1. Introduction
Renewable energy technology and the improvement of energy systems have to compete with the new framework for climate change and the desired targets for reducing emissions of greenhouse gases. The proliferation of renewable energy sources (e.g., wind or PV) has to be balanced by new technologies and instruments for the new energy systems, characterised by intermittent and uncertain energy generated and new measures for assuring the stability and reliability of the energy system.
One solution to improve the stability of an energy system is to optimise the relation between the generation and consumption of electricity in the energy system, in other words, to optimise the relation between energy producers and consumers. In the new market context, the old rule that energy generation follows the consumption is not feasible anymore.
This solution is based on demand side management, which can improve the stability and the security of an energy system even in the case of the proliferation of wind and photovoltaic power plants [
1]. Demand side management has two main pillars: energy efficiency (EE) and demand response (DR). Energy efficiency (EE) aims to use less energy in order to perform the same task. On the other side, demand response is defined as a change in the power consumption of a consumer to better match the demand for power with the supply of electricity. New EE and DR solutions are a result of energy management innovations and promote cost-efficient strategies which can reduce the cost of energy [
2]. Energy efficiency aims to minimize the energy use of an operational system.
A major difference between EE and DR consist of the fact that EE generates permanent changes in the consumption (e.g., new technical characteristics for consumption of the installed equipment) and DR starts with temporary changes in the consumption (e.g., minutes) [
3,
4].
DR is not a very new concept in the European Union due to the fact that, since 2012, the Energy Efficiency Directive (2012/27/EU) indicates in the article 15.8 that all member states should encourage its implementation in the energy markets. However, DR implementation is still voluntary and, therefore, it is still important to find measures for motivating consumers and energy producers to be part of this strategy.
There is a need to improve the relation between energy companies and consumers which are involved in DR programs in order to increase the stability of the energy grid. Whereas in the past only important power plants (e.g., hydropower plants) were responsible for this stability, in the new market conditions energy companies are developing new business models where the consumers can also play an important role in this process. Therefore, the consumers are integrated in the value creation and delivery processes of the new DR business model [
5].
The new business model has an important social dimension where the energy consumers should change their energy patterns. The change in the consumer behaviour is enabled by new technological and technical improvements in the energy market (e.g., smart meters, IoT), but it is essentially influenced by the social context. In this social context, there is a need to make a closer relation between consumers and energy companies, and to motivate consumers to respond to the new requirements of the energy system.
There is a need to promote new measures (e.g., incentives or energy price advantages) which can determine consumers to take part in DR programs. For example, in order to optimise the grid stability, flexible energy contracts with high energy prices can influence the consumers to reduce their consumption, and low energy prices can determine the consumers to increase their consumption [
6].
There is a lack of knowledge about the preferences of consumers for different factors that are promoted through flexible energy contracts in order to implement DR schemes.
Specialists consider that the motivation of customers to participate in DR schemes is not thoroughly understood, and there is a need to improve the mechanisms for promoting flexibility among households [
7].
This article contributes to the reduction of this gap, and presents the main benefits of DR and the main factors which contribute to its acceptance from customers, in order to improve grid stability and increase the share of renewables in the grid.
The goal of this study is to identify and analyse the acceptance level of DR for energy consumers, and to determine the main factors which contribute to its efficient implementation.
The article has the following structure. The introduction presents the DR concept and its importance for promoting renewable energy generation. In this context an important role has to be played by the energy consumers and by their motivation. In
Section 2, DR, flexible energy contracts and consumer behaviour are defined, with an analysis of the main scientific sources. Price and incentive based DR solutions are analysed in
Section 3. Within
Section 4, the research methodology, which consists of semi-structured interviews, an online survey based on questionnaires and a correlation analysis is presented.
Section 5 presents the main research results and their importance. Main conclusions and the bibliographical references complete this article.
2. Demand Response, Flexible Contracts and Consumer Behavior in the Scientific Literature
2.1. Demand Response (DR)
Demand response (DR) represents the main part of demand side management, which also includes the energy efficiency (EE) solutions. Energy management innovation promotes new DR and EE solutions based on cost-efficient strategies [
2,
8]. Therefore, DR represents a solution for increasing the flexibility of the energy system in the case of new intermittency generated by the proliferation of renewable energy sources and the lower predictability of the future loads [
9]. DR solutions are represented, from a technical point of view, by shifting or curtailment. The shifting model for DR is characterised by a high flexibility for the operators, but the consumer has to use his equipment in another period. The curtailment model for DR represents a real reduction of energy consumption because the consumer has no plan to use his equipment for a specific task at a different time. Both models contribute to the improvement of the ancillary services markets. In these markets, an energy system operator has to monitor the stability of the grid frequency by monitoring the generation and consumption of electricity [
10]. Therefore, DR solutions help suppliers of energy maintain a balance between energy generation and consumption at different time intervals, which is an important rule for the stabilisation of the grid frequency [
11]. The technology for implementing DR programs is mature due to the development of bi-communication infrastructure, smart meters, smart grids, and artificial intelligence and smart algorithms, which have the capacity to analyse even Big Data [
12,
13,
14].
In the scientific literature, the implementation of DR programs is associated with significant benefits. DR programs offer significant technical benefits for the energy system by reducing the stress in the distribution during peak times with the existing energy ge-neration capacity [
10,
15]. Consequently, the network assets are used more efficiently. These DR programs can shift loads from peak times to off-peak times and reduce the CO
2 emissions [
16]. From an economic point of view, DR solutions create economic benefits for the consumers by reducing their electricity bill or by receiving incentives [
2,
17], and create value for the energy providers [
18].
Due to the fact that the generation of renewable energy is intermittent, the DR solutions have to be flexible in order to avoid fluctuations in the energy supply for consumers. These fluctuations can also be reduced by a flexible generation of electricity and by energy storage, but these options are more expensive. Specialists consider that DR is potentially the most effective cost solution for improving the flexibility of the energy system [
19]. As a result of its higher flexibility, DR can be promoted as the solution for the integration of renewable energy in the grid.
The implementation of DR solutions on a large scale is dependent on the participation of residual consumers in these programs. The potential associated with the residential consumers’ DR potential is very high [
11]. Less than 2% of the global potential for DR solutions is used, and a major part of it consists of industrial thermal loads and processes [
20].
The residential consumer demand is distributed and heterogeneous; therefore, the implementation of DR programs is enabled due to the involvement of new service providers in electricity markets, such as aggregators [
21]. Therefore, in order to promote sustainability in the future, energy sectors dominated by renewable DR solutions would play a more important role [
16,
22], but these have to be implemented through flexible contracts.
2.2. Energy Flexible Contracts
Flexible contracts can also improve the planning of capacity in the case of uncertain demand (e.g., generation of PV or Wind) due to their flexibility as a main characteristic. This flexibility represents, for energy systems, an important factor, as it quantifies its performance to maintain its stability in the case of rapid and important changes in the energy generation and consumption.
In this article, the term flexibility is used for designing a contract which stipulates the needed flexibility [
23] and the incentives or penalties related to achieving the required flexibility in DR solutions. There are also studies which indicate that incentive based contracts have a higher flexibility. In this contract category, the quality is the main parameter that has to be defined in a specific way in the energy field. Main characteristics for the associated quality are performance, behaviour and information.
In the case of renewable energy sources (e.g., wind or PV), the selling price on the Spot market could be significantly affected by the weather, which usually fluctuates. Flexible energy contracts can reduce this uncertainty [
24].
Main examples of flexible contracts are capacity reservation contracts and commitment contracts.
In the case of capacity reservation contracts in supply chain coordination, for the capacity reservation the retailer pays a given amount in advance. By this, the retailer reserves a capacity for future usage. According to the producer market expectations and the capacities reserved by the retailer, the producer builds its capacity. The retailer pays a pre-agreed price for each product. In the case that he does not use the capacity, he will lose the reservation fee.
Concerning capacity reservation contracts, we can attract methodologies to energy generation and supply from different areas in supply chain coordination through two main contracts: capacity reservation and quantity flexibility contracts. These types of contracts, between electricity producers and retailers (suppliers), can work as back-to-back contracts, meaning that the retailer always receives price quotations to give to the end consumer, according to their consumption pattern. The supplier adds its margin to this price. When the contract is made with the end customer, the producer allocates the part from its forecasted production. The main idea is that the producer will offer the final discounts to the supplier according the whole sold quantity for a given period. The level of discount can be different according to the level of the sold quantity, meaning that the level of the price reduction is higher for a larger sold quantity.
The commitment contract represents an agreement between a buyer (e.g., energy consumer), which estimates a minimum quantity that has to be supplied, and the supplier (e.g., energy supplier) which accepts to supply the required quantity. This type of contract, which is characterised by certain conditions, can also be developed for uncertain conditions by combining the quantity flexibility mechanism and an incentive based on price reduction [
25].
In practice, for balancing the electricity system, new DR programs, based on flexible contracts, are also introducing a new economic agent (the aggregator), and for a higher flexibility, the consumers have to offer him some control over their electric equipment [
26]. This acceptance is also influenced by their energy consumption behaviour [
27]. Therefore, consumer behaviour may change this case and influence the cost-effectivity of the DR system.
2.3. Consumer Behaviour in the Electricity Field
Most of the research papers related to DR are using the principles of the classical economic theory, which supposes that consumers are rational economic actors and are well informed. This idea can be accepted for energy systems which don’t require any human intervention. In this case, DR requires no intervention when a home appliance is automated, closed, and other equipment, with a similar function, is activated at the same time. Such an ideal example has no impact on the consumer’s comfort.
Therefore, DR is modelled considering the hypothesis that end-users are always rational and active economic agents. In practice, this hypothesis may be false, and this could explain the differences between the results from different energy consumption models and the observed data for DR [
19].
Only a few specialists have analysed the role of consumers and their behaviour in the implementation of DR programs. Experts indicate that DR programs focused on day-ahead planning can be efficient only for an ideal behavior of customers [
22].
There are also studies which underline the important role of the customers and their energy related behaviour for the energy system. One important task for the behavioural science is to understand the main factors which influence the motivation and the commitment of consumers for long term agreements [
28].
Behaviour studies for energy consumption are divided into routine and the deliberative energy behaviour. The first one is repetitive and can be easily implemented. The second one is related to a specific signal received from an energy service provider. Another main theoretical typology consists in the social practice theory (SPT) and the behavioural economics (BE) [
19].
The social practice theory (STP) considers the energy use as a factor of social practice (e.g., heating water), which is more familiar to a person and is undertaken almost subconsciously. Therefore, this theory is used in studies for analysing the routine behaviour.
The behavioural economics theory (BE) is focused on the individual decision making and is, in principal, used for analysing the deliberative energy behaviour (e.g., to reduce the consumption of energy when an energy service provider sends a specific signal). This theory enables a better understanding of the decision making related to the energy consumption from different perspectives: energy [
29], psychological, economical explained by game theory, engineering, management, and even medicine.
Other theories are promoted by evolutionary economists, which consider that the deviations from rational thinking are extremely complex and, in many cases, the individualised decision-making structure is influenced by different social factors (e.g., culture, environment, institutions).
In the case of the implementation of DR programs, a special factor that can play an important role is altruism. From the evolutionary perspective, this factor describes an energy consumption behaviour, which reduces the personal comfort in order to increase the social group comfort. Comparative with the behavioural economics theory perspective, these deviations are considered anomalies that have to be corrected. A third social behaviour perspective that analysed altruism, is based in the theory of Charles Darvin (CD Theory). It is also interesting to remark that the core theory of Charles Darvin, based on human motivation theory, has, in its new form, four primary drivers: the drive to acquire, to bond, to comprehend, and to defend, which are influenced by an altruistic behaviour. The drive to acquire and to have more power are based on traditional financial incentives. The emotional side is part of the drive to bond and can be influenced by pro-social incentive programs [
30]. Individual information about new technologies (e.g., for reducing energy consumption) is part of the drive to comprehend [
31,
32]. In order to reduce losses, the drive to defend can be exploited, which enables the reduction of losses.
As we remark on classic BE and CD theory, consider that the individuals have the same goals, which can be considered universal goals. A clear differentiation of an individual’s goals is explained by the evolutionary economics, due to the fact that cultural and institutional norms, or even other factors, influence the consumer behaviour.
In the next chapter, the trigger factors and their contribution for implementing DR solutions are presented.
3. Price and Incentive Based Demand Response Solutions
DR solutions can be differentiated between demand bidding, being price based, and being incentive based.
Demand bidding solutions are based on trading where the actors (e.g., suppliers and consumers) are establishing the price of the electricity and its availability for DR.
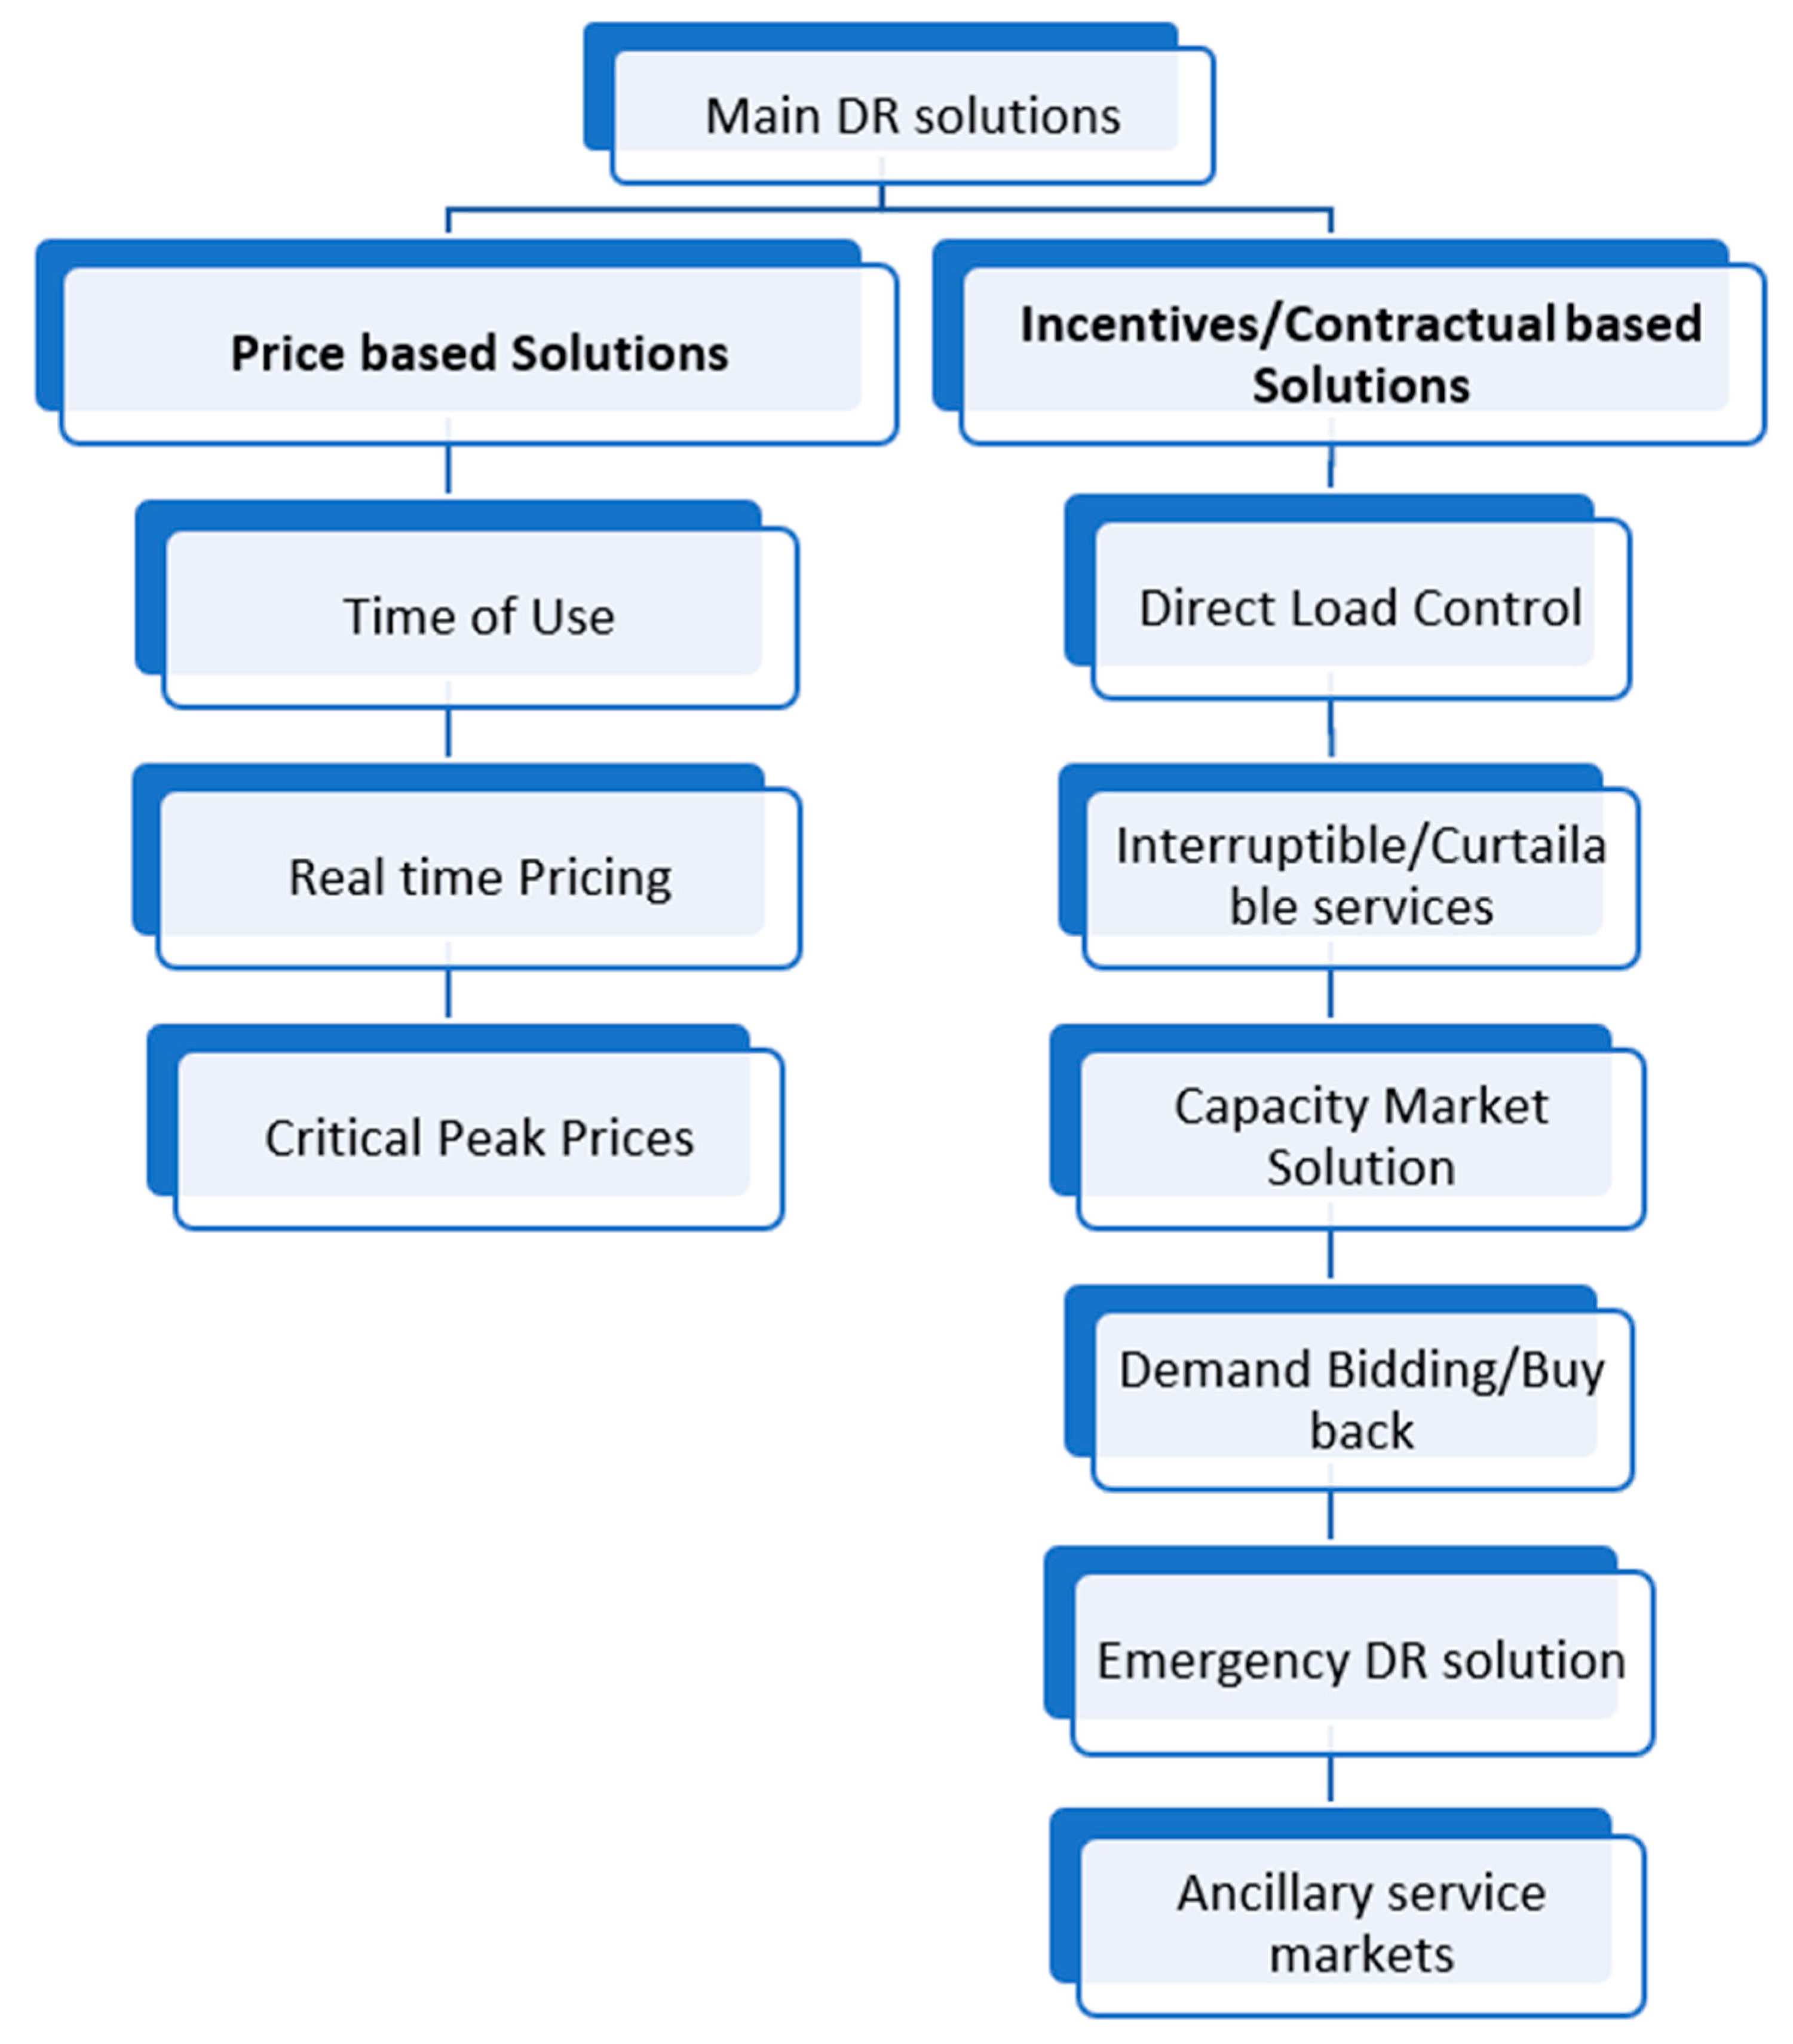
The main DR solutions are price and incentive based.
The objective of price based DR solutions is to reshape the demand curve of customers through different energy prices at different hours. In other words, the customers have to reduce their energy consumption at specific times, when overall high energy is predicted.
Price based DR solutions include: time-of-use pricing (TOU), real-time pricing and critical peak pricing (CPP) (
Figure 1).
In the case of time-of-use pricing solution, prices vary with the time of day. The consumers have the possibility to shift their demand from hours with expensive energy prices to hours with cheaper energy prices [
33].
The real-time pricing solutions are based on new energy system technologies which enable real time communication for changing the energy prices each hour of the day, or even more frequently, based on the energy system or the wholesale price of electricity in the energy market conditions. These are considered the purest form of dynamic pricing due to the fact that the cost of energy is established on an hourly basis. A special real-time pricing solution is the day-ahead pricing. In this case, the energy supplier offers real time price quotations for electricity for the day ahead, and customers can select their consumption bill from these, one day prior to their execution [
33]. The critical peak pricing solution promotes higher prices during specified critical peak periods for the energy system (e.g., a small percentage of hours). Therefore, in general, it is used only for a few days in a year.
All these price based DR solutions are influenced by the psychological influence of these prices on the consumer energy behaviour. Therefore, in the case of residential consumers, the price based DR solutions are more appropriate than incentive based DR solutions.
Unfortunately, only a few studies analyse the willingness of consumers to deal with different energy tariffs, and some results indicate that many consumers, even 90% in some cases, didn’t want to deal with different energy tariffs or were even not so interested in reducing their thermal comfort for an incentive.
Incentive based DR solutions are different from demand bidding and price-based DR due to the fact that these try to change consumer behaviour by using a separate reward under a contract [
24]. The first incentives that were used for implementing DR solutions by changing consumer behaviour were the financial incentives.
Incentive based DR solutions are fixed or time varying payments which can be divided into: direct load control, interruptible/curtailable services, emergency DR solution, capacity market programs, demand bidding/buy back, and ancillary service markets. In these cases, customers received monetary incentives in order to reduce their energy consumption with a specific load (DR requirement) at specific previsioned times when the grid can register peak events. For the implementation of these solutions, the customer consumption also plays an important role. It is important to estimate their consumption in detail (e.g., each hour), not only the average daily demand.
Incentive based solutions are, in a classic approach, based on bill discounts, due to the participation of customers in DR programs, and, in a market based approach, are focused on the compensation of customers, which depends on their level of involvement in these programs.
Direct load control DR solutions offer incentives for customers, which allows the system operator to directly change the electricity consumption of certain appliances (e.g., air conditioners or water heaters). It is also offered in the cases where customers can usually override the control, although they may lose some incentive. Direct load control may be also combined with time varying pricing.
There is a paradox, which was analysed by different specialists, which indicates that penalties can be more effective than rewards. They have tried to explain this using the principles of behavioural economics. In general, consumers have a negative aversion to losses, and this can be even higher than their motivation to gain an incentive of equivalent size. Therefore, a special DR solution, which can influence the behaviour of consumers, can be the integration of rewards with penalties in the energy tariff design [
34].
Interruptible or curtailable services offer penalties or incentives in advance, so that end consumers have to reduce their electricity consumption during system emergencies. The end consumers should at least have their consumption between 200 kW and 3 MW to be eligible for the base interruptible program [
33].
The emergency DR solution is a combination of interruptible or curtailable and direct load control solutions. In this case, incentives are provided for end consumers if they lower their electricity consumption during a period of time when an event is triggered which can endanger the proper functioning of the system.
There are also other incentives that can contribute to the achievement of the DR solutions. These non-price incentives can be based on pro-social attitudes [
19,
35].
Companies which promote and implement DR solutions have to understand which are the trigger factors that influence consumer behaviour, and even their willingness to trade comfort.
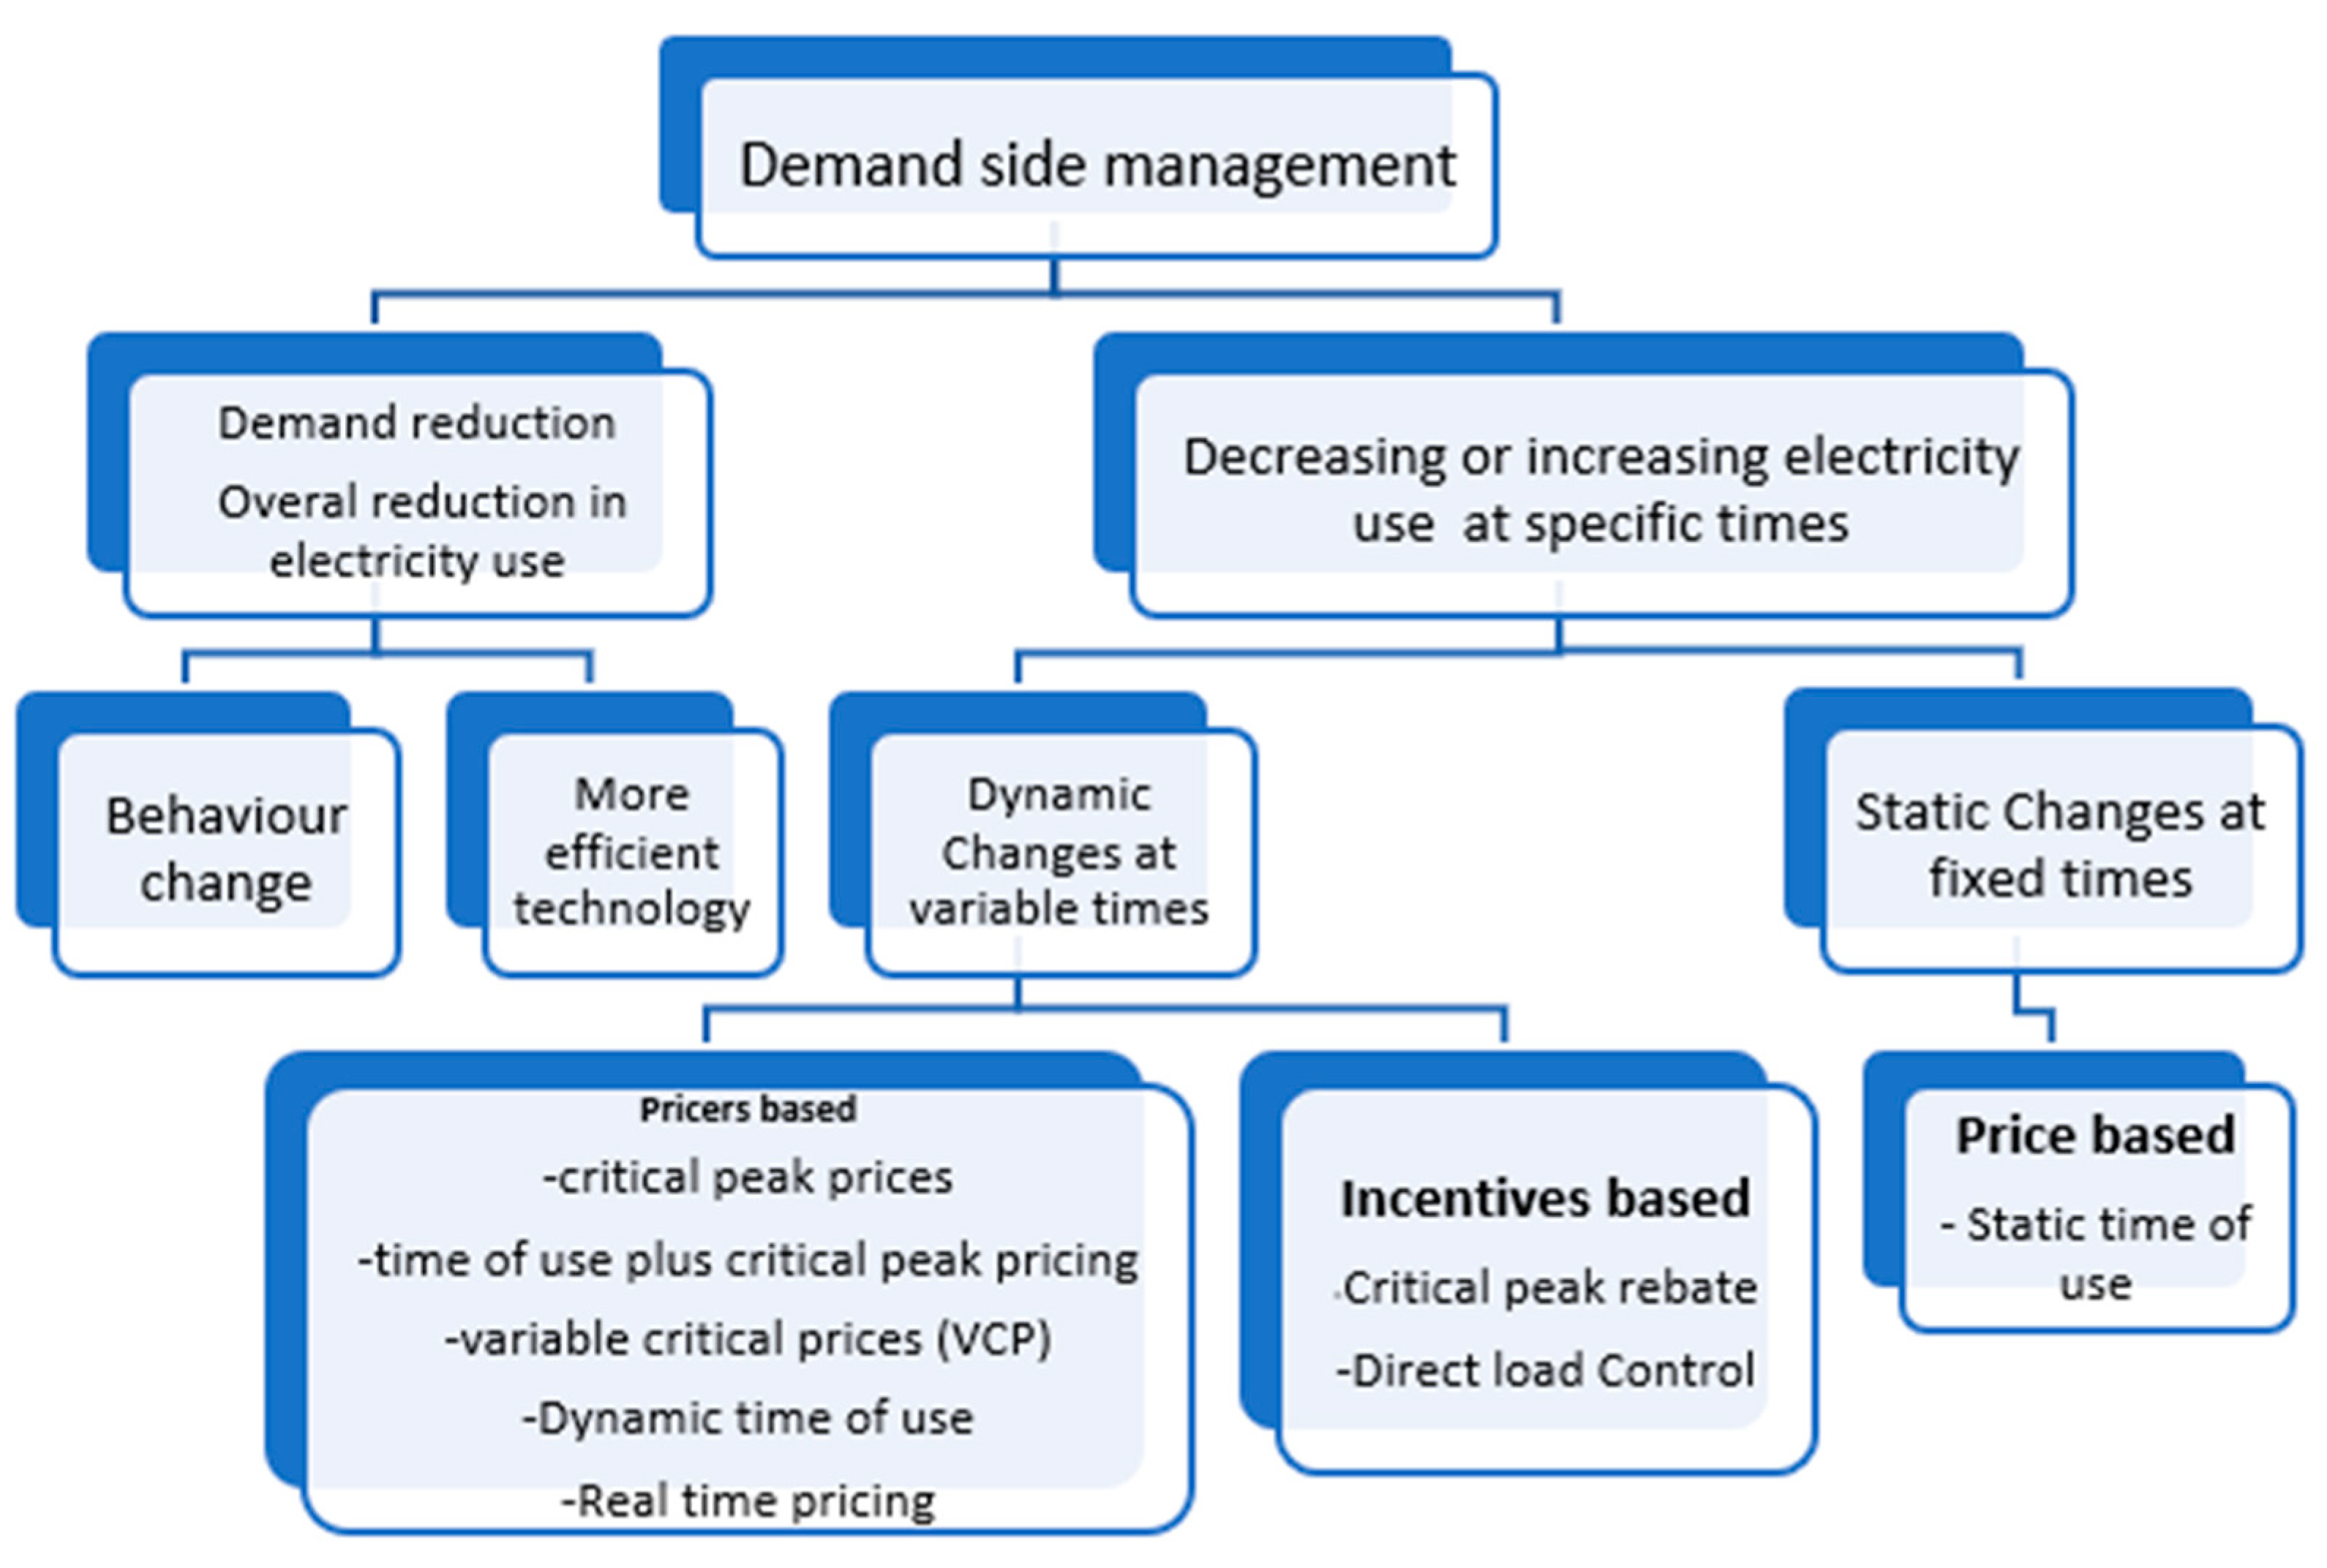
A special behaviour can be observed by consumers which are also producers of energy (prosumers) and also have energy storage facilities (e.g., batteries). In this case, their flexibility is high and they can implement static changes at fixed times, or even dynamic changes for energy consumption at variable times (
Figure 2).
4. Research Methodology
The main objective of this research is to determine special DR solutions, and the related key factors which influence the participation of consumers in DR programs and may contribute to the proliferation of renewable energy sources. The main DR solutions are price and incentive based, but there is a need to identify the main factors which can influence their efficiency due to the fact that there is a lack of knowledge about the preferences of consumers.
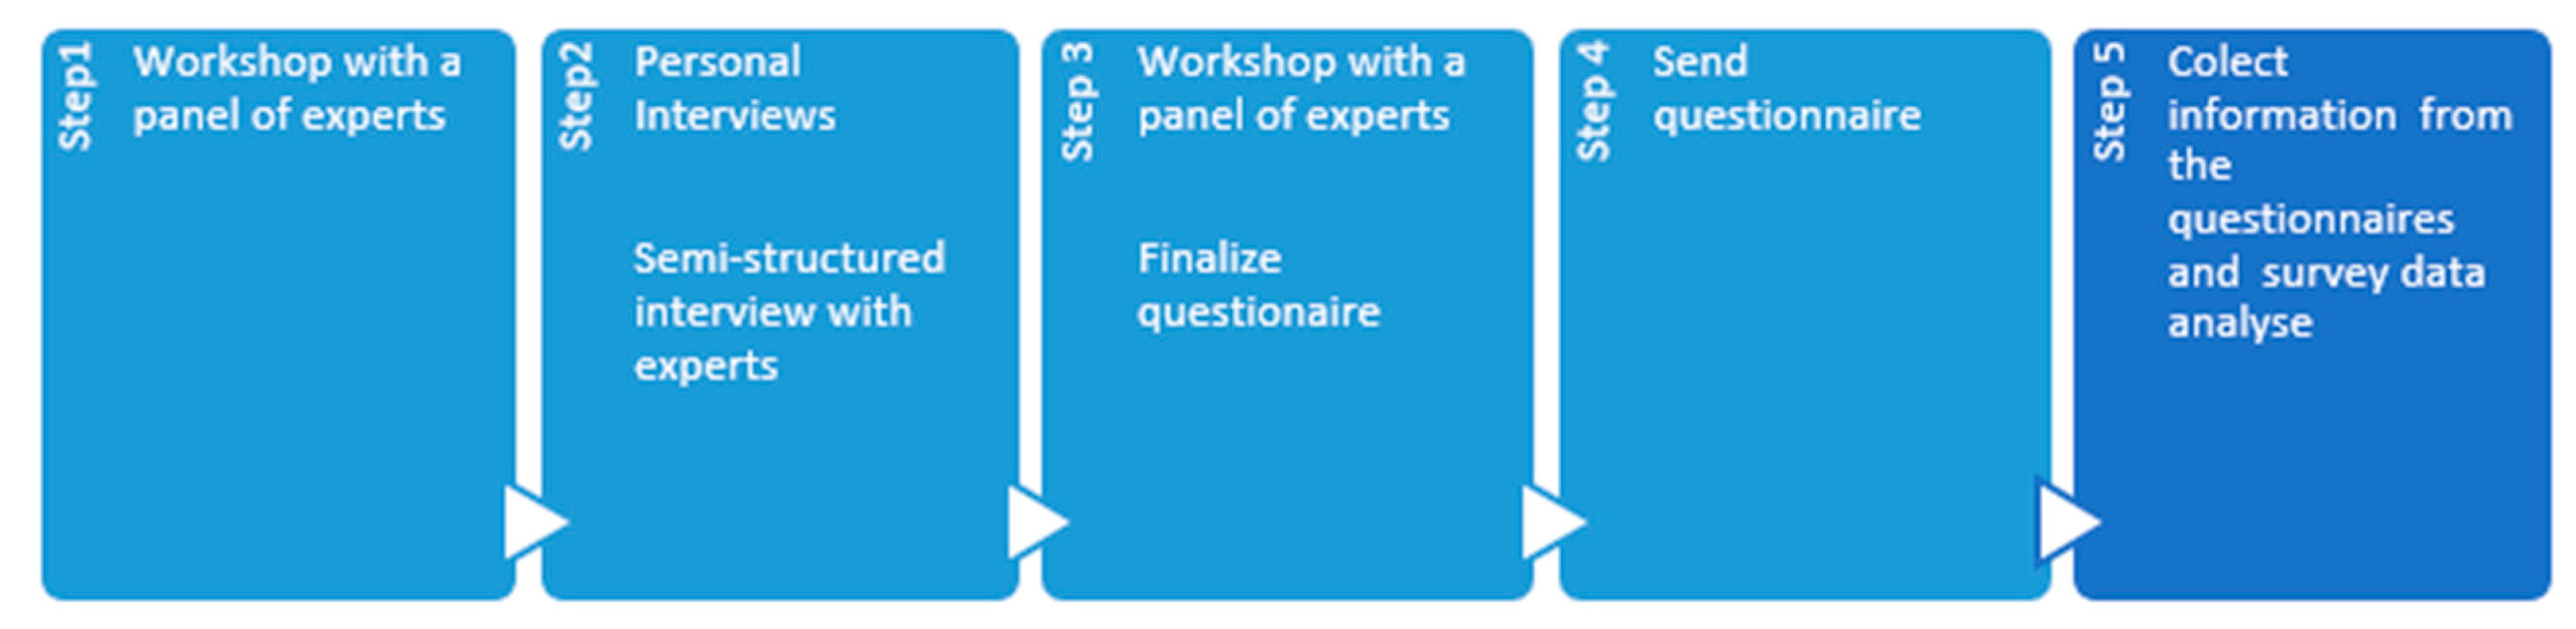
The research methodology used in this paper is based on five steps. The general framework of the methodology is designed in
Figure 3.
In Step 1, a panel of experts from the energy field was invited to a workshop in order to formulate the first hypothesis regarding key factors, and the main DR solutions which influence the end consumer’s participation in DR programs as well.
Hypothesis 1 (H1). Considers that “the level of consumer’s information on DR programs has a positive impact on their participation in DR programs”.
Hypothesis 2 (H2). Specifies that “the level of consumer’s knowledge about flexible electricity con-tracts has a positive impact on their participation in DR programs”.
Hypothesis 3 (H3). “The level of consumer’s information on DR programs has a positive impact on the level of consumer’s knowledge about flexible electricity contracts” tests the relevance of the answers and the correlation between consumer information and knowledge in this field.
Hypothesis 4 (H4). “I would like to participate in DR programs in order to optimise my electricity consumption and decrease the value of my bill” has a positive impact on encouraging the consumption and development of the renewable energy sector.
Hypothesis 5 (H5). “I would like to participate in DR programs in order to help in the reduction of CO2 and global warming” has a positive impact on optimising the electricity consumption and decreasing the value of the electricity bill.
Hypothesis 6 (H6). Receiving a device for DR, in order to know the amount of renewable electricity that is consumed and to estimate the contribution to the reduction of CO2, has a positive impact on encouraging the consumption and development of the renewable energy sector.
Hypothesis 7 (H7). Monthly average electricity consumption has a positive impact on the participation of consumers in DR programs.
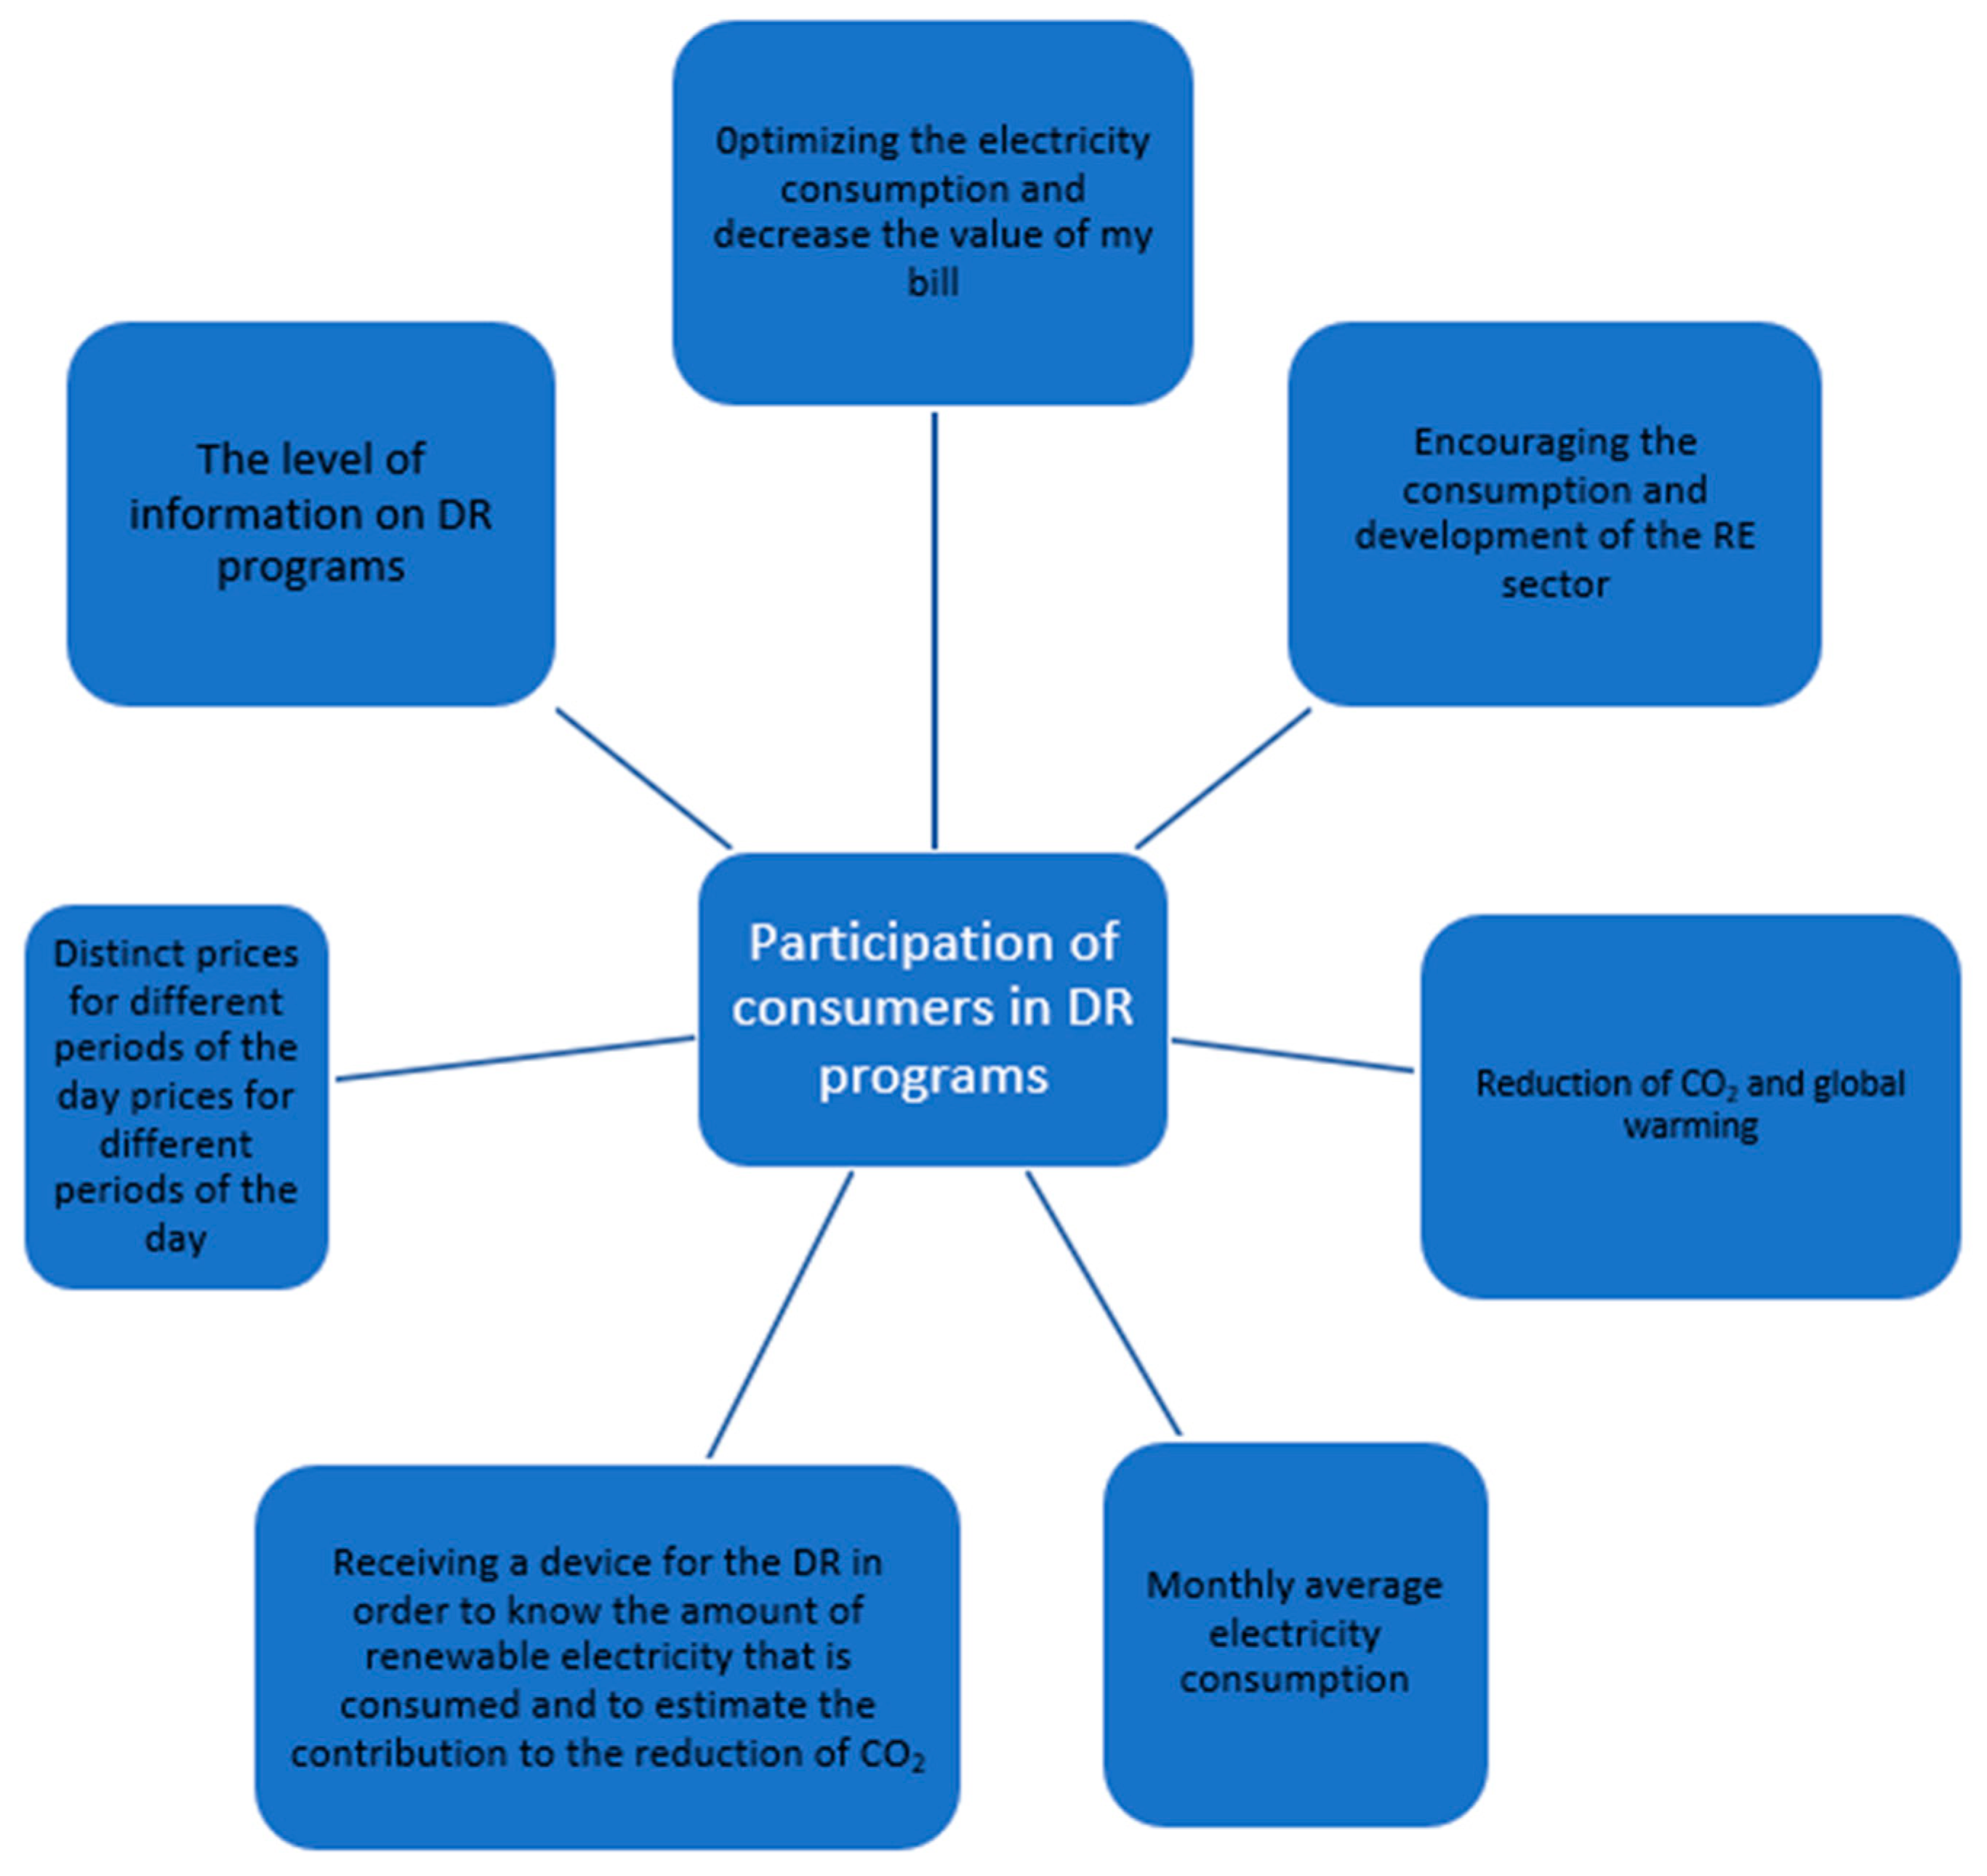
In Step 2, personal interviews were organised. The semi-structured interviews were made with 11 experts having more than 10 years of experience in the energy field. Experts were selected from Romania, Hungary and Serbia, and the discussions were organised during September–April 2021. These interviews helped the researchers to obtain additional data for the elaboration of the research questionnaire. These data was correlated with other studies about DR and the factors which influence the participation of consumers in DR programs (
Figure 4).
In Step 3, in order to finalise the questionnaire, the second workshop with a panel of experts from the energy field was organised.
The questionnaires have two parts. The first part contains questions about the acceptance of DR programs and the factors which influence the implementation of DR programs. The second part is representative of the consumer profile.
In Step 4, the selection of subjects was made where, next to experienced respondents within the energy field, unexperienced subjects in this domain were also chosen. The questionnaires were sent to electricity end consumers located in Hungary, Romania and Serbia.
The survey involved 222 respondents.
It has to be mentioned that when we analysed the main electricity market patterns, the selected three countries, Hungary, Romania and Serbia, showed many similarities.
The Fourth Energy Package from June 2019 supports the increase of investments in the area of renewable energy, responding to the proliferation in this field. This introduces new electricity market rules in order to promote the aforementioned.
In addition, electricity end consumers can receive incentives. As well as this, new limits for electricity generators were introduced, which allow them to receive subsidies as capacity management. The Package is made up of three regulations and one directive.
As Hungary and Romania are part of the EU, and Serbia tends to adhere to it, the utilisation and acceptance of these programs will be aligned to other Member States. Therefore, in these countries, the ground and support have to be given by regulatory authorities in the development and utilisation of programs such as DR.
These countries are linked through cross-border electricity capacities; they are neighbouring countries with common borders and, because of these, the electricity can easily circulate from one country to another, resulting in the fact that wholesale electricity prices are more or less the same.
According Eurostat, in the second half of 2020, retail electricity prices (with taxes included) for household electricity end consumers were as follows: Hungary 0.1009 EUR/kWh, Romania 0.1449 EUR/kWh and Serbia 0.0737 EUR/kWh, all below the EU average price, which was 0.2134 EUR/kWh for the same period.
Regarding differences between the internal electricity markets of the countries in question, we can say that Romania has a fully liberalised electricity market for both households and industrial consumers, Hungary has a liberalised market for industrial consumers and a regulated market for households (electricity prices are cheap for the population), and, further, Serbia has a liberalised market for industry and a regulated market for households; it is mostly a monopoly market, knowing that the biggest player on the local supply market is the national electricity company with a very high market share.
In Step 5, answers from consumers of electricity were collected and the survey data were analysed. The profile of the consumers who answered the questionnaires is presented in
Table 1.
We can affirm about the subjects’ profile that nearly half of the respondents were male and half female, regarding their age, are mainly 31–40 years old, predominantly living in cities, and in their own, owned properties.
By these questionnaires, we wanted to find out and to research the trigger factors which influence the participation of consumers in DR programs.
In this research, we analysed the correlations between different factors which influence consumer behaviour in the energy field and facilitate the implementation of DR programs. It was additionally analysed whether any of these factors were strong correlated to other factors which influence consumer behaviour in the energy field and facilitate the implementation of DR programs.
In addition, we wanted to examine if end consumers could be interested in receiving a device (e.g., mobile phones, displays, tablets) from their aggregator or energy supplier, during the period when they take part in demand response programs, in order to be able to track, for different appliances in the house, the instantaneous electricity consumption.
Furthermore, it is important to analyse the information related to the consumers, mainly to determine their competencies for energy consumption and to correlate them with their educational background. These factors are important to analyse in order to find out if there is any correlation between the consumer’s acceptance of the DR and their profile. In the questionnaire, consumers were asked about their monthly average electricity consumption, about their annual household income and about how much are spending for energy as an utilitity. Additionally, questions were focused on age, gender, and place of living, as well as whether the location of consumption was rented or owned.
For the correlation analysis, the Kendall test was applied, due to the fact that most of the results collected from questionnaires are non-parametric. The dependence between the identified factors was analysed, which influenced the implementation of DR programs in the energy field. From the dependence perspective, Kendall estimates the likelihood ratio [
29,
37]. The main variables used for the correlation analysis are the following: my attitude towards the DR, competencies in the energy sector, how I would optimise my electricity consumption and decrease the value of my bill, how I would help in the reduction of CO
2 and global warming, distinct prices for different periods of the day, a monthly average electricity consumption, how I would encourage the consumption and development of the renewable energy sector, different electricity prices every hour of the day, the percentage of total income spent on electricity, cheap electricity prices for the whole year, instantaneous electricity consumption of different appliances in the house, how much renewable electricity I have consumed and contributed to the reduction of CO
2, an annual voucher with the cumulative value of all monthly incentives in a year, a dynamic bonus, points accumulated for each “response to demand”, annual income and level of education.
IBM SPSS Statistics for Windows, Version 27 and MS Office Professional Plus 2019 were used for processing the data needed for the correlation analysis.
5. Results and Discussions
The first data which were analysed were related to the energy consumption profile of the customers and are presented in
Table 2.
The vast majority of respondents (53%) had the average monthly electricity consumption between 150 kWh and 300 kWh, and it is correlated with the fact that most of consumers were living in flats (68%).
In the next phase these data were correlated with the consumer income and the household expenditure on electricity (
Table 3).
From the research came out that subjects spent only a small amount of their income on their electricity invoice.
Accordingly, the preponderance of respondents (40%) had expenditures of less than 3%, and for 35% of respondents it was between 3 and 6%, resulting that 75% of subjects spent less than 6% on electricity from their incomes.
From analysing the subjects’ levels of education, we can affirm the fact that most of them (71%) completed a faculty program (36% Bachelor’s degree, 33% Bachelor’s degree and Master’s Program, finally 2% Ph.D. studies).
When describing the respondents’ competencies in the energy sector, we have to mention that 56% of them did not have competencies in the energy field, but, on the other hand, 22% of subjects had more than 10 years of experience in the field. In
Table 4, a detailed representation of the subjects’ profiles and their levels of education and experience in the energy sector can be found.
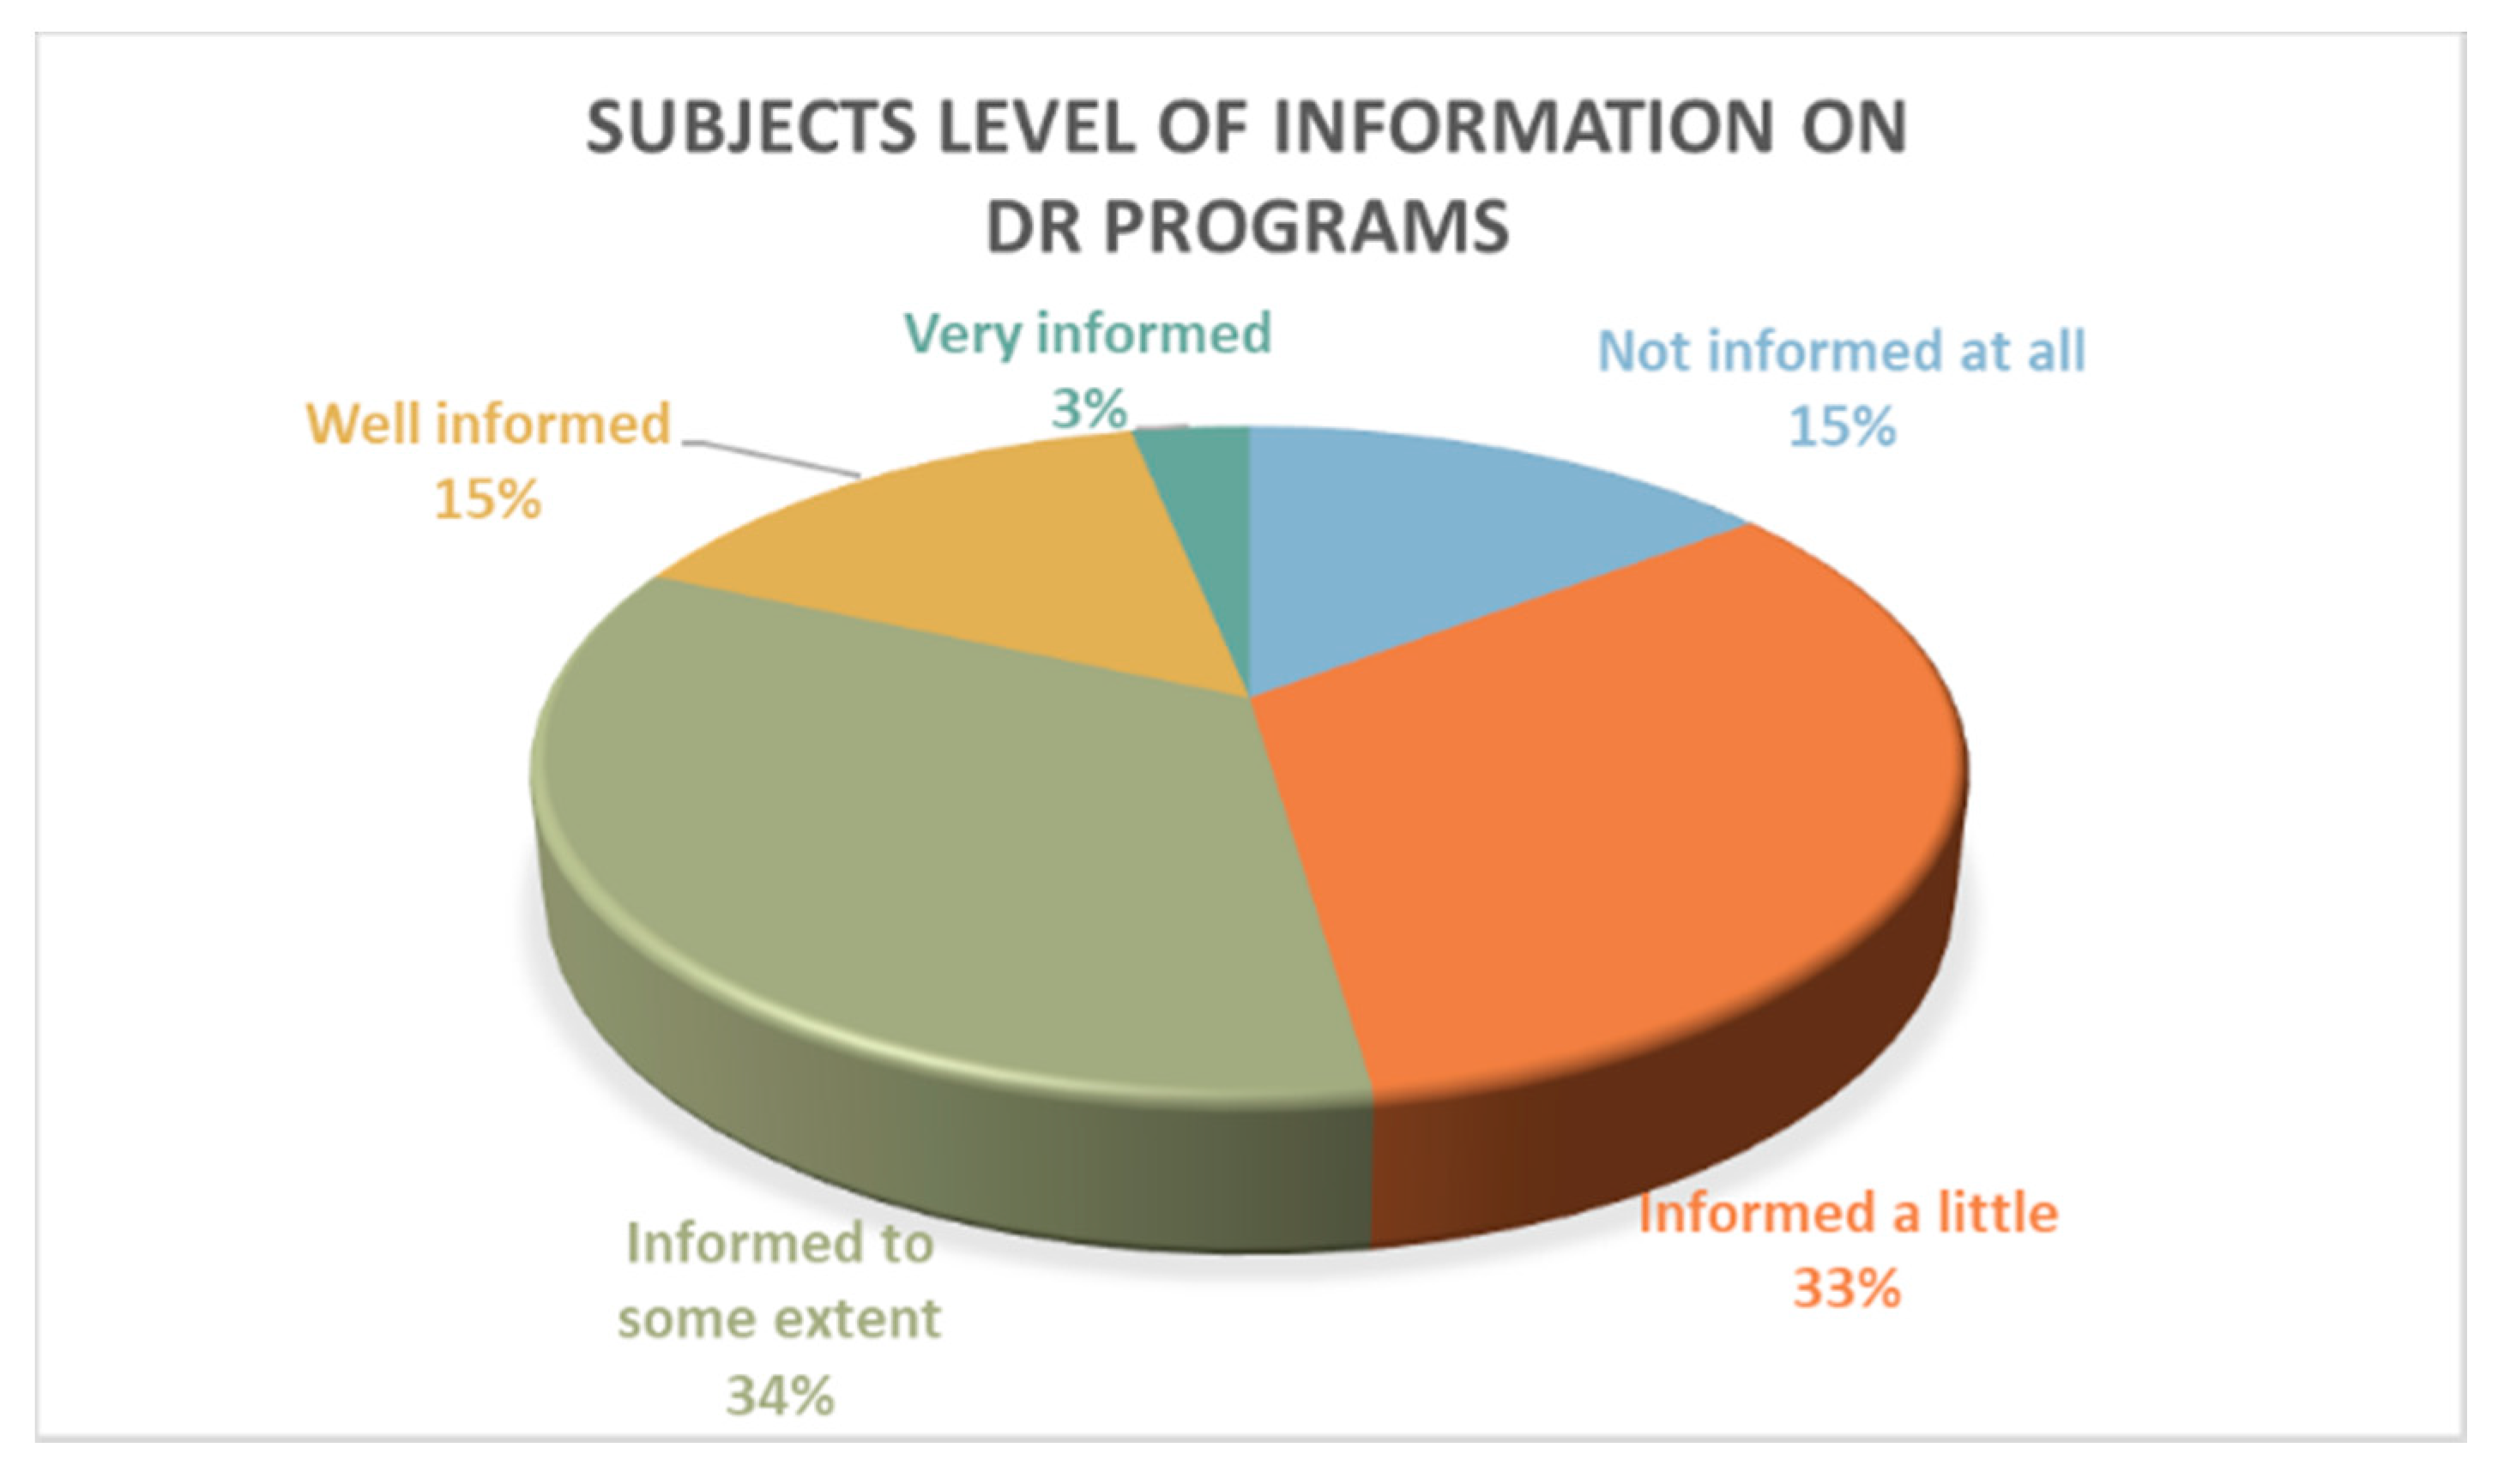
Firstly, we wanted to find out from these questionnaires the subjects’ levels of information on DR programs. Results show that only 18% of respondents were well-informed (3% very well-informed and 15% well-informed). As this is a low percentage, we can conclude the fact that it is important to improve the communication between electricity end consumers and energy providers on DR programs. In
Figure 5, detailed results regarding the subjects’ levels of information on DR programs are represented:
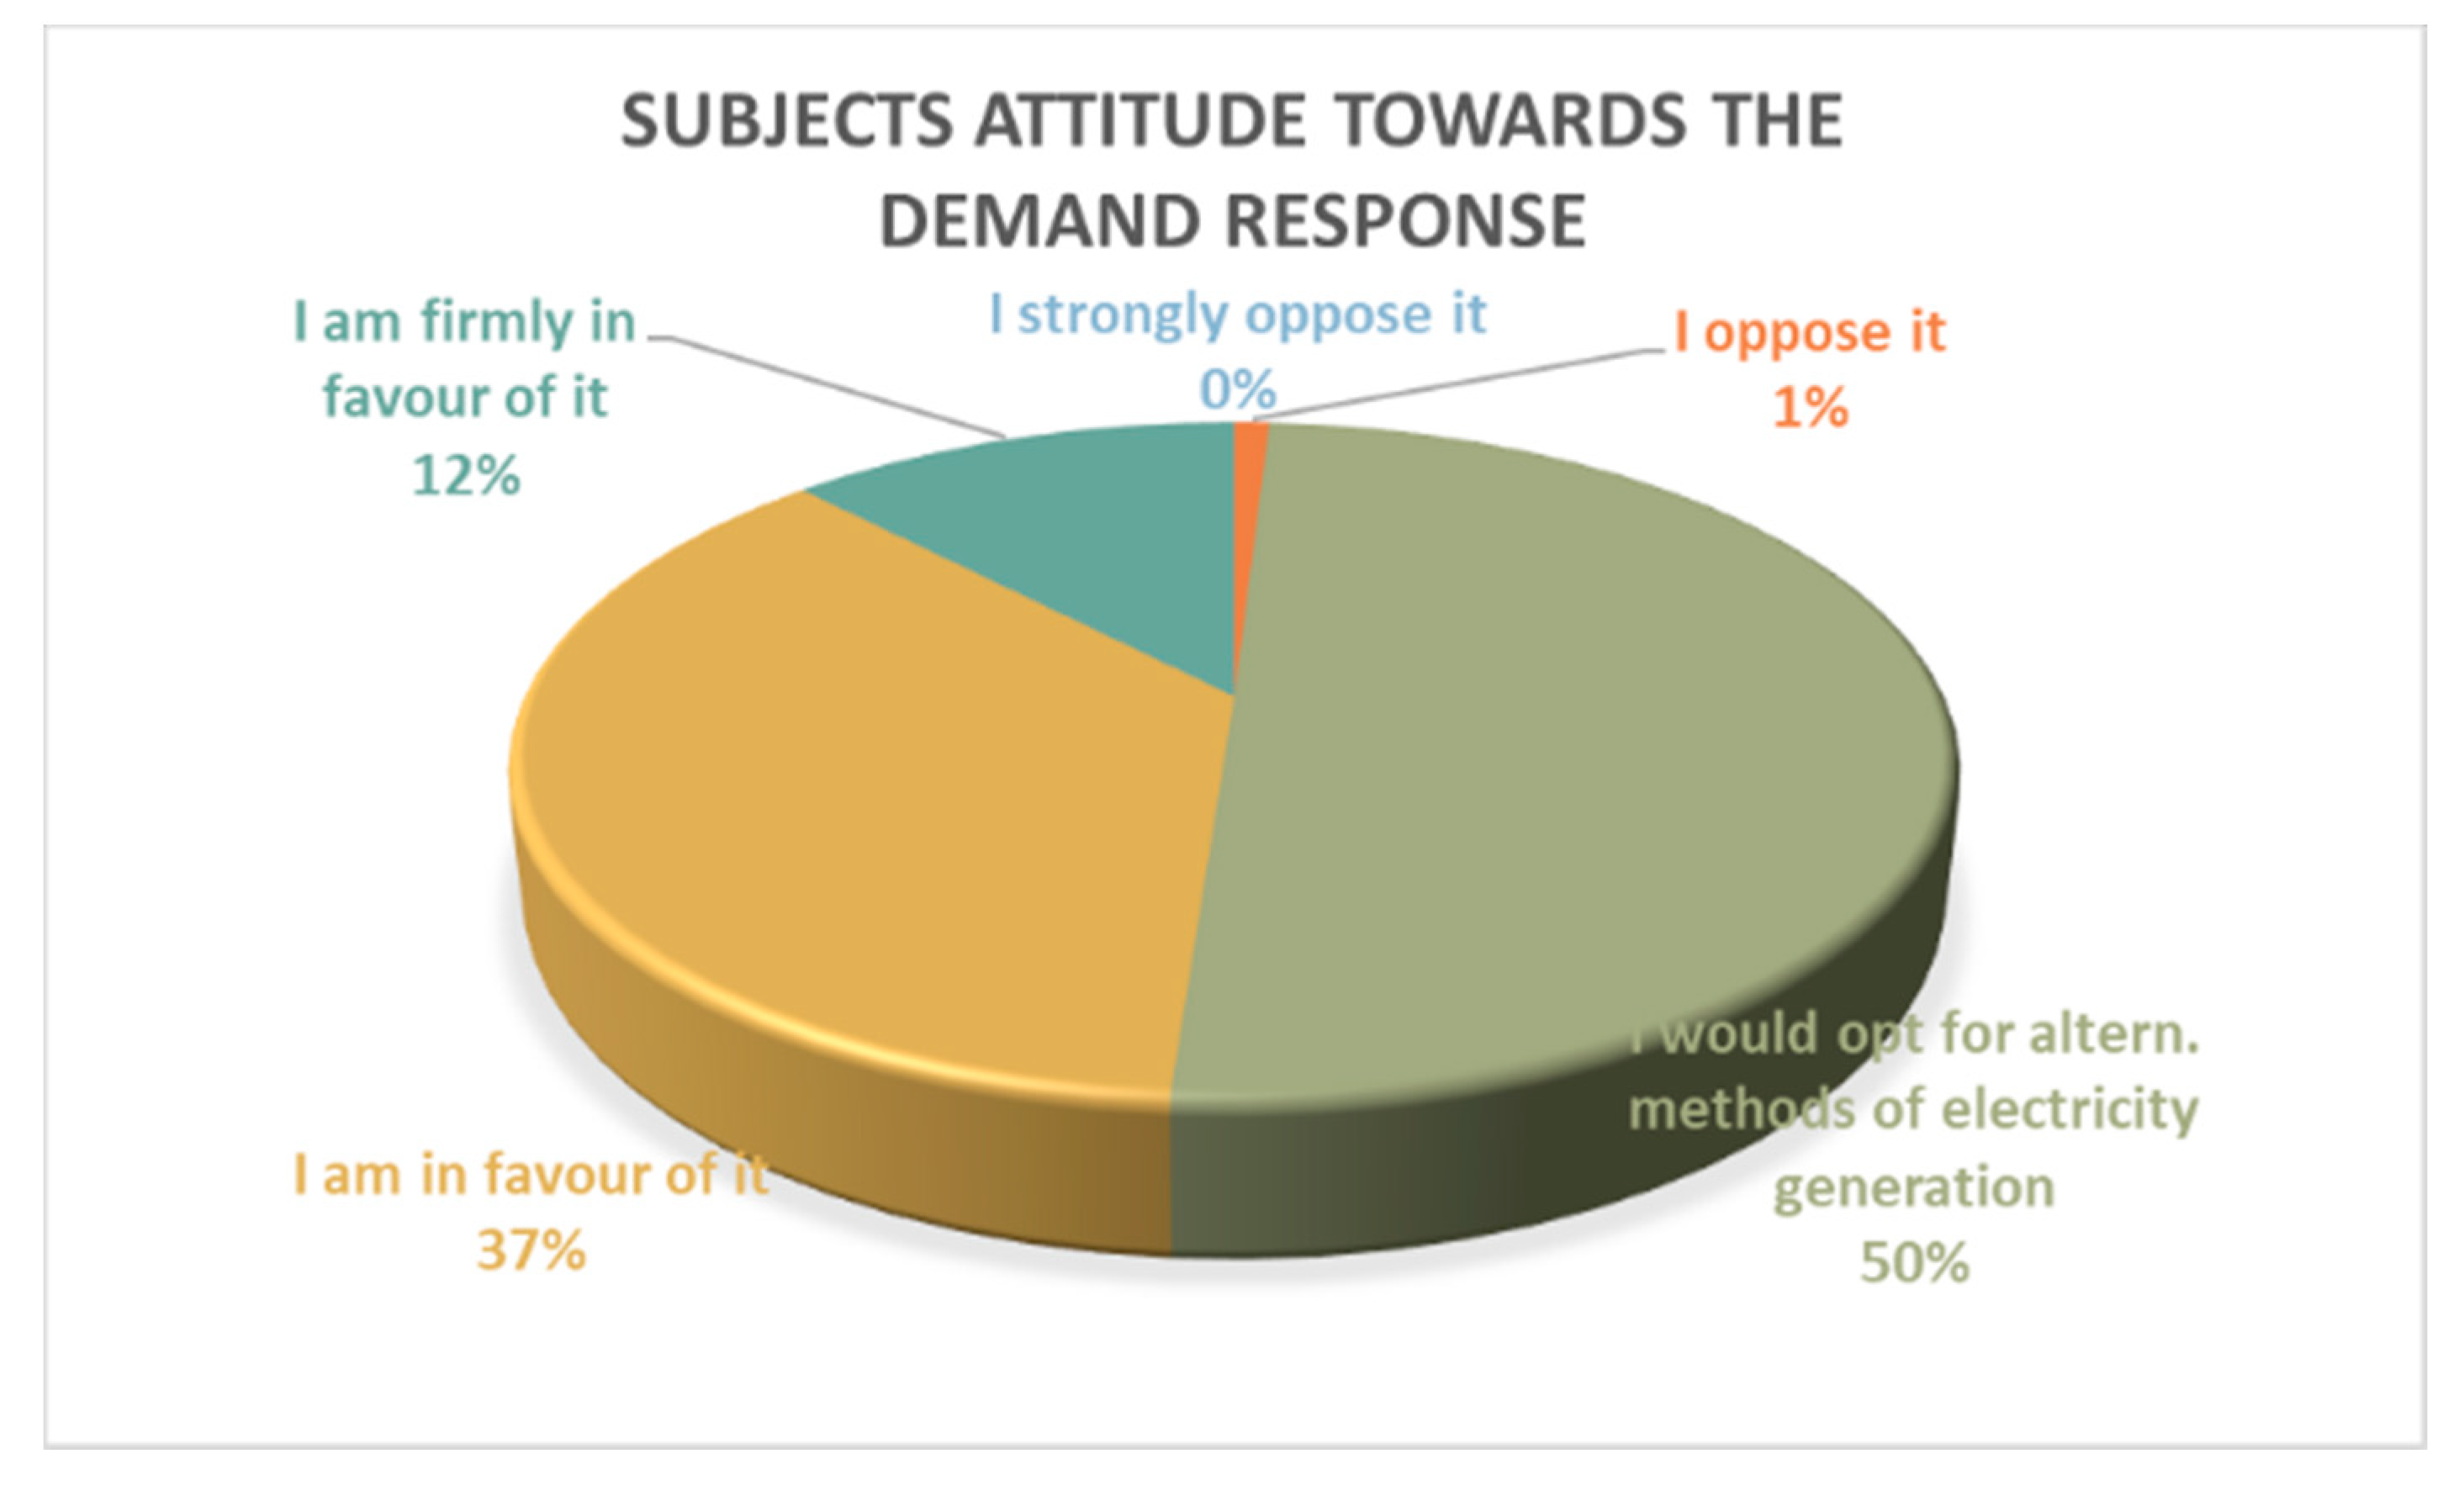
By researching attitudes towards the DR programs, we find out that end consumers do not strongly oppose them at all, and very few final consumers oppose them. In conclusion, no one indicated that they strongly oppose DR, and only 1% expressed that they opposed it. These results show that a very positive attitude for the future application and implementation of DR programs exists. In
Figure 6, a detailed representation of subjects’ attitudes towards DR can be found:
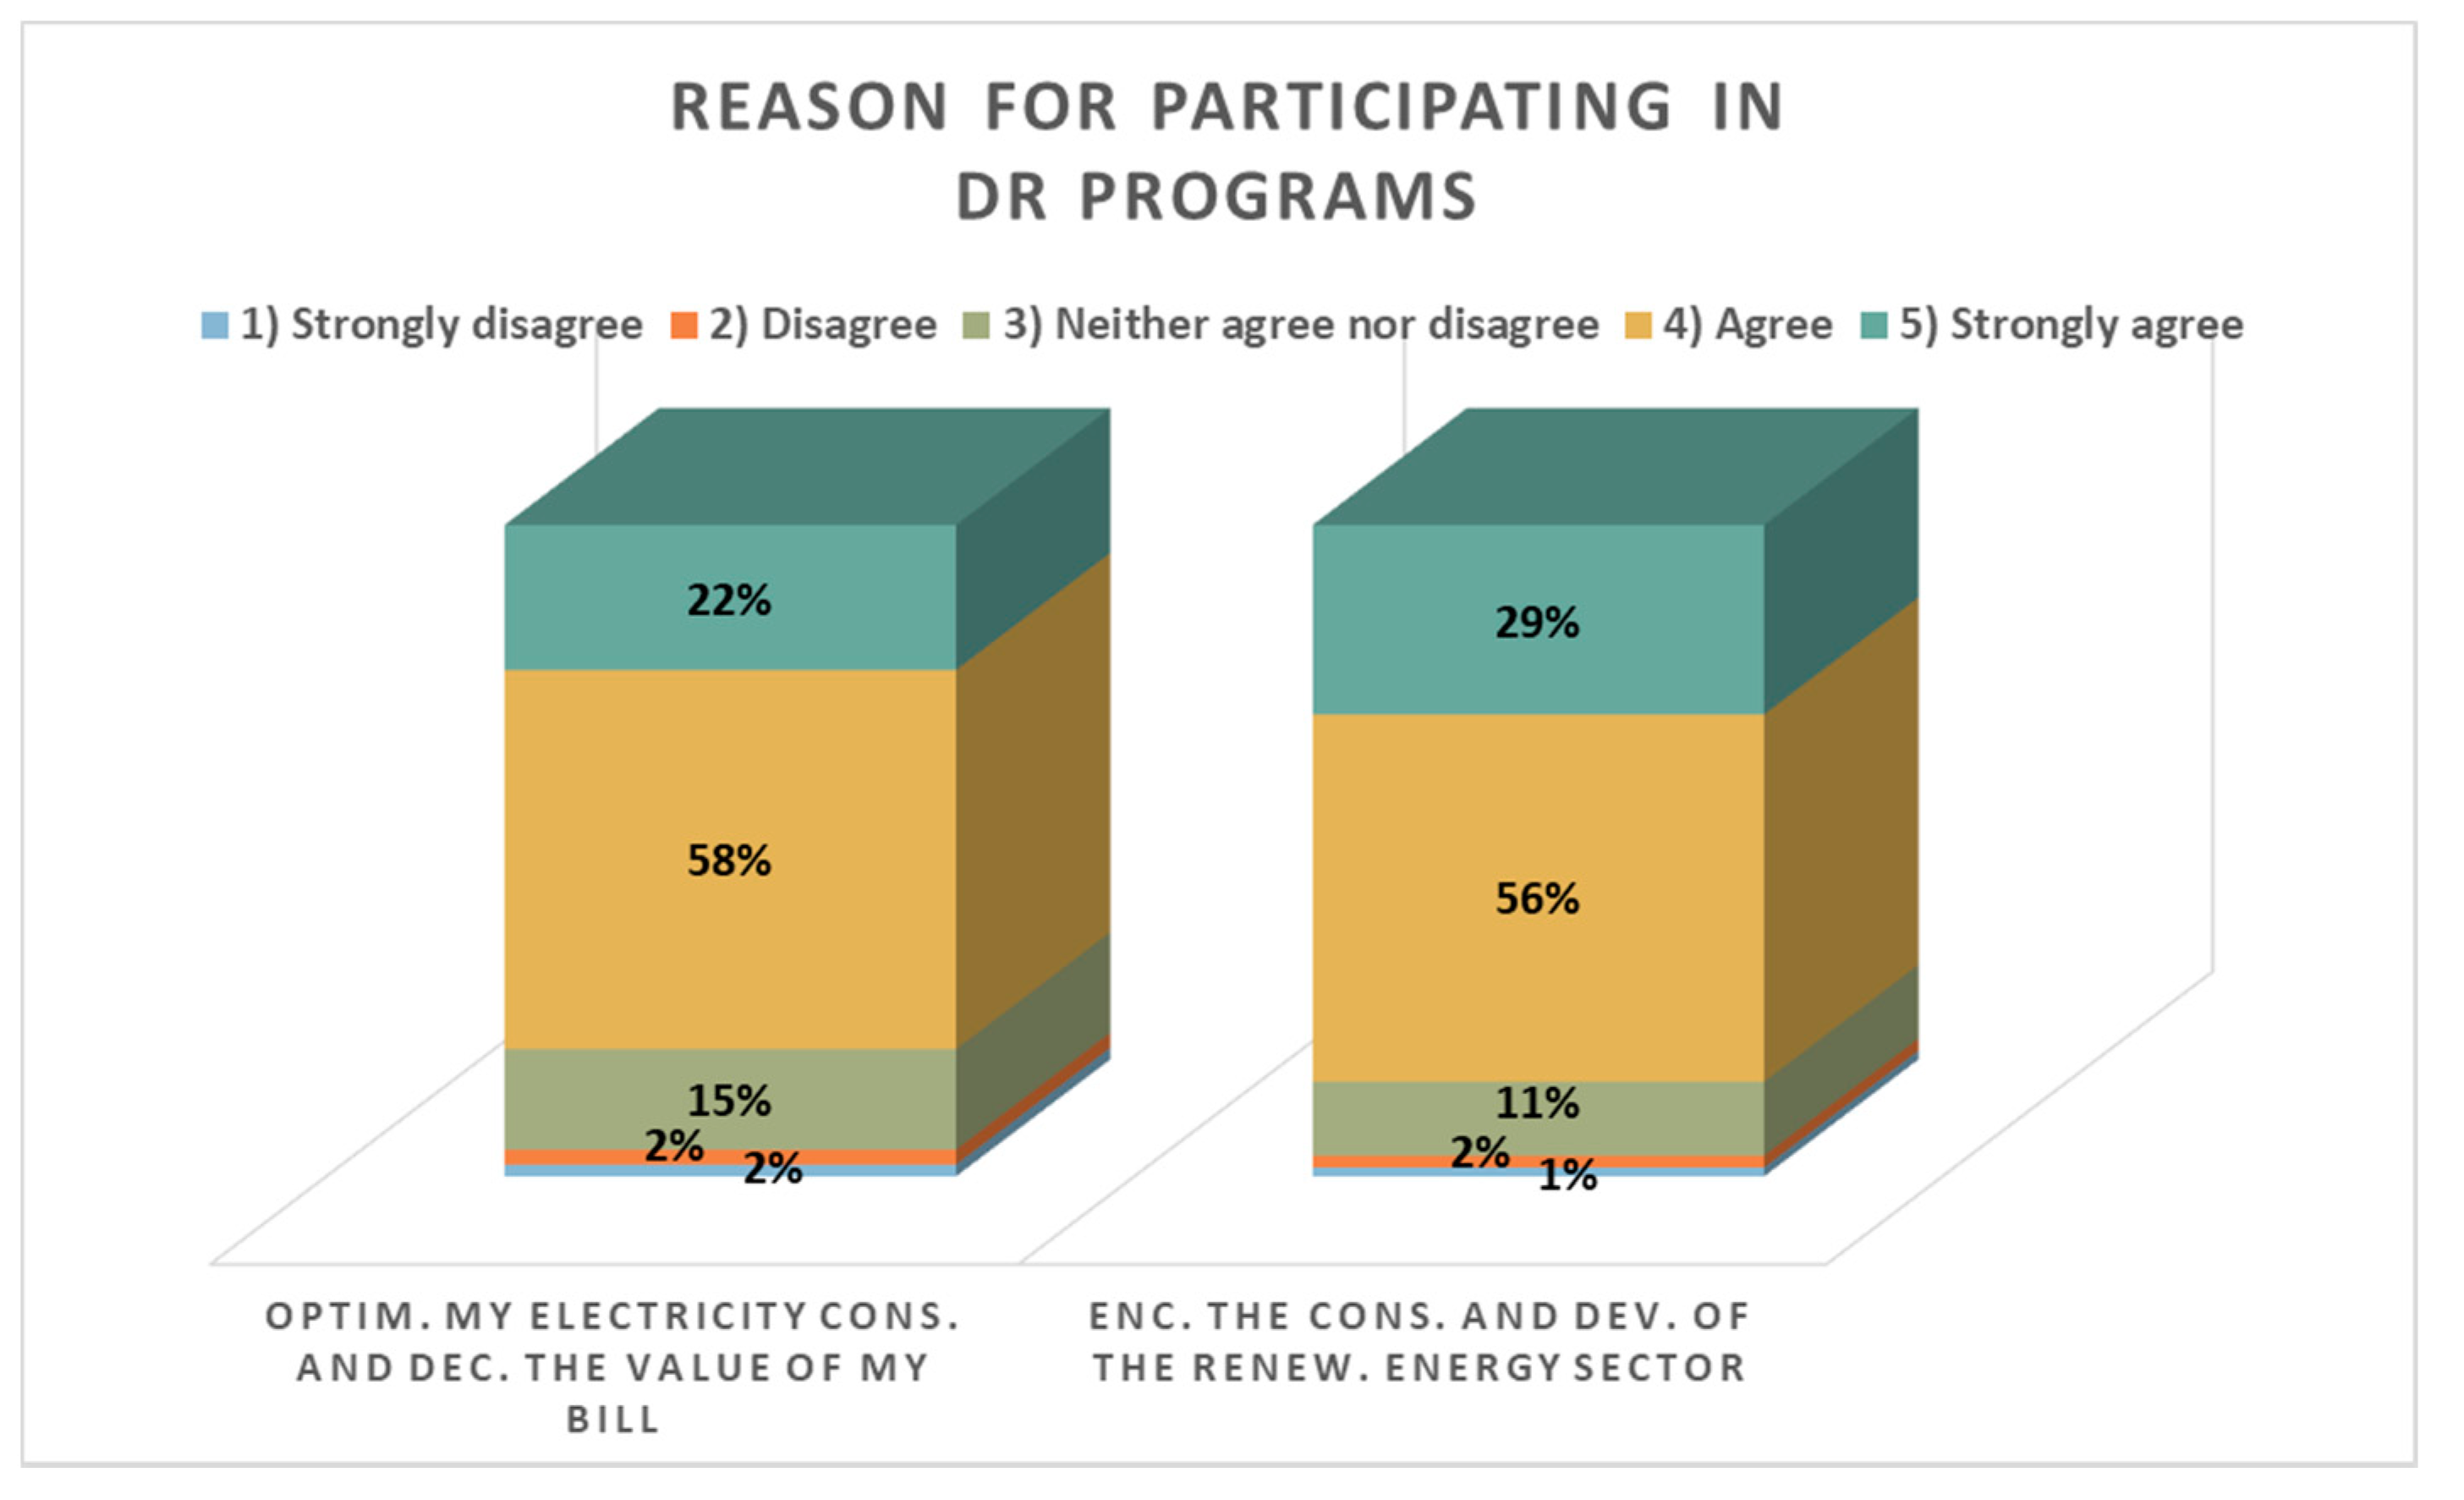
In addition, we analysed the core reason why end consumers would like to participate in DR programs. The outcome shows that the vast majority of end consumers (80%) would agree to participate in DR programs (22% strongly agreed and 58% agreed) in order to decrease the value of their energy bill and optimise their electricity consumption. Furthermore, 85% agreed (29% strongly agreed and 56% agreed) to participate in DR programs in order to encourage the consumption and development of the renewable energy sector.
Figure 7 shows a detailed representation of the results.
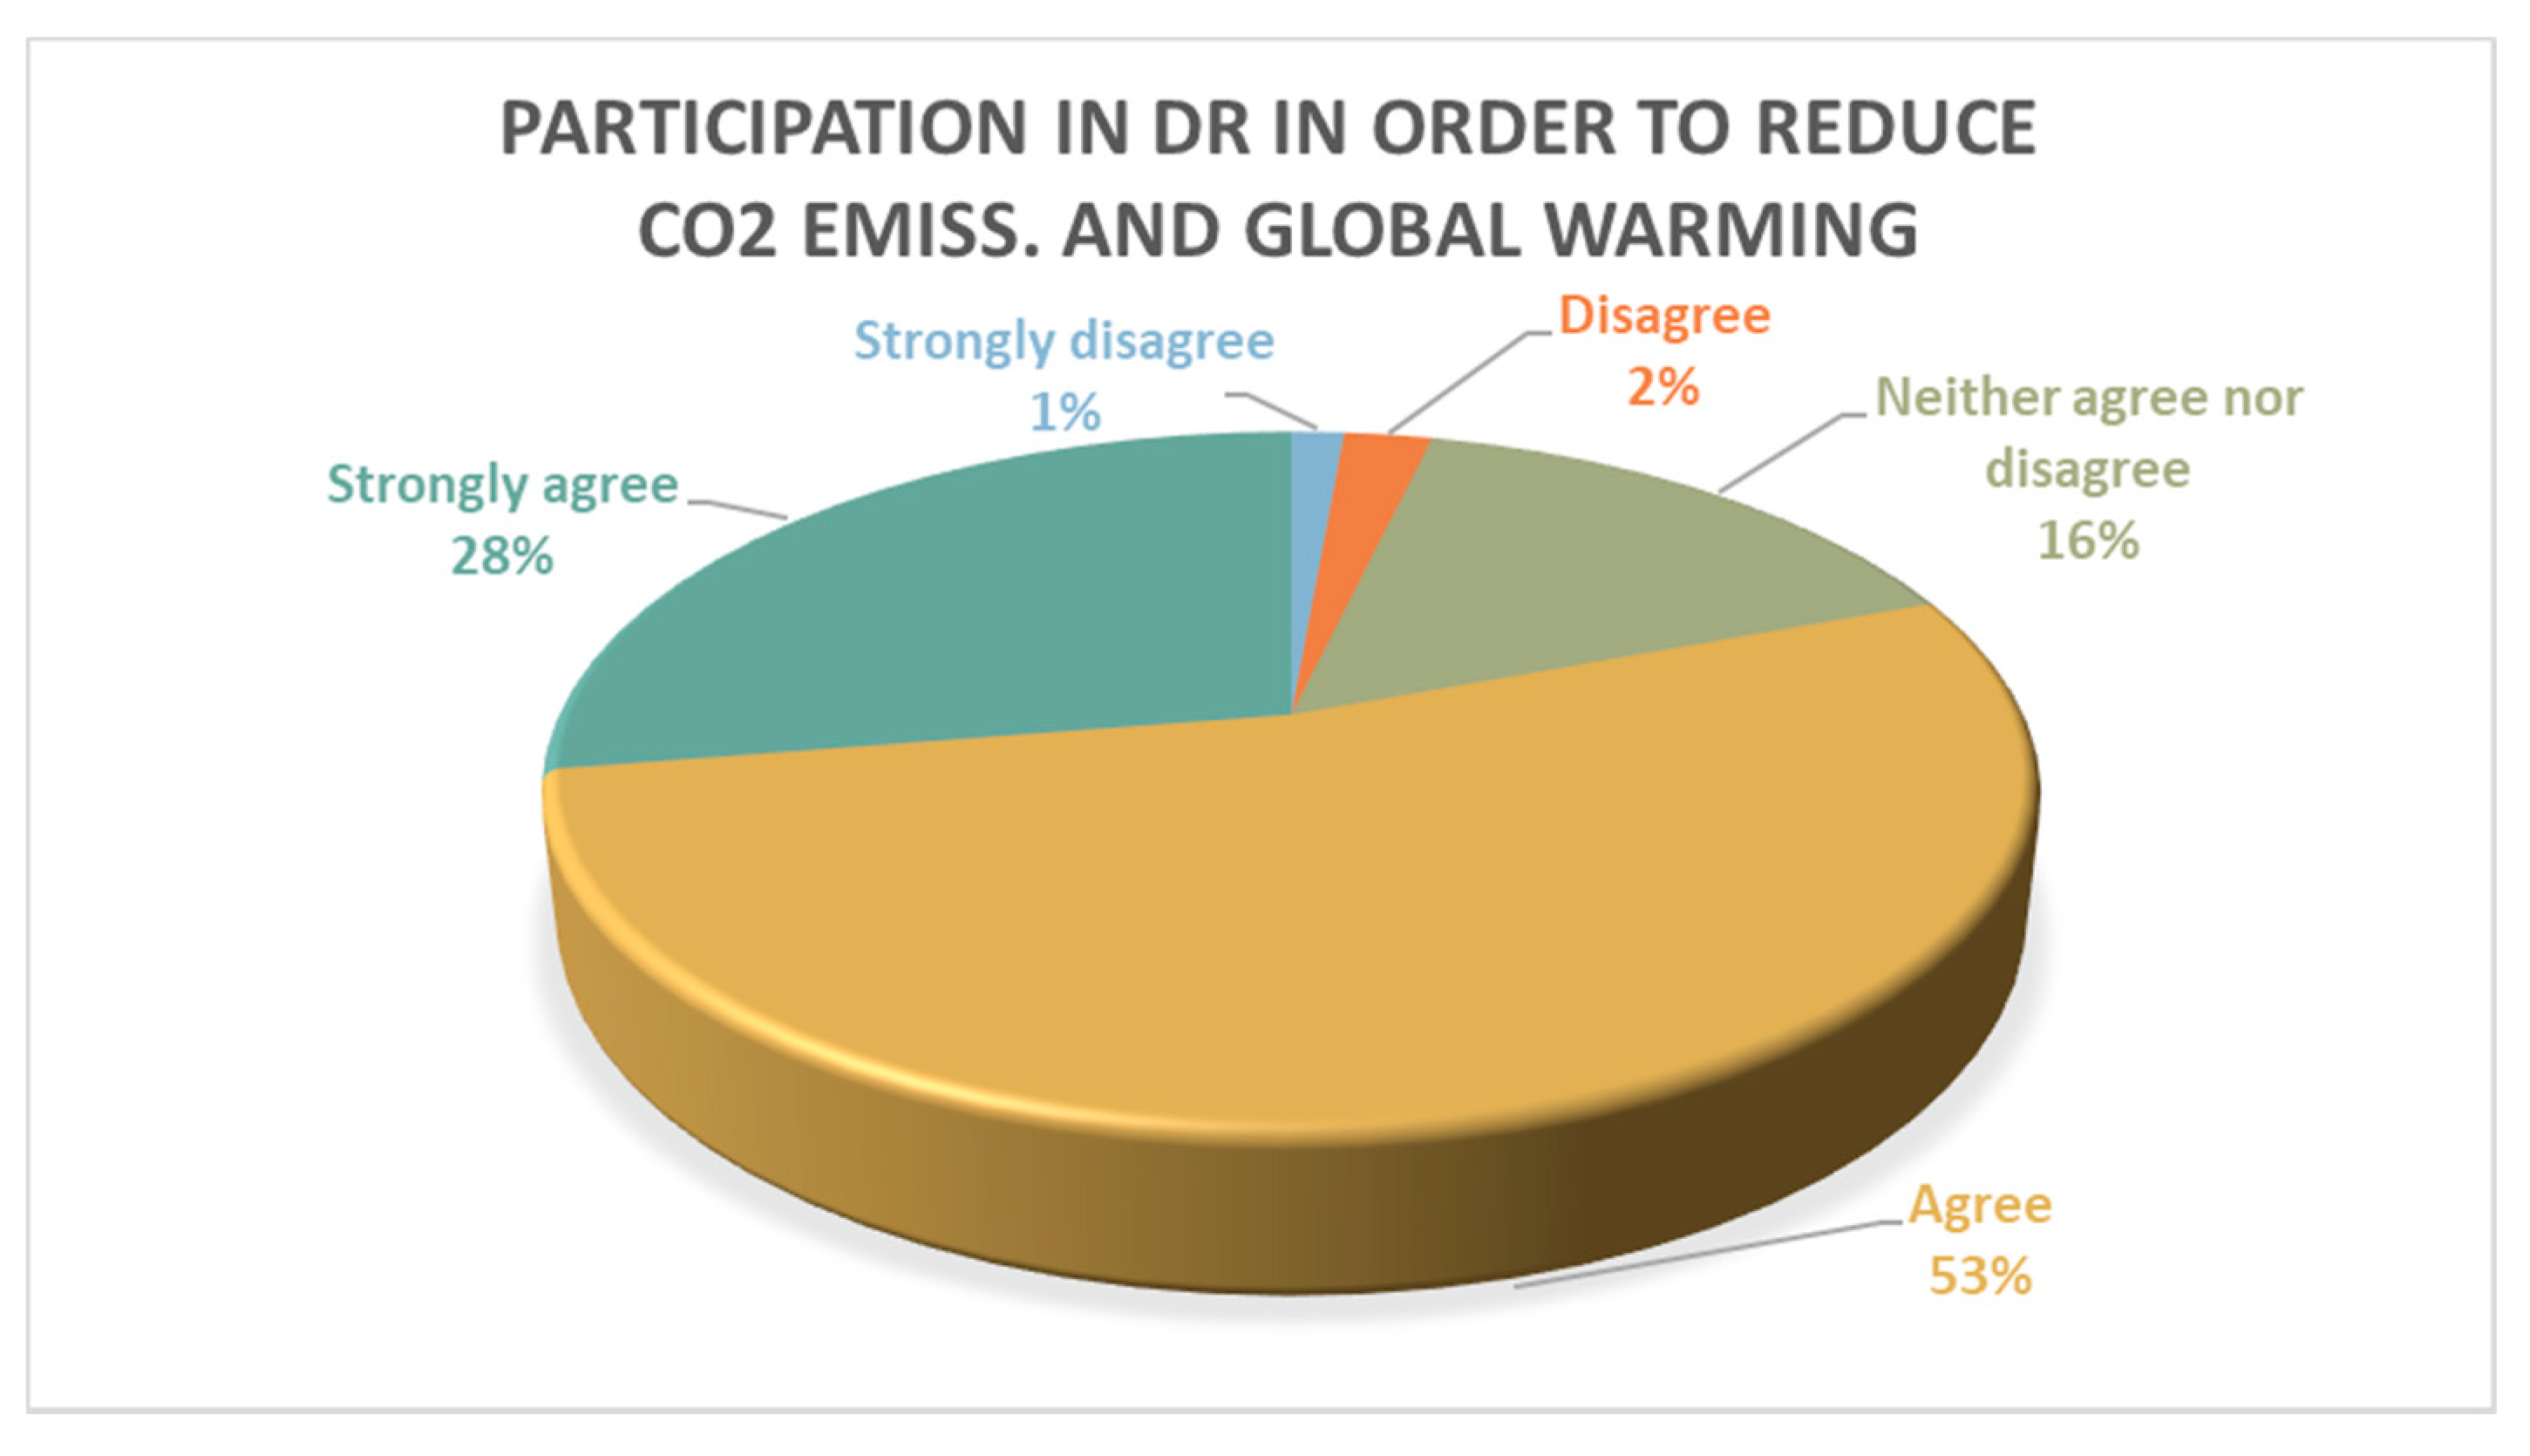
A particular question was focused on the end consumer’s willingness to participate in DR programs in order to contribute to the reduction of global warming and to reduce CO
2 emissions. In this regard, the declarations are very promising. This is because a remarkable percentage of respondents (81%) affirmed that they would agree to participate in DR programs (28% strongly agreed and 53% agreed). Detailed results are presented in
Figure 8.
These results confirm the conclusions of the previous study [
21]. Therefore, the consumers without experience in the energy field also agreed to their participation in DR programs in order to contribute to the reduction of CO
2 emissions global warming.
It has to be mentioned that the majority of studies analysing DR programs only do so from a technical point of view, as a solution for reducing the energy peaks [
38], or to balance the energy system [
39]. Most studies related to consumer behaviour in the energy sector are focused on energy consumption [
40].
Furthermore, we studied the correlation between the acceptance of the end consumer’s participation in DR programs, in order to reduce CO
2 emissions, and their level of income, which conferred an interesting result. The significant part of subjects agreed that they are interested in participating in DR programs, knowing, thereby, that through this they can contribute to the reduction of global warming and the reduction of CO
2 emissions (
Table 5).
When we considered end consumers with household incomes over 25,000 Euros, 74% agreed (27% strongly agreed and 47% agreed) to participate in DR programs. In the case of subjects where the annual household income was below 25,000 Euros, 82% agreed (26% strongly agreed and 56% agreed). In both cases, the significant majority of them were interested in the reduction of CO2 emissions.
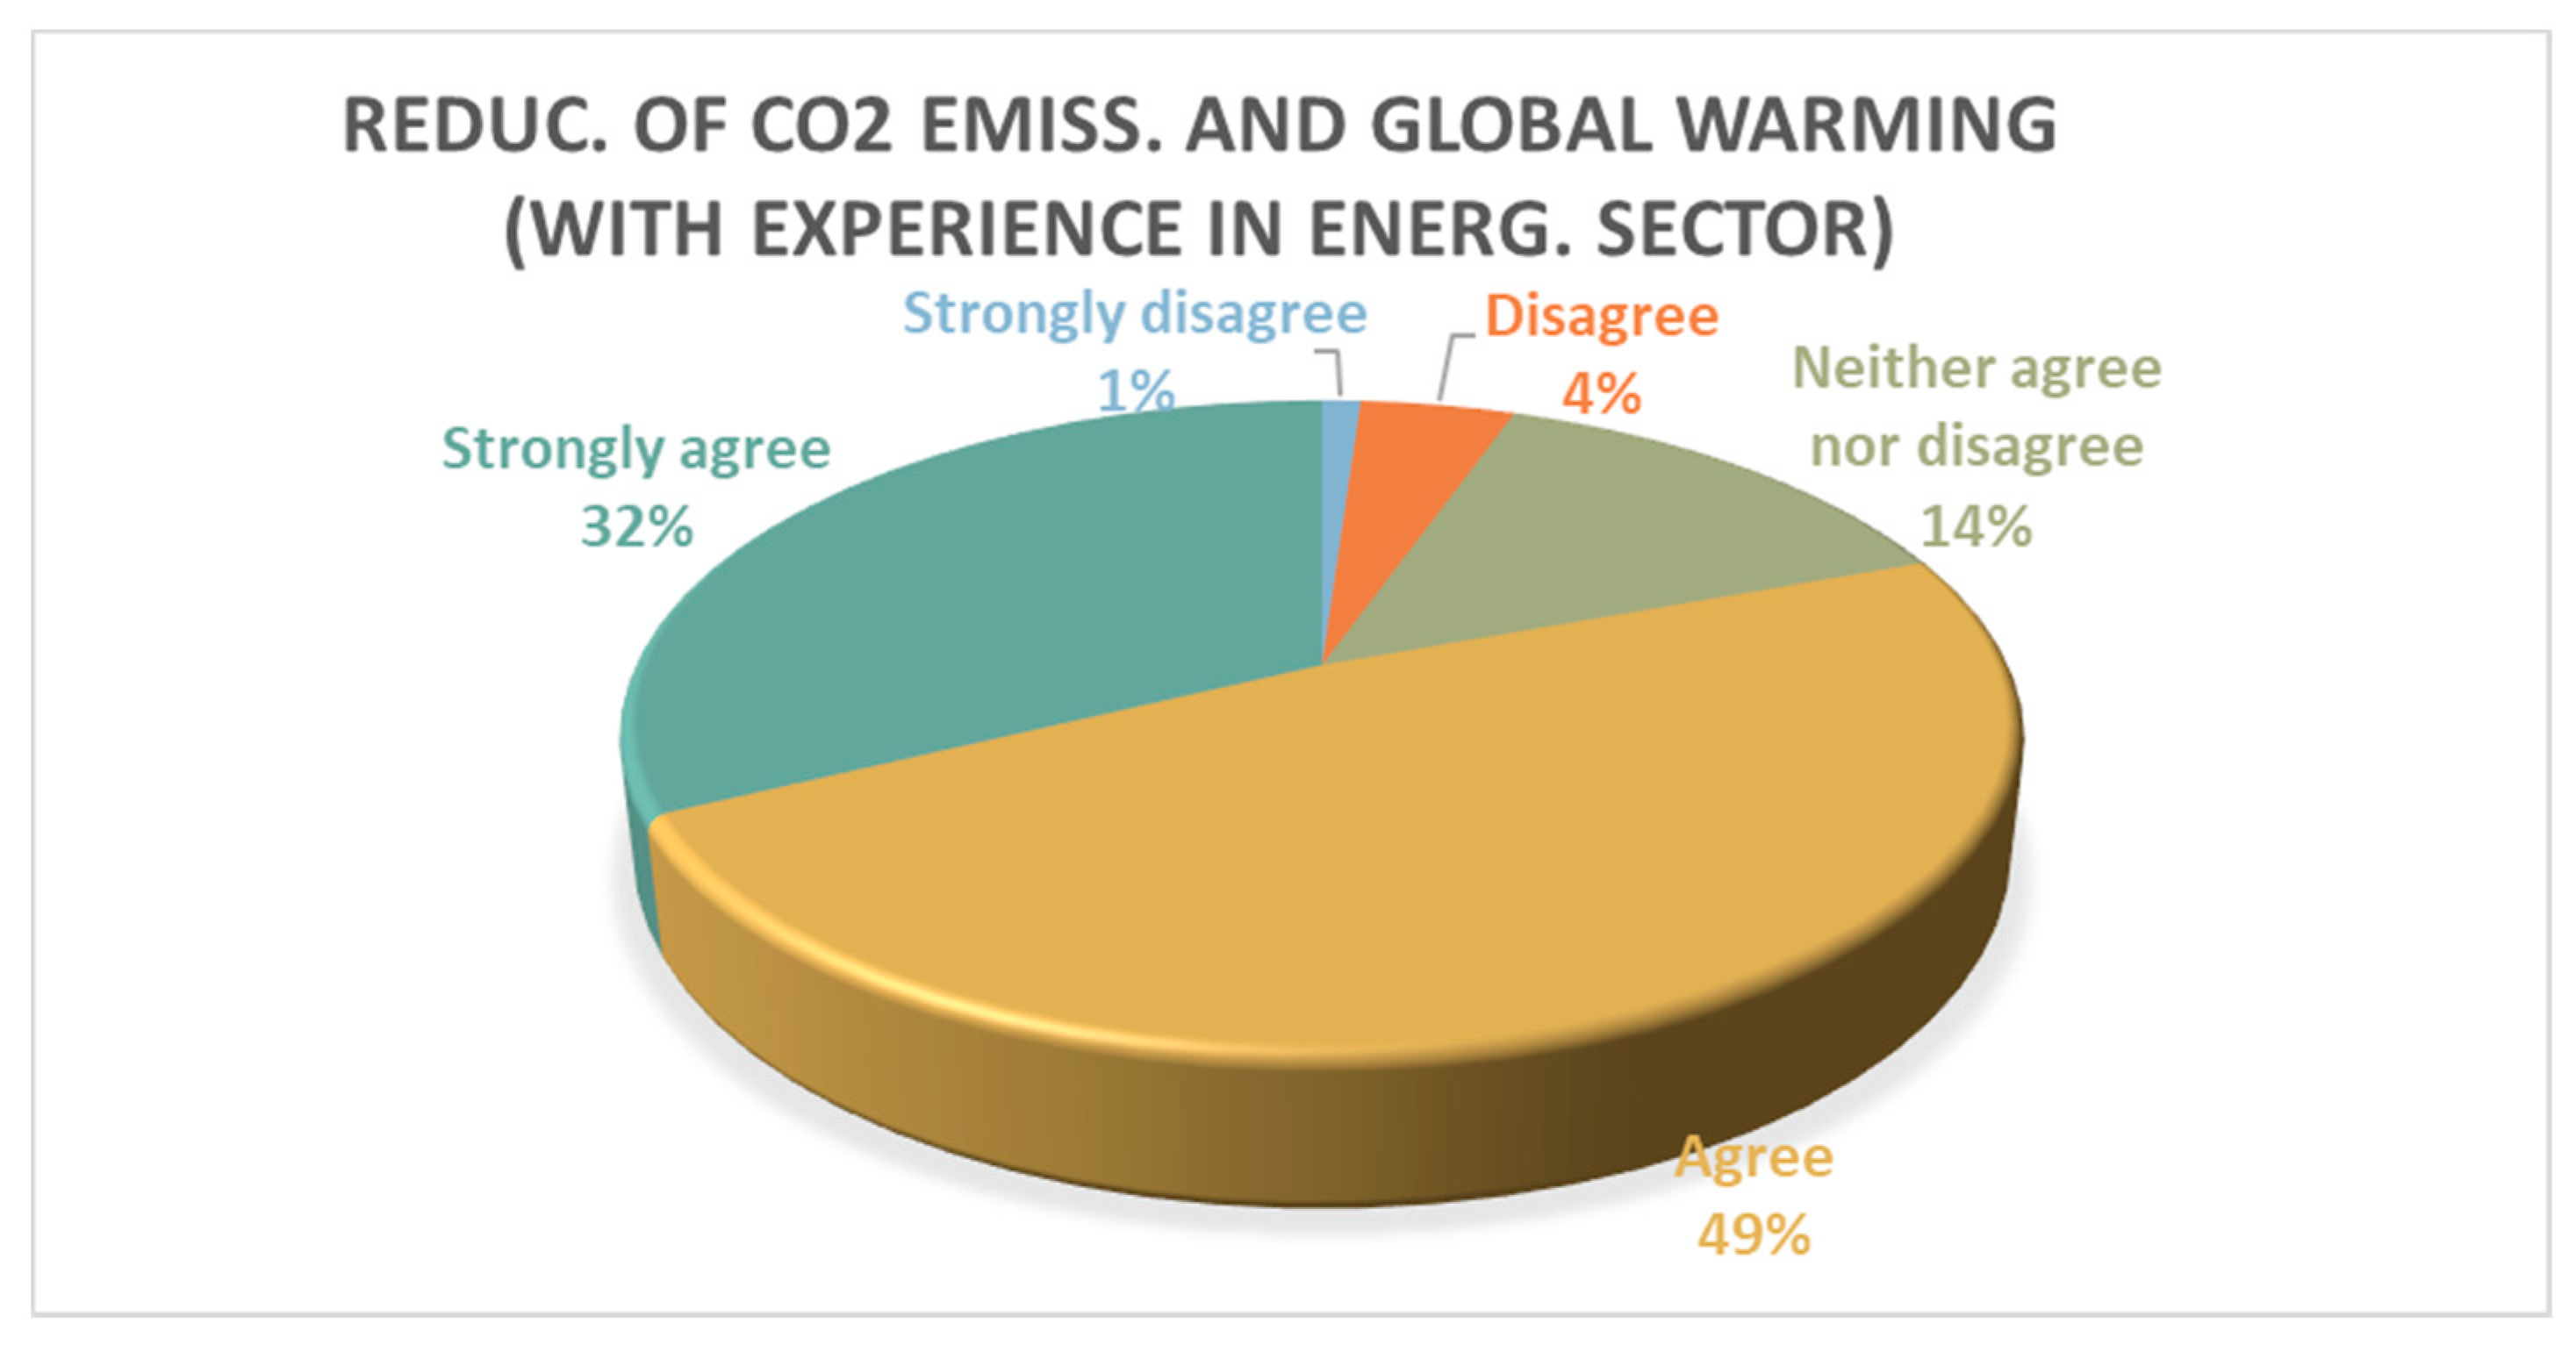
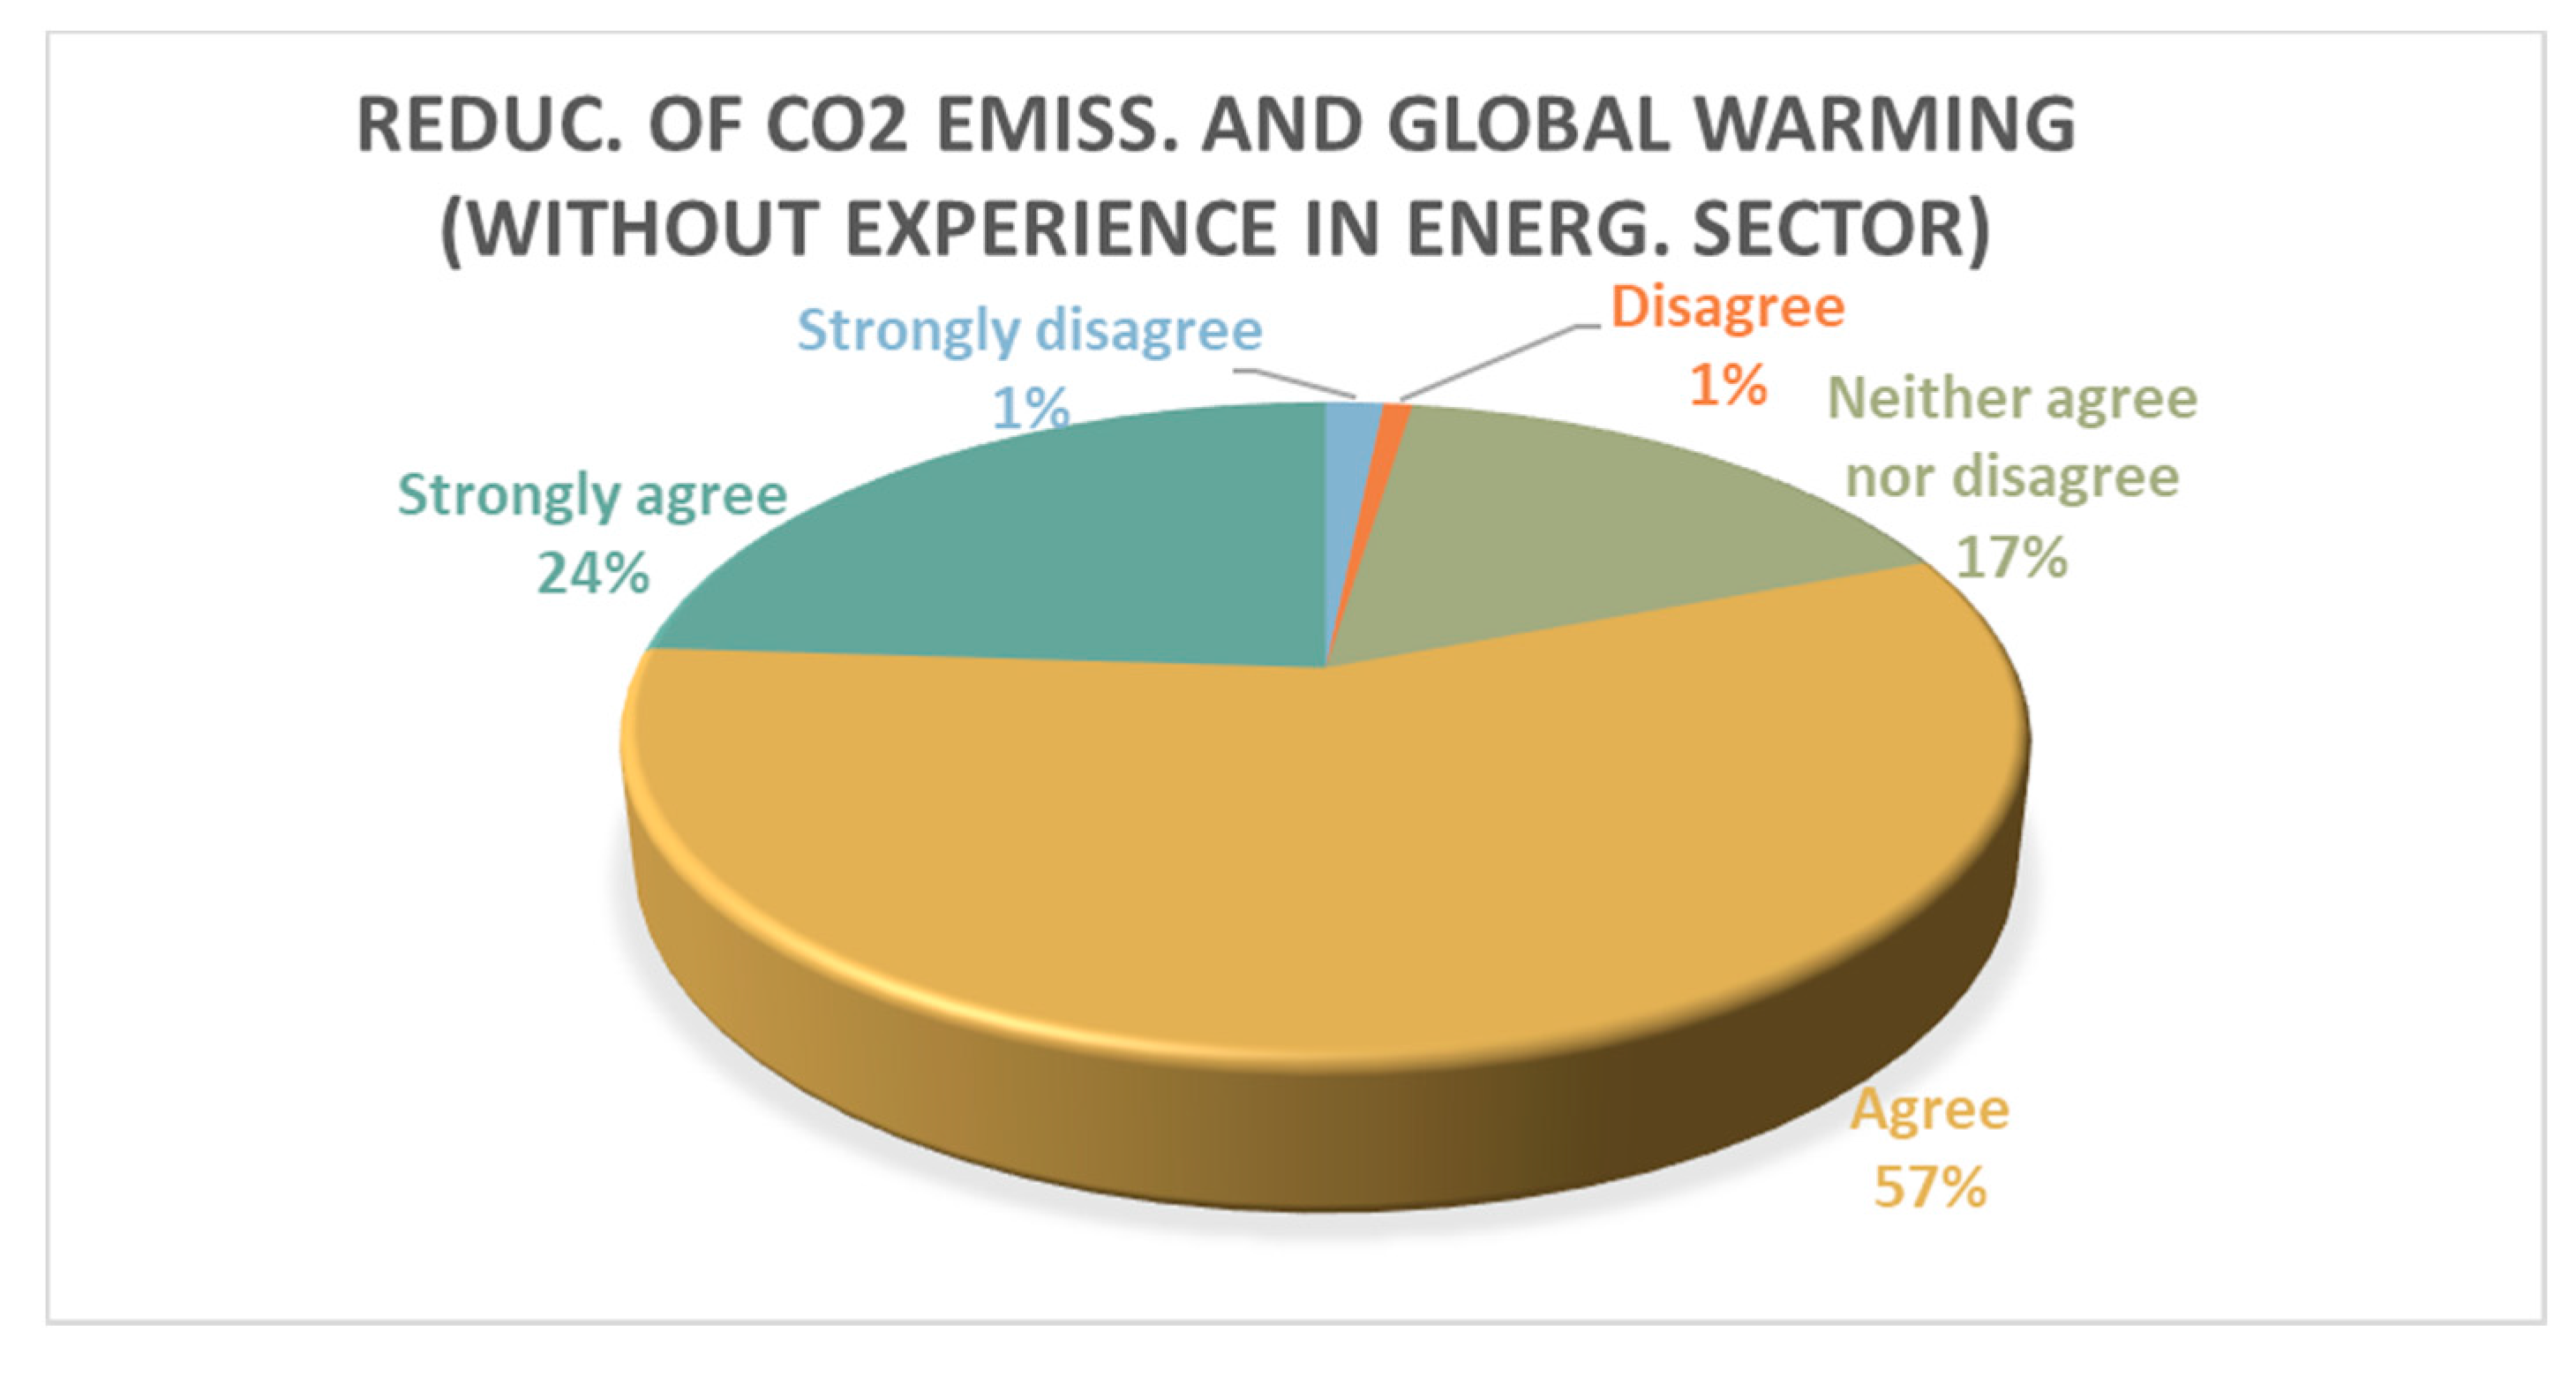
A separate correlation that we analysed was between the subjects’ willingness to participate in DR programs in order to reduce the CO
2 emissions and to reduce impacts on global warming, and the consumers’ levels of experience in the energy field (
Figure 9 and
Figure 10).
In both cases, the consumers without experience and with experience in the energy field confirmed (81%) that they would agree to participate in DR programs in order to contribute to the reduction of CO2 emissions. Consumers with experience in the field had a stronger will to participate in DR programs, as they strongly agreed in 32% of cases, versus those without experience, who strongly agreed only in 24% of cases.
When inspecting the level of acceptance of devices on which consumers could follow their current electricity consumption for different appliances in their homes, 81% of them agreed (31% strongly agreed and 50% agreed) to utilise them. When analysing the use of devices in order to follow how they contribute to the reduction of carbon emissions and to track how much renewable electricity they consumed, 80% agreed to utilise them (29% strongly agreed and 51% agreed).
Table 6 presents the detailed results:
When comparing attitudes towards DR, 44% of subjects from Romania were in favour of it (33% in favour and 11% firmly in favour of it), 67% of subjects in Hungary were in favour of it (51% in favour and 16% firmly in favour of it), while 50% of subjects from Serbia were in favour of it (30% in favour and 20% firmly in favour of it).
Regarding the participation in DR in order to optimise electricity consumption and decrease the value of their electricity bills, 78% of subjects from Romania agreed (54% agreed and 24% strongly agreed), 89% of subjects from Hungary agreed (70% agreed and 19% strongly agreed), while 80% of subjects from Serbia agreed (70% agreed and 10% strongly agreed).
With concerns to their participation in DR in order to encourage the consumption and development of the renewable energy sector, 87% of subjects from Romania agreed (59% agreed and 28% strongly agreed), 79% of subjects from Hungary agreed (49% agreed and 30% strongly agreed), while 90% of subjects from Serbia agreed (50% agreed and 40% strongly agreed).
When analysing their participation in DR because it would help with the reduction of CO2 and global warming, 82% of subjects from Romania agreed (54% agreed and 28% strongly agreed), 75% of subjects from Hungary agreed (51% agreed and 24% strongly agreed), while 90% of subjects from Serbia agreed (50% agreed and 40% strongly agreed).
We can affirm that in Romania, subjects would mostly participate in DR in order to encourage the consumption and development of the renewable energy sector, while in Hungary, subjects are interested mostly in the optimisation of electricity consumption and in the decrease of the value of electricity bills. Subjects from Serbia lean towards the development of the renewable energy sector, but also to the reduction of CO2 and global warming.
The significance of the dependence between the main factors, which have contributed to the implementation of DR programs in the energy field, was analysed based on the Kendall test. The main variables introduced in the correlation analyses were: my level of information on DR programs, my level of knowledge about flexible electricity contracts, how I would like to participate in DR programs in order to optimise my electricity consumption and decrease the value of my bill, how I would like to participate in DR programs in order to encourage the consumption and development of the renewable energy sector, how I would like to participate in DR programs in order to help with the reduction of CO
2 and global warming, distinct prices for different periods of the day, different electricity prices every hour of the day, how I would be interested in receiving a device for the DR in order to know how much renewable electricity I have consumed and my contribution to the reduction of CO
2, and a monthly average electricity consumption. The results of the correlations between the main nine variables which influence the participations of consumers in DR programs, are at first estimated with Kendall’s tau correlation coefficient (
Table 7). These variables, from V
1 to V
9, are represented by the following assumptions: V
1 My level of knowledge about flexible electricity contracts, V
2 how I would like to participate in DR programs in order to optimise my electricity consumption and decrease the value of my bill, V
3 how I would like to participate in DR programs in order to encourage the consumption and development of the renewable energy sector, V
4 how I would like to participate in DR programs in order to help in the reduction of CO
2 and global warming, V
5 Distinct prices for different periods of the day, V
6 Different electricity prices every hour of the day, V
7 how I would be interested in receiving a device for the DR in order to know how much renewable electricity I have consumed and my contribution to the reduction of CO
2 emissions, V
8 my level of information on Demand Response programs, and V9 a monthly average electricity consumption.
As visible in
Table 7, the correlation between the level of the consumers’ information, in terms of DR and their participation in DR programs, is very low or not statistically significant. Therefore, the hypothesis H1 could not be validated. Otherwise, there is a good correlation between the level of the consumers’ information, in terms of DR and their level of knowledge about flexible electricity contracts (Kendall’s tau = 0.589, sig < 0.05), and the third hypothesis (H3) is validated. A very positive outcome is that many of respondents have basic knowledge of flexible contracts and understand how they work, which is a very positive thing for the future spread of DR, even if their number is small nowadays.
The second hypothesis H2 could not be validated because the correlation between the consumers’ knowledge about flexible electricity contracts and their participation in DR programs is very low or not statistically significant. Even if subjects had a relatively good level of information on flexible electricity contracts and DR programs, in these countries, at this moment, these programs or subscriptions are not available for utilisation, can-not be tested, and consumers are cautious, which is normal for any new technology, especially when it comes to electricity supply.
The correlation between the participation in DR programs in order to optimise electricity consumption and decrease the value of bills, and to encourage the consumption and development of the renewable energy sector is at an appropriate level and is positive (Kendall’s tau = 0.53, sig < 0.05). The fourth hypothesis is validated. The fifth hypothesis (H5) is also validated due to the fact that the participation in DR programs in order to help in the reduction of CO2 and global warming is correlated to optimising the electricity consumption and decreasing the value of the electricity bills. (Kendall’s tau = 0.504, sig < 0.05). What is encouraging for the development of the field is the fact that there is an immense interest in regard to the electricity consumption optimisation through DR programs, not just to decrease the value of bills, but for environmental protection and, also, for the development of green energy.
Another correlation is registered between the motivation to receive a device during the participation in DR program, in order to track the amount of renewable electricity that is consumed and to estimate the contribution to the reduction of CO2, and the encouragement of the consumption and development of the renewable energy sector. The dependence in this case is (Kendall’s tau = 0.41, sig < 0.05), so hypothesis H6 is confirmed. Therefore, it is confirmed that the receiving of special devices can encourage the consumption and development of the renewable energy sector. We saw that the vast majority of respondents care about environmental protection and green energy sector development. These devices can help us give meaning to our electricity consumption on each electronic appliance which is really unclear for most of us, offering the resolution for optimisation.
The last proposed hypothesis H7 is not confirmed, due to the fact that the average electricity consumption per month is not correlated to the participation of consumers in DR programs (there is no statistical relevance). Most of the respondents pay very small amounts of their incomes on electricity bills, which makes them quite comfortable in this regard. These things could change when the market totally opens; regulated prices will no longer exist in these markets and consumers will have to pay the real price for the electricity, which is getting more expensive.
6. Conclusions
This study has investigated the main factors which influence the participation of consumers in DR programs and may contribute to the proliferation of renewable energy sources.
The level of information on DR programs, the level of knowledge about flexible electricity contracts, the participation in DR programs in order to optimise electricity consumption and decrease the value of bills, the participation in DR programs in order to encourage the consumption and the development of the renewable energy sector, the participation in DR programs in order to help the reduction of CO2 and global warming, distinct prices for different periods of the day, different electricity prices every hour of the day, receiving a device for the DR in order to know how much renewable electricity is consumed and the contribution to the reduction of CO2, and a monthly average electricity consumption were considered in this analysis as independent variables.
The correlation matrix revealed that the participation of consumers in DR programs is not directly influenced by their level of information or their level of knowledge in this field.
In the concerned countries, DR and aggregators are relatively new concepts. Article 17 of the EU Directive 2019/944 (Demand response through aggregation) is in the process of being transposed or has just been transposed into local legislation. This explains the relatively low level of information on DR programs, which was 82% (15% not informed at all, 33% informed a little and 34% informed to some extent). It also explains the fact that, at this moment, 50% of subjects would opt for alternative methods of electricity generation, 37% of subject are in favour of DR programs, and 17% firmly in favour of it. The fact that none strongly oppose, and only 1% oppose participation in DR programs is a very positive result.
The results of the present research suggest that the consumers’ participation in DR programs is highly influenced by different aspects related to the promotion of renewable energy, and the reduction of CO2 emissions and the global warming impact.
If we put the subjects’ preferences in order of importance, we can observe that 85% of them would participate in DR programs in order to encourage the consumption and development of the renewable energy sector, 81% in order to contribute in the reduction of global warming and to reduce CO2 emissions, and 80% to decrease the value of their energy bill and to optimise their electricity consumption. When analysing these results, we have to bear in mind that two of the concerned markets (the countries in which the subjects live) have subsidised prices for households, and only one market is totally liberalised. We could consider that these are strong facts which can attract consumers to DR, but results may differ if all three countries where liberalised markets.
Moreover, the incentives that motivate the consumers to participate in DR programs have to be focused on devices which can indicate the amount of renewable energy that is consumed and the contribution of consumers to the reduction of CO2 emissions.
We can observe that 81% percent of subjects would like to follow the instantaneous electricity consumption of different appliances in the house, and 80% are interested in following how much renewable electricity they have consumed and how they have contributed to the reduction of carbon emissions. By offering the described devices to end consumers, they could make them more involved and could make the fields of electricity supply, aggregators and DR more interesting. By seeing their electricity consumption and costs related to each device, they can more easily calculate their electricity expenditure with much more efficiency and less energy consumption, which can make them change some old equipment for new.
It can be observed that, at this moment, there is less interest towards incentives or other different pricing schemes than the development of green energy and environmental protection. These facts and actions are the triggers which can attract end consumers to DR programs. It is important to communicate that only with customers’ active participation is it possible to stop global warming and reduce electricity production from polluting fossil fuels. If consumers will be more involved in these programs, then the renewable electricity will be consumed more optimally and rationally.
Therefore, good communication and information could help in attracting consumers to utilise the described service. A huge role is played in the awareness and education of a more conscious and rational electricity consumption. Renewable electricity consumption optimisation should have the same acceptance and importance that the reutilisation of different recyclable materials has nowadays.
The limitation of this research consists of the fact that the results are focused on three electricity markets in states which also have geographical borders. The research can also be developed in other electricity markets: Bulgaria, Czech Republic, Croatia, Poland, and Slovakia. Future research may also be developed on other incentives which can be used for increasing the acceptance of consumers for demand response solutions.


