Article

The Health Impact and External Cost of Electricity Production

Faculty of Energy and Fuels, AGH University of Science and Technology, 30-059 Kraków, Poland
*
Author to whom correspondence should be addressed.
Energies 2021, 14(24), 8263; https://doi.org/10.3390/en14248263
Submission received: 15 October 2021 / Revised: 24 November 2021 / Accepted: 6 December 2021 / Published: 8 December 2021
(This article belongs to the Collection Feature Papers in Energy, Environment and Well-Being)

Abstract

:
The use of fossil fuels, which still dominate global primary energy consumption, results not only in emissions of greenhouse gas but also in emissions of pollutants such as SO2, NOx, and PM. Damage caused by air pollution can be expressed in monetary terms in the form of external costs to society. The goal of this paper is to answer the following questions: How much will the energy sector’s emissions change as a result of decarbonization? What is the estimated level of external costs related to human health in future energy scenarios? How large are the estimated external costs compared to the planned investments in this sector? The study conducted for the period 2018–2050 used the impact pathway approach and covered the centralized power and heat generation sector in Poland. The reported values of the concentration–response functions that relate human exposure to air pollution with health impact were reviewed. The results show that external costs decrease from an estimated annual level in the range of EUR 782–1911 million in 2018 to EUR 36–876 million in 2050. The cumulative value of avoided external costs between 2018 and 2050 is significantly lower than the planned capital expenditures in the energy sector in Poland.

1. Introduction

The scenarios presented in the recently published report of the Intergovernmental Panel on Climate Change (IPCC) show that only a reduction in carbon dioxide emissions to almost zero will keep the Earth’s temperature at a level similar to today (scenario SSP1–1.9) [1]. Otherwise, there would be a significant increase in temperature by 2100, even above 5 °C, according to scenario SSP5–8.5. To address the challenges of global warming, the European Union (EU) has pledged to reduce its net greenhouse gas (GHG) emissions by at least 55% by 2030 compared to 1990 and to become climate neutral by 2050 [2]. In its National Energy and Climate Plan submitted to the European Commission, Poland sets the following climate and energy targets for 2030: (i) a 7% reduction in GHG emissions in non-ETS sectors compared to 2005 levels, (ii) a 21–23% share of renewable energy sources (RES) in gross final energy consumption, and (iii) a reduction in the share of coal in electricity production to 56–60% [3]. Ten years later, the share of RES in gross final energy consumption is planned at 28.5%, and the share of brown and hard coal in electricity production at 28% [4]. In 2018, the share of coal in electricity generation in Poland was 75.4% and the share of renewable energy sources was 12.7%. Having the highest share of coal in electricity and heat production of the EU means that Poland will have to incur substantial costs to achieve climate neutrality. According to a government document, the projected cost of investment in the entire energy sector between 2021 and 2040 is estimated at EUR 200 billion, of which EUR 117 billion is for the electricity sector [4]. One study showed that the capital expenditures (CAPEX) of the electricity sector to achieve carbon neutrality by 2050 is EUR 134 billion [5]. McKinsey & Company estimated the cost of decarbonizing the Polish power sector by 2050 at EUR 100 billion [6]. It is worth noting that Poland’s gross domestic product at market prices in 2018 was EUR 497 billion.
The coal-based energy sector, in addition to CO2 emissions, emits other pollutants that directly affect human health, such as SO2, NOx, and particulate matter (TSP: total suspended particles, PM10: particulate matter with a diameter of 10 µm and below, and PM2.5 with a diameter of up to 2.5 µm). These pollutants cause many diseases such as cancer, heart attack, neurological problems, pneumonia, chronic bronchitis, and asthma, leading to hospital admissions and a reduction in life expectancy [7,8,9,10,11,12,13,14]. The observed human effects of various kinds result in measurable economic costs and losses (external cost), e.g., hospitalization cost, absence at work due to illness, or premature death. An external cost (or externality) is the cost of an activity to those that are not directly participating in the activity itself [15]. In this paper, the term external cost refers to the cost to society caused by the negative health impact of direct emissions from the energy sector. To calculate the health effect, the concentration–response functions (CRFs) (also known as exposure–response functions, ERFs) were used. The slopes of concentration–response functions presented in several studies are listed in Table 1.
The external costs of pollutant emissions have been estimated in many studies. A recent report prepared by the European Commission showed that the national average external costs of electricity in the EU-27 were the highest in Estonia at 221 EUR/MWh, in Cyprus at 146 EUR/MWh, and in Poland at 139 EUR/MWh [15]. For heat production, the highest external costs were observed in Slovenia at 100 EUR/MWh and Estonia at 88 EUR/MWh. The European Commission’s analysis considers the external costs of climate change, human health, eutrophication, acidification, and ozone depletion. The total external costs for electricity and heat production were estimated at EUR 23.7 billion and EUR 10.5 billion, respectively. Most of the external costs are due to the effects of climate change and particulate matter emissions. For example, in Poland, CO2 emissions account for 70% and 46% of the total external costs of electricity and heat generation, respectively, while the respective shares for particulate matter are 32% and 16%. In Iran, based on the same approach but with different tools than those used in this paper, the annual health damages related to the emissions of 61 power plants were USD 723 million, averaging 2.85 USD/MWh [16]. A detailed analysis of external costs related to the energy sector in Turkey showed average external costs of 36 EUR/MWh for brown coal, 14 EUR/MWh for hard coal, and 5 EUR/MWh for natural gas. Most of the external costs were associated with CO2 emissions. A study in China found that of external costs associated with the life cycle of coal, 96% arise from combustion, 3% from mining, and 1% from coal transport. Most of the costs (87.2%) are related to human health, and the rest to global warming and destruction of materials [36]. The low contribution of global warming to the cost of damages has also been reported in other works for many regions in the world [37]. Another work, based on the use of multiple models, estimates the average external costs (excluding CO2) related to the health impacts of air pollution emitted by all sectors at EUR 334 billion and EUR 146 billion for Europe and the United States, respectively [17]. According to various estimates carried out around the world, the highest external costs are observed in coal combustion technology due to high emissions of CO2 and particulate matter, while costs are very low (less than 2 EUR/MWh) for renewable and nuclear sources [15,37,38,39,40,41,42]. The results are influenced by the following factors: CO2 emission costs (and also whether they are considered or not), emission values, concentration–response functions adopted, population, and monetary valuation of various health damages [43]. As a result, external cost estimates reported in the literature can fall into large ranges. Taking coal as an example, data from 36 estimates showed the external cost with a minimum value of 0.01, a maximum of 90.6, and a mean of 18.75 USD/kWh [42].
In this paper, we estimated the baseline (2018) and future (2030, 2035, 2040, 2045, 2050) external costs of emissions from the centralized power and heat generation sector (hereinafter referred to as the energy sector) in Poland. A full description and the results of the energy scenarios considered in this paper are given in [44]. The main question we addressed was: What is the proportion of the avoided external costs for the energy sector to the capital cost of transforming the sector into a climate-neutral one? The impact pathway approach (IPA) was used to estimate the external costs of emissions. This approach, developed as part of the ExternE projects, has been widely used to assess the environmental impact and calculate the external cost of the energy sector [12,16,41,42,45]. In this study, emissions in 2018 were estimated for all the stacks of the Polish energy sector, including public power plants (PP), public combined heat and power plants (CHP), district heating plants (DHP), and industrial combined heat and power plants (CHPI). Emissions in 2030, 2035, 2040, 2045, and 2050 were calculated based on energy sector development scenarios and EU emission standard regulations. Then, the atmospheric transport of pollutants emitted from the energy sector was modelled using the Polyphemus air quality modelling system. The obtained results of ambient concentration of PM10, PM2.5, NOx, and SO2 were then used to calculate the health impact and the associated external costs. In this study, only direct emissions from the energy sector were considered. Life-cycle emissions, e.g., those related to fossil fuel extraction or commissioning/decommissioning of power and heating plants, were not taken into account. According to a study in China, in the case of coal-fired power plants, only 4% of life-cycle emissions are related to the extraction and transport of coal [36].

2. Methodology

The impact pathway approach used in this study is based on four main steps: (i) identification of emission sources, (ii) modelling the atmospheric transport of pollutants, (iii) estimation of the impact of air pollution on human health, and (iv) estimation of the external cost. In this article, the impact of direct emission from fuel combustion on human health and related external cost were calculated. The external cost of climate change, eutrophication, acidification, and ozone depletion were not taken into consideration.

2.1. Emission Estimation

In this paper, two emission scenarios were developed for four groups of units: public power plants (PP), public combined heat and power plants (CHP), district heating plants (DHP), and industrial combined heat and power plants (CHPI). The scenarios provide estimates of fuel consumption in each group. Fuels such as biomass (BM), hard coal (HC), brown coal (BC), natural gas (GS), biogas (BG), heavy fuel oil (HFO), and light fuel oil (LFO) were considered. Heavy fuel oil (HFO) and light fuel oil (LFO) are used during combustion start-up in units that burn solid fuels such as coal and biomass. The emission scenarios were developed on the basis of the scenarios for the development of the Polish energy sector described by the authors in the previous work [44]. The first one, referred to in this article as the non-nuclear scenario (NN) and in [44] as the RES scenario, assumes that no nuclear power plant will be built in Poland in the future. In this scenario, electricity generation takes place mainly through renewable energy sources supported by gas peaking units. The power sector annual emissions of CO2 are less than 10 Mt in 2050. The second one, referred to in this article as the nuclear scenario (YN) and in [44] as NUC, assumes that the first nuclear power plant will be built in Poland between 2030 and 2035. The total electrical capacity installed in nuclear power plants reaches 10.4 GW by 2050. The results of the energy scenarios include fuel consumption of existing and new power plants. The levels of emissions of pollutant released into the air from the energy sector in Poland were estimated for 2030, 2035, 2040, 2045, and 2050 based on fuel activity provided in each group of generation units and fuel-specific emission limit values (ELVs) for pollutants. Emission limit values for pollutants from the power sector are defined by European Union regulation in the so-called best available techniques (BAT) conclusions [46]. These regulations are the same for all Member States and apply from January 2021. The average annual emission limit values applied to the power sector for existing and new plants are shown in Table 2. It is the first attempt to estimate future emissions using the ELVs presented in the BAT conclusions. The volume of flue gas resulting from combustion of GJ of a given fuel was determined for different fuels on the basis of previous research [47,48,49].
Emissions of SO2, NOx, TSP, PM2.5, and PM10 in 2018 were individually estimated for 18 public power plants (PP), 60 public combined heat and power plants (CHP), 439 district heating plants (DHP), and 63 industrial combined heat and power plants (CHPI). These emissions were estimated based on the Enviro database, which has been developed since 2006 at AGH UST [50]. This database is continuously updated based on publicly available information. The Enviro database contains detailed information on boilers (1965 boilers), stacks (580), SOX, NOx, and TSP emission control systems, fuel consumption (natural gas, coal, biomass, biogas, heavy fuel oil, light fuel oil), and emissions. Based on these data, the emissions for the period 2030–2050 were disaggregated over Poland. Future emissions have been distributed proportionally according to the fuel consumption of the individual boilers in 2018.

2.2. Modelling of Air Transport of Pollutants

The Polyphemus air quality system was applied to model the atmospheric transport of pollutants emitted from the considered point sources from the energy sector [51]. Polyphemus includes the Eulerian-type model Polair3D, which enables modelling of dispersion of gaseous and dust pollutants. The model considers reactions and transformations in gaseous, aqueous, and solid phases. Polyphemus has been used extensively by many research groups, and the results obtained over Europe and Poland have been thoroughly evaluated. The results of the evaluation of concentrations and deposition of particulate matter (PM2.5, PM10), sulfur dioxide (SO2), nitrogen dioxide (NO2), ozone (O3), mercury (Hg), lead (Pb), and cadmium (Cd) against measurements from different types of stations (background, urban, industrial, and transport) can be found in [20,52,53,54]. In Poland, the Polyphemus air quality system has previously been used from local to continental scale to assess air quality and the impact of different sectors and emission sources [45,54,55,56].
The modelling domain applied in this study covers Poland and consists of 67 × 112 cells (along latitude and longitude respectively), starting at 48.40°N latitude and 13.50°E longitude with a horizontal resolution of 0.1°. Five vertical levels were used with the following limits (in meters above surface level): 0, 50, 600, 1200, 2000, and 3000. The simulation was run with a time step of 10 min, and results were saved for each hour as the average value of the six steps. In total, 12 one-year simulations of pollutant dispersion were run. The simulations were run based on emissions for the years 2018 (base year), 2030, 2035, 2040, 2045, and 2050. For the period 2030–2050, simulations were run for two scenarios: non-nuclear (NN) and nuclear (NY). Additionally, one simulation without emissions from the energy sector was run to assess the background level. The difference between the concentration results of the simulations with and without emissions from the energy sector makes it possible to calculate the impact of this sector on air quality in each of the years and scenarios considered.
Emissions from the power sector were determined for each stack based on detailed location [57]. This process was performed by Polyphemus using land-use coverage (LUC) data with a horizontal resolution of 1 km by 1 km [58]. Emissions from other sectors and natural emissions remained at 2018 levels. In this article, in order to examine the impact of the energy sector alone, changes in emissions in other sectors by 2050 have been omitted, although we are fully aware that these emissions affect the physical and chemical changes of pollutants in the atmosphere. Meteorological conditions were calculated based on the data of the European Centre for Medium-Range Weather Forecasts for 2008 [59]. These data were provided every 3 h with a horizontal resolution of 0.25° at 54 vertical levels. The boundary condition was estimated from a simulation run over Europe with emissions for 2018. The domain for this simulation consisted of 50 × 72 cells starting from 40.0° latitude and −3.0° longitude with a horizontal resolution of 0.5°. The vertical levels were similar to those in the simulation over Poland.
Particulate matter is distributed among 10 different size sections (between 0.01 to 10 μm) with the following threshold limits (in μm) of diameter: 0.01–0.02–0.0398–0.0794–0.1585–0.3162–0.6310–1.2589–2.5119–5.0119–10. The following particulate matter components were included in the model: black carbon, aromatics, mineral dust, primary and secondary organic aerosols, SO4, NO3, and NH4 ions and hydrochloric acid aerosols.

2.3. Estimation of Health Impact and External Cost

In this study, health impact was estimated based on the concentration–response functions (CRFs), population statistics (population density and pyramids, life expectancy), and pollutant concentrations. A similar approach is used by the World Health Organization and the European Environment Agency, among others [7,17,60].
The health impact was calculated using Equation (1).
H I = j C j P j C R F
where HI is the health impact of a given type (cases); ∆C is the change in annual average concentration of SO2, NOx, and PM10 at ground level due to emissions from the energy sector calculated using the Polyphemus air quality system (µg/m3); P is population exposed (number), CRF is the concentration–response function for a given impact type (<cases, days, years>/µg/m3); and j is the index of the cell in the domain (7504 cells). We assumed a linear CRF without a threshold.
Average annual concentration (C) of pollutants is calculated using the Polyphemus air quality system. Data on the Polish population in the modelled years, by gender and age group, were obtained from [61,62]. These sources give population distributions at a spatial resolution of 0.00833°. According to these estimates, Poland’s population was 37.921 million in 2018 and is projected to fall to 36.944 million in 2030, 35.282 million in 2040, and 33.294 in 2050. The age structure of the Polish population will also change. In Poland, as in other developed countries, a significant ageing of the society will be observed. The share of children under 16 in the total population will decrease from 17% in 2018 to 14.6% in 2050. During this period, the proportion of people aged over 65 will change from 17.5% to 31.1%.
The external costs are calculated based on the literature review and gross domestic product (GDP) per capita in Poland for all modelled years. In 2018, this was EUR 12,420 PPP (gross domestic product based on purchasing power parity) [16,17,33,63,64,65]. For the future unit damage costs, the GDP growth paths published by the Ministry of Finance were adopted. An average annual growth rate of 1.4–4.7% was assumed over the 30-year period [66]. Cumulative GDP growth to 2050 will be 115%, compared to 2018. Services and industry will be mainly responsible for creating added value.
Based on the data and sources presented in Table 1, the health impact was calculated for two cases. In the first case (“low estimation”), a low value of CRFs was considered, and in the second one (“high estimation”), a high value of CRFs was considered (Table 3). Table 3 also shows the unit damage costs for health effects in Poland in 2018.
The CRF coefficients presented in Table 3 make it possible to indicate the upper and lower values for the number of cases of human health damage. Some slopes of CRFs reported in the literature differ significantly. For example, the lowest and highest values of CRF for infant mortality differ by nearly 6000-fold.

3. Results and Discussion

3.1. Emission Results

In Poland, 15.51 kt of TSP, 168.22 kt of NOx, and 261.21 kt o of SO2 were emitted in 2018 (Table 4). The majority of NOx and SO2 emissions originated from power plants (PP). Due to the application of BAT emission standards, as well as reduced fuel consumption at selected plants, emissions in 2030 compared to 2018 will be reduced by 63% for SO2, 53% for TSP, and 32% for NOx in both scenarios. In 2050, when all planned nuclear power plants are operational, the differences in emissions between the two scenarios becomes more evident. In 2050, under the non-nuclear scenario, 10.97 kt of SO2, 15.73 kt of NOx, and 9.48 kt of TSP will be emitted, whereas under the nuclear scenario, 6.36 kt of SO2 and 9.12 kt of NOx will be emitted (Table 5 and Table 6).
Power plants emit relatively low amounts of particulate matter compared to combined heat and power plants (CHP) and district heating plants (DHP), as these units are equipped with the best dust abatement equipment. Between 2030 and 2045, however, power plants will be the main emitter of SO2 and NOx (Table 5 and Table 6), although the emission will fall faster than in the case of cogeneration plants. Emissions of SO2 from power plants are approximately 60 kt in 2030 and 15 kt in 2045 in both scenarios. In CHP plants, a reduction from 24 kt in 2030 to around 10 kt in 2045 is observed. In 2050, the SO2 will be emitted from biomass burning in DHP and CHP.
Between 2030 and 2050, a sharp reduction in NOx emissions from power plants is observed (Table 6). In the case of DHP, the lowest emissions are observed in 2040. In 2050, biomass will be the main source of NOx emissions from the Polish power sector. An increase of NOx emissions from the power sector is not observed, despite the growth in consumption of this transient fuel.
A significant reduction in TSP emissions from power plants is observed during the modelled period (Table 7). TSP emissions from CHP will grow rapidly due to increasing biomass consumption. In 2045, biomass will become the main source of TSP emissions from the power sector. Therefore, a further tightening of emission limits for this fuel is to be expected, particularly as CHP plants are located in large cities, so the particulate matter emitted from them would affect a relatively large number of people. In order to model the atmospheric dispersion of particulate matter, emissions of PM2.5 and PMcoarse (i.e., PM10–PM2.5) had to be provided to Polyphemus. Emissions of these particles were calculated individually for each stack based on TSP emissions, fuel, boiler, emission control device, and reported values for 2018.

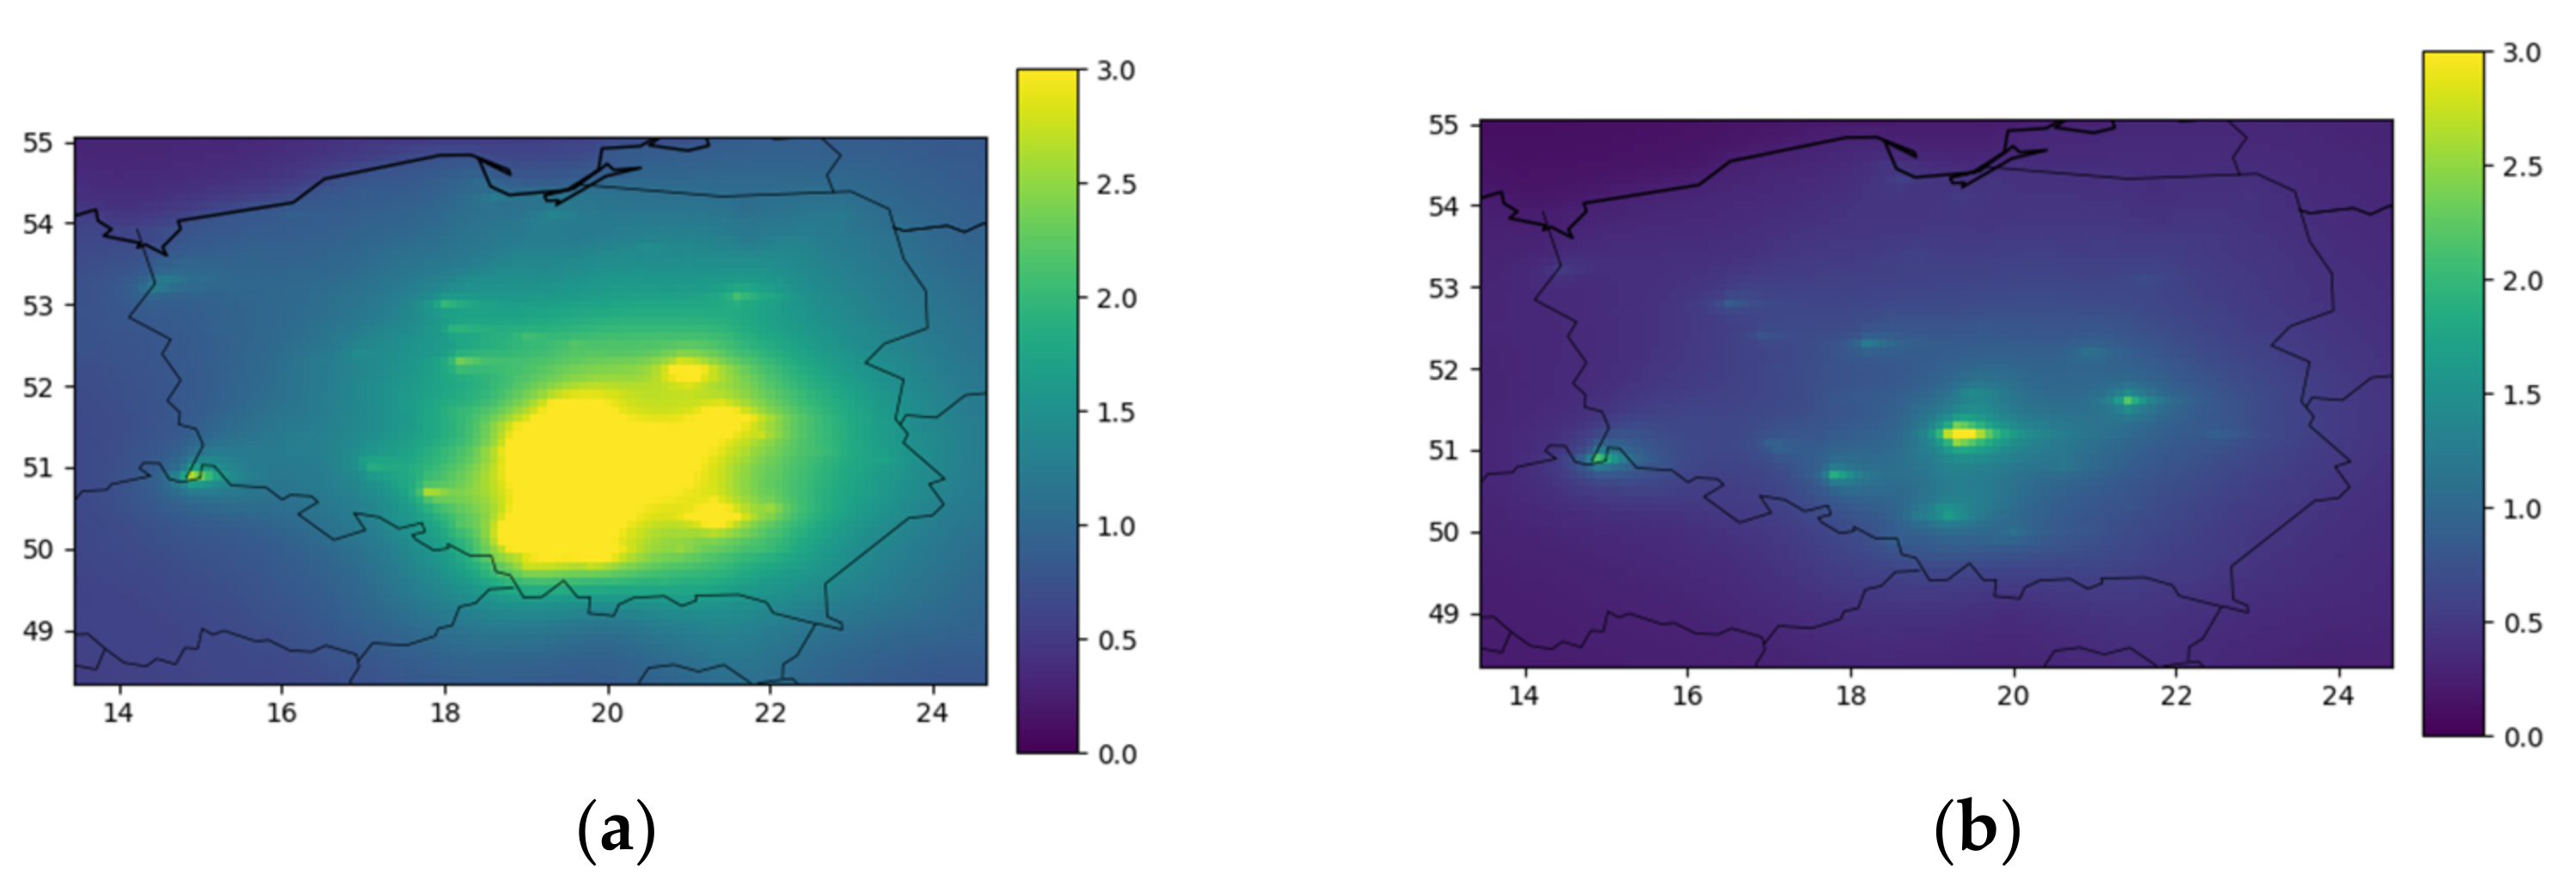
3.2. Concentration of Air Pollutants Results

Simulations of the dispersion of pollutants emitted from the power sector using the Polyphemus air quality system make it possible to obtain results of the concentration and depositions of (i) NOx as the sum of NO2, NO, and N2O, (ii) SO2, and (iii) PM2.5 as the sum of different types (black carbon, mineral dust, and others) and particle sizes of particulate matter. An example of an impact of the emissions from the energy sector on SO2, NOx, and PM10 concentrations is shown in Figure 1, Figure 2 and Figure 3. The highest SO2 and PM10 concentrations related to the energy sector are observed in central and southern Poland, where the biggest brown-coal-fired power plant and many hard-coal-fired power plants are located. The impact of emissions from the energy sector on concentration is significantly lower in 2030 compared to 2018 (Figure 1, Figure 2 and Figure 3). SO2 emissions from the power sector over this period are reduced from 261.21 kt in 2018 to 96.43 kt in 2030 (Table 4 and Table 5). NOx emissions are reduced from 168.33 kt in 2018 to 133.36 kt in 2030 (Table 4 and Table 6). TSP emissions are reduced in this period from 15.51 kt to 7.16 kt (Table 4 and Table 7). Although Poland has serious problems with exceedance of the air quality threshold values for PM10, this can only marginally be attributed to emissions from the power sector [67]. PM10 emissions from the energy sector represent about 6.5% of total emissions. In addition, unlike the residential sector, they are released at high altitudes (stacks above 70 m), which facilitates dilution of pollutants.
The IPA methodology requires annual average pollutant concentrations as input data. Therefore, the model was validated against the 2018 annual mean measurements. Validation of the model against observations conducted over Poland is presented in Table 8. The model was validated against the observations of background rural stations. The results were not compared with the observations from traffic, industrial, urban, and suburban stations. These stations are highly influenced by local sources (cars, households, local factories). The simulation was carried out at a resolution that does not allow for accurate modelling of pollution inside cities.
The results of the simulations are overestimated for SO2 and PM2.5 and underestimated for PM10 and NO2 (Table 8). Generally, better results are obtained for particulate matter (PM10 and PM2.5) and worse results are obtained for NO2. To improve the results, the emissions from other sectors (especially transport) should be provided in better resolution. In this paper, the EMEP data with a resolution of 50 × 50 km were used for all sectors apart from the power sector.

3.3. Health Impact and External Costs Results

Health impacts and external costs were calculated using Equation (1) based on the results of pollutant concentration modelling, information on the number of people exposed to air pollution, concentration–response functions (CRFs), and the unit costs of health impacts presented in Table 3. According to the results, 280 cases of lung cancer, from 6 to 189 new cases of chronic bronchitis, 710 cases of congestive heart failure, and 7 cases of acute mortality occurred in Poland in 2018 due to PM10 emissions from the energy sector. These negative cases will be reduced in 2050 to 21 and 13 cases of lung cancer; 4–138 and 3–89 new cases of chronic bronchitis; and 52 and 38 cases of congestive heart failure under the non-nuclear and nuclear scenarios, respectively. The number of restricted activity days was estimated to be between 99 and 150 thousand in 2018. Years of life lost (YLL) attributable to PM10 emissions equals 920–2590.
The number of acute mortalities attributable to SO2 emissions from the power sector was estimated at 636 cases in 2018 and 230 in 2030. In 2040, these numbers were 100 for the NN scenario and 102 for the YN scenario, and in 2050 the numbers were 27 and 16, respectively. An equally pronounced decrease was observed in the number of years of life lost due to emissions of NOx. The estimated number of YLL was 1200 in 2018, whereas in 2050 it was 109 for the nuclear scenario and 68 for the non-nuclear scenario. The total number of hospital admissions for respiratory diseases related to PM10, SO2, and NOx emissions from the power sector in 2018 was estimated in the range from 228 to 6490. Likewise, in 2050, a significant reduction in their number was observed; total admissions ranged from 36 to 305 under the non-nuclear scenario and from 23 to 187 under the nuclear scenario.
The greatest differences in external costs occurred for infant mortality. For the lower estimate, the cost is only EUR 0.18 million, and for the high estimate, it is EUR 1060 million (Table 9). The high value of external costs in the case of the high estimate is particularly visible in the period from 2040 to 2050, in which there is a significant rise in infant mortality due to rising PM emissions and thus concentrations (Table 7 and Figure 2). Such a high value of the CRF slope coefficient makes the result very sensitive to changes in PM concentrations, and it may be overestimated. When lower estimates of CRFs are used, the external costs decrease constantly from 2018 to 2050. In this case, external costs are mainly generated by chronic mortality attributable to SO2 emissions. The external costs of SO2 in 2018 were estimated in the range of EUR 776.4–1910.75 million. These values accounted for 0.1–0.4% of Polish GDP in that year. Relatively low external costs are attributable to NO2 emissions.
The values presented above are lower than those presented in the European Commission’s (EC) report on the external costs [15]. Disregarding CO2-related external costs, which were not calculated in this paper, external costs related to the power sector amounted to EUR 12 billion for Poland in 2018 in the EC report. For the same year, the external cost estimates of this study are in the range of EUR 0.8 to EUR 1.9 billion (Figure 4).
Considering that 152 TWh of electricity and 109 TWh of district heat were produced in Poland in 2018, the associated external costs are in the range of 2.9–7.3 EUR/MWh. This value corresponds to the results presented for the G20 countries [70]. External costs of 3 USD/MWh and 1.5 USD/MWh were reported in the US [11]. A relatively old study estimated the external costs of fossil fuel-based power plants at 11.795 EUR/MWh [37]. Our values are higher than the results presented for Iran [16].
The maximum annual value of avoided external costs occurs in 2040 and amounts to EUR 1286 and EUR 1507 million in the case of the non-nuclear and nuclear scenarios, respectively (Figure 5). With regard to the reduction of SO2, NOx, and PM10 emissions in the Polish power sector, the avoided external costs are estimated at EUR 15.5–30.6 billion under the non-nuclear scenario and at EUR 15.8–33.4 billion under the nuclear scenario (Table 10). This is about 1/3 of the cost needed to transform the Polish energy sector towards climate neutrality [4,5,6].

4. Conclusions

The impact pathway approach (IPA), developed as part of the ExternE projects, was used in this study to estimate the external costs attributable to NOx, PM, and SO2 emissions from the Polish energy sector. Emissions reported in 2018 for 580 stacks belonging to power plants (PP), combined heat and power plants (CHP), district heating plants (DHP), and industrial combined heat and power plants (CHPI) were used as input. Future emissions for 2030–2050 were calculated for two energy scenarios: non-nuclear and nuclear, described in detail in the article [44]. External costs were calculated based on the results of pollutant concentration modelling, information on the number of people exposed to air pollution, concentration–response functions, and the unit costs assigned to given health impacts.
The results show that the external costs in Poland related to emissions from the energy sector in 2018 were in the range of EUR 0.78–1.91 billion (Table 9). These results are significantly lower compared to the EUR 12 billion presented in the last European Commission report [15]. The EC report does not use the impact pathway approach (IPA) but instead uses a direct external cost factor at the technology level. In general, the estimated external cost per unit of energy produced in the range of 2.9–7.3 EUR/MWh is in agreement with the results of other studies [15,37,38,39,40,41,42].
The external cost in Poland decreases sharply until 2040 and may then increase due to the increase in PM10 emissions (Figure 4). Higher PM10 emissions after 2040 can be explained by the increase in the use of biomass in power generation (Table 7). It is therefore important to adequately set the future emission standards for biomass-fired units to minimize their impact.
The avoided external costs between 2018 and 2050 are in the range of EUR 15.5–30.6 and 15.8–33.4 billion (EUR 2018) for the non-nuclear and nuclear scenarios, respectively (Table 10). The first conclusion from these results is that the development of nuclear energy will not have a significant impact on external costs. The results from the non-nuclear and nuclear scenarios are relatively close. The second most important conclusion of this paper is that the external costs avoided are lower than the costs of transforming the Polish energy sector towards carbon neutrality by 2050. The avoided external costs constitute only about 15–30% of the estimated investment cost of decarbonizing the Polish power sector.
It should be noted that this paper did not take into account the costs of climate change related to CO2 emissions. The climate costs borne by society in Poland may be much higher than the costs of the energy transition. However, the effects related to CO2 are difficult to estimate as they appear globally and depend on all sources (total emissions). The separation of one sector in one relatively small country (responsible for about 1% of global emissions) is subject to a large error.
When estimating the external costs related to the health impacts of air pollution, one should be aware of possible inaccuracies appearing at all steps of the impact pathway approach: emission estimation, dispersion modelling, and slopes of concentration–response functions [71]. Therefore, it is difficult to estimate the uncertainties in each step. Considering the discussion and results of estimating uncertainty of pollution damage costs using the uniform world model (UMW), the cumulative external costs for the non-nuclear scenario and nuclear scenario can be in the range of (68% CI) 2.1–51.3 and 1.9–47.2 billion EUR 2018, respectively.

Author Contributions

Conceptualization, J.Z.; methodology, J.Z. and A.W.; software, J.Z.; validation, J.Z.; formal analysis, J.Z., M.R., T.O. and M.P.; investigation, J.Z.; resources, J.Z., A.W. and M.P.; data curation, J.Z. and A.W.; writing—original draft preparation, J.Z. and A.W.; writing—review and editing, J.Z., A.W. and M.R.; visualization, J.Z.; supervision, W.S., T.O. and A.W.; project administration, J.Z.; funding acquisition, J.Z. All authors have read and agreed to the published version of the manuscript.

Funding

This work received financial support from the funding of AGH University of Science and Technology, Faculty of Energy and Fuels (grant number 16.16.210.476). Part of the computational work was conducted using the resources of the Cyfronet AGH and PLGrid Infrastructure.

Institutional Review Board Statement

Not applicable.

Informed Consent Statement

Not applicable.

Conflicts of Interest

The authors declare no conflict of interest.

References

  1. IPPC. Climate Change 2021: The Physical Science Basis; Contribution of Working Group I to the Sixth Assessment Report of the Intergovernmental Panel on Climate Change; Cambridge University Press: Cambridge, UK, 2021. [Google Scholar]
  2. EU. Update of the NDC of the European Union and Its Member States. Submission by Germany and The European Commission on Behalf of The European Union and Its Member States; EU: Brussels, Belgium, 2020. [Google Scholar]
  3. Ministry of State Assets National Plan for Energy and Climate for 2021–2030; Warszawa. 2019; (In Polish). Available online: https://www.gov.pl/web/klimat/krajowy-plan-na-rzecz-energii-i-klimatu (accessed on 12 September 2021).
  4. Ministry of Climate and Environment Polish Energy Policy until 2040. 2021; (In Polish). Available online: https://www.dziennikustaw.gov.pl/MP/2021/264 (accessed on 8 August 2021).
  5. Ecke, J.; Steinert, T.; Bukowski, M.; Śniegocki, A. Polish Energy Sector 2050. 4 Scenarios; Forum Energii: Warszawa, Poland, 2020; Available online: https://forum-energii.eu/en/analizy/polska-energetyka-2050-4-scenariusze(In Polish). (accessed on 10 August 2021). (In Polish)
  6. Engel, H.; Purta, M.; Speelman, E.; Szarek, G.; Pluijm, P. Carbon-Neutral Poland 2050; McKinsey & Company: Warszawa, Poland, 2020. [Google Scholar]
  7. WHO. Health Risk Assessment of Air Pollution. General Principles; WHO Regional Office for Europe: Copenhagen, Denmark, 2016; ISBN 978-92-890-5131-6. [Google Scholar]
  8. Burnett, R.T.; Pope, C.A.; Ezzati, M.; Olives, C.; Lim, S.S.; Mehta, S.; Shin, H.H.; Singh, G.; Hubbell, B.; Brauer, M.; et al. An Integrated Risk Function for Estimating the Global Burden of Disease. Attributable to Ambient Fine Particulate Matter Exposure. Environ. Health Perspect. 2014, 122, 397–403. [Google Scholar] [CrossRef]
  9. Goossens, J.; Jonckheere, A.C.; Dupont, L.J.; Bullens, D.M.A. Air Pollution and the Airways: Lessons from a Century of Human Urbanization. Atmosphere 2021, 12, 898. [Google Scholar] [CrossRef]
  10. EEA. Air Quality in Europe—2020 Report; European Environment Agency: Luxembourg, 2020. [Google Scholar]
  11. Rabl, A.; Spadaro, J.V. Public Health Impact of Air Pollution and Implications for the Energy System. Annu. Rev. Energy Environ. 2000, 25, 601–627. [Google Scholar] [CrossRef]
  12. Bickel, P.; Friedrich, R. ExternE. Externalities of Energy Methodology 2005 Update; European Commission, Directorate-General for Research Sustainable Energy Systems: Stuttgart, Germany, 2005. [Google Scholar]
  13. University of Stuttgart HEIMTSA Project. Health and Environment Integrated Methodology and Toolbox for Scenario Development. D 5.3.1/2 Methods and Results of the HEIMTSA/INTARESE Common Case Study; University of Stuttgart: Stuttgart, Germany, 2010. [Google Scholar]
  14. World Health Organization. Health Risks of Air Pollution in Europe—HRAPIE Project; Recommendations for Concentration–Response Functions for Cost–Benefit Analysis of Particulate Matter, Ozone and Nitrogen Dioxide; World Health Organization: Geneva, Switzerland, 2013. [Google Scholar]
  15. Directorate-General for Environment Final Report. External Costs. Energy Costs, Taxes and the Impact of Government Interventions on Investments; European Commission: Brussels, Belgium, 2020. [Google Scholar]
  16. Jorli, M.; Van Passel, S.; Sadeghi, H.; Nasseri, A.; Agheli, L. Estimating Human Health Impacts and Costs Due to Iranian Fossil Fuel Power Plant Emissions through the Impact Pathway Approach. Energies 2017, 10, 2136. [Google Scholar] [CrossRef] [Green Version]
  17. Ulas, I.; Brandt, J.; Geels, C.; Hansen, K.M.; Christensen, J.H.; Andersen, M.S.; Solazzo, E.; Kioutsioukis, I.; Alyuz, U.; Balzarini, A.; et al. Assessment and Economic Valuation of Air Pollution Impacts on Human Health over Europe and the United States as Calculated by a Multi-Model Ensemble in the Framework of AQMEII3. Atmos. Chem. Phys. 2018, 18, 5967–5989. [Google Scholar]
  18. Torfs, R.; Hurley, F.; Miller, B.; Rabl, A. A Set of Concentration-Response Functions; NEEDS Project, FP6, Rs1b_D3.7—Project No: 502687; University of Stuttgart: Stuttgart, Germany, 2007. [Google Scholar]
  19. Preiss, P.; Roos, J.; Friedrich, R. Assessment of Health Impacts of Coal Fired Power Stations in Germany; Universität Stuttgart: Stuttgart, Germany, 2013. [Google Scholar]
  20. Zyśk, J.; Wyrwa, A.; Suwała, W.; Pluta, M.; Olkuski, T.; Raczyński, M. The Impact of Decarbonization Scenarios on Air Quality and Human Health in Poland—Analysis of Scenarios up to 2050. Atmosphere 2020, 11, 1222. [Google Scholar] [CrossRef]
  21. Woodruff, T.J.; Grillo, J.; Schoendorf, K.C. The Relationship between Selected Causes of Postneonatal Infant Mortality and Particulate Air Pollution in the United States. Environ. Health Perspect. 1997, 105, 608–612. [Google Scholar] [CrossRef]
  22. Pope, C.A.; Burnett, R.T.; Thun, M.J.; Calle, E.E.; Krewski, D.; Ito, K.; Thurston, G.D. Lung Cancer, Cardiopulmonary Mortality and Long-Term Exposure to Fine Particulate Air Pollution. JAMA 2002, 287, 1132–1141. [Google Scholar] [CrossRef] [Green Version]
  23. Pope, C.A.; Thun, M.J.; Namboodiri, M.M.; Dockery, D.W.; Ewans, J.S.; Speizer, F.E.; Heath, C.W., Jr. Particulate Air Pollution as a Predictor of Mortality in a Prospective Study of US Adults. Am. J. Respir. Crit. Care Med. 1995, 151, 669–674. [Google Scholar] [CrossRef]
  24. Abbey, D.E.; Lebowitz, M.D.; Mills, P.K.; Petersen, F.F.; Beeson, W.L.; Burchette, R.J. Long-Term Ambient Concentrations of Particulates and Oxidants and Development of Chronic Disease in a Cohort of Non-Smoking California Residents. Inhal. Toxicol. 1995, 7, 19–34. [Google Scholar] [CrossRef]
  25. Schwartz, J.; Morris, R. Air Pollution and Hospital Admissions for Cardiovascular Disease in Detroit. Am. J. Epidemiol. 1995, 142, 23–35. [Google Scholar] [CrossRef] [PubMed]
  26. Dab, W.; Medina, S.; Quénel, P.; le Moullec, Y.; le Tertre, A.; Thelot, B.; Monteil, C.; Lameloise, P.; Pirard, P.; Momas, I.; et al. Short Term Respiratory Health Effects of Ambient Air Pollution: Results of the APHEA Project in Paris. J. Epidemiol. Community Health 1996, 50, 42–46. [Google Scholar] [CrossRef] [PubMed] [Green Version]
  27. Wordley, I.; Walters, S.; Ayres, J.G. Short Term Variations in Hospital Admissions and Mortality and Particulate Air Pollution. Occup. Environ. Med. 1997, 54, 108–116. [Google Scholar] [CrossRef] [PubMed] [Green Version]
  28. Roemer, W.; Hoek, G.; Brunekreef, B. Effect of Ambient Winter Air Pollution on Respiratory Health of Children with Chronic Respiratory Symptoms. Am. Rev. Respir. Dis. 1993, 147, 118–124. [Google Scholar] [CrossRef]
  29. Dusseldorp, A.; Kruize, H.; Brunekreef, B.; Hofschreuder, P.; de Meer, G.; van Oudvorst, A.B. Associations of PM10 and Airborne Iron with Respiratory Health of Adults Living Near a Steel Factory. Am. J. Respir. Crit. Care Med. 1995, 152, 1932–1939. [Google Scholar] [CrossRef] [PubMed]
  30. Pope, C.A.; Dockery, D.W. Acute Health Effects of PM10 Pollution on Symptomatic and Asymptomatic Children. Am. Rev. Respir. Dis. 1992, 145, 1123–1126. [Google Scholar] [CrossRef]
  31. Anderson, H.R.; Ponce de Leon, A.; Bland, J.M.; Bower, J.S.; Strachan, D.P. Air Pollution and Daily Mortality in London: 1987–92. BMJ 1996, 312, 665–669. [Google Scholar] [CrossRef] [Green Version]
  32. Touloumi, G.; Samoli, E.; Katsuyanni, K. Daily Mortality and “Winter Type” Air Pollution in Athens, Greece—A Time Series Analysis within the APHEA Project. J. Epidemiol. Community Health 1996, 50 (Suppl. 1), S47–S51. [Google Scholar] [CrossRef] [Green Version]
  33. Dettner, F.; Blohm, M. External Cost of Air Pollution from Energy Generation in Morocco. Renew. Sustain. Energy Transit. 2021, 1, 100002. [Google Scholar] [CrossRef]
  34. Xing, Y.-F.; Xu, Y.-H.; Shi, M.-H.; Lian, Y.-X. The Impact of PM2.5 on the Human Respiratory System. J. Thorac. Dis. 2016, 8, 69–74. [Google Scholar] [CrossRef]
  35. Friedrich, R.; Voss, A. External Costs of Electricity Generation. Energy Policy 1993, 21, 114–122. [Google Scholar] [CrossRef] [Green Version]
  36. Wang, X.; Wamg, L.; Chen, J.; Zhang, S.; Tarolli, P. Assessment of the External Costs of Life Cycle of Coal: The Case Study of Southwestern China. Energies 2020, 13, 4002. [Google Scholar] [CrossRef]
  37. Rafaj, P.; Kypreos, S. Internalisation of External Cost in the Power Generation Sector: Analysis with Global Multi-Regional MARKAL Model. Energy Policy 2007, 35, 828–843. [Google Scholar] [CrossRef]
  38. NEEDS Project New Energy Externalities Developments for Sustainability (NEEDS). Available online: https://www.psi.ch/en/ta/projects/new-energy-externalities-developments-for-sustainability-needs (accessed on 20 August 2021).
  39. Samadi, S. The Social Costs of Electricity Generation—Categorising Different Types of Costs and Evaluating Their Respective Relevance. Energies 2017, 10, 356. [Google Scholar] [CrossRef] [Green Version]
  40. ExternE Project; University of Stuttgart ExternE—External Costs of Energy. Available online: http://www.externe.info/externe_d7/ (accessed on 28 June 2021).
  41. Rabl, A.; Spadaro, J.V. External Costs of Energy: How Much Is Clean Energy Worth? J. Sol. Energy Eng. 2016, 138, 040801. [Google Scholar] [CrossRef]
  42. Burtraw, D.; Krupnick, A.J.; Sampson, G. The True Cost of Electric Power: An Inventory of Methodologies to Support Future Decision-Making in Comparing the Cost and Competitiveness of Electricity Generation Technologies; International Nuclear Information System (INIS): Paris, France, 2012. [Google Scholar]
  43. Cox, L.A. Effects of Exposure Estimation Errors on Estimated Exposure-Response Relations for PM2.5. Environ. Res. 2018, 164, 636–646. [Google Scholar] [CrossRef]
  44. Wyrwa, A.; Suwała, W.; Pluta, M.; Raczyński, M.; Zyśk, J.; Tokarski, S. A New Approach for Coupling the Short- and Long-Term Planning Models to Design a Pathway to Carbon Neutrality in a Coal-Based Power System. Energy 2021, 122438. [Google Scholar] [CrossRef]
  45. Jestin, L.; Wyrwa, A.; Stężały, A.; Zyśk, J.; Pluta, M.; Śliż, B. Environmental Challenges of the Polish Energy Sector. Pol. J. Environ. Stud. 2010, 19, 331–335. [Google Scholar]
  46. Commission Implementing Decision (EU) 2017/1442 of 31 July 2017 Establishing Best Available Techniques (BAT) Conclusions, under Directive 2010/75/EU of the European Parliament and of the Council, for Large Combustion Plants (Notified under Document C(2017) 5225) 2017. Available online: https://eur-lex.europa.eu/legal-content/EN/TXT/?uri=CELEX%3A32017D1442 (accessed on 8 June 2021).
  47. Pulles, T.; Appelman, W. Use of a PRTR Emission Inventory in Assessing the Benefits of Abatement Policies in Industry; TNO Built Environment and Geosciences, Business unit Environment, Health and Safety: Utrecht, The Netherlands, 2008. [Google Scholar]
  48. The Engineering ToolBox. Combustion Air and Flue Gas for Common Fuels—Coke, Oil, Wood, Natural Gas and More. Available online: https://www.engineeringtoolbox.com/fuels-air-flue-gas-d_170.html (accessed on 20 June 2021).
  49. Graham, D.; Harnevie, H.; van Beek, R.; Blank, F. Validated Methods for Flue Gas Flow Rate Calculation with Reference to EN 12952-15; Kema Nederland: Arnhem, The Netherlands, 2021; p. 81. [Google Scholar]
  50. Zyśk, J.; Wyrwa, A.; Pluta, M. Emissions of Mercury from the Power Sector in Poland. Atmos. Environ. 2011, 45, 605–610. [Google Scholar] [CrossRef]
  51. Mallet, V.; Quello, D.; Sportisse, B.; Ahmed de Biasi, M.; Debry, E.; Korsakissok, I.; Wu, L.; Roustan, Y.; Sartelet, K.; Tombette, M.; et al. Technical Note: The Air Quality Modeling System Polyphemus. Atmos. Chem. Phys. 2007, 7, 5479–5487. [Google Scholar] [CrossRef] [Green Version]
  52. Wyrwa, A. An Optimization Platform for Poland’s Power Sector Considering Air Pollution and Health Effects. Environ. Model. Softw. 2015, 74, 227–237. [Google Scholar] [CrossRef]
  53. Lecœur, E.; Seigneur, C. Dynamic Evaluation of a Multi-Year Model Simulation of Particulate Matter Concentrations over Europe. Atmos. Chem. Phys. 2013, 13, 4319–4337. [Google Scholar] [CrossRef] [Green Version]
  54. Zyśk, J.; Roustan, Y.; Wyrwa, A. Modelling of the Atmospheric Dispersion of Mercury Emitted from the Power Sector in Poland. Atmos. Environ. 2015, 112, 246–256. [Google Scholar] [CrossRef] [Green Version]
  55. Rafaj, P.; Cofala, J.; Kuenen, J.; Wyrwa, A.; Zyśk, J. Benefits of European Climate Policies for Mercury Air Pollution. Atmosphere 2014, 5, 45–59. [Google Scholar] [CrossRef] [Green Version]
  56. Cuvelier, C.; Muntean, M.; Thunis, P.; Kamiński, J.; Wyrwa, A.; Łobocki, L.; Strużewska, J.; Zdunek, M.; Kamiński, K.; Kamiński, W.; et al. Air Quality Modelling in the Greater-Kraków Area; OPOCE: Luxembourg, 2006. [Google Scholar]
  57. EMEP. The European Monitoring and Evaluation Programme. Available online: http://www.emep.int/ (accessed on 18 March 2020).
  58. GLCC/USGS. Global Land Cover Characteristics. Available online: http://edc2.usgs.gov/glcc/glcc.php (accessed on 14 March 2012).
  59. ECMWF. European Centre for Medium-Range Weather Forecasts. Available online: www.ecmwf.int (accessed on 9 December 2008).
  60. European Environment Agency (EEA). Assessing the Risks to Health from Air Pollution. Available online: https://www.eea.europa.eu/publications/assessing-the-risks-to-health (accessed on 15 June 2021).
  61. SEDAC. The Socioeconomic Data and Applications Center. The Gridded Population of the World (GPW). Available online: https://sedac.ciesin.columbia.edu/data/collection/gpw-v4 (accessed on 15 June 2021).
  62. Population Pyramids of the World from 1950 to 2100. Available online: https://www.populationpyramid.net (accessed on 21 July 2021).
  63. Navrud, S.; Ready, R. Environmental Value Transfer: Issues and Methods; Springer: Dordrecht, The Netherlands, 2007; ISBN 978-1-4020-4081-8. [Google Scholar]
  64. Alberini, A.; Hunt, A.; Markandya, A. Willingness to Pay to Reduce Mortality Risks: Evidence from a Three-Country Contingent Valuation Study. Environ. Resour. Econ. 2006, 33, 251–264. [Google Scholar] [CrossRef] [Green Version]
  65. Amann, M. Costs, Benefits and Economic Impacts of the UE Clean Air Strategy and Their Implications on Innovation and Competitiveness. IIASA Report; International Institute for Applied Systems Analysis (IIASA): Laxenburg, Austria, 2017. [Google Scholar]
  66. Guidelines for the Use of Uniform Underlying Macroeconomic Indicators Estimating the Financial Effects of the Proposed Acts; Polish Minister of Finance: Warszawa, Poland, 2021; (In Polish). Available online: https://www.gov.pl/web/finanse/wytyczne-sytuacja-makroekonomiczna (accessed on 15 October 2021).
  67. EEA. Air Quality in Europe—2019 Report; EEA Report No 10/2019; EEA: Copenhagen, Denmark, 2019. [Google Scholar]
  68. European Environment Agency AirBase—the European Air Quality Database. Available online: https://www.eea.europa.eu/data-and-maps/data/air-pollutant-concentrations-at-station (accessed on 3 September 2021).
  69. Patryl, L.; Galeriu, D. Statistical Performances Measures—Models Comparison.; The International Atomic Energy Agency: Viena, Austria, 2011. [Google Scholar]
  70. Karkour, S.; Ichisugi, Y.; Abeynayaka, A.; Itsubo, N. External-Cost Estimation of Electricity Generation in G20 Countries: Case Study Using a Global Life-Cycle Impact-Assessment Method. Sustainability 2020, 12, 2002. [Google Scholar] [CrossRef] [Green Version]
  71. Spadaro, J.V.; Rabl, A. Estimating the Uncertainty of Damage Costs of Pollution: A Simple Transparent Method and Typical Results. Environ. Impact Assess. Rev. 2008, 28, 166–183. [Google Scholar] [CrossRef]
Figure 1. The ambient SO2 concentration at surface level resulting from the emissions of the power sector in (a) 2018 and (b) 2030, according to the non-nuclear scenario (µg/m3).
Energies 14 08263 g001
Figure 2. The ambient PM10 concentration at surface level resulting from the emissions of the power sector in (a) 2018 and (b) 2030, according to the non-nuclear scenario (µg/m3).
Energies 14 08263 g002
Figure 3. The ambient NOx (sum of NO2, NO, and N2O) concentration at surface level resulting from the emissions of the power sector in (a) 2018 and (b) 2030, according to the non-nuclear scenario (µg/m3).
Energies 14 08263 g003
Figure 4. The range of external costs associated with the power sector in Poland from 2018 to 2050 according to (a) the non-nuclear scenario, and (b) the nuclear scenario (million EUR 2018).
Energies 14 08263 g004
Figure 5. The range of avoided external costs associated with the power sector in Poland from 2018 to 2050 according to (a) the non-nuclear scenario, and (b) the nuclear scenario (million EUR 2018).
Energies 14 08263 g005
Table 1. The slopes of concentration–response functions (CRFs) associated with long-term exposure to pollutants. Based on [12,13,16,17,18,19,20,21,22,23,24,25,26,27,28,29,30,31,32,33,34,35].
Type of Health ImpactCRF (Per Person Per µg/m³ Annually)UnitsReferences
PM2.5
Chronic mortality6.51 × 10−4years[18,19]
3.42 × 10⁻⁴ [12,20]
Restricted activity days4.87 × 10−2days[18,19]
4.20 × 10⁻² [12,20]
0.92 × 10⁻² (adults aged 18–64) for Europe [13]
0.57 × 10⁻² (adults aged 18–64) for Poland [13]
Chronic bronchitis4.90 × 10−5cases[12,20]
14 × 10−5 [13]
Infant mortality8.7 × 10−6 (children under 12 months)cases[13]
Cardiac hospital admissions6.5 × 10−6cases[13]
Respiratory hospital admissions8.6 × 10−6cases[13]
Lower respiratory symptoms0.29 (children aged 5–14)days[13]
0.21 (adults with chronic respiratory symptoms-30% of the population) [13]
PM10
Restricted activity days2.36379 × 10−2 (working adults aged 15–64)days[16]
2.67786 × 10⁻³ (nonworking adults aged 15–64) [16]
9.02 × 10⁻² (working adults aged 15–64) [12]
Infant mortality6.84 × 10−8cases[18,19]
1.7 × 10⁻⁷ (children under 12 months)years[16]
6.68 × 10⁻⁶cases[17,21]
4.0 × 10⁻⁴cases[12]
5.8 × 10⁻⁶cases[13]
Acute mortality2.88 × 10−6years[16]
3.0 × 10⁻⁶ [12]
Chronic mortality4.0 × 10−4years[12,16]
1.138 × 10⁻³ (adults aged over 30)years[17,22,23]
Chronic bronchitis1.86 × 10−5cases[18,19]
1.81944 × 10⁻⁵ (adults aged 27+) [16]
8.2 × 10⁻⁵ [17,24]
2.65 × 10⁻⁶ [17,24]
8.6 × 10⁻⁵ (adults aged 18+) [13]
7.7 × 10⁻⁵ [13]
Lung cancer1.26 × 10−5cases[17,22]
Congestive heart failure3.09 × 10−5cases[17,25]
Respiratory hospital admissions7.03 × 10−6cases[12,18,19]
6.82 × 10⁻⁶ [16]
3.46 × 10⁻⁶ [17,26]
5.6 × 10⁻⁶ [13]
Cardiac hospital admissions4.34 × 10−6cases[18,19]
4.2 × 10⁻⁶ [16]
Cerebrovascular hospital admissions8.42 × 10−6cases[17,27]
4.3 × 10⁻⁶ [13]
Medication use/bronchodilator use4.03 × 10−4 (children)cases[18,19]
3.27 × 10⁻³ (adults) [18,19]
3.663× 10⁻⁴ (children aged 5–14) [16]
3.15 × 10⁻³ (adults aged 20+) [16]
1.29 × 10⁻¹ (children with asthma, 7.6% aged under 16) [17,28]
2.72 × 10⁻¹ (adults with asthma, 5.9% aged over 15) [17,18,19]
1.8 × 10⁻² (children aged 5–14 with asthma, 15% in Northern and Eastern Europe and 25% in Western Europe) [12]
9.12 × 10⁻² (adults with asthma, 4.5% aged over 20) [12]
Lower respiratory symptoms2.08 × 10−2 (children)days[18,19]
3.24 × 10⁻² (adults) [18,19]
2.057 × 10⁻² (children aged 5–14) [16]
3.076 × 10⁻² (adults) [16]
0.13 (adults with chronic respiratory symptoms-30% of the population) [12,13]
0.186 (children aged 5–14) [12,13]
1.72 × 10⁻¹ (children with asthma, 7.6% aged under 16) [17,28]
1.01 × 10⁻¹ (adults with asthma, 5.9% aged over 15) [17,29]
Cough4.46 × 10−1 (children with asthma, 7.6% aged under 16)days[17,30]
2.8 × 10⁻¹ (adults with asthma, 5.9% aged over 15) [17,29]
Medical consultations for asthma1.18 × 10−4 (children aged 0–14)cases[12]
0.51 × 10⁻⁴ (adults aged 15–64)
0.95 × 10⁻⁴ (adults aged 65+)
Medical consultations for upper respiratory diseases4.0 × 10−4 (children aged 0–14)cases[12]
3.2 × 10⁻⁴ (adults aged 15–64)
4.7 × 10⁻⁴ (adults aged 65+)
Acute respiratory symptoms0.465days[12]
SO2
Acute mortality7.85 × 10−6cases[17,31,32]
Respiratory hospital admissions2.04 × 10−6cases[17,26]
7.91 × 10⁻⁵ [33,34]
Cardiovascular hospital admissions7.94 × 10−4years[33,34]
NO2
Chronic mortality3.91 × 10−4 (adults aged 15+)years[12,33]
Respiratory hospital admissions7.03 × 10−6 (adults aged 15+)cases[33,35]
Table 2. The average annual emission limits of pollutants according to BAT conclusions (mg/Nm) [46].
FuelThermal Input [MW]TSPSO2NOx
ExistingNewExistingNewExistingNew
Hard coal (HC),
Brown coal (BC),
<100185360200270150
100–300145200150180100
>300 PC 1307515085
>300 FBC 1907515085
300–1000125
>100085
Biomass (BM)50–10015510070225150
100–3001257050180140
≥3001055035150140
Heavy fuel oil (HFO),
Light fuel oil (LFO)
<100 270200
≥100 11075
<3002010175175
≥30010510050
Natural gas (NG),
Biogas (BG)
50–600 4530
≥600 4030
Table 3. The concentration–response function (CRF) used in the two cases (low and high estimation). Costs given for Poland in 2018 in EUR 2018. Based on the data presented in Table 1.
Type of Health ImpactLow Estimation (Per Person Per µg/m³ Annually)High Estimation (Per Person Per µg/m³ Annually)UnitsUnit Cost EUR 2018
PM10
Acute mortality2.88 × 10−63.0 × 10⁻⁶case768,380
Restricted activity days (only working adults aged 15–64)2.36379 × 10−29.02× 10−2days49
Infant mortality6.84 × 10−84.0 × 10⁻⁴cases1,152,570
Chronic mortality4.0 × 10−41.138 × 10⁻³years28,842
Chronic bronchitis2.65 × 10−68.2 × 10⁻⁵cases19,347
Lung cancer1.26 × 10−5cases8065
Congestive heart failure3.09 × 10−5cases5515
Respiratory hospital admissions3.46 × 10−67.03 × 10⁻⁶cases2666
Cardiac hospital admissions4.2 × 10−64.34 × 10⁻⁶cases2666
Cerebrovascular hospital admissions4.3 × 10−68.42 × 10⁻⁶cases3377
Medication use/bronchodilator use4.03 × 10−4 (children)1.29 × 10⁻¹ (children with asthma, 7.6% aged under 16)cases8
3.27 × 10⁻³ (adults)2.72 × 10⁻¹ (adults with asthma, 5.9% aged over 15)
Lower respiratory symptoms2.057 × 10−2 (children aged 5–14)0.186 (children aged 5–14)days4
3.076 × 10⁻² (adults)0.13 (adults with chronic respiratory symptoms–30% of population)
Medical consultations for asthma1.18 × 10−4 (children aged 0–14)cases48
0.51 × 10⁻⁴ (adults aged 15–64)
0.95 × 10⁻⁴ (adults aged 65+)
Medical consultations for upper respiratory diseases4.0 × 10−4 (children aged 0–14)cases48
3.2 × 10⁻⁴ (adults aged 15–64)
4.7 × 10⁻⁴ (adults aged 65+)
SO2
Respiratory hospital admissions2.04 × 10−67.91 × 10⁻⁵cases2666
Acute mortality7.85 × 10−6cases768,380
Cardiovascular hospital admissions7.94 × 10−4cases3377
NO2
Chronic mortality3.91 × 10−4 (adults aged 15+)years28,842
Respiratory hospital admissions7.03 × 10−6cases2666
Table 4. Annual emissions of the main pollutants in Poland in 2018 from public power plants (PP), public combined heat and power plants (CHP), district heating plants (DHP), and industrial combined heat and power plants (CHPI) (kt).
Type of UnitsTSPNOXSO2
PP5.48107.47144.18
CHP3.1032.0753.81
DHP5.0714.2341.48
CHPI1.8614.5621.74
Table 5. Emission of SO2 in 2030–2050 from various fuels (BM: biomass, HC: hard coal, HFO: heavy fuel oil, BC: brown coal, LFO: light fuel oil) from public power plants (PP), public combined heat and power plants (CHP), district heating plants (DHP), and industrial combined heat and power plants (CHPI) for non-nuclear (NN) and nuclear (YN) scenarios (kt). A blank field in the table means that a respective fuel is not used in a given model year.
20302035204020452050
NNYNNNYNNNYNNNYNNNYN
PP
BM0.360.360.360.36
HC22.8722.8720.9420.9415.4515.456.166.16
HFO0.220.190.170.130.120.090.050.06
BC37.3437.3416.3216.3211.4711.478.668.76
SUM60.7860.7637.7837.7427.0327.0014.8714.98
CHP
BM2.292.393.163.164.753.816.985.239.376.10
HC21.8321.8318.9018.979.509.463.254.83
HFO0.090.090.080.080.040.040.010.02
SUM24.2124.3222.1422.2114.2913.3110.2410.089.376.10
DHP
BM0.110.110.050.060.580.131.090.191.600.26
HC8.878.875.075.07
BC0.070.070.030.03
SUM9.059.055.165.160.580.131.090.191.600.26
CHPI
BM0.370.370.030.180.010.03
HC2.012.010.630.120.390.92
LFO0.020.020.010.010.010.01
SUM2.392.390.670.310.410.96
Table 6. Emission of NOx between 2030 and 2050 from various fuels (BM: biomass, HC: hard coal, HFO: heavy fuel oil, BC: brown coal, LFO: light fuel oil, NG: natural gas, BG: biogas) from public power plants (PP), public combined heat and power plants (CHP), district heating plants (DHP), and industrial combined heat and power plants (CHPI), for non-nuclear (NN) and nuclear (YN) scenarios (kt). A blank field in the table means that a respective fuel is not used in a given model year.
2030 2035 2040 2045 2050
NNYNNNYNNNYNNNYNNNYN
PP
BM1.081.081.081.08
HC30.7930.7928.1928.1920.8020.808.298.29
HFO0.330.300.260.200.180.140.080.09
BC36.3036.3015.8615.8611.1511.158.428.52
SUM68.5068.4645.3845.3332.1232.0816.7916.90
CHP
BM6.286.578.728.7213.1710.536.985.239.376.10
NG0.070.071.600.613.122.042.651.291.460.87
HC29.3929.3925.4425.5412.7912.734.376.50
HFO0.140.140.120.120.060.060.020.03
BG0.480.480.030.440.040.070.250.301.471.01
SUM36.3636.6535.9235.4429.1825.4414.2813.3512.307.98
DHP
BM0.210.210.110.121.230.272.330.413.430.55
NG0.080.080.000.040.240.320.150.45 0.60
HC6.666.663.803.80
BC0.050.050.030.03
SUM7.007.003.933.991.480.592.480.863.431.14
CHPI
BM0.810.810.060.410.020.06
NG0.010.010.010.010.000.00
HC1.541.540.480.090.300.70
LFO0.030.030.020.020.020.02
SUM1.501.500.330.370.190.45
Table 7. Emissions of TSP between 2030 and 2050 from various fuels (BM: biomass, HC: hard coal, HFO: heavy fuel oil, BC: brown coal, LFO: light fuel oil) from public power plants (PP), public combined heat and power plants (CHP), district heating plants (DHP), and industrial combined heat and power plants (ICHP) for non-nuclear (NN) and nuclear (YN) scenarios (t). A blank field in the table means that a respective fuel is not used in a given model year.
20302035204020452050
NNYNNNYNNNYNNNYNNNYN
PP
BM108108108108
HC211121111933193314261426569569
HFO25221915131066
BC16601660725725510510385389
SUM390339002785278119491946960964
CHP
BM2682783553555144196977523293756105
HC235123512035204310231019350520
HFO1111995522
SUM2629264023992407154114437328575593756105
DHP
BM161689419781411418
HC444444254254
BC3322
SUM463463263264419781411418
CHPI
BM585842914
HC1051053362048
LFO221111
SUM16516538362354
Table 8. Evaluation of the modelled result against measurements of the annual average concentration. Source of observation data [68]. Statistical performance measures: RMSE: root mean square error, FB: faction bias, FAC2: the fraction of predictions within a factor of two of the observations. Based on measurement data provided for 2018 [69].
PollutantNumber of StationsAverage from Observation
[µg/m3]
Average from Model
[µg/m3]
RMSE
[µg/m3]
FBFAC2
SO22212.517.068.33−0.300.70
NO2197.423.784.390.640.52
PM101323.1519.904.550.151
PM2.5415.7518.102.69−0.131
Table 9. External costs associated with the Polish power sector in 2018 (million EUR 2018).
Type of Health ImpactLow EstimationHigh Estimation
PM10
Acute mortality5.095.30
Restricted activity days1.927.35
Infant mortality0.181059.92
Chronic mortality26.5274.80
Chronic bronchitis0.123.65
Lung cancer0.230.23
Congestive heart failure0.390.39
Respiratory hospital admissions0.020.04
Cardiac hospital admissions0.030.03
Cerebrovascular hospital admissions0.070.07
Medication use/bronchodilator use0.060.42
Lower respiratory symptoms0.320.56
Medical consultations for asthma0.010.01
Medical consultations for upper respiratory diseases0.040.04
Total for PM1035.001152.68
SO2
Respiratory hospital admissions0.4417.11
Acute mortality488.84488.84
Cardiovascular hospital admissions217.58217.58
Total for SO2706.86723.53
NO2
Chronic mortality34.4734.47
Respiratory hospital admissions0.070.07
Total for NOx34.5434.54
Total for all pollutants776.401910.75
Table 10. Cumulative and avoided external costs associated with the Polish power sector in 2018–2050 (billion EUR 2018).
ScenarioCumulative External CostsAvoided External Costs
Non-nuclear scenario10.3–32.515.5–30.6
Nuclear scenario9.8–29.715.8–33.4
Publisher’s Note: MDPI stays neutral with regard to jurisdictional claims in published maps and institutional affiliations.

