Article

Optimal Sizing of Hybrid Microgrid in a Remote Island Considering Advanced Direct Load Control for Demand Response and Low Carbon Emission

1
Faculty of Engineering, University of the Ryukyus, 1 Senbaru, Nishihara-cho, Nakagami 903-0213, Okinawa, Japan
2
ETAP R&D, Irvine, CA 92618, USA
3
Department of Electrical and Computer Engineering, The University of Texas at El Paso, El Paso, TX 79968, USA
4
Fuji Electric Co., Ltd., Tokyo 141-0032, Japan
*
Authors to whom correspondence should be addressed.
Energies 2021, 14(22), 7599; https://doi.org/10.3390/en14227599
Submission received: 14 October 2021 / Revised: 29 October 2021 / Accepted: 8 November 2021 / Published: 13 November 2021

Abstract

:
Optimal sizing of the power system can drastically reduce the total cost, which is challenging due to the fluctuation in output power of RE (primarily wind and solar) and pollution from thermal generators. The main purpose of this study is to cope with this output power uncertainty of renewables by considering ADLC, residential PV, and BESS at the lowest cost and with the least amount of carbon emission, while putting less burden on consumers by minimizing the IL. This paper optimizes the cost and carbon emission function of a hybrid energy system comprising PV, WG, BESS, and DG at Aguni Island, Japan, using a multi-objective optimization model. To solve the proposed problem in the presence of ADLC, the ϵ -constraint method and MILP are utilized. After obtaining all possible solutions, the FSM selects the best possible solution among all solutions. The result shows that while case 1 has a lower energy cost than the other cases, the quantity of IL is quite significant, putting customers in a burden. In case 2 and case 3, the total energy cost is 11.23% and 10% higher than case 1, respectively, but the sum of the IL is 99% and 95.96% lower than case 1 as the ADLC is applied only for the consumers who have residential PV and BESS, which can reflect the importance of residential PV and BESS. The total cost of case 3 is 1.72% lower than case 2, but IL is higher because sometimes home PV power will be used to charge the home BESS.

1. Introduction

Aguni Island is a remote island of Okinawa prefecture located 60 kilometres northwest of the Naha district on Okinawa Island in the East China Sea. It covers 7.64 km 2 and has a population of roughly 800 people. There is one bar, one cop, and a few restaurants in the area. Aside from the hotel, there are around ten guest homes that cater to scuba divers, and guests [1]. There is no power supply from the main island, and there is less possibility of it in the future. The power generation system of this island is the internal combustion of heavy oil, and the total rated output power is 1600 kW [2]. The cost of energy production in this way is very costly as Japan needs to import 99.7% oil from abroad [3]. On the other hand, greenhouse gas emissions are rising significantly due to massive electricity production from fossil fuels, such as oil, coal, and gas, which tend to change the climate, security, and price of natural resources. In FY2016, total greenhouse gas (GHG) emissions (preliminary figures) in Japan were 1322 Mt CO2 eq. (0.2%, 6.2%, and 4.6% decreased as compared to FY2015, FY2013, and FY2005, respectively). The main reason for the lower emissions in FY2016 compared to FY2015 and FY2013 is the widespread adoption of renewable energy (RE) and resumption of nuclear power plant operation, which reduces the energy-related carbon emissions [4]. By introducing RE sources such as wind power and photovoltaic (PV) into a country’s energy mix was in response to energy conservation issues to solve the problem of energy security, especially since the Fukushima nuclear disaster and the Great East Japan Earthquake in Japan [5]. Okinawa electric power company has introduced various RE sources for remote Island and for Aguni island, Aguni wind power has also been introduced for Aguni island [6]. However, in some cases, the individual use of solar and wind energy sources can result in substantial sizing, making single RE sources is very expensive to implement [7,8,9]. The output power from these renewable sources is uncertain because of weather dependency. On the other hand, the operational scheduling of RE in a power system converts the load curve into a duck curve. This duck curve concept is widely used to describe the imbalance of time between peak demand and the PV generation [10,11]. The battery energy storage system (BESS) is generally considered to be effective equipment for dealing with these problems as it can store extra energy to deliver electricity at lower power generation. Because of their low emissions and excellent efficiency, batteries have gained popularity as storage devices. However, the development of BESS is limited to high capital costs. BESS installation in random or non-optimal form can increase installation costs, system damage, and greater BESS capacity. In a future hybrid implementation, an optimal sizing strategy of installed equipment could help get maximum power reliability in minimum system costs [12,13]. Off-grid power systems typically suffer from low load factors, increasing the number of batteries needed to meet the total demand, which increases total system costs. One of the options tested to solve this problem is to apply appropriate demand response (DR) techniques [14,15]. These strategies encourage electricity customers to reduce power consumption during peak periods of the system in response to time-based rates or other types of financial incentives to manage demand with the available energy without adding new generation. Electric system planners and operators are using DR programs as resource options to balance demand and supply. Such programs can reduce the cost of electricity in wholesale markets and, consequently, reduce retail rates. These programs include the ability to reduce the top demand of electricity suppliers and to delay the implementation of new power plants and power distribution systems—in particular, to save money with the help of reserves for peak use [16,17]. Residential PV and BESS have become popular these days and can also be a good solution to respond to the output uncertainty of renewables. In the context of modelling power systems, the share of solar and wind energy is increasing, and accounting for these renewable sources’ temporal and local variability is an important issue. A long-term power system model is needed, which is rarely feasible for the computational burden. So numerous models include some representative days with similar load and renewable generation to represent the whole time span. Several authors have used different data selection methods to select the representative days. In [18], two representative days selection methods are used to carry out the number of sample days for the optimal sizing of microgrids with industrial load profile. In [19], an efficient time slice approach is presented that can be applied to the input data of all types of the power system model to determine the small number of representative days for the long-term model LIMES-EU. In [20], two hierarchical clustering techniques are designed to capture the statistical features of load data and renewable sources availability in selecting representative days.
The overall goal of this research is to propose a hybrid microgrid system to fulfil Aguni Island’s load demand, considering the minimum energy cost and low carbon emissions. The following tasks have been completed in order to attain this goal:
  • A multi-objective optimization model is proposed to minimize the LCC and carbon emission of PV-wind generator (WG)-BESS-diesel generator (DG) based hybrid power model;
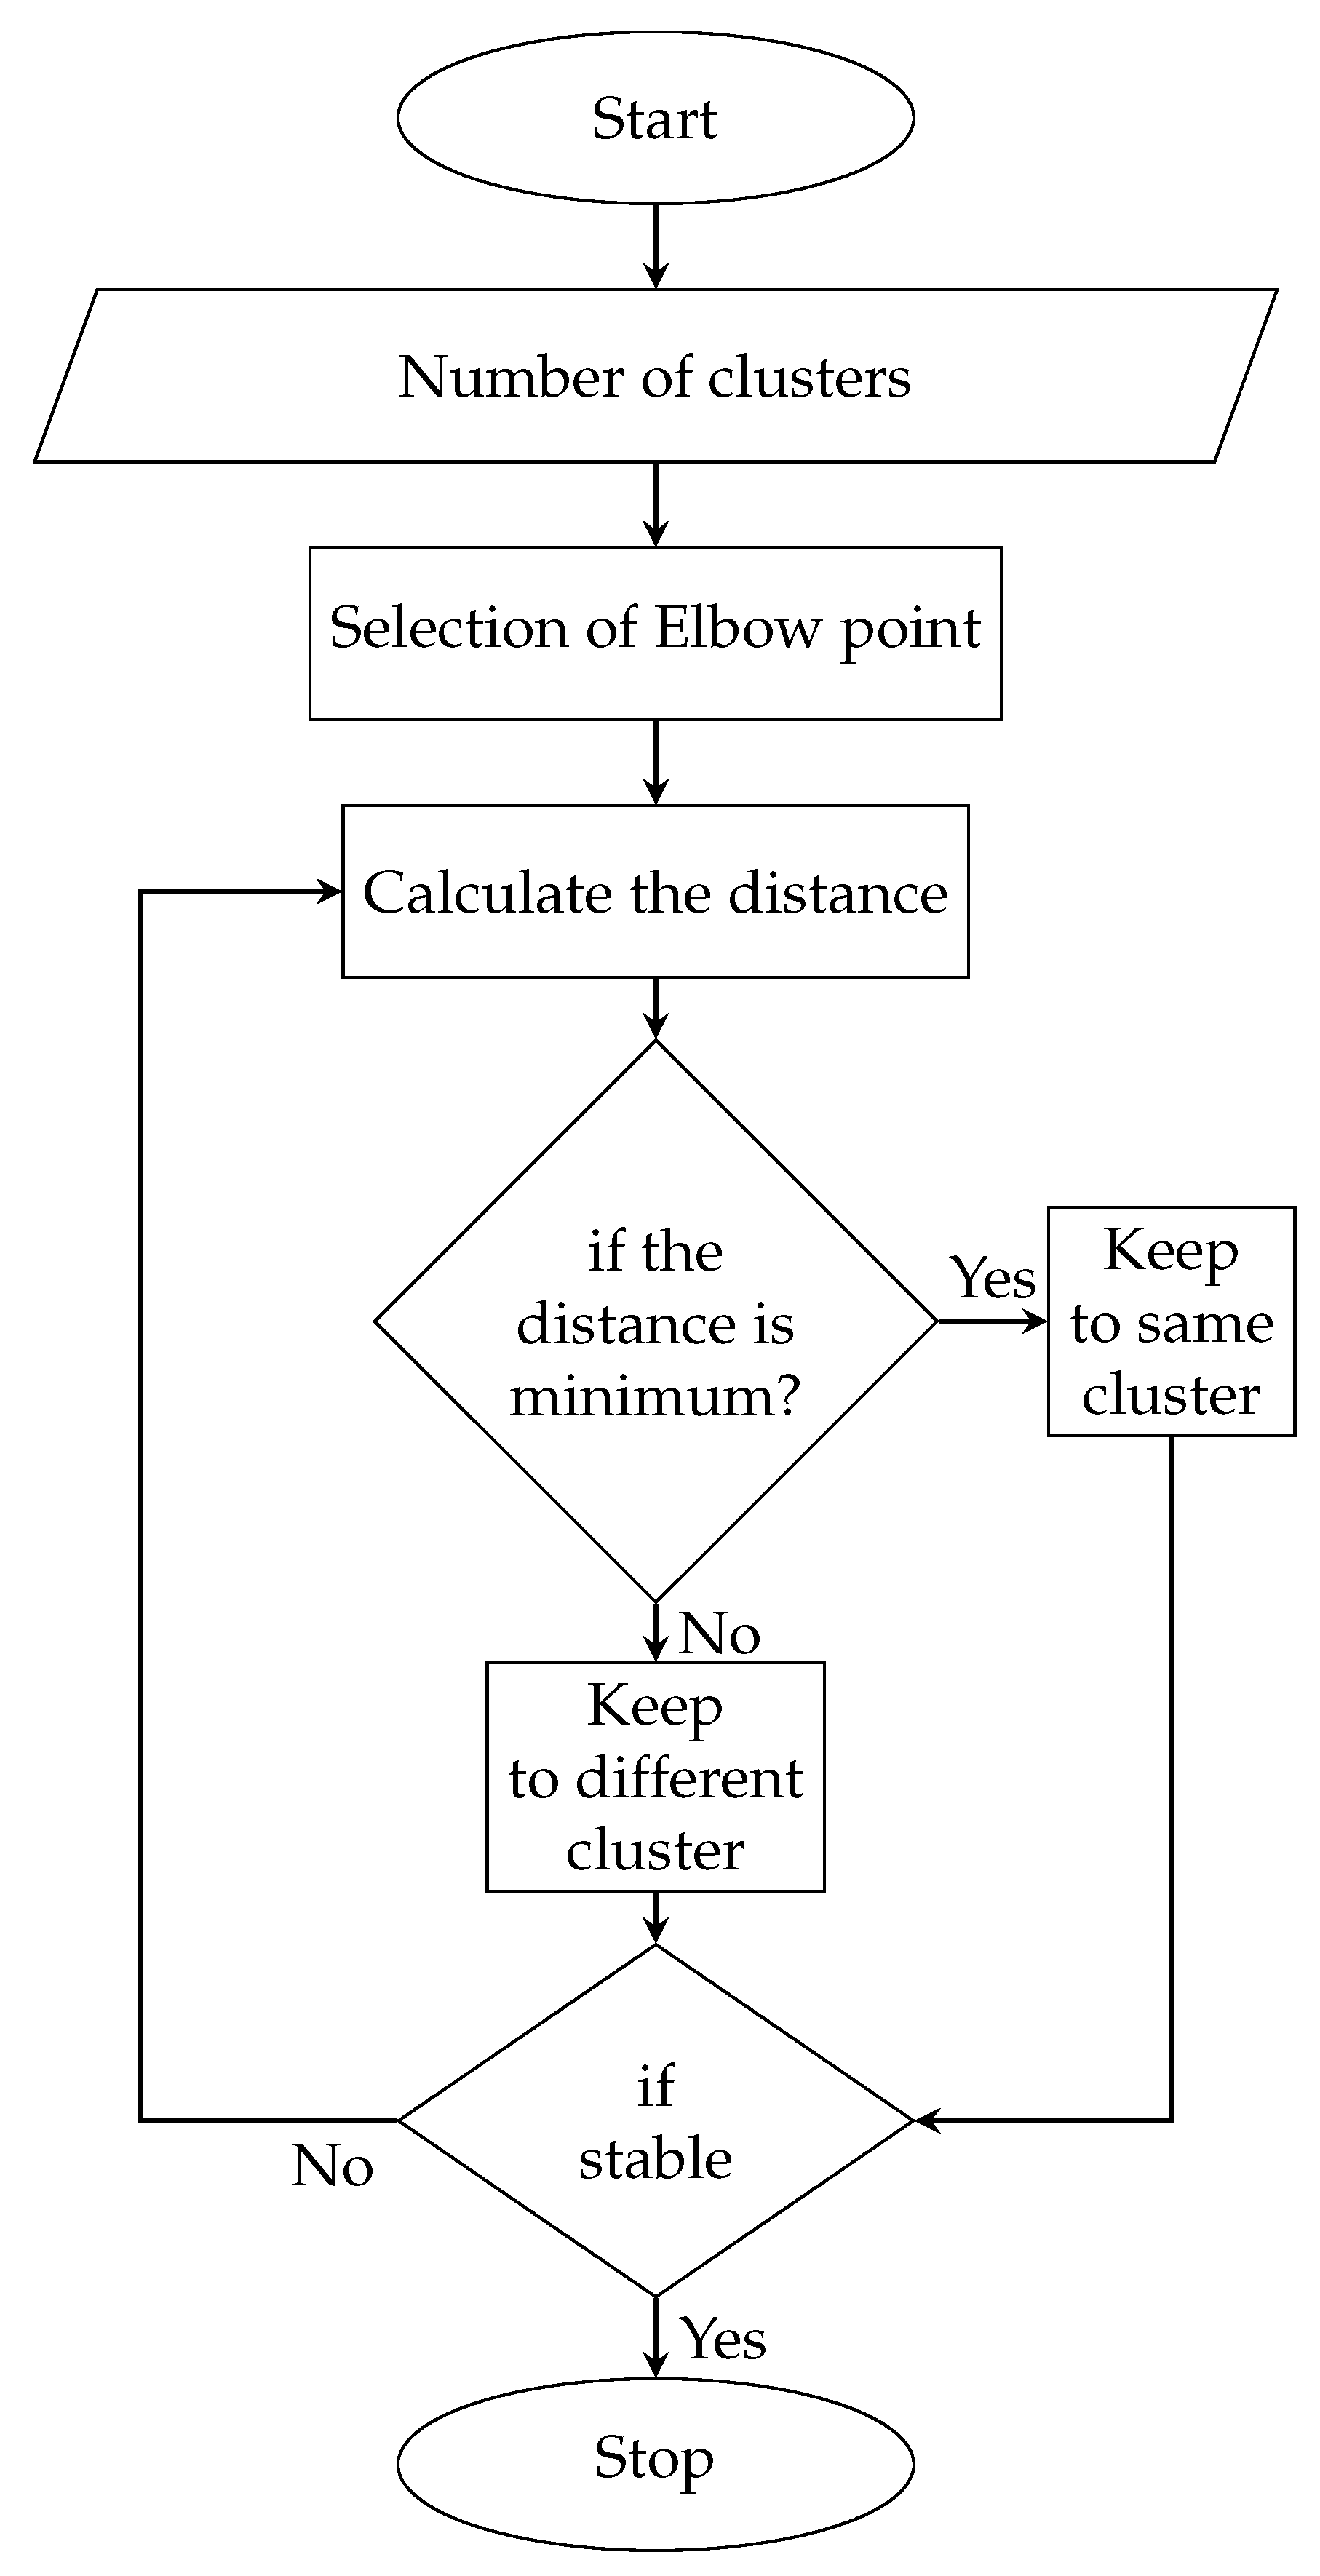
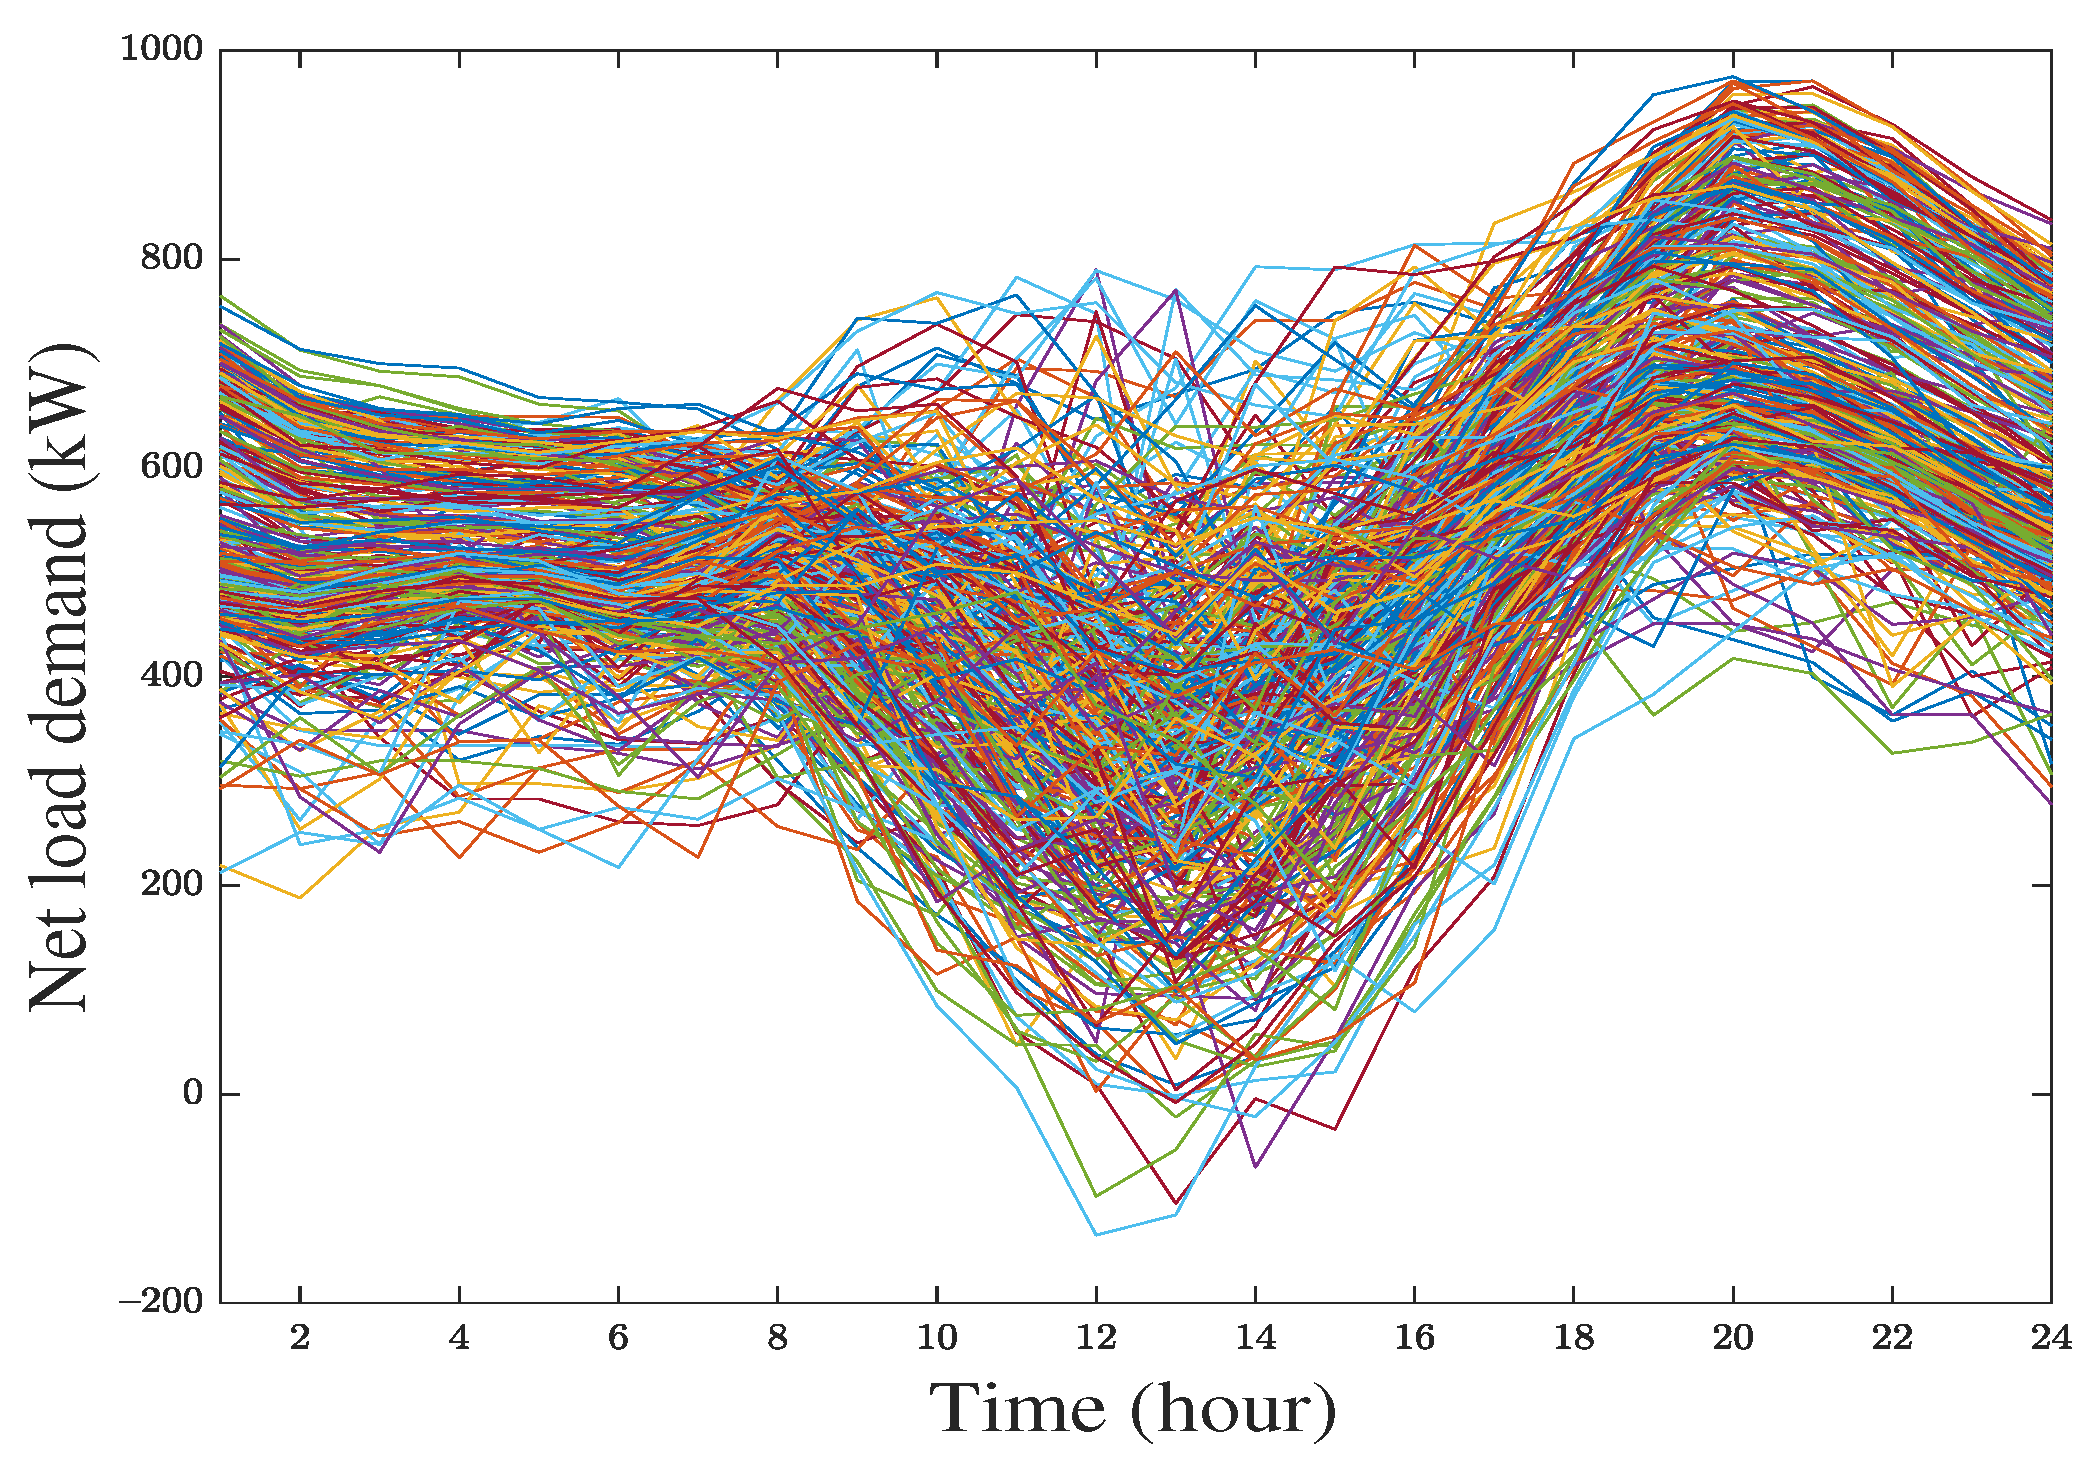
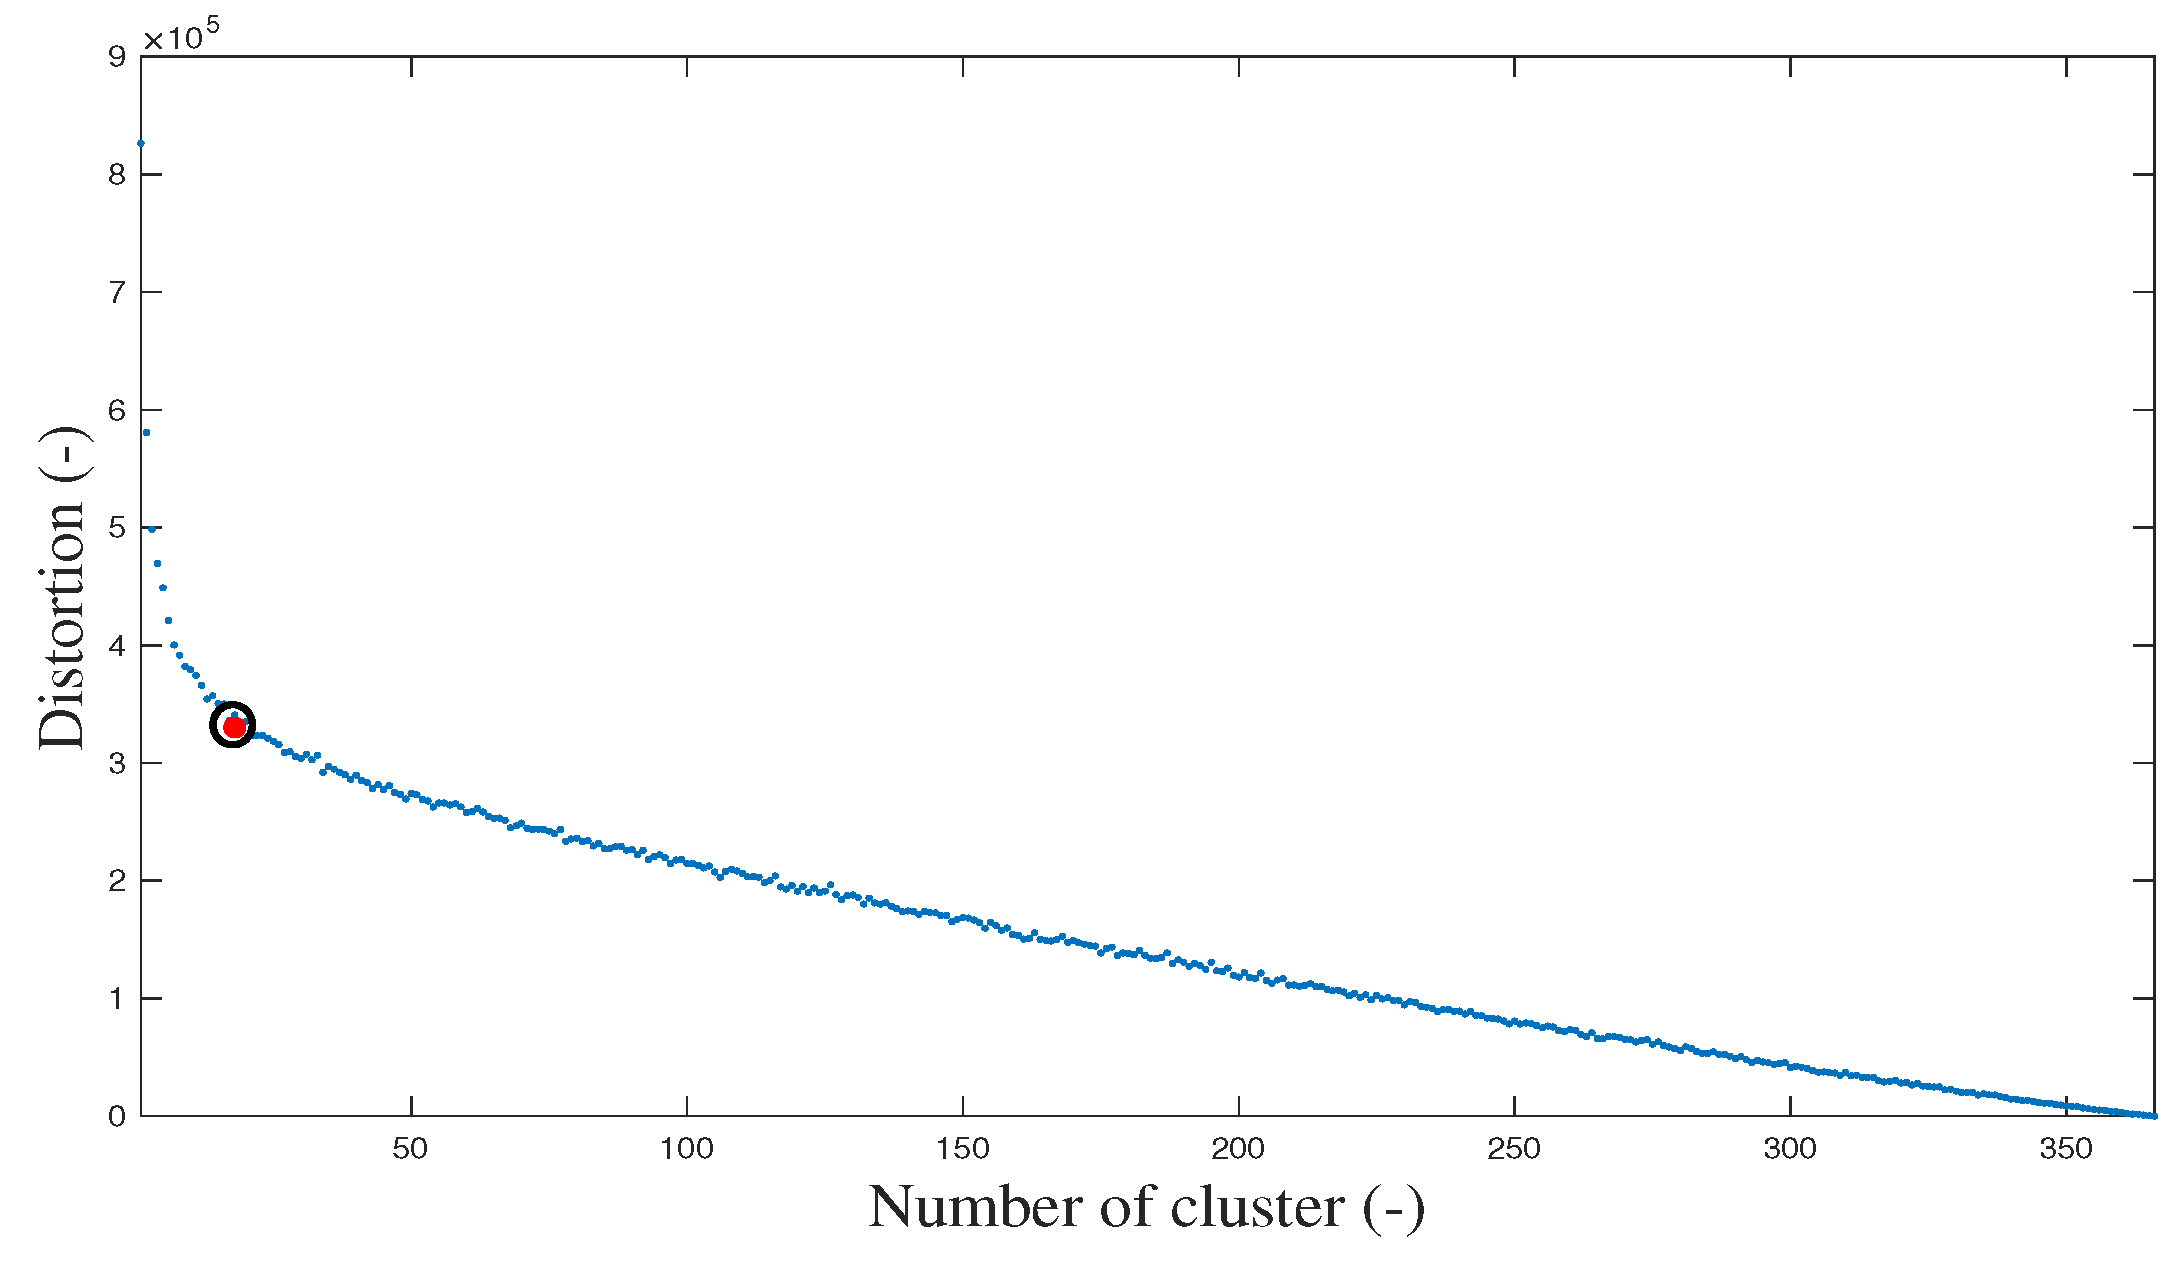
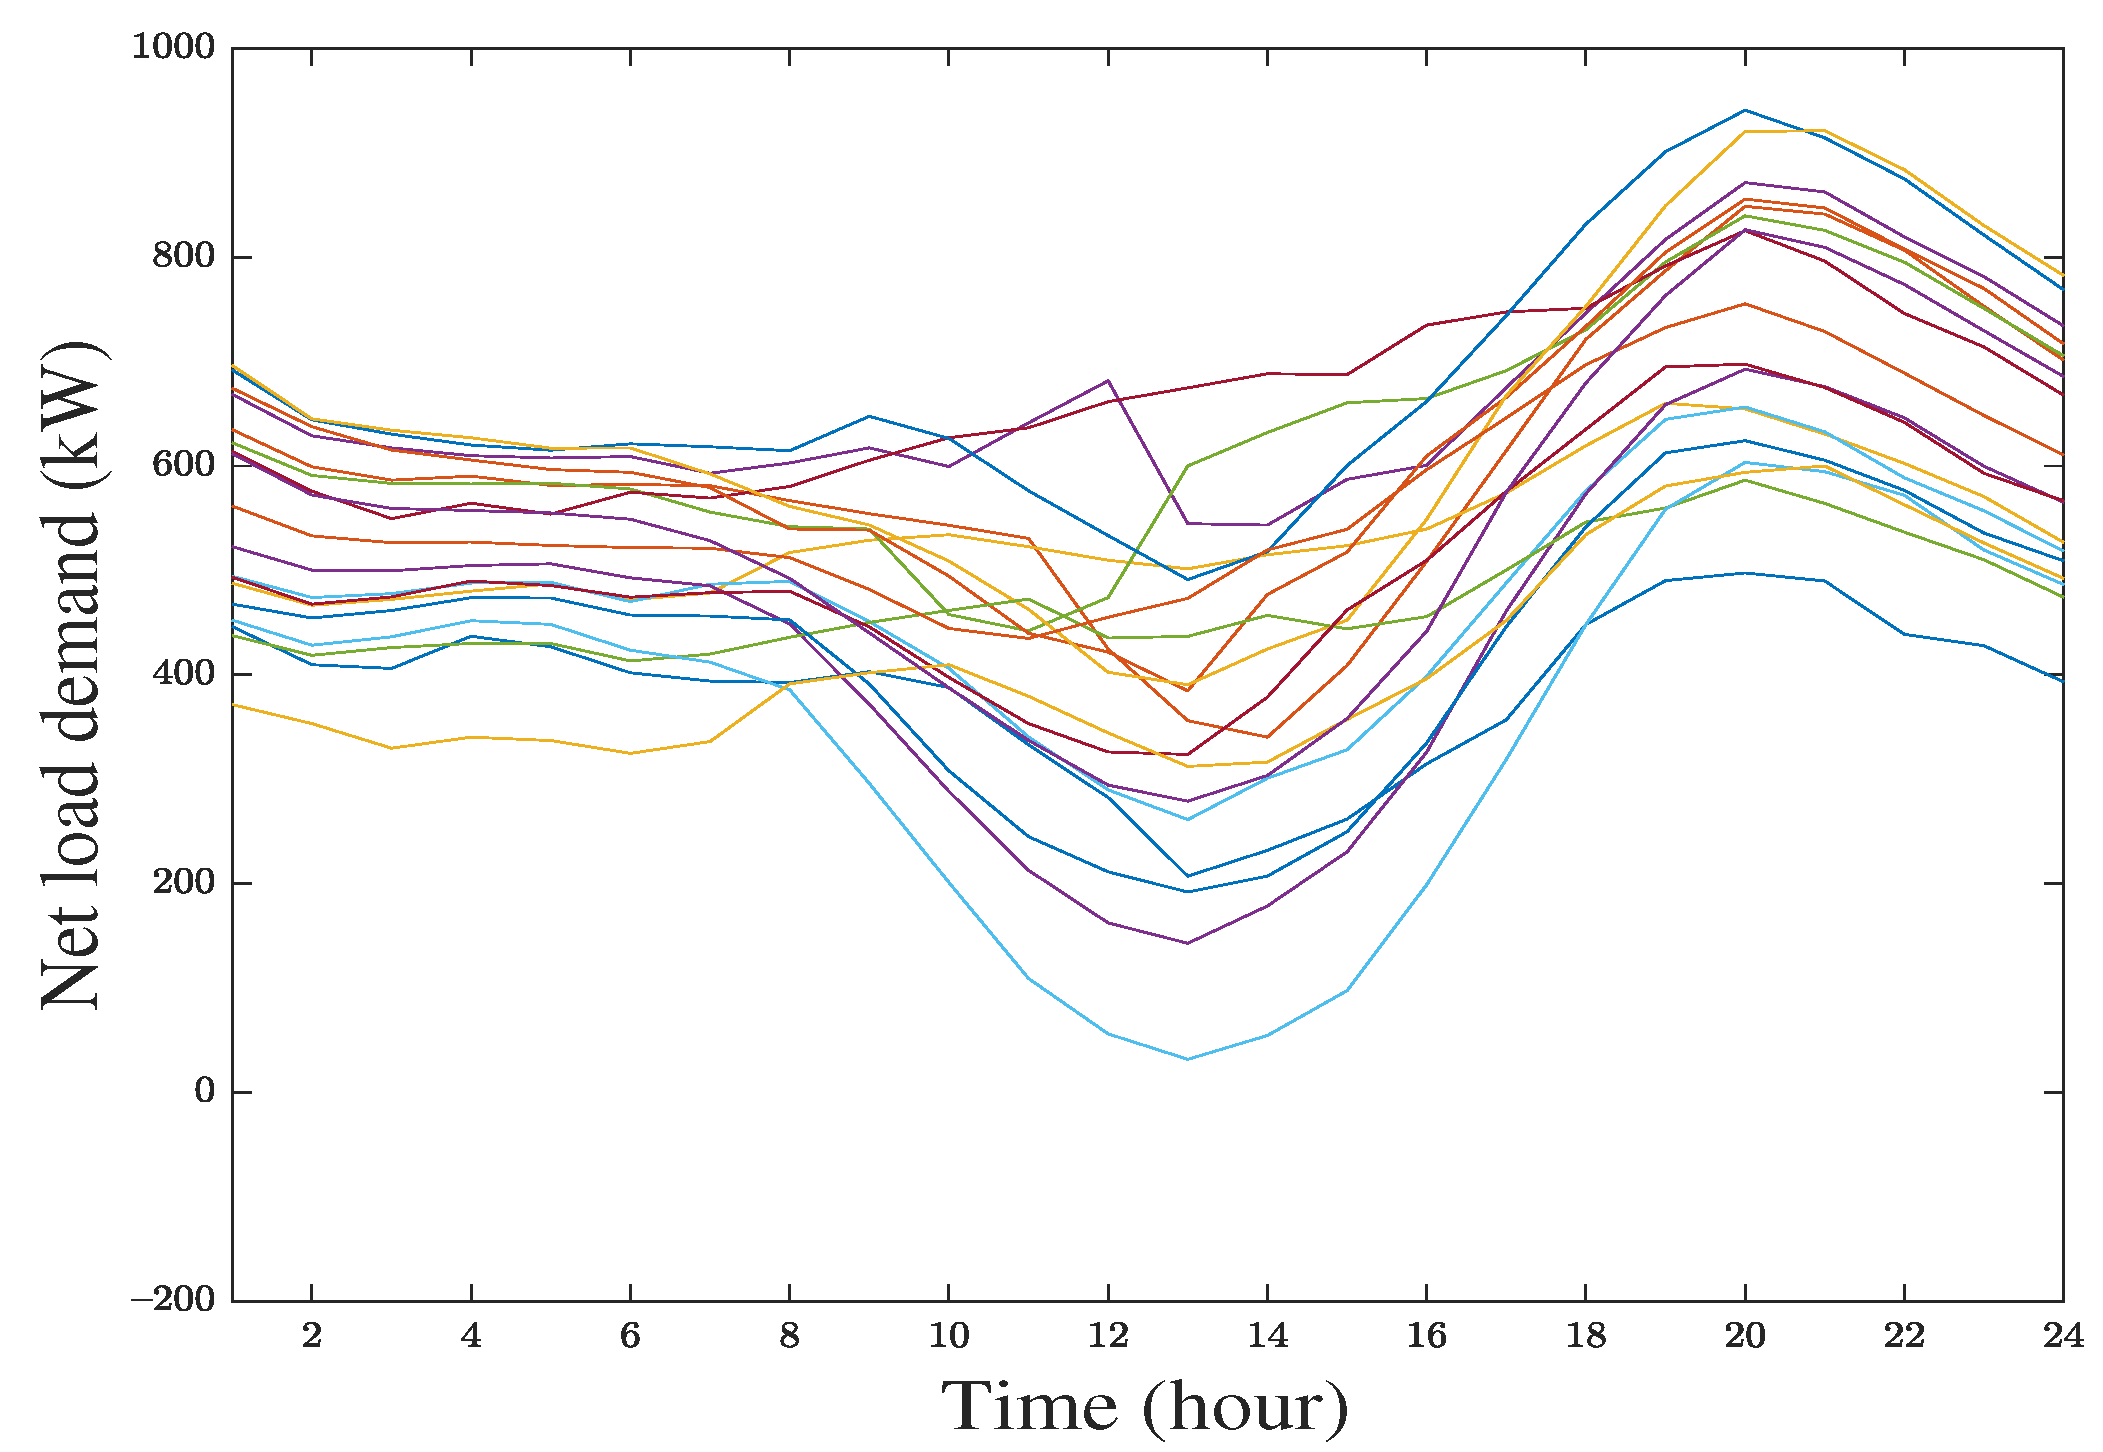
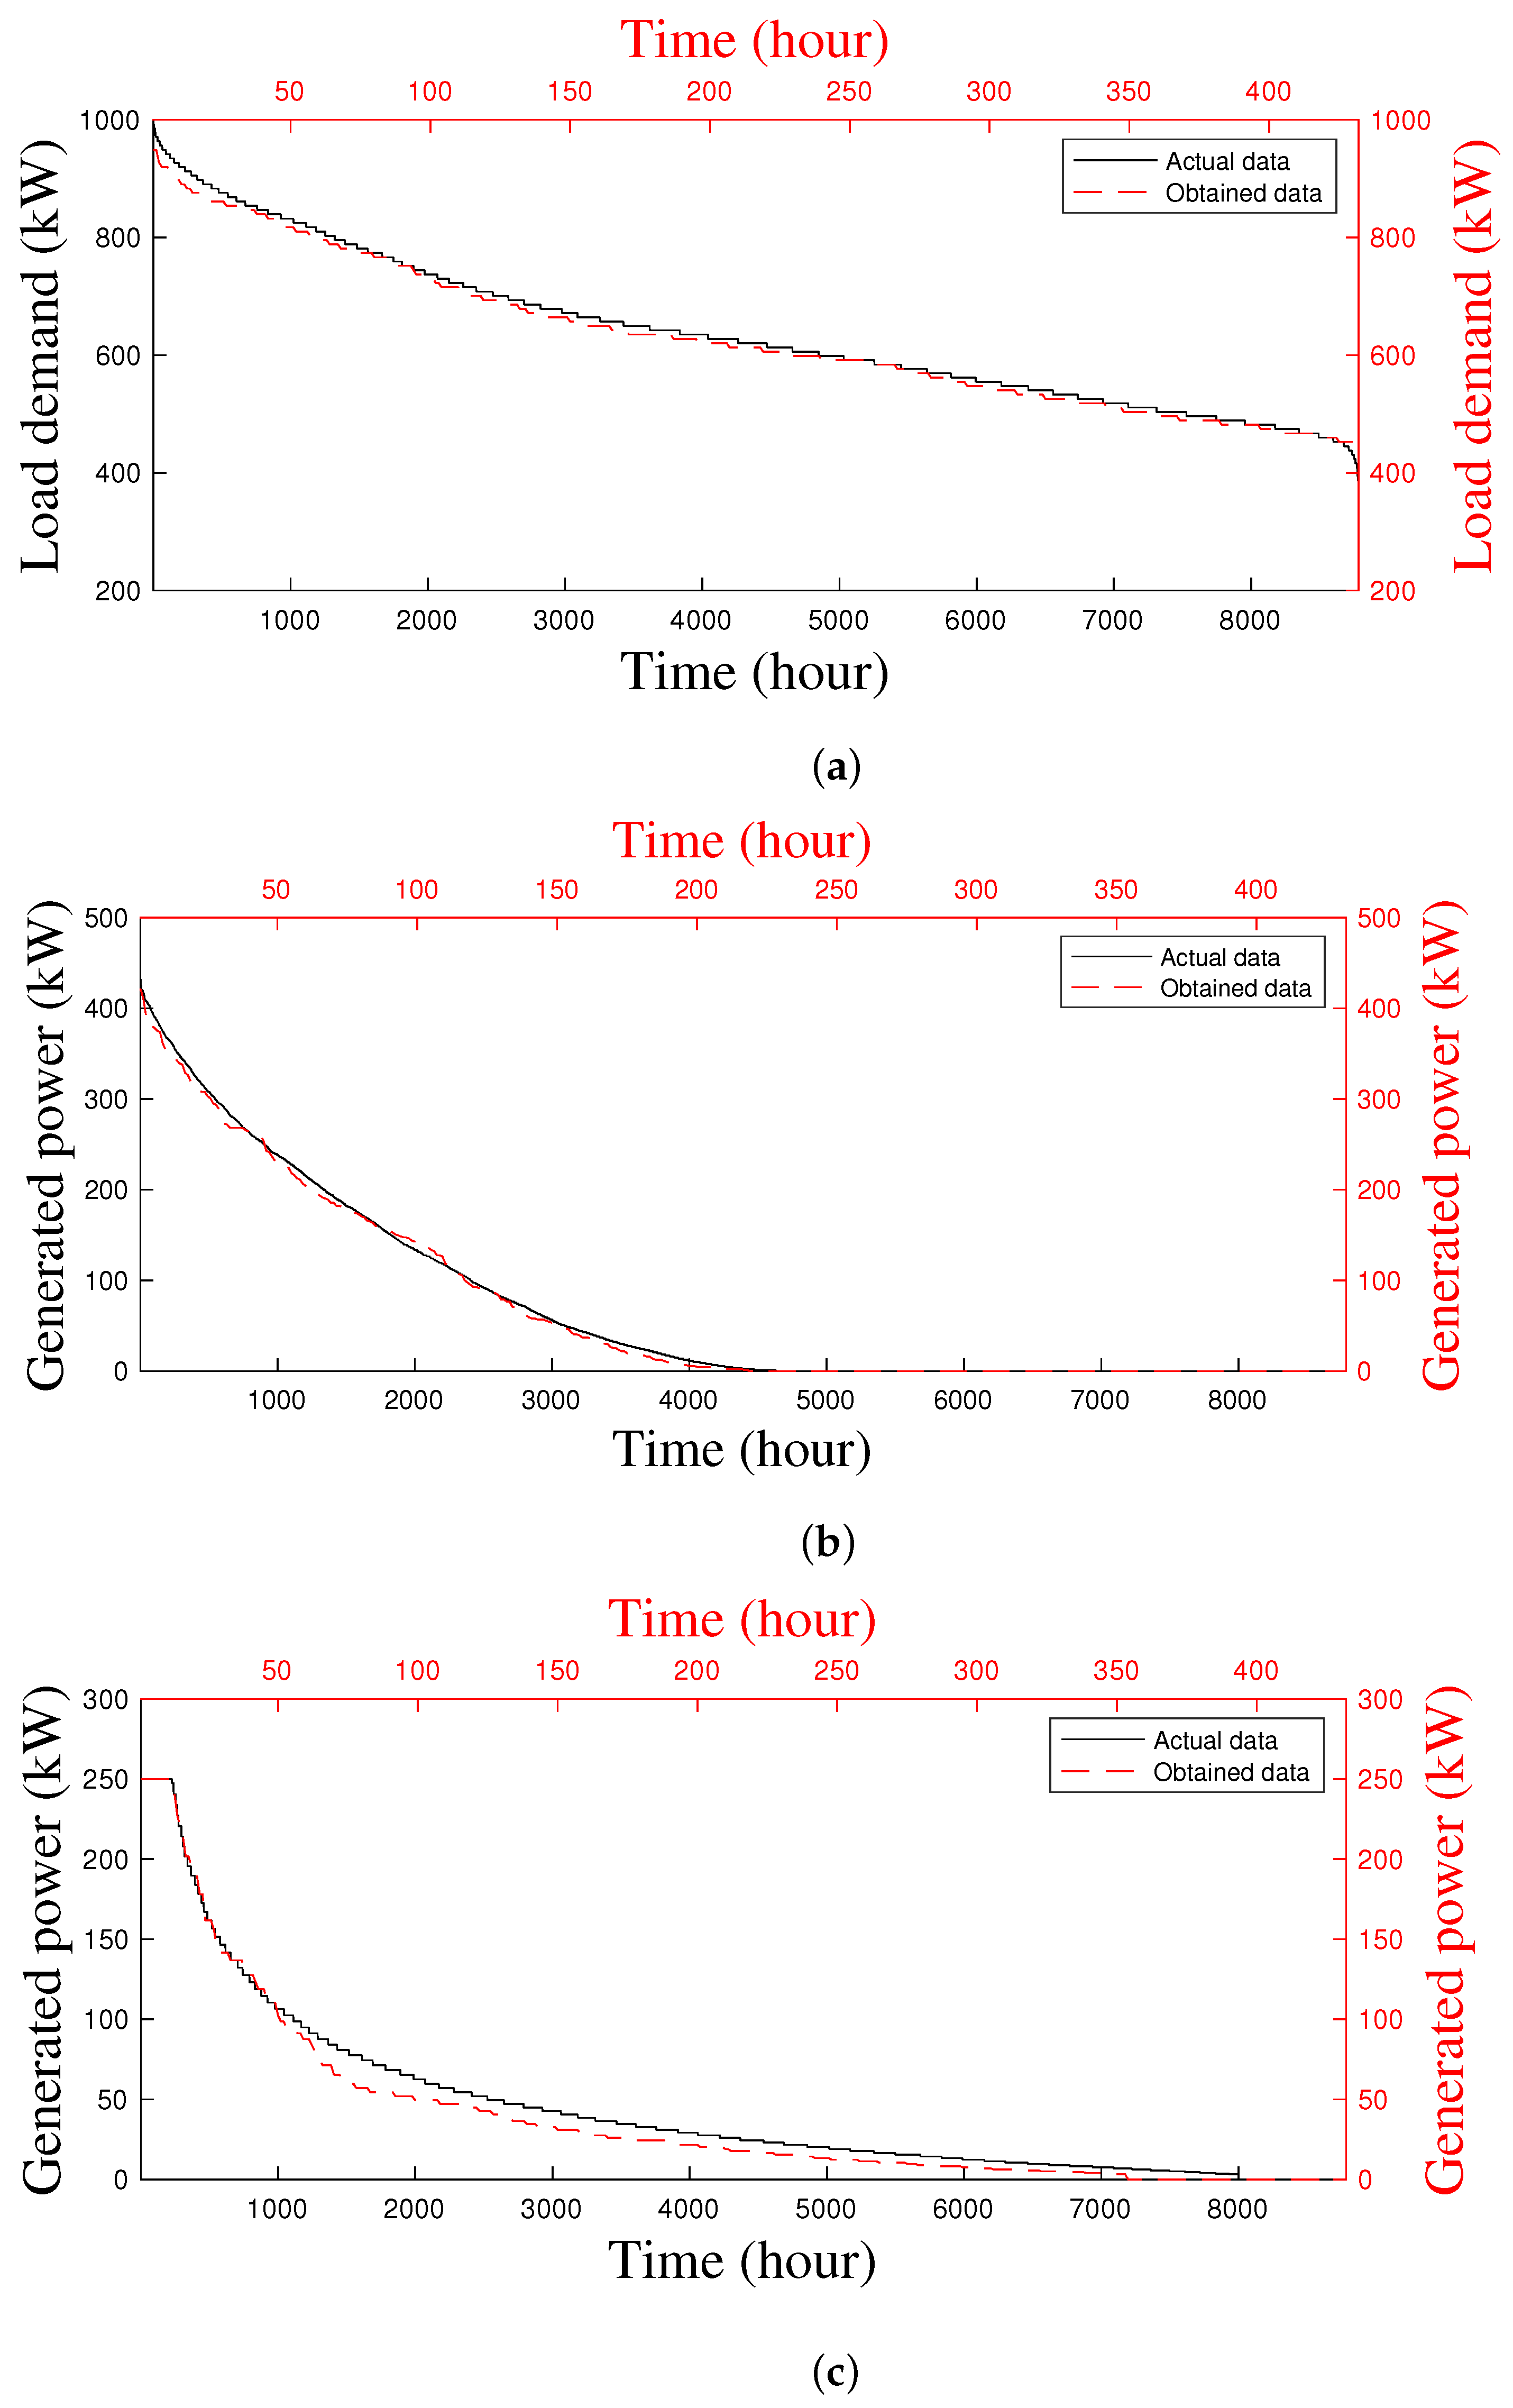
  • K-means clustering is used to select the representative days to represent the whole year data by representative days that can minimize the computational burden of simulating one-year data;
  • ϵ -constraint method with mixed-integer linear programming (MILP) is applied to solve the proposed multi-objective optimization problem and obtain multiple possible solutions. The fuzzy satisfying method (FSM) is then used to select the appropriate solution;
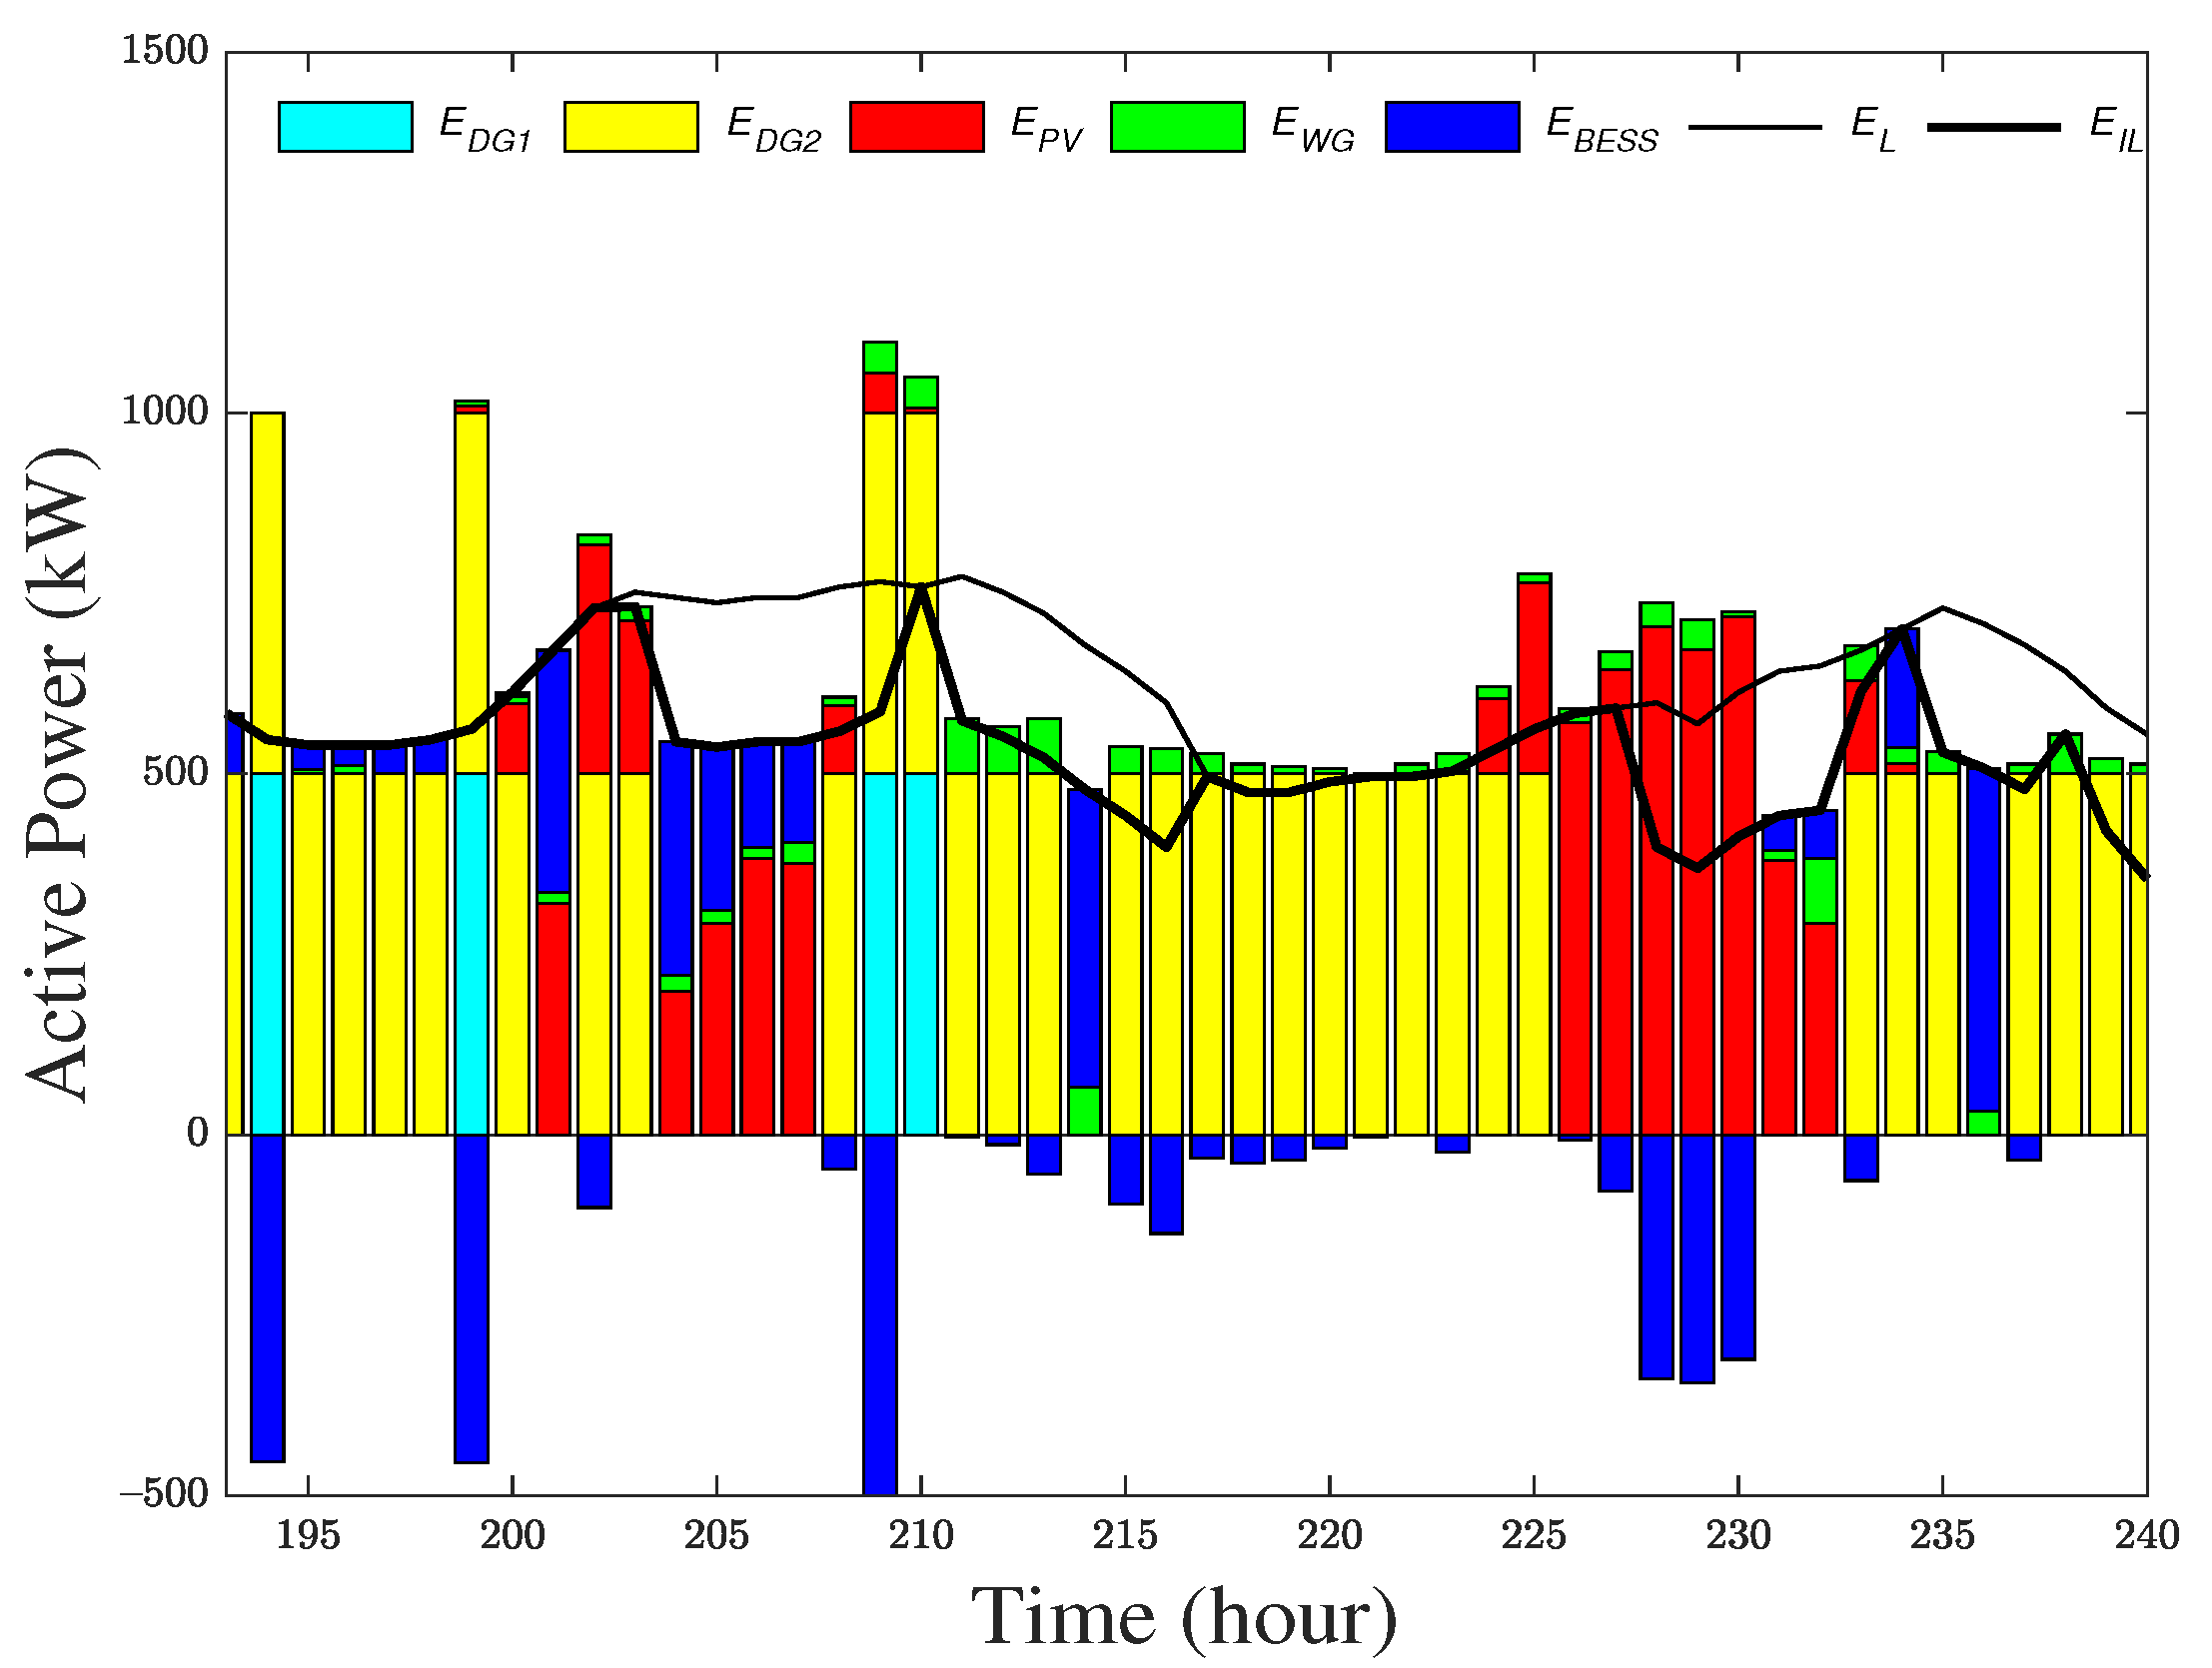
  • DR program is implemented to flatten the load curve for solving the important duck curve problem. Residential PV and BESS are introduced to minimize the amount of interruptible load (IL), making the system more reliable.
The rest of the paper is organized as follows: The literature review is described in Section 2. The proposed power system model and advanced direct load control are described in Section 3. The data selection method is discussed in Section 4. The objective function and constraints are explained in Section 5. The techniques of solving the multi-objective optimization are described in Section 6. In Section 7, the results of 3 different case studies (without home PV and BESS, with home PV and with home PV and battery) are compared to show the effectiveness of the proposed method. Finally, the conclusion and future modification of this paper are presented in Section 8.

2. Literature Review

Some other existing works on HRES are also reviewed for better understanding. In [21], the greenhouse gas emissions from current fossil fuel power facilities of Bangladesh is analyzed using hybrid optimization of multiple energy resources (HOMER). The results demonstrate that coal, diesel, and natural gas power plants release 0.90 kg, 0.76 kg, and 0.566 kg of CO2 per kWh, respectively, responsible for climate change.
In [22], the aim was to discover the optimal size of a hybrid energy storage system, consisting of a hydrogen fuel cell and a supercapacitor for a commercial load provided by solar panels. To examine the influence of the hydrogen cost on the cost of the system and the levelized cost of energy, a sensitivity analysis on the estimated costs of hydrogen storage is performed using HOMER Pro under Cape Town weather conditions. Although the cost of such a hybrid storage system is likely to fall in the coming years, it will still be too expensive to deploy for a commercial load. In [23], HOMER software generates three optimal configurations of hybrid renewable energy systems to meet the residential and agricultural power demand requirements of an energy-deprived village in India, with wind, PV, and battery-based HRES being the most cost-effective design for this specific area. The load is forecasted for a remote district in India, and HOMER software is used to optimize the design and conduct a techno-economic analysis of the proposed PV, WG, and bio-generator based HRES system in [24], which is a more cost-effective system than the conventional one. In [25], different combinations of the off-grid hybrid energy system (HES) are optimized for a rural hilly area of Bangladesh, considering minimizing the cost of energy, net present cost, and CO2 emissions using HOMER software where PV-Diesel-PHS based system is more cost-effective. In [26], HOMER software is used to optimize hybrid PV-DG-battery based systems for electrifying the rural area of Benin. According to the findings, the suggested method is more successful than the current approach in terms of lowering energy costs and carbon emissions.
In [27], intelligent flower pollination algorithm is used for the optimal design and energy management of the hybrid systems based on hydrogen storage, including PV, WG, and FC, to reduce the total net present cost of the northwest region of Iran that finds the optimal decision variables at the minimum cost, and with better reliability values in various reliability indices. In these papers, a demand response program was not considered, which may increase the cost of energy.
In [28], genetic algorithm (GA) and HOMER Pro Software are used to minimize the total system net present cost, cost of energy, unmet load, CO2 emissions of an off-grid HRES for supplying electricity to a group of three villages in India. A genetic algorithm is used in [29] to optimize the solar, wind, and storage based off-grid hybrid system for the remote island. In both papers, and the obtained results are compared with the HOMAR software, and the optimal result of GA is more cost-effective than HOMAR. For minimizing the total/net present cost of the HES encompassing solar PV, wind, diesel generator, and battery for electrifying rural areas in stand-alone applications, a suitable improved GA program has been developed in [30] utilizing the MATLAB toolbox. The size of grid-connected solar and battery systems for residential houses is optimized using a genetic algorithm in [31] to reduce the overall yearly cost of electricity. In this paper, 0% leakage and complete charge/discharge capabilities of the battery are considered, which is not realistic. In [32], GA is used to optimize the PV, wind, battery, and diesel-based hybrid system to satisfy the electricity demands of a remote village of northern Nigeria at the lowest possible cost and with the least amount of carbon emissions. The computational cost of GA is expensive as it takes a long time for convergence. In [33], the NSGA-II method is used for optimal sizing of a HES that includes PV, WG, BESS, combined cooling, heating, and power generation system, heat storage tank, gas boiler, and electric chiller to decrease economic and environmental consequences. A one year dataset is used for simulation, which makes slow convergence of the optimal result.
An improved multi-objective grey wolf optimizer is applied in [34] to minimize the annualized cost of the system and deficiency of power supply probability by determining the optimal size of a hybrid microgrid consisting of PV, WG, tidal current, battery, and diesel for an island. In this research, only the initial cost and running cost of installed equipment is considered that cannot be able to reflect the appropriate cost of energy.
A multi-objective mathematical model is established in [35] for optimizing the capacity of hybrid energy storage system for a grid-connected 99MW Caka wind farm in Qinghai Province, China, to maximize target satisfaction rate and minimize net present value. The only wind farm is considered with a storage system which is less efficient than multiple energy sources.
In [36], the Grasshopper Optimization Algorithm (GOA) is used to determine the optimal system configuration of an autonomous microgrid system that includes PV, WG, BESS, and DG to fulfil energy demand reliably and cost of energy. This system can fulfil the energy demand for only five residential houses.
A Firefly algorithm is applied in [37] to determine the optimal size of a solar, wind and battery storage based hybrid energy system considering the minimum cost of energy for electrifying remote villages in India. In this paper, only one day of summer and winter data are used for simulation, which is not enough for the whole year’s representation.
In [38], a multi-objective crow search algorithm is proposed to reduce the total net present cost and loss of power supply probability of an off-grid hybrid system consisting of PV, FC, and DG to supply electric power in the south of Iran. According to the simulation result, the total cost of the HES can be reduced by the integration of hydrogen energy technology. A geographical information system module is used in [39], to choose the best site based on different factors. A hybrid optimization technique is then used to estimate the optimal capacity to satisfy the demand at the least cost, which is more accurate than other algorithms. One year of data have been used for simulation, which increased the computational burden.
RETScreen simulation software is deployed in [40] to estimate the cost and pollutant emission parameters of a PV, biomass, and additional storage based off-grid hybrid system in the remote areas of Ashuganj, Bangladesh, which is more reliable than the conventional kerosene-based system. No optimization method is used in this paper.
In [41], MILP optimization algorithm has been designed for a case study of a mountain hut in South Tyrol (Italy) with solar, wind, DG, and battery storage based HRES to design a tool capable of determining the optimal sizing of an HRES that can assist engineers in identifying the best trade-off between costs and energy deficiency during the planning stage. The reduction in carbon emission is not considered here.
For the Gobi Desert in China, the ϵ -constraint technique and elephant herd optimization algorithm are utilized in [42] to reduce the loss of load probability, CO2 emissions, and yearly cost of a solar, diesel, and battery-based hybrid system. According to the results, the suggested system emits less carbon than the PSO and HOMER-based systems. A significant portion of the energy generated by the PV throughout the day is lost for the limitation of battery capacity.
For optimization and sensitivity analysis of an autonomous HES consisting of PV-diesel-battery for a remote Saharan village in southern Algeria, particle swarm optimization and the ϵ -constraint method were proposed in [43] to reduce total system cost, unmet load, and CO2 emissions, which is more cost-effective compared to HOMER.
MILP and ϵ -constraint method were used to generate energy storage system day-ahead scheduling in the context of wind farm uncertainty. According to the simulation result, the use of an energy storage unit lowers daily costs and emissions. Only one day of data have been used for simulation, which is insufficient for long term planning for optimal scheduling of energy storage system [44].
A multi-objective optimal scheduling model for CCHP microgrids integrated with RE, energy storage system, and incentive-based demand response is solved using MILP and augmented-constraint methods by minimizing pollutant gas emissions and lowering costs. By adjusting the peak of the exchange power curve, the IL and the battery may effectively adapt to peak load fluctuations. Residential PV and BESS can reduce the IL, which is not considered in this paper [45].
Among various optimization methods, the ϵ -constraint technique minimizes the computational cost of the system and becomes effective when the limits of objective functions are known. This approach is very good for finding convex and linear Pareto optimal front as it has the ability to find accurate Pareto front, rather than approximated solutions [46].
According to the limitation of above literature, the contributions of this study are as follows:
  • The advantages of minimizing cost-emissions function, as well as household PV and BESS, are examined, consider carbon emission as a constraint;
  • Advanced direct load control (ADLC) is used to flatten the load curve. This ADLC is exclusively applied to customers who possess residential PV and BESS in order to reduce the amount of IL on the system, making it more reliable by lowering the impact of power outages.

3. System Description

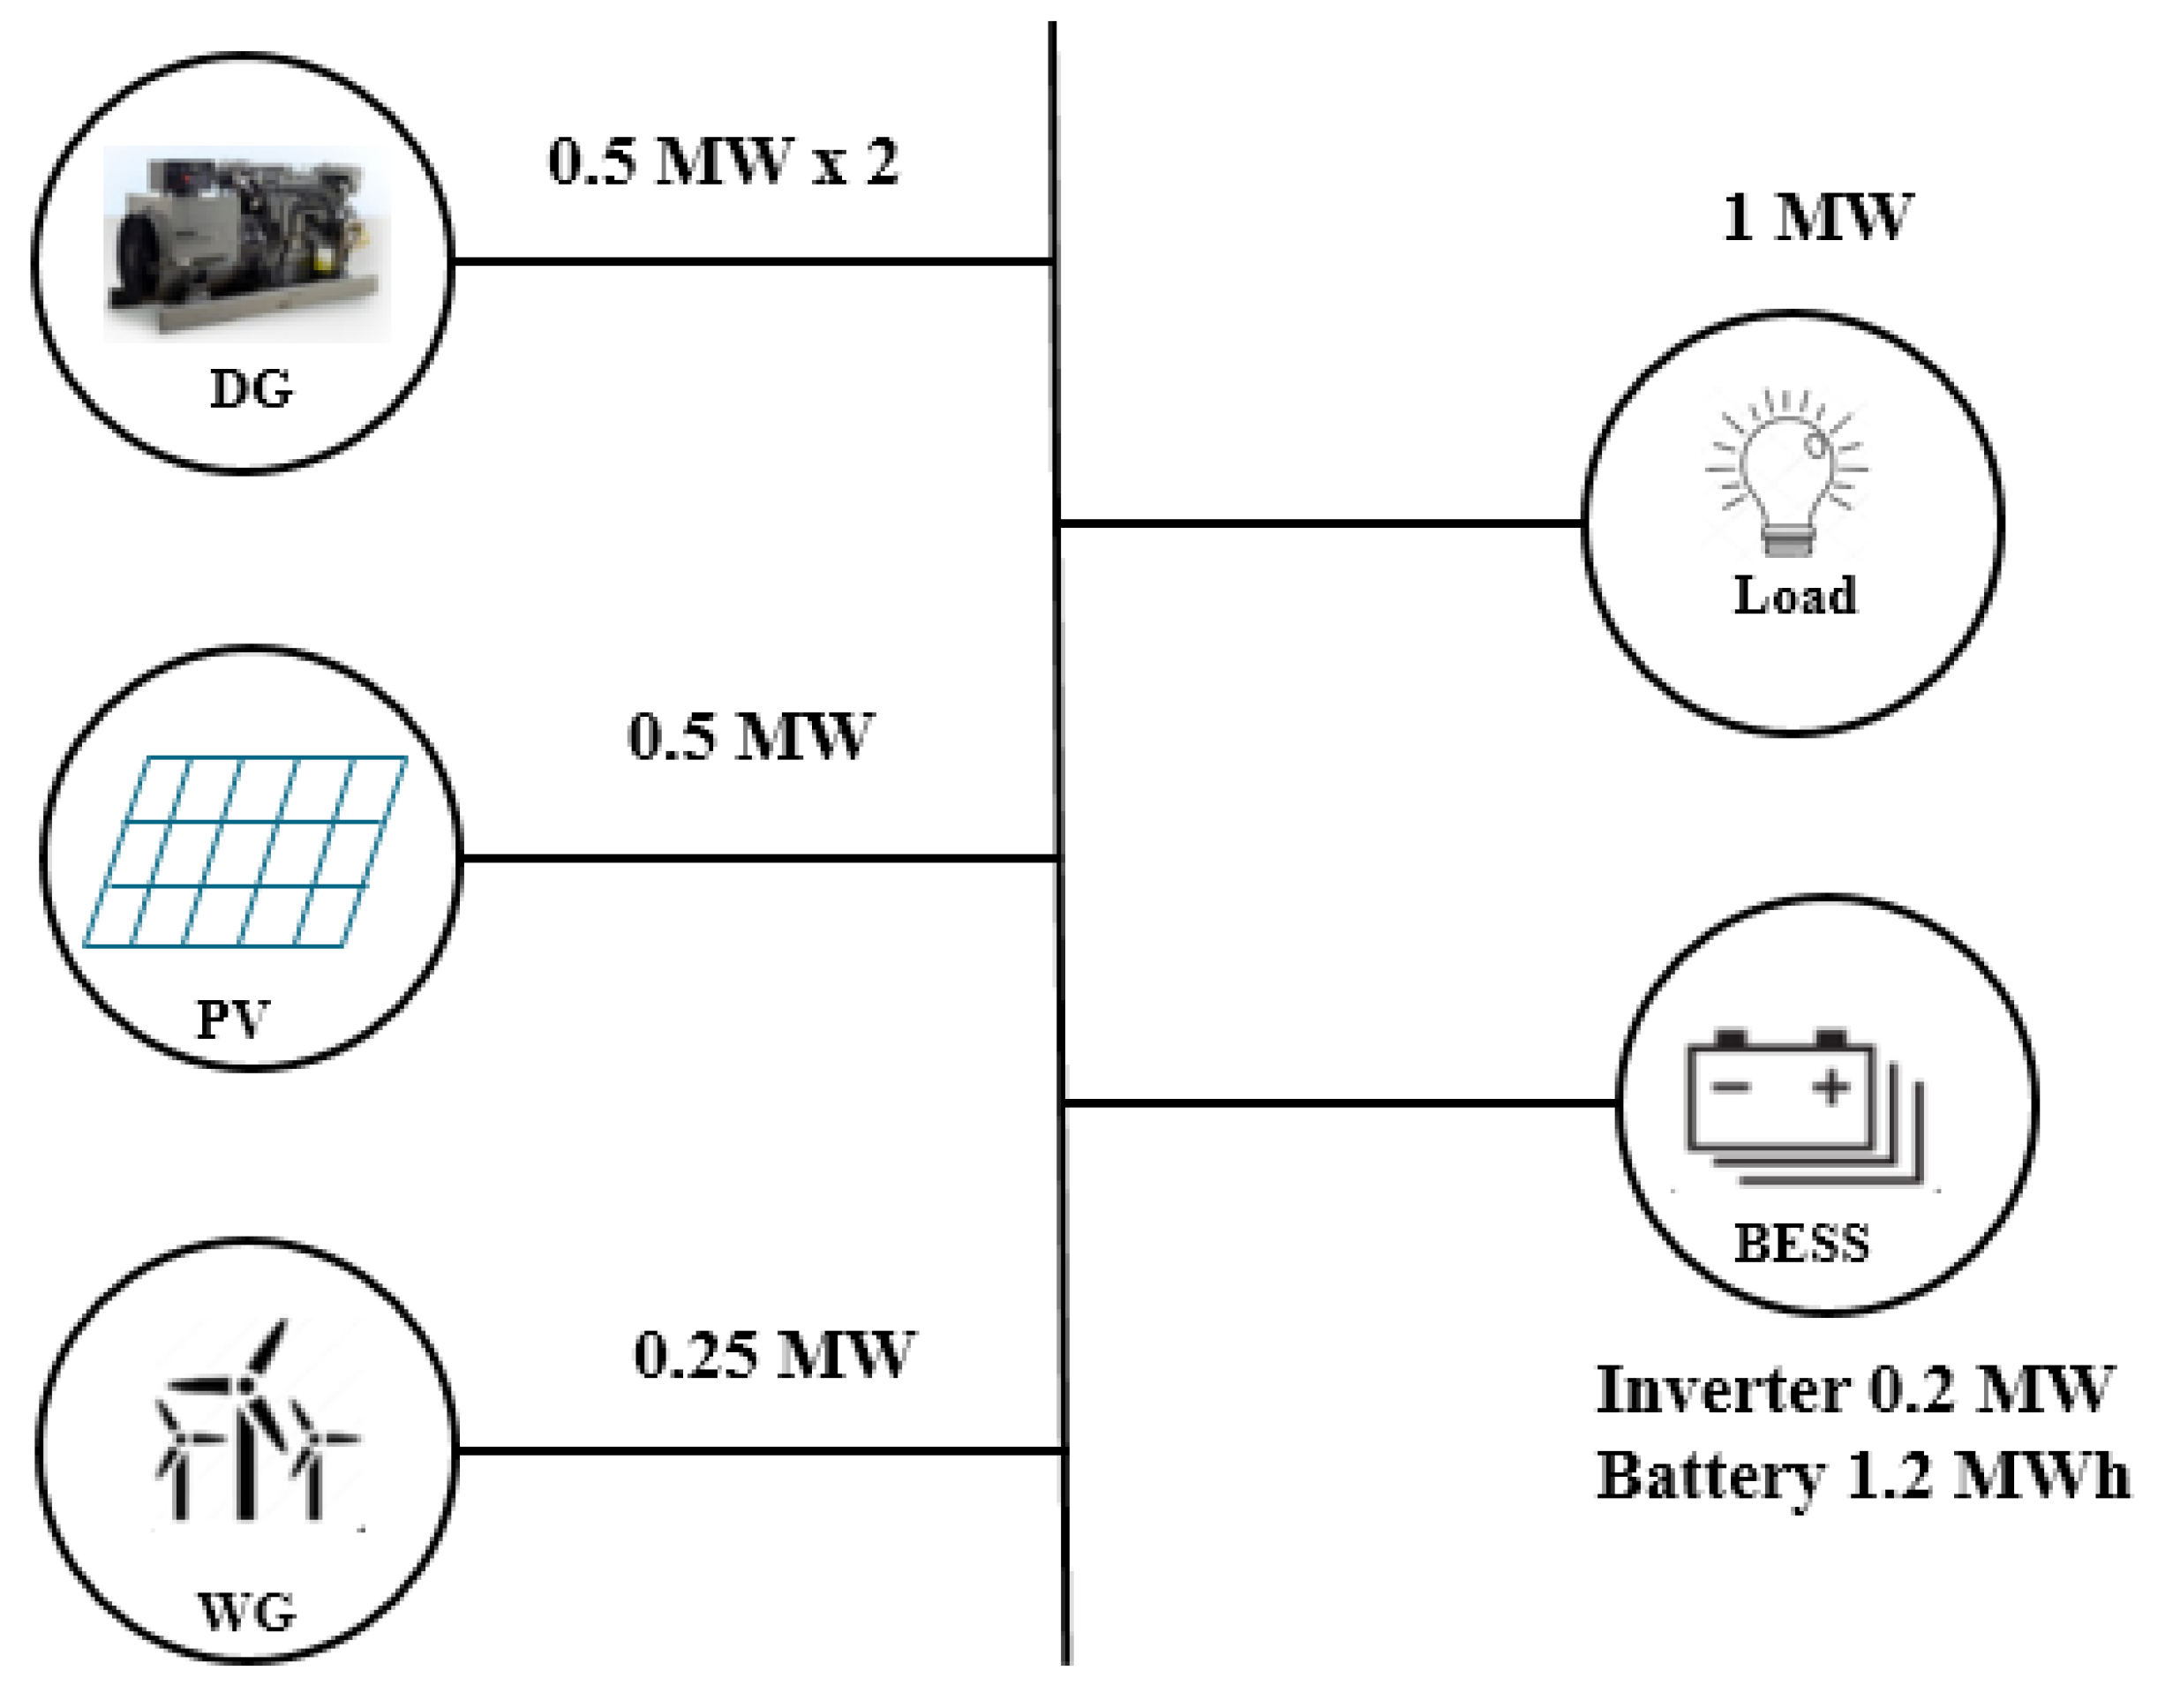
3.1. Power System Model

A decentralized power system model is designed and shown in Figure 1 in this paper for a remote island in Okinawa Prefecture named Aguni island with a peak load of 1 MW. It is considered that the power system is disconnected from the Okinawa main power system. As a hybrid power system, a small PV, WG, DG, and BESS are considered as the power generation source and energy storage. PV and WG power is used to meet the demand, and the battery is charged by the remaining power. If PV and WG power is not enough, BESS will be discharged. If the demand is not compensated by the PV, WG with BESS, DG will run, and DR will be applied.

3.2. Modeling of Installed Equipments

The load data used in this paper are collected from the Okinawa Electric Power website. Solar irradiation and wind speed data of one year are used to calculate the output power of PV and WG, respectively, which is taken from Japan Meteorological Agency.
The output power generated by PV is calculated by Equation (1).
E P V ( t ) = H ( t ) η p v A p v
where E P V is the power produced by PV (kW), H is the quantity of solar irradiation (kW/m2), A P V is the total solar panel area (m2), and η P V is the solar panel yield or efficiency of the PV system which is considered as 12.3% in this paper [47].
The output power generated by WG is represented by Equations (2) and (3).
E W G ( t ) = 0.5 C p ρ A W G V h u b 3 ( t )
V h u b = V r e f Z h u b Z r e f α
where E W G is the generated power by WG (kW), C p is the output power coefficient of performance of WG, ρ is the air density (kg/m3), A W G is the swept area of blades of the WG (m2). V h u b is the speed of wind (m/s) at the target height of the hub of the WG, V r e f is the speed of wind (m/s) at the reference height of the WG. Z h u b and Z r e f is the target hub height and reference hub height of the WG, respectively. The cost of installed equipment and other parameters for calculating the generated power of PV, WG, BESS and DG is listed in Table 1.

3.3. Modeling of Advanced Direct Load Control

DLC is a contract based DR signed by the consumers, which is provided by utilities. According to this contract between consumers and utilities, consumers permit utilities to control consumers’ air conditioners and water heaters remotely. Utilities can shut down such appliances during peak-demand periods or power supply shortages or notify consumers about peak periods to shut down appliances. The consumers who participate in this contract obtain compensation by decreasing their electricity bill [48,49].
ADLC, an incentive-based DR, has been introduced in this paper to bridge the gap between supply and demand curves. We estimate that this contract will be made by 0%–50% of consumers. The consumers following the agreement accede to the power cut while the shortage of power. Each contracted household will face a maximum of 2 h of power cut per day, and for 1 kW of a power cut, they will receive JPY 10 as compensation.
  • IL function in ADLC: In this proposed method the content of IL is defined by Equation (4)
    0 I L ( k W h ) I L m a x ( k W h )
    where I L m a x is the maximum amount of IL per hour.
  • Compensation cost function in ADLC: In ADLC, the compensation cost is calculated by Equation (5)
    c o m p c o s t = t = 1 n I L t ( k W ) P R c o m p ( Y e n / k W )
    where c o m p c o s t is the compensation cost, I L t is the IL in hour t and P R c o m p is the compensation price per kW which is considered as JPY 10 here.
The advantages of this contract are listed below:
  • Electricity bill saving for consumers: For cutting of 1 kW of electricity from a household each time, it will receive a discount of JPY 10 from the electricity bill;
  • Lower electricity bill for other consumers: For using less energy by the contracted consumers, the wholesale market price of energy will not increase at the time of shortage;
  • Minimize the duck curve problem: Duck curve occurs during peak load with low generation. If the load is minimized by cutting off power, the duck curve will also be minimized.

4. Proposed Data Selection Method for Optimal Scheduling

In order to finalize the optimal power supply configuration with the best operation plan of the annual data, a large number of calculations are required. These data should be simplified to reduce the computational burden. The calculation cost can be minimized by choosing some qualitative days as representative days. K-means clustering is used to simplify the yearly data in this research, which is a simple unsupervised machine learning algorithm that classifies similar data into a number (k) of clusters. For k-means clustering, the optimal number of clusters is selected by the elbow method in this paper. K-means clustering is run by the elbow method based on the dataset for a range of values for k, and an average score is calculated for all clusters for each value of k. The distortion score is calculated by default from the sum of square distances between each point and its assigned center. After plotting these overall metrics, it is possible to visualize the best value for k. If the line graph looks like an arm, then the elbow point is the best value of k that can be either up or down [50]. In the power system model, all historical days which are classified into the same cluster will be illustrated by the same representative day.
The simplified working procedure of the elbow method for determining representative days for optimal operation in this paper is shown in Figure 2.
The annual net demand dataset of clustering in this paper is shown in Figure 3, which depends on load demand, solar radiation and wind speed. Figure 4 shows the elbow diagram where number 18 is considered as the elbow point and the best value of k. Figure 5 shows the net load demand of the obtained dataset of the number of clusters [51]. The obtained dataset, actual load data, power generated from WG and PV is shown in Figure 6, ensuring that proper data selection has been accomplished here [52] which can be able to represent the whole year.

5. Problem Formulation

In the assumed power system model of this paper, the number of installed WG, PV, and BESS can vary. The output power is proportional to the rising number of installed WG and PV. The minimization of the LCC of the system and carbon emission are the objective functions of this paper. The number WG, PV, and BESS, schedule of charging or discharging of BESS, and schedule of DG operation are determined by MILP so that the objective functions can be minimized.

5.1. Objective Function

i
Cost function: In this paper, multi-objective optimization is considered with two objective function of minimization. The first objective function is to minimize the LCC which is defined by Equation (6).
M i n : L C C = C F + y = 1 Y C O & M ( y ) + C R P ( y ) ( 1 + D ) y R V ( 1 + D ) y
where C F is the initial/fixed investment cost (JPY), Y is the total lifetime (Year) of the project which is considered 15 years in this paper. C O & M ( y ) operation and maintenance cost and C R P ( y ) is the replacement cost in the year y (JPY), respectively. D is the discount rate which is assumed to be 3% in this paper. R V is the residual value.
The initial investment cost C F is the sum of the initial investment cost of installed equipment which is calculated by Equation (7)
C F = C F P V + C F W G + C F B E S S
where C F P V , C F W G and C F B E S S are the fixed investment cost of PV, WG, and BESS, respectively.
Similarly, the operation and maintenance cost C O & M ( y ) and replacement cost C R P ( y ) is calculated by Equations (8) and (9), respectively.
C O & M ( y ) = C O & M P V ( y ) + C O & M W G ( y ) + C O & M B E S S ( y )
where C O & M P V ( y ) , C O & M W G ( y ) , and C O & M B E S S ( y ) are the the operation and maintenance cost of PV, WG, and BESS in the year y, respectively.
C R P ( y ) = C R P P V ( y ) + C R P W G ( y ) + C R P B E S S ( y )
where, C R P P V ( y ) , C R P W G ( y ) , and C R P B E S S ( y ) are the the replacement cost of PV, WG, and BESS in the year y, respectively.
ii
Emission function: The second objective function is to minimize the carbon emission which can be calculated by Equation (10).
M i n : E C O 2 = h = 1 H H c × C F × C c o i l
where H c is the heating value of C fuel oil (GJ/kL), C F is the CO2 conversion factor of CO2 per calorific value (tCO2/GJ) and C c o i l is the consumption of C heavy oil that can be calculated by Equation (11).
C c o i l = H H c × E D G
where, H is the heating value (kJ/kW) and E D G is the total power generated by DG.
The fuel cost of DG is shown by Equation (12).
C D G i ( t ) = H × E ( D G i ) × P c H c × η i
E ( D G i ) is the power generated by DGi at each time t (kW), P c is the rate of C fuel oil (JPY), and η i is the efficiency of DG.

5.2. Constraints

i.
Constraints for charging and discharging of BESS are given below:
B c ( t ) + B d ( t ) 1
where, B c and B d are the charging and discharging state of BESS, respectively.
S O C m i n n B C B t = 1 T η c B E c ( t ) 1 η d B E d ( t ) + S O C i
t = 1 T η c B E c ( t ) 1 η d B E d ( t ) + S O C i S O C m a x n B C B
ii.
Maximum output power of BESS
E c n B E c m a x
E d n B E d m a x
iii.
Start/stop constraint of DG
D G o n ( t ) + D G o f f ( t ) 1
iv.
Power balance limit
n P V E P V ( t ) + n W G E W G ( t ) + ( E d ( t ) E c ( t ) ) + E D G ( t ) E s r ( t ) E I L ( t ) = E L ( t )
where, n B is the number of BESS; C B is the per unit capacity of BESS; η c B , η d B are charging and discharging efficiency which have taken by 80% in this paper; n P V and n W G are the number of installed PV and WG. E P V and E W G , are the power generated prom PV and WG, respectively. E d and E c are the discharging and charging power of BESS. E d m a x , E c m a x are the maximum discharging and charging power of BESS. E D G are generated power from DG; E s r is the surplus power; S O C i is the initial state of the SOC of BESS; E I L is the amount of IL; E L is the load demand.
v.
ϵ -constraint
Min: LCC subject to
E C O 2 E C O 2 m a x × ϵ i
where i = 1, 2, 3,......, n

6. Problem Solving Method

6.1. ϵ –Constraint Method

The ϵ –constraint method is used to solve the proposed multi-objective optimization. One objective function is considered for optimization, and the rest of the objective functions are converted to inequality functions and considered as constraints. In this research, one objective function, ϕ 1 , is optimized, and another objective function, ϕ 2 , is considered as a constraint as follows.
O F = m i n ( ϕ 1 )
s . t : ϕ 2 ϵ
Equations (21) and (22) describe the ϵ –constraint method where ϕ 2 is restricted by ϵ parameter. The minimum and maximum values of this parameter are set very carefully. Gradually the parameter varies from the minimum value to maximum value, and the solution of the modified single objective function is obtained for each ϵ parameter. The set of all obtained solutions from the variations of ϵ m i n to ϵ m a x are the Pareto optimal front of the multi-objective optimization problem.

6.2. Fuzzy Satisfying Method

To find the best possible solution from the Pareto optimal front of the multi-objective optimization problem, FSM is necessary. A fuzzy membership function with the interval (0, 1) is assigned to each solution in the Pareto front. The linear fuzzy membership functions can be obtained nth solution of ith objective function is defined as Equation (23)
ϕ i n = 1 , ϕ i n ϕ i m i n ϕ i m a x ϕ i n ϕ i m a x ϕ i m i n , ϕ i m i n ϕ i n ϕ i m a x 0 , ϕ i n ϕ i m i n
where ϕ i n shows the optimality degree of the nth solution of ith objective function. ϕ i m a x and ϕ i m i n are the maximum and minimum values of the solution of objective function i.
The best possible solution is determined by min–max method where the value of ϕ 1 n and ϕ 2 n are calculated by Equations (24) and (25).
ϕ 1 n = L C C m a x L C C n L C C m a x L C C m i n
ϕ 2 n = ϵ m a x ϵ n ϵ m a x ϵ m i n
The minimum value between ϕ 1 n and ϕ 2 n is determined. This value is called the membership function of the nth solution which can be calculated by Equation (26).
ϕ n = m i n ( ϕ 1 n , , ϕ N n ) ; n = 1 , , N P
The solution with maximum lowest membership function can be selected as the best possible solution which is calculated by Equation (27).
ϕ m a x = m a x ( ϕ m a x , , ϕ N P )
The above solution method can be briefly explained by following steps
  • Step-1: Minimize ϕ 1 and ϕ 2 subject to all equal and unequal constraints using MILP;
  • Step-2: Calculate the maximum value of ϕ 1 and ϕ 2 ;
  • Step-3: A number of iterations are considered where in the first iteration, ϕ 2 is minimum and ϕ 1 is maximum. With increasing the number of iteration, ϕ 2 will increase, and in the last iteration, ϕ 2 is the maximum, and ϕ 1 is minimum;
  • Step-4: To select the best possible solution FSM is used. The solutions of the objective functions are converted to per unit values using Equations (24) and (25). Then the membership function and best possible solution can be calculated by Equations (26) and (27), respectively.

7. Result Analysis

Using one-year data for simulation is time-consuming. Selecting random days for simulation could not compute the optimal sizing of RE correctly because of the variation of output power and load demand. The sizing of the HRES could not meet the needs of the load demand if the proper representative days of the entire year were not selected. That is why K-means clustering is used to simplify the yearly data to minimize the computational burden.
In this work, a comparison of 3 case studies is considered to reflect the usefulness of the proposed method.
Case 1: Energy optimization with ADLC—In this case, if there is a shortage of power, cutting off the power supply will occur for all consumers who have a contract with ADLC.
Case 2: Energy optimization with ADLC and residential PV—In case 2, residential PV is considered for some houses. Since these PVs are not connected to the grid, reverse energy will not appear to the grid. Only the consumers who have the residential PV in their home would have the contract of ADLC and face the cut off power supply.
Case 3: Energy optimization with ADLC, residential PV and BESS—In this case, it is considered that some houses have residential PV and BESS. The consumer who owns the residential PV and BESS would have the contract of ADLC and face the cut off power supply.
The results of determining the optimal configuration of these cases are calculated by the selected data based on Section 3. 11 different solutions for each case with the combination of PV, WG, BESS, and DG are obtained in this paper with the variation of epsilon. The LCC, the fuel cost of DG and the carbon emission of each case is listed in, Table 2 shows that the LCC has decreased with the increase in carbon emission. The obtained Pareto set of each case is shown in Figure 7.
Here, the best possible solution of each case is selected by the FSM discussed in Section 5 where the maximum value of ϵ constraint is set to 30% of the maximum value of ϵ .
From the Pareto set, the optimal configuration in case 1 can be achieved at the lowest cost, and in case 2 the LCC is the highest among these three cases.
The result of each case is listed in Table 3 where the maximum value of ϵ -constraint is set to 0% and 30% of the maximum value of ϵ .
Although the LCC, as well as total cost (TC), is low in case 1 in Table 3, the amount of IL is higher than in other cases. Additionally, in this case, contracted consumers cannot benefit from electricity during the cut off electricity because there is no source of electricity generation in the houses. At some point, it will become a burden on consumers.
In case 2, the LCC and TC are higher than in other cases, but IL is 99% low here. As only the houses that own residential PVs will face the cut off power during the shortage; they can use the power generated from PVs while the power interruption. This case can reduce the burden of consumers, but the duck curve phenomenon is occurred by PV generation in the daytime could not be solved.
In case 3, the LCC and TC are higher than case 1 and lower than case 2, and the IL is 95.96% lower than case 1 and higher than case 2. In this case, only the houses that own residential PVs and BESSs will face the cut off power during the shortage. They can use the power generated from PVs and battery storage while the time of power cut off. As there are residential BESS, sometimes the power generated from PVs is used for charging home BESSs. That is why the amount of IL is higher than case 2 here. However, it can slightly solve the duck curve problem. Figure 8, Figure 9 and Figure 10 show the optimal operation of 2 days at 30% carbon emission, respectively.

8. Conclusions

In this paper, a multi-objective optimization model was proposed for optimal sizing of PV, WG, BESS, and DG based HES considering minimum cost and carbon emission utilizing ADLC, residential PV, and BESS program to electrify the remote Aguni Island in Japan. For inspiring consumers to install the residential PV and BESS, ADLC is modeled in a way that only the consumers with residential PV and BESS would have the contract of ADLC, which can significantly reduce the amount of IL. The proposed multi-objective model is solved by the ϵ -constraint method. MILP is applied to obtain all possible solutions of this model, and FSM is responsible for selecting the best solution. Three different case studies are considered here to validate the effectiveness of the DR program with residential PV and BESS. With the variation of epsilon, 11 different results are obtained for each case. FSM has selected the best solution where the value of epsilon is 30%. The best solution illustrates that:
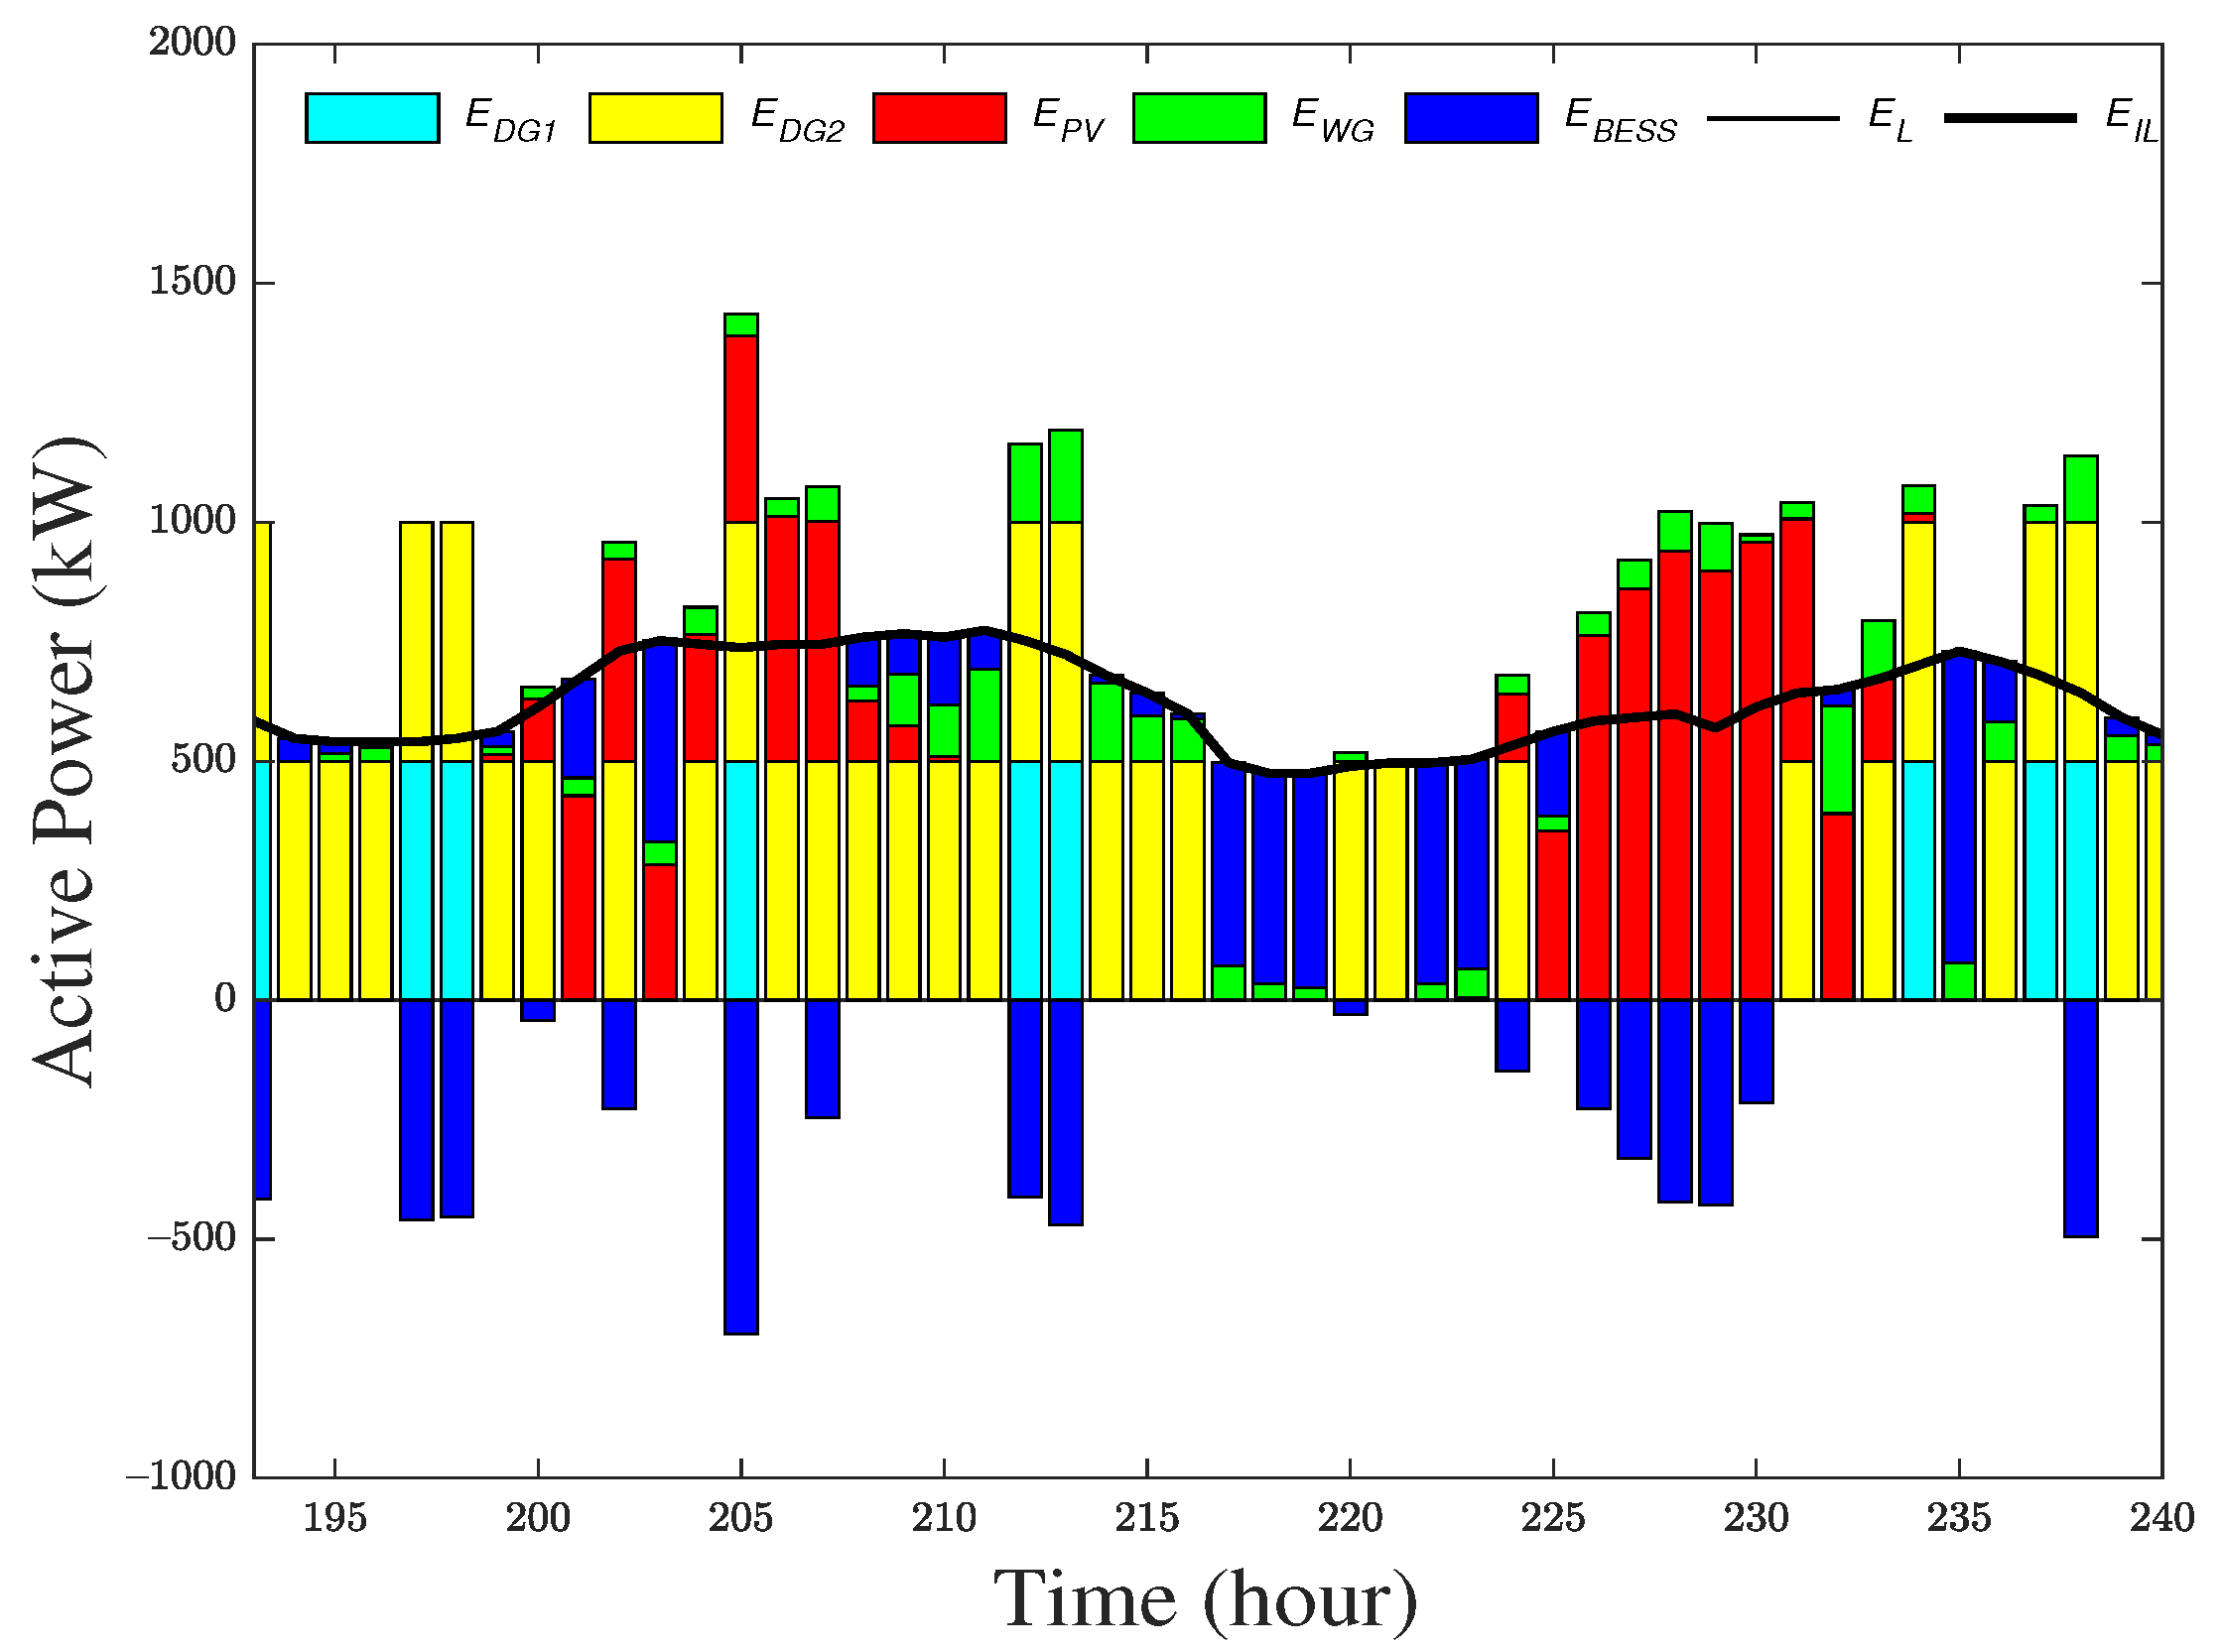
  • In case 1, only ADLC is considered with no home PV and BESS. In this case, the energy demand is fulfilled at the lowest cost, but the amount of IL is very high, which will be a burden for consumers as they cannot be able to use electricity at that time;
  • In case 2, ADLC and home PV is considered where the total energy cost is 11.23% higher than case 1, but the amount of IL is almost 99% lower than case 1;
  • In case 3, ADLC, home PV and home BESS is considered where the total cost is 10% higher than case 1 and the amount of IL is 95.96% lower than case 1.
This paper does not take into account real-time uncertainty in load demand. Specifically, the proposed method considers 18-day sample data from 1 year of historical data. Calculating compensation for ADLC on historical data might have minor bugs due to real-time load uncertainty.

Author Contributions

Conceptualization, H.A.; methodology, H.A.; validation, H.A., H.O.R.H. and T.S.; formal analysis and investigation, H.A. and T.S.; data curation, H.A. and T.S.; writing—original draft preparation, H.A.; writing—review and editing, H.A., H.O.R.H., A.Y.S., P.M. and H.T.; resources and supervision, T.S. All authors have read and agreed to the published version of the manuscript.

Funding

This research received no external funding.

Institutional Review Board Statement

Not applicable.

Informed Consent Statement

Not applicable.

Conflicts of Interest

The authors declare no conflict of interest.

References

  1. Aguni Guide. Available online: https://okijets.com/about/island-guides/aguni-guide/ (accessed on 27 October 2021).
  2. Aguni Island. Available online: https://openjicareport.jica.go.jp/pdf/12265039_02.pdf (accessed on 27 October 2021).
  3. 2019—Understanding the Current Energy Situation in Japan (Part 1). Available online: https://www.enecho.meti.go.jp/en/category/special/article/energyissue2019_01.html (accessed on 27 October 2021).
  4. Japan’s National Greenhouse Gas Emissions. 2016. Available online: https://www.env.go.jp/press/files/en/743.pdf (accessed on 25 August 2021).
  5. Adewuyi, O.B.; Kiptoo, M.K.; Afolayan, A.F.; Amara, T.; Alawode, O.I.; Senjyu, T. Challenges and prospects of Nigeria’s sustainable energy transition with lessons from other countries’ experiences. Energy Rep. 2020, 6, 993–1009. [Google Scholar] [CrossRef]
  6. Management Reference Materials. Available online: https://www.okiden.co.jp/shared/pdf/ir/ar/ar2018/181114_02.pdf (accessed on 25 August 2021).
  7. Fadaee, M.; Radzi, M.A.M. Multi-objective optimization of a stand-alone hybrid renewable energy system by using evolutionary algorithms: A review. Renew. Sustain. Energy Rev. 2012, 16, 3364–3369. [Google Scholar] [CrossRef]
  8. Anoune, K.; Bouya, M.; Astito, A.; Abdellaha, A.B. Sizing methods and optimization techniques for PV-wind based hybrid renewable energy system: A review. Renew. Sustain. Energy Rev. 2018, 93, 652–673. [Google Scholar] [CrossRef]
  9. Masrur, H.; Howlader, H.O.R.; Lotfy, M.E.; Khan, K.R.; Guerrero, J.M.; Senjyu, T. Analysis of Techno-Economic-Environmental Suitability of an Isolated Microgrid System Located in a Remote Island of Bangladesh. Sustainability 2020, 12, 2880. [Google Scholar] [CrossRef] [Green Version]
  10. Fallahi, F.; Maghouli, P. An efficient solution method for integrated unit commitment and natural gas network operational scheduling under “Duck Curve”. Int. Trans. Electr. Energy Syst. 2020, 30, e12662. [Google Scholar] [CrossRef]
  11. Hou, Q.; Zhang, N.; Du, E.; Miao, M.; Peng, F.; Kanga, C. Probabilistic duck curve in high PV penetration power system: Concept, modeling, and empirical analysis in China. Appl. Energy 2019, 242, 205–215. [Google Scholar] [CrossRef]
  12. Liao, J.T.; Chuang, Y.S.; Yang, H.T.; Tsai, M.S. BESS-Sizing Optimization for Solar PV System Integration in Distribution Grid. IFAC-PapersOnLine 2018, 51, 85–90. [Google Scholar] [CrossRef]
  13. Kerdphol, T.; Fuji, K.; Mitani, Y.; Watanabe, M.; Qudaih, Y. Optimization of a battery energy storage system using particle swarm optimization for stand-alone microgrids. Int. J. Electr. Power Energy Syst. 2016, 81, 32–39. [Google Scholar] [CrossRef]
  14. Nguyen, A.-D.; Bui, V.-H.; Hussain, A.; Nguyen, D.-H.; Kim, H.-M. Impact of Demand Response Programs on Optimal Operation of Multi-Microgrid System. Energies 2018, 11, 1452. [Google Scholar] [CrossRef] [Green Version]
  15. Kiptoo, M.K.; Lotfy, M.E.; Adewuyi, O.B.; Conteh, A.; Howlader, A.M.; Senjyu, T. Integrated approach for optimal techno-economic planning for high renewable energy-based isolated microgrid considering cost of energy storage and demand response strategies. Energy Convers. Manag. 2020, 215, 112917. [Google Scholar] [CrossRef]
  16. Demand Response. Available online: https://www.energy.gov/oe/activities/technology-development/grid-modernization-and-smart-grid/demand-response (accessed on 30 August 2021).
  17. The Energy Grid. Available online: https://theenergygrid.com/about-the-principal/energy-articles/134-demand-response-programs.html (accessed on 30 August 2021).
  18. Dakir, S.; Mekki, S.E.; Cornélusse, B. On the number of representative days for sizing microgrids with an industrial load profile. In Proceedings of the 2020 International Conference on Probabilistic Methods Applied to Power Systems (PMAPS) 2020, Liege, Belgium, 18–21 August 2020; pp. 1–6. [Google Scholar]
  19. Nahmmacher, P.; Schmid, E.; Hirth, L.; Knopf, B. Carpe diem: A novel approach to select representative days for long-term power system modeling. Energy 2016, 112, 430–442. [Google Scholar] [CrossRef]
  20. Liu, Y.; Sioshansi, R.; Conejo, A.J. Hierarchical Clustering to Find Representative Operating Periods for Capacity-Expansion Modeling. IEEE Trans. Power Syst. 2018, 33, 3029–3039. [Google Scholar] [CrossRef]
  21. Karmaker, A.K.; Rahman, M.M.; Hossain, M.A.; Ahmed, M.R. Exploration and corrective measures of greenhouse gas emission from fossil fuel power stations for Bangladesh. J. Clean. Prod. 2020, 244, 118645. [Google Scholar] [CrossRef]
  22. Luta, D.N.; Raji, A.K. Optimal sizing of hybrid fuel cell-supercapacitor storage system for off-grid renewable applications. Energy 2019, 166, 530–540. [Google Scholar] [CrossRef]
  23. Krishan, O.; Suhag, S. Techno-economic analysis of a hybrid renewable energy system for an energy poor rural community. J. Energy Storage 2019, 23, 305–319. [Google Scholar] [CrossRef]
  24. Murugaperumal, K.; Srinivasn, S.; Prasad, G.S. Optimum design of hybrid renewable energy system through load forecasting and different operating strategies for rural electrification. Sustain. Energy Technol. Assess. 2020, 37, 100613. [Google Scholar] [CrossRef]
  25. Das, B.K.; Hasan, M.; Rashid, F. Optimal sizing of a grid-independent PV/diesel/pump-hydro hybrid system: A case study in Bangladesh. Sustain. Energy Technol. Assess. 2021, 44, 100997. [Google Scholar] [CrossRef]
  26. Odou, O.D.T.; Bhandari, R.; Adamou, R. Hybrid off-grid renewable power system for sustainable rural electrification in Benin. Renew. Energy 2020, 145, 1266–1279. [Google Scholar] [CrossRef]
  27. Moghaddam, M.J.H.; Kalam, A.; Nowdeh, S.A.; Ahmadi, A.; Babanezhad, M.; Saha, S. Optimal sizing and energy management of stand-alone hybrid photovoltaic/wind system based on hydrogen storage considering LOEE and LOLE reliability indices using flower pollination algorithm. Renew. Energy 2019, 135, 1412–1434. [Google Scholar] [CrossRef]
  28. Suresh, V.; Muralidhar, M.; Kiranmayi, R. Modelling and optimization of an off-grid hybrid renewable energy system for electrification in a rural areas. Energy Rep. 2020, 6, 594–604. [Google Scholar] [CrossRef]
  29. Javed, M.S.; Song, A.; Ma, T. Techno-economic assessment of a stand-alone hybrid solar-wind-battery system for a remote island using genetic algorithm. Energy 2019, 176, 704–717. [Google Scholar] [CrossRef]
  30. Suresh, M.; Meenakumari, R. An improved genetic algorithm-based optimal sizing of solar photovoltaic/wind turbine generator/diesel generator/battery connected hybrid energy systems for standalone applications. Int. J. Ambient. Energy 2021, 42, 1136–1143. [Google Scholar] [CrossRef]
  31. Li, J. Optimal sizing of grid-connected photovoltaic battery systems for residential houses in Australia. Renew. Energy 2019, 136, 1245–1254. [Google Scholar] [CrossRef]
  32. Yimen, N.; Tchotang, T.; Kanmogne, A.; Idriss, I.A.; Musa, B.; Aliyu, A.; Okonkwo, E.C.; Abba, S.I.; Tata, D.; Meva’a, L.; et al. Optimal sizing and techno-economic analysis of hybrid renewable energy systems—A case study of a photovoltaic/wind/battery/diesel system in Fanisau, Northern Nigeria. Processes 2020, 8, 1381. [Google Scholar] [CrossRef]
  33. Wang, Y.; Wang, X.; Yu, H.; Huang, Y.; Dong, H.; Qi, C.; Baptiste, N. Optimal design of integrated energy system considering economics, autonomy and carbon emissions. J. Clean. Prod. 2019, 225, 563–578. [Google Scholar] [CrossRef]
  34. Zhu, W.; Guo, J.; Zhao, G.; Zeng, B. Optimal sizing of an island hybrid microgrid based on improved multi-objective grey wolf optimizer. Processes 2020, 8, 1581. [Google Scholar] [CrossRef]
  35. Du, R.; Zou, P.; Ma, C. Multi-objective optimal sizing of hybrid energy storage systems for grid-connected wind farms using fuzzy control. J. Renew. Sustain. Energy 2021, 13, 014103. [Google Scholar] [CrossRef]
  36. Bukar, A.L.; Tan, C.W.; Lau, K.Y. Optimal sizing of an autonomous photovoltaic/wind/battery/diesel generator microgrid using grasshopper optimization algorithm. Sol. Energy 2019, 188, 685–696. [Google Scholar] [CrossRef]
  37. Sanajaoba, S. Optimal sizing of off-grid hybrid energy system based on minimum cost of energy and reliability criteria using firefly algorithm. Sol. Energy 2019, 188, 655–666. [Google Scholar] [CrossRef]
  38. Jamshidi, M.; Askarzadeh, A. Techno-economic analysis and size optimization of an off-grid hybrid photovoltaic, fuel cell and diesel generator system. Sustain. Cities Soc. 2019, 44, 310–320. [Google Scholar] [CrossRef]
  39. Cai, W.; Li, X.; Maleki, A.; Pourfayaz, F.; Rosen, M.A.; Nazari, M.A.; Bui, D.T. Optimal sizing and location based on economic parameters for an off-grid application of a hybrid system with photovoltaic, battery and diesel technology. Energy 2020, 201, 117480. [Google Scholar] [CrossRef]
  40. Chowdhury, N.; Akram Hossain, C.; Longo, M.; Yaïci, W. Feasibility and Cost Analysis of Photovoltaic-Biomass Hybrid Energy System in Off-Grid Areas of Bangladesh. Sustainability 2020, 12, 1568. [Google Scholar] [CrossRef] [Green Version]
  41. Alberizzi, J.C.; Frigola, J.M.; Rossi, M.; Renzi, M. Optimal sizing of a Hybrid Renewable Energy System: Importance of data selection with highly variable renewable energy sources. Energy Convers. Manag. 2020, 223, 113303. [Google Scholar] [CrossRef]
  42. Ashraf, M.A.; Liu, Z.; Alizadeh, A.A.; Nojavan, S.; Jermsittiparsert, K.; Zhang, D. Designing an optimized configuration for a hybrid PV/Diesel/Battery Energy System based on metaheuristics: A case study on Gobi Desert. J. Clean. Prod. 2020, 270, 122467. [Google Scholar] [CrossRef]
  43. Fodhil, F.; Hamidat, A.; Nadjemi, O. Potential, optimization and sensitivity analysis of photovoltaic-diesel-battery hybrid energy system for rural electrification in Algeria. Energy 2019, 169, 613–624. [Google Scholar] [CrossRef]
  44. Eslahi, M.; Nematollahi, A.F.; Vahidi, B. Day-Ahead scheduling of centralized energy storage system in electrical networks by proposed stochastic MILP-Based bi-objective optimization approach. Electr. Power Syst. Res. 2021, 192, 106915. [Google Scholar] [CrossRef]
  45. Yang, X.; Leng, Z.; Xu, S.; Yang, C.; Yang, L.; Liu, K.; Song, Y.; Zhang, L. Multi-objective optimal scheduling for CCHP microgrids considering peak-load reduction by augmented ϵ -constraint method. Renew. Energy 2021, 172, 408–423. [Google Scholar] [CrossRef]
  46. Wattanasaeng, N.; Ransikarbum, K. Model and Analysis of Economic-and Risk-Based Objective Optimization Problem for Plant Location within Industrial Estates Using Epsilon-Constraint Algorithms. Computation 2021, 9, 46. [Google Scholar] [CrossRef]
  47. Kamjoo, A.; Maheri, A.; Putrus, G.A. Chance constrained programming using non-Gaussian joint distribution function in design of standalone hybrid renewable energy systems. Energy 2014, 66, 677–688. [Google Scholar] [CrossRef]
  48. Li, D.; Chiu, W.-Y.; Sun, H. Demand Side Management in Microgrid Control Systems. Microgrid 2017, 203–230. [Google Scholar]
  49. Chen, C. Demand response: An enabling technology to achieve energy efficiency in a smart grid. In Application of Smart Grid Technologies; Academic Press: Cambridge, MA, USA, 2018; pp. 143–171. [Google Scholar]
  50. Elbow Method. Available online: https://www.scikit-yb.org/en/latest/api/cluster/elbow.html (accessed on 30 August 2021).
  51. Sugimura, M.; Gamil, M.; Akter, H.; Krishnan, N.; Abdel-Akher, M.; Mandal, P.; Senjyu, T. Optimal sizing and operation for microgrid with renewable energy considering two types demand response. J. Renew. Sustain. Energy 2020, 12, 065901. [Google Scholar] [CrossRef]
  52. Poncelet, K.; Höschle, H.; Delarue, E.; Virag, A.; D’haeseleer, W. Selecting Representative Days for Capturing the Implications of Integrating Intermittent Renewables in Generation Expansion Planning Problems. IEEE Trans. Power Syst. 2017, 32, 1936–1948. [Google Scholar] [CrossRef] [Green Version]
Figure 1. Proposed power system model.
Energies 14 07599 g001
Figure 2. Data selection method.
Energies 14 07599 g002
Figure 3. Data set of load demand.
Energies 14 07599 g003
Figure 4. Elbow point identification.
Energies 14 07599 g004
Figure 5. Representative days selected by clustering.
Energies 14 07599 g005
Figure 6. Actual and Obtained dataset. Subfigure (a) represented the actual and obtained load profile by clustering. Subfigure (b) represented the actual and obtained PV power generation by clustering. Subfigure (c) represented the actual and obtained WG power generation by clustering.
Energies 14 07599 g006
Figure 7. Pareto set of each case.
Energies 14 07599 g007
Figure 8. Operation schedule of 2 days (Case 1).
Energies 14 07599 g008
Figure 9. Operation schedule of 2 days (Case 2).
Energies 14 07599 g009
Figure 10. Operation schedule of 2 days (Case 3).
Energies 14 07599 g010
Table 1. Parameters of installed components.
EquipmentParametersValues
PVRated power (kW)500
Lifetime (Years)30
Capital cost (Million of JPY)0.299
Operation and maintenance6000
cost (JPY/kW-year)
Replacement cost (Million of JPY)0.294
Panel area (m2)3400
Efficiency (%)12.3
WGRated power (kW)250
Lifetime (Years)20
Capital cost (Million of JPY)0.342
Operation and maintenance15,200
cost (JPY/kW-year)
Replacement cost (Million of JPY)0.342
Hub height (m)40
Cut in wind speed (m/s)3
Cut out wind speed (m/s)25
BESSRated power (kW)200/1200 kWh
Max SoC0.8
Min SoC0.2
Charging efficiency0.9
Discharging efficiency0.9
Lifetime (Years)15
Capital cost (Million of JPY/kW)0.302
Operation and maintenance8000
cost (JPY/kW-year)
Replacement cost (Million of JPY/kW)0.302
DGHeating value (kJ/kW)9970
Cost of C fuel oil (Million of JPY/kL)0.067
Heating value of C41.9 × 106
fuel oil (kJ/kL)
Conversion factor of CO2 per0.0715
calorific value (tCO2/GJ)
Table 2. Cost of each iteration.
ϵ LCC (Million of JPY)CDG (Million of JPY)CO2 (tCO2)
Case 1Case 2Case 3
011.9214.5314.3400
0.17.439.498.721.4727.80
0.25.887.516.762.9655.96
0.33.454.834.654.4584.12
0.42.073.353.195.94112.27
0.51.472.671.817.43140.43
0.61.032.161.298.92168.59
0.70.610.860.7810.39196.39
0.80.350.520.5211.88224.55
0.900.26013.37252.71
100014.86280.86
Table 3. Simulation results of each case.
ϵ (CO2)Case 1Case 2Case 3
At 0%At 30%At 0%At 30%At 0%At 30%
PV [500 kW/unit]133144157
WG [250 kW/unit]7285114
BESS [(200 kW/1200 kWh)/unit]176245172
LCC (Million of Yen)11.923.4514.524.8314.334.65
Fuel cost of DG (Million of Yen)04.4504.4504.45
Compensation cost (Million of yen)0.093.940.0170.0270.7040.159
Total Cost (Million of Yen)12.028.3014.529.2914.349.13
Interruptible loads (kWh)9.3439.40.1650.270.7041.59
Amount of carbon emission (tCO2)084.12084.12084.12
Publisher’s Note: MDPI stays neutral with regard to jurisdictional claims in published maps and institutional affiliations.

