
Synergies between Direct Air Capture Technologies and Solar Thermochemical Cycles in the Production of Methanol


Abstract
: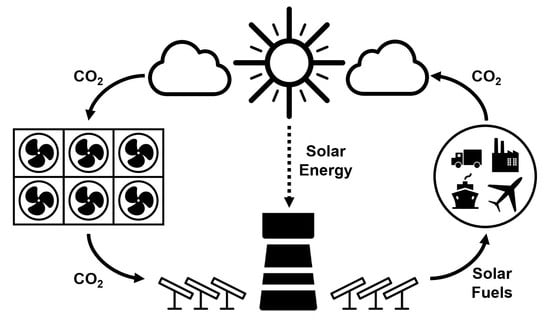
1. Introduction
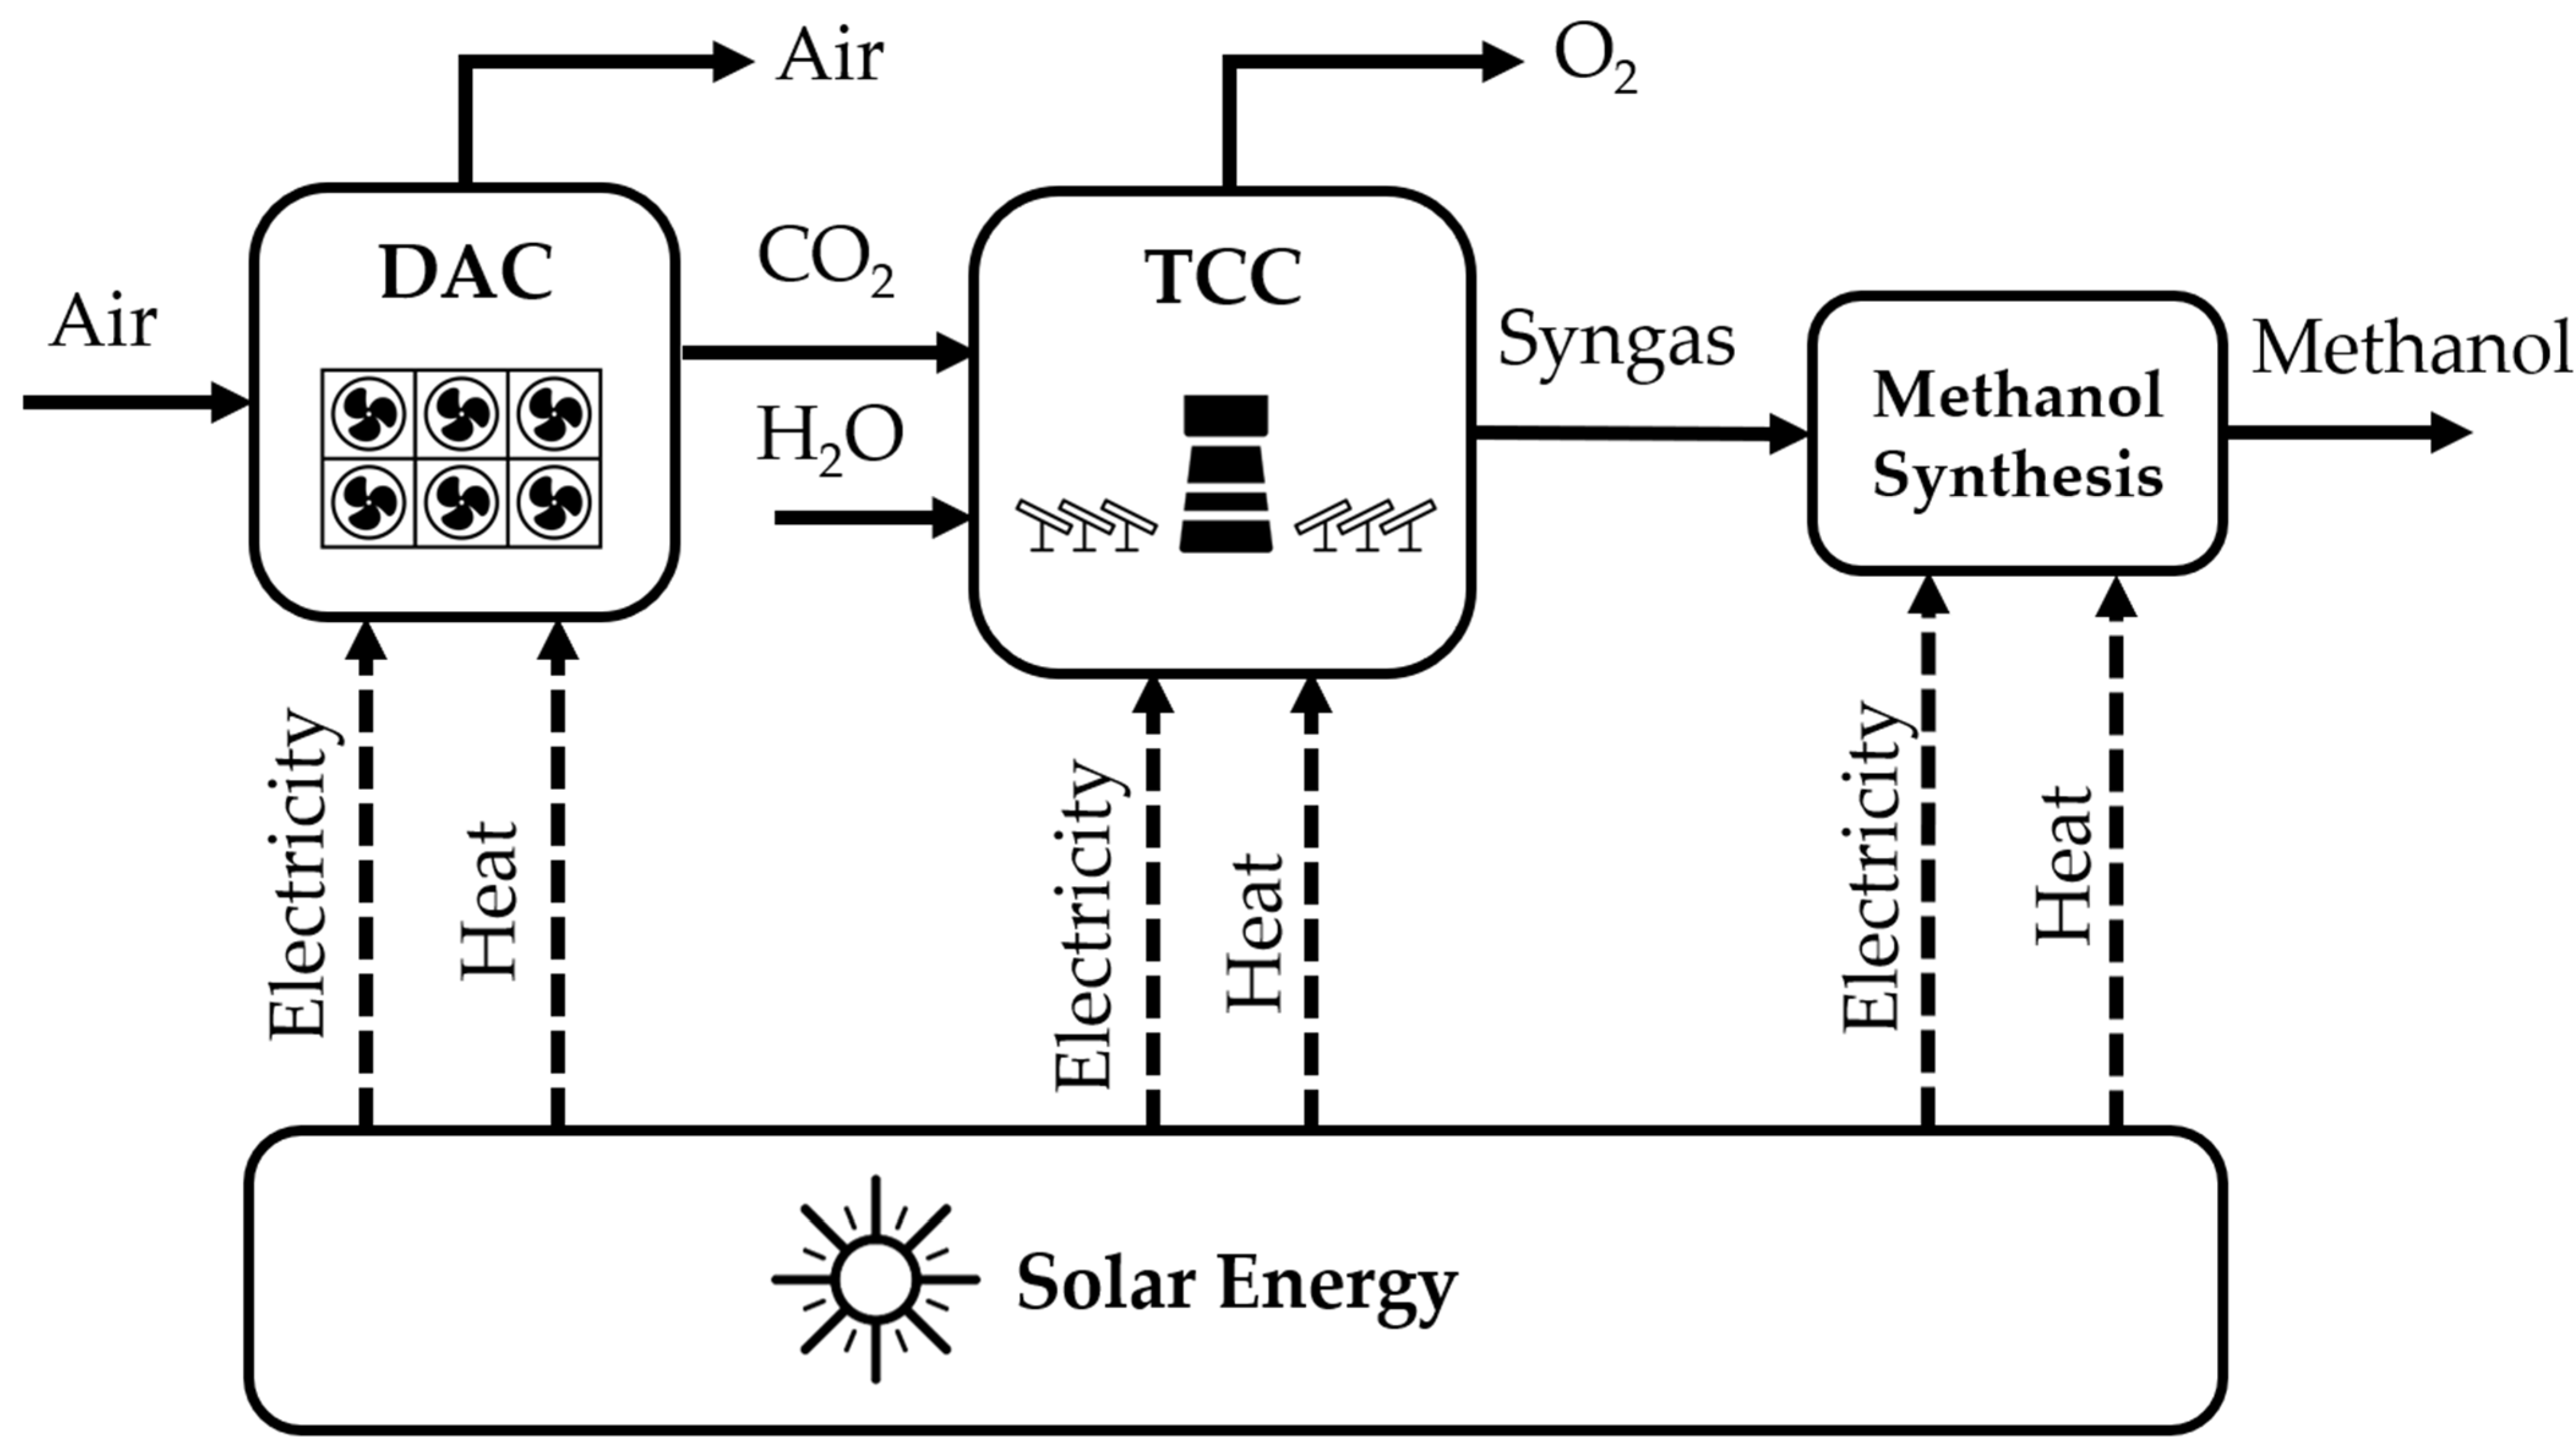
2. Methodology
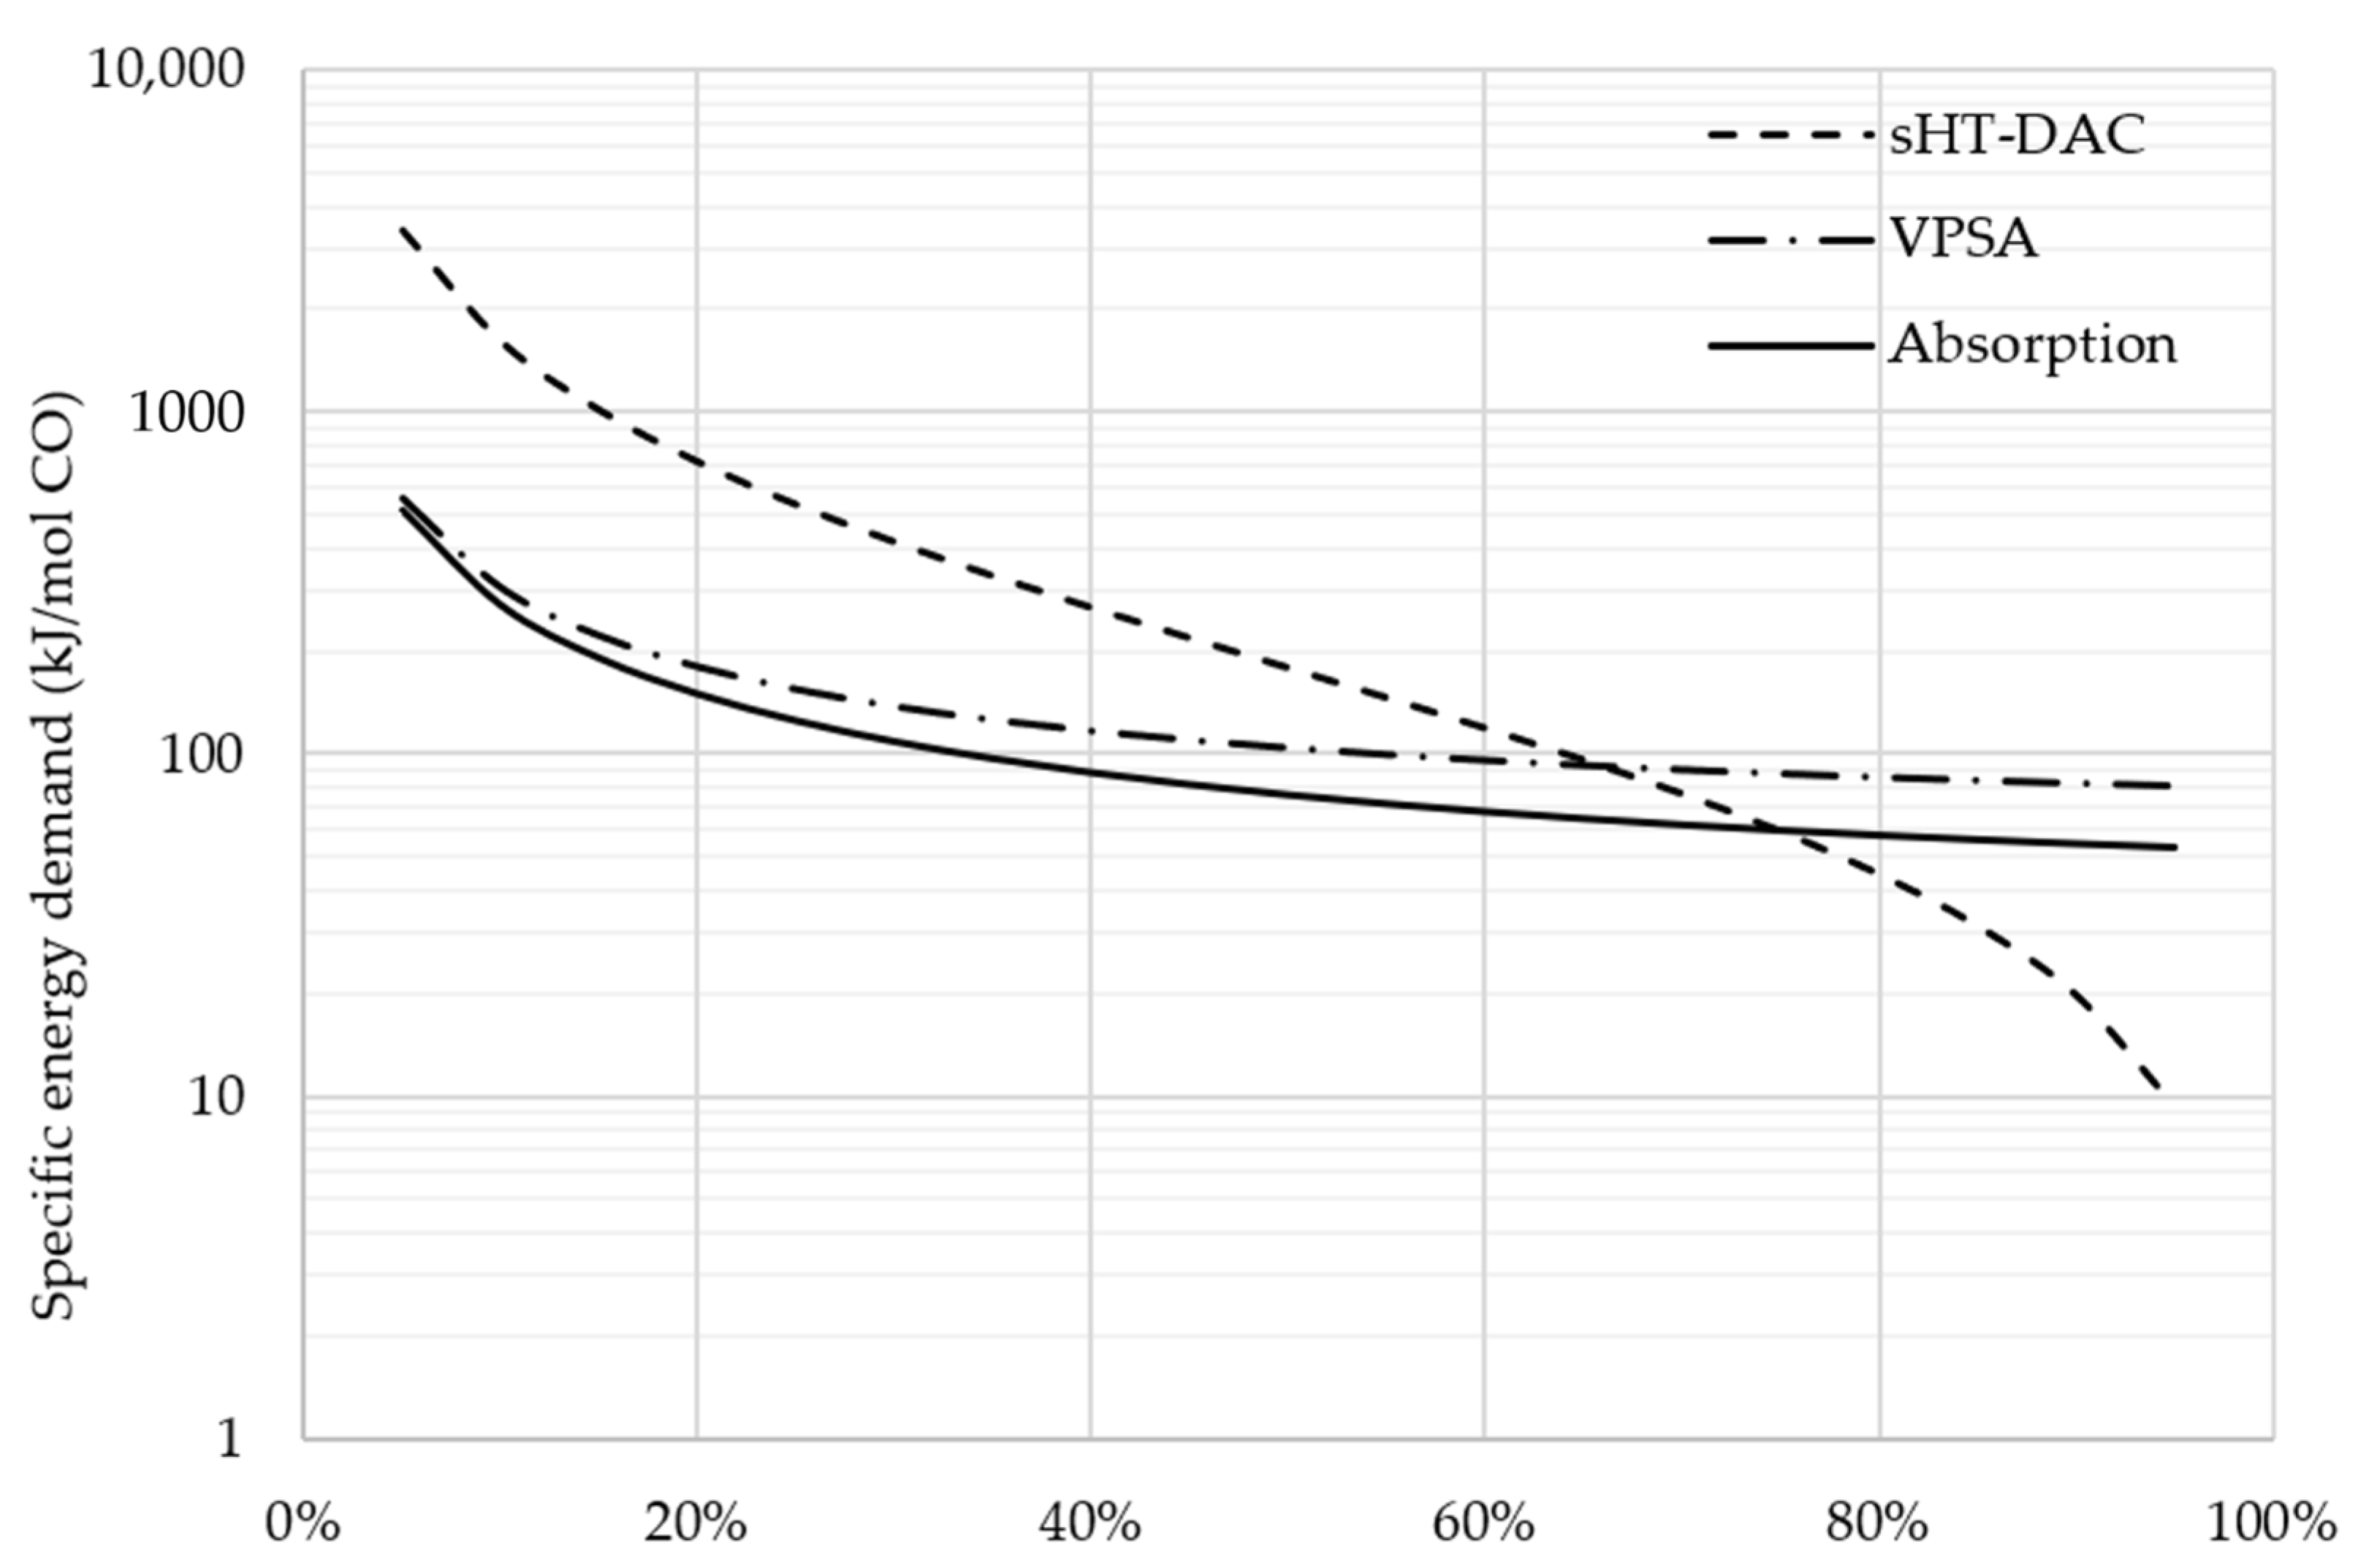
2.1. Modelling of DAC
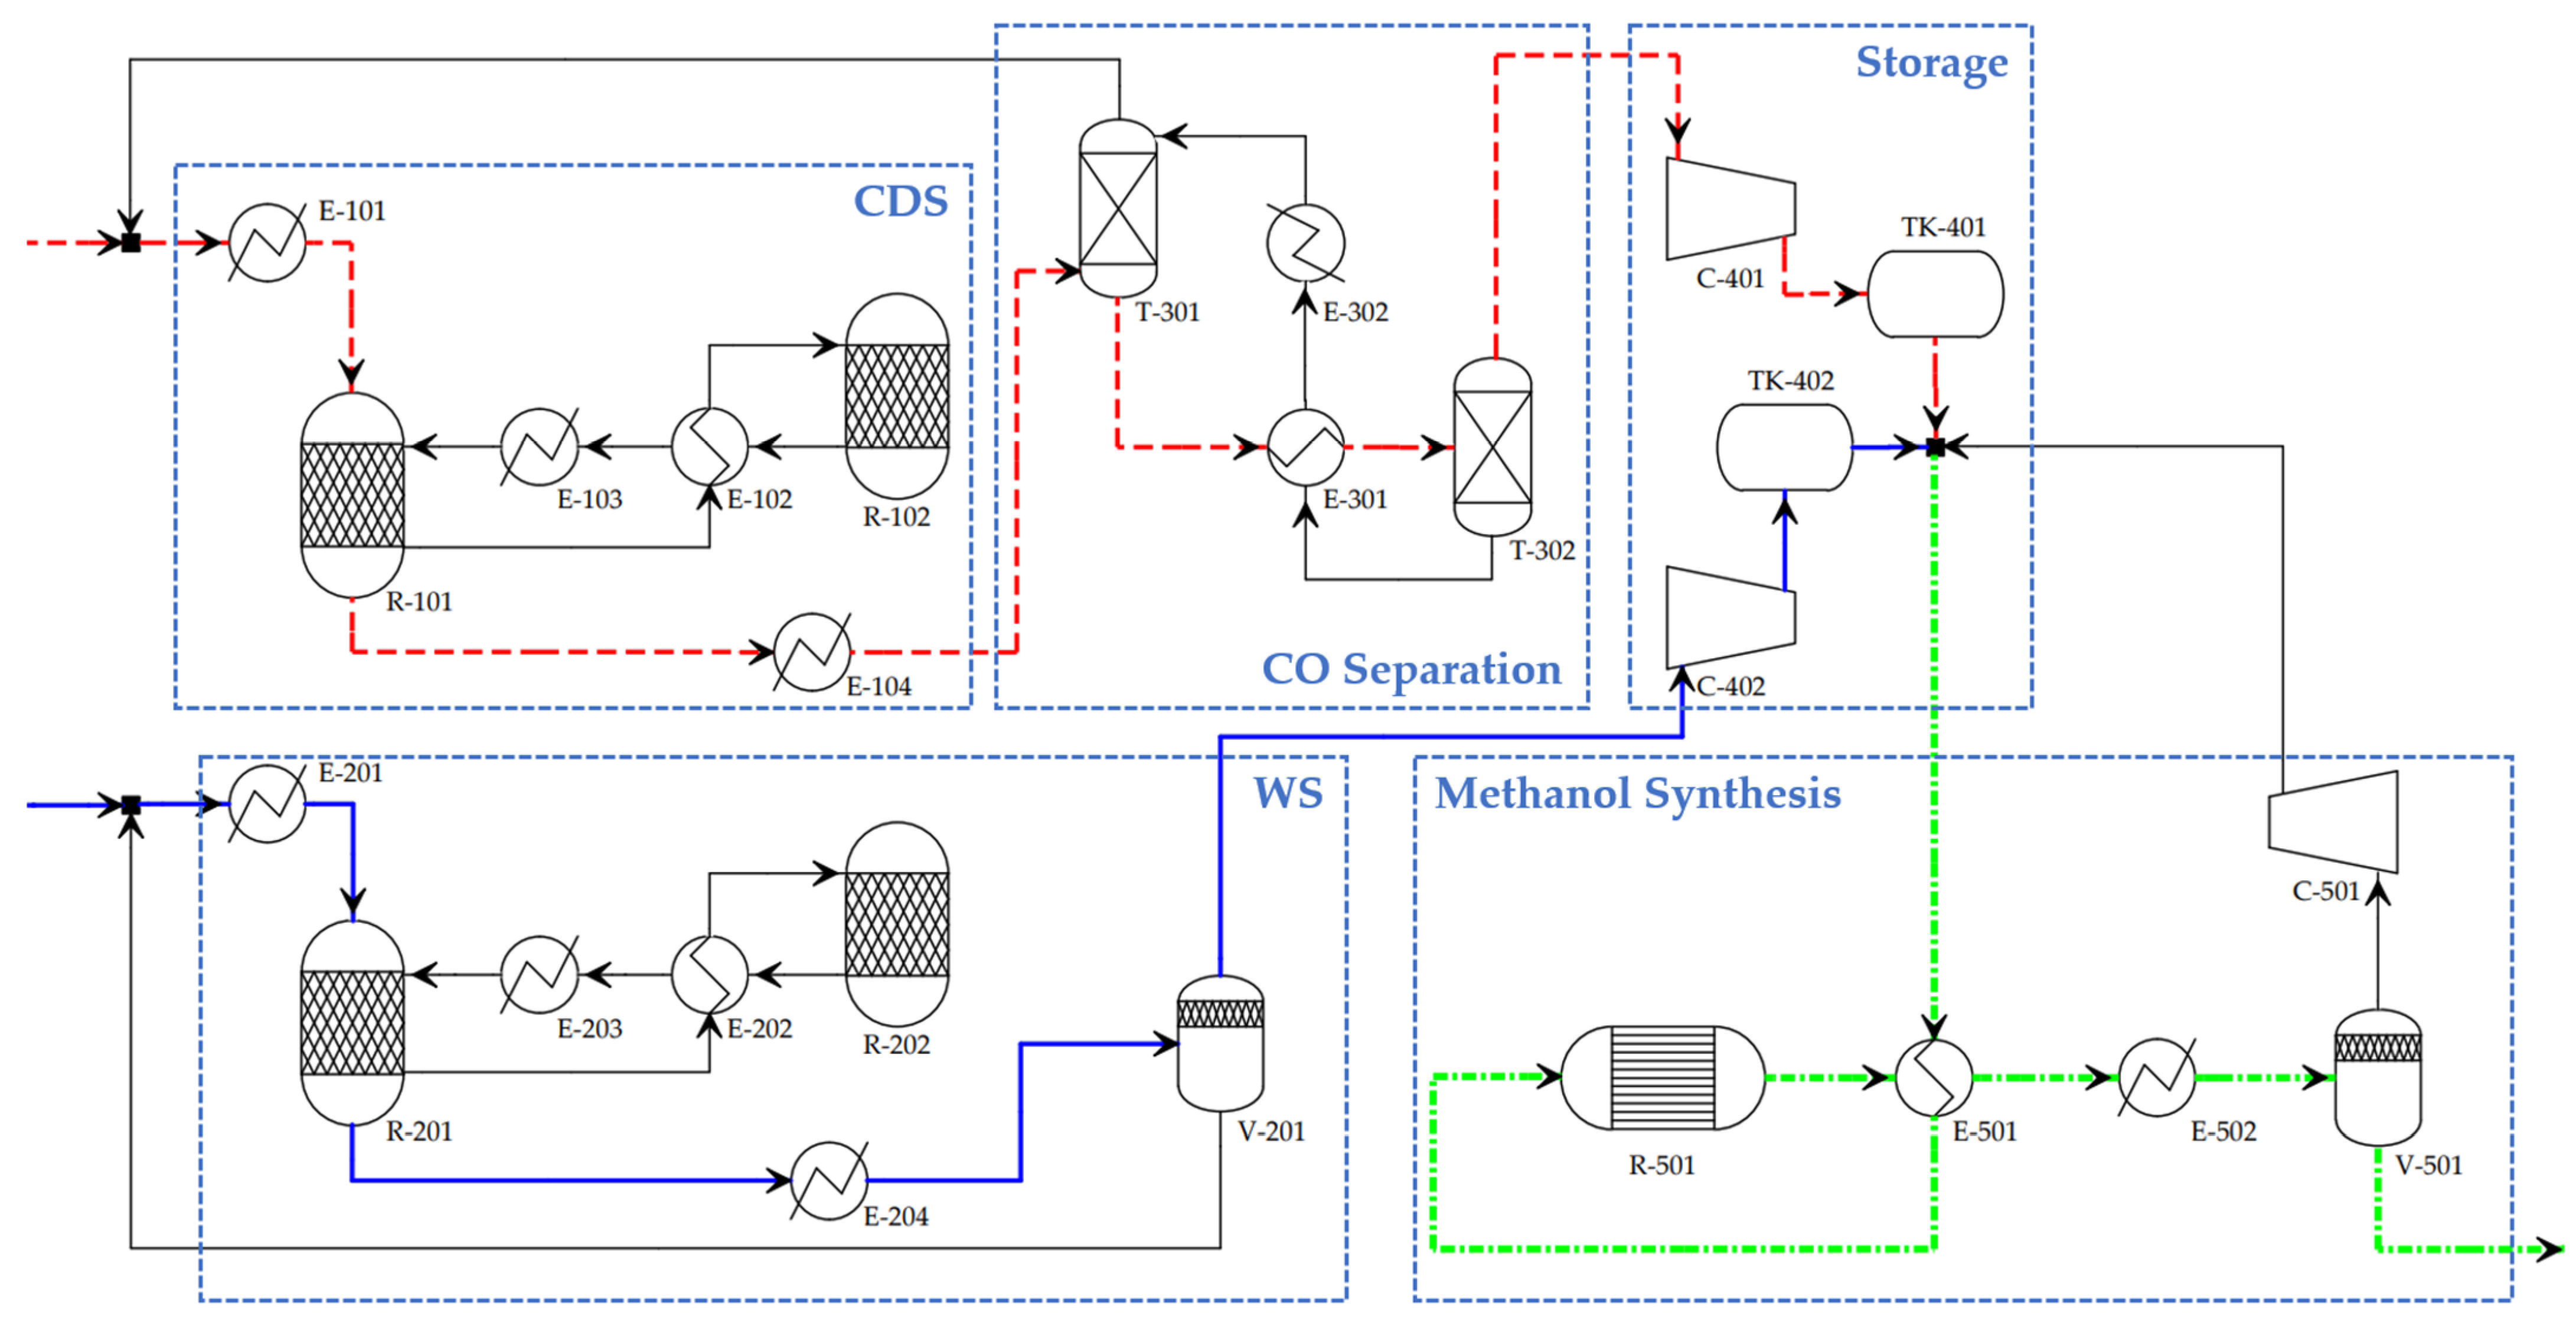
2.2. Modelling of TCC and Methanol Synthesis
2.3. Modelling of Auxiliary Equipment
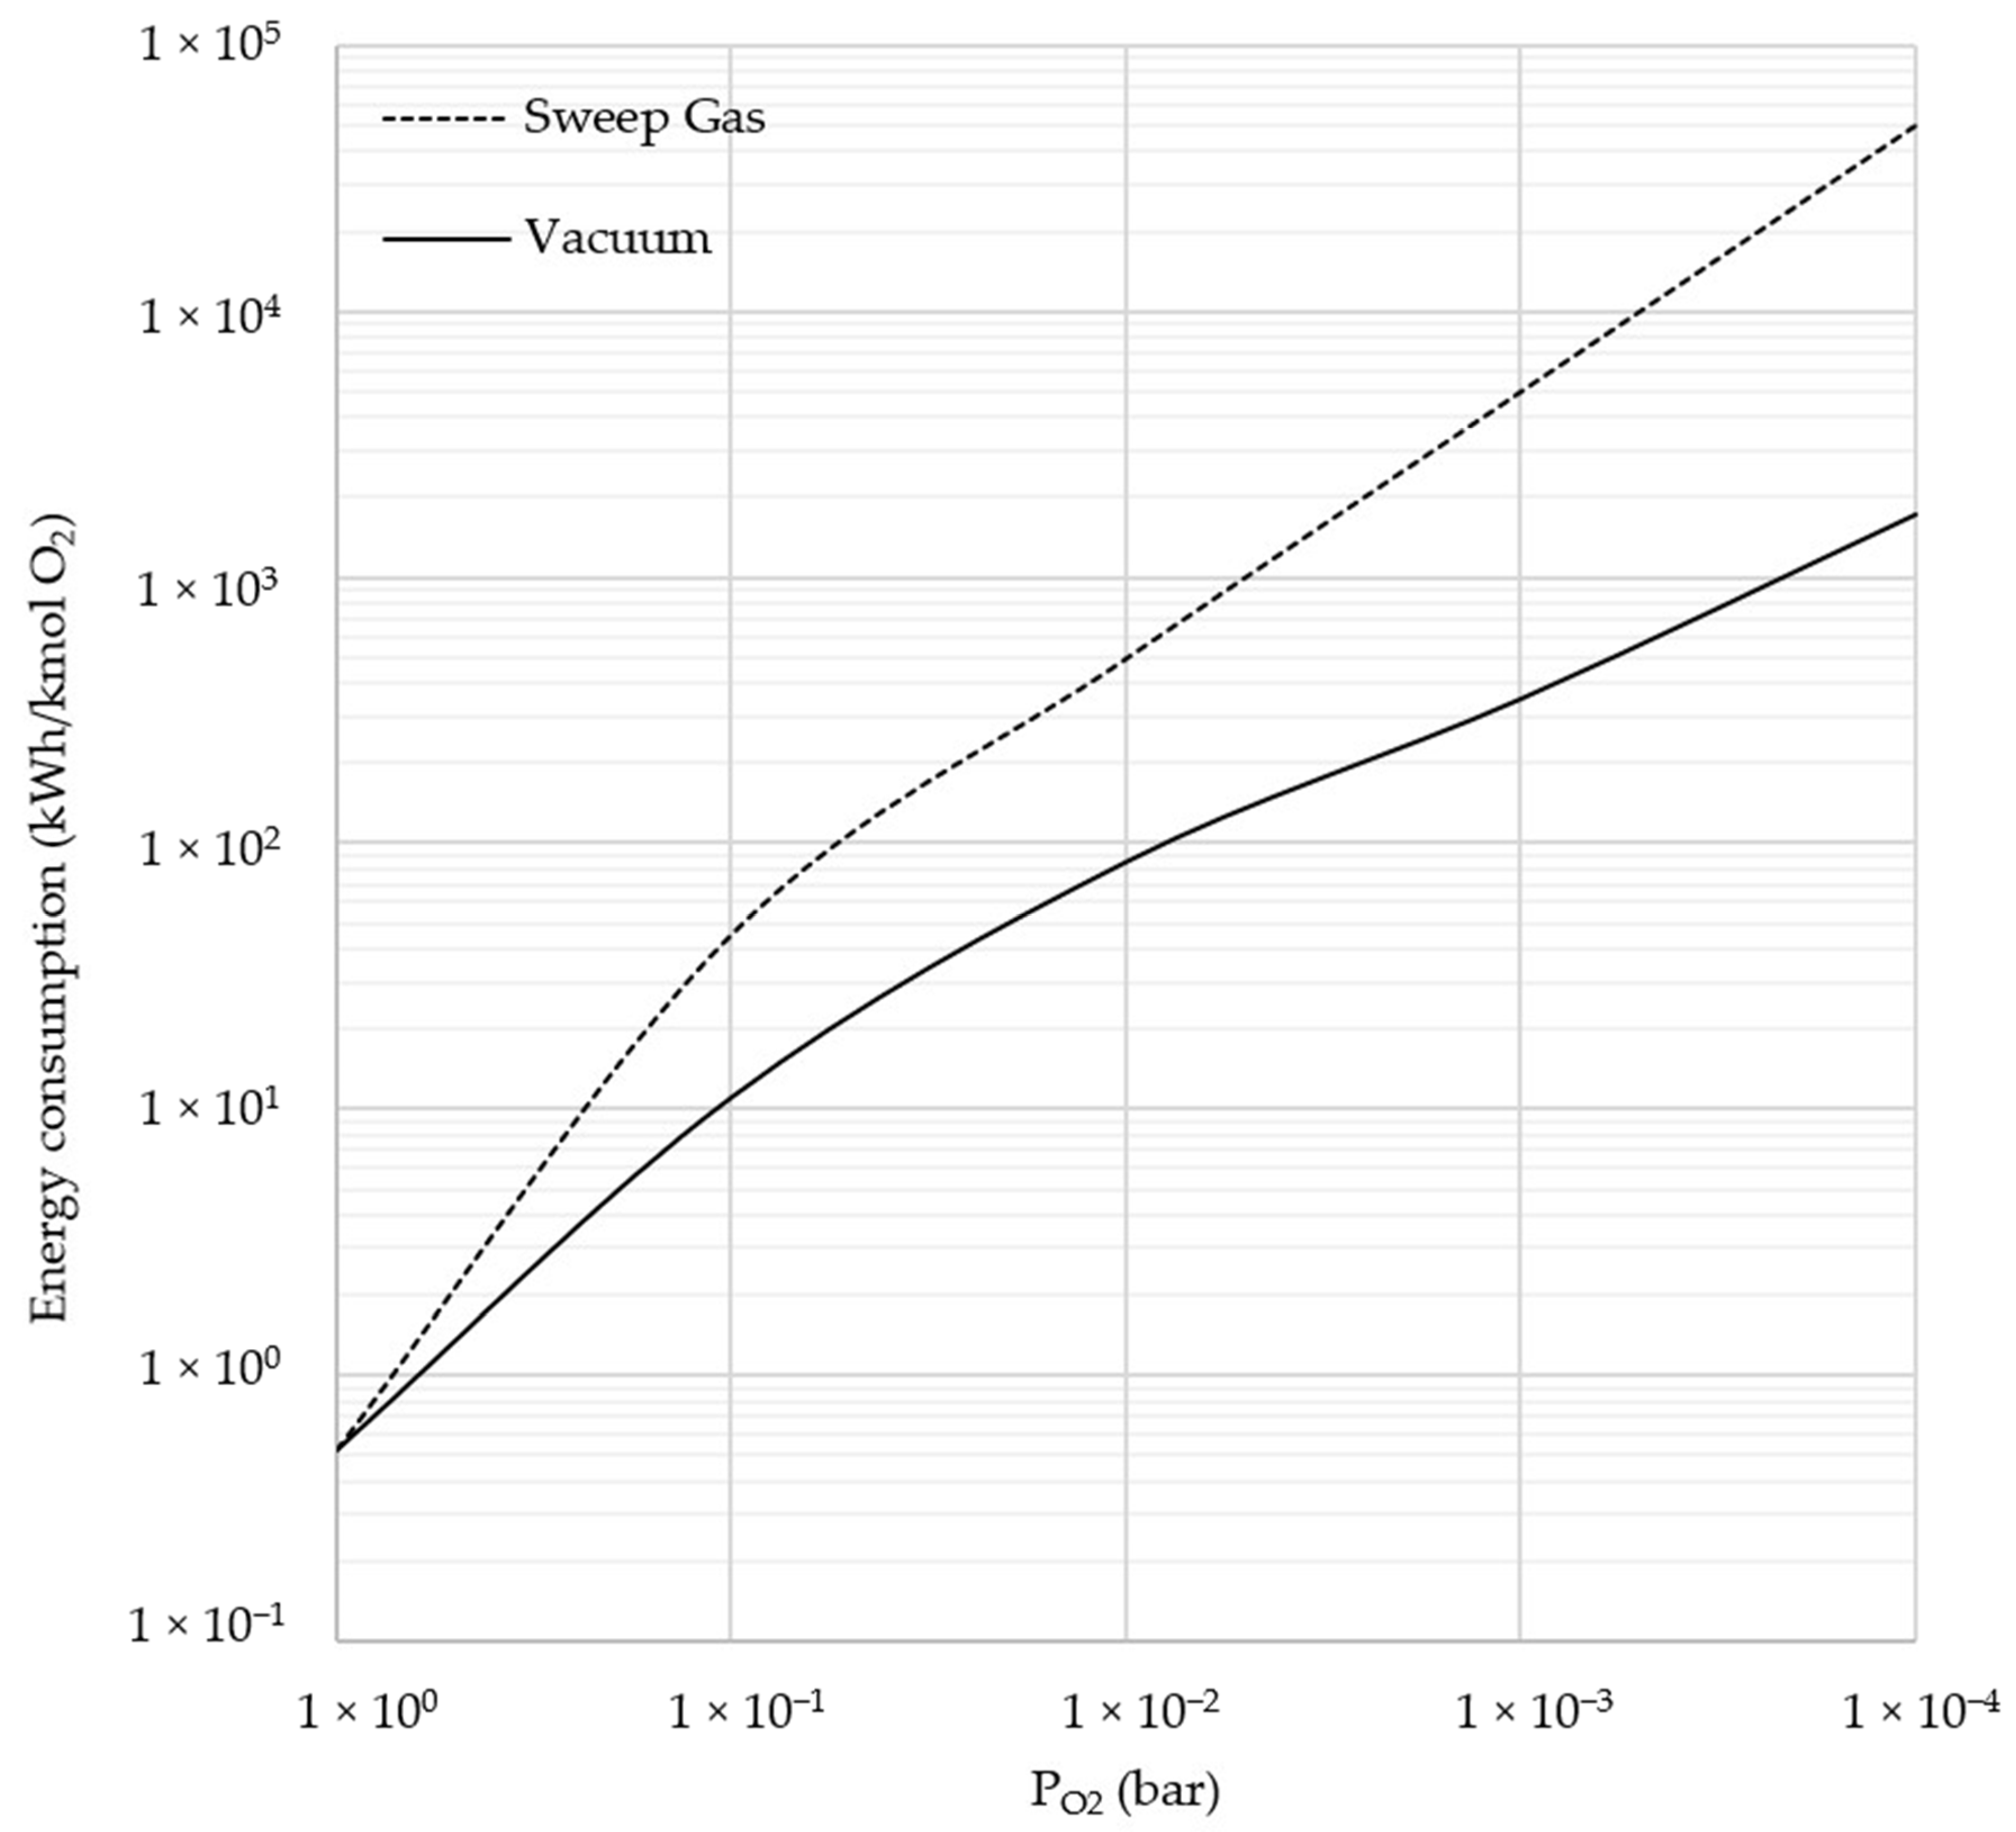
2.3.1. Sweep Gas and Vacuum
2.3.2. Heat Integration and Waste Heat Exploitation
2.3.3. Water Desalination
2.4. Considered Scenarios
3. Results and Discussion
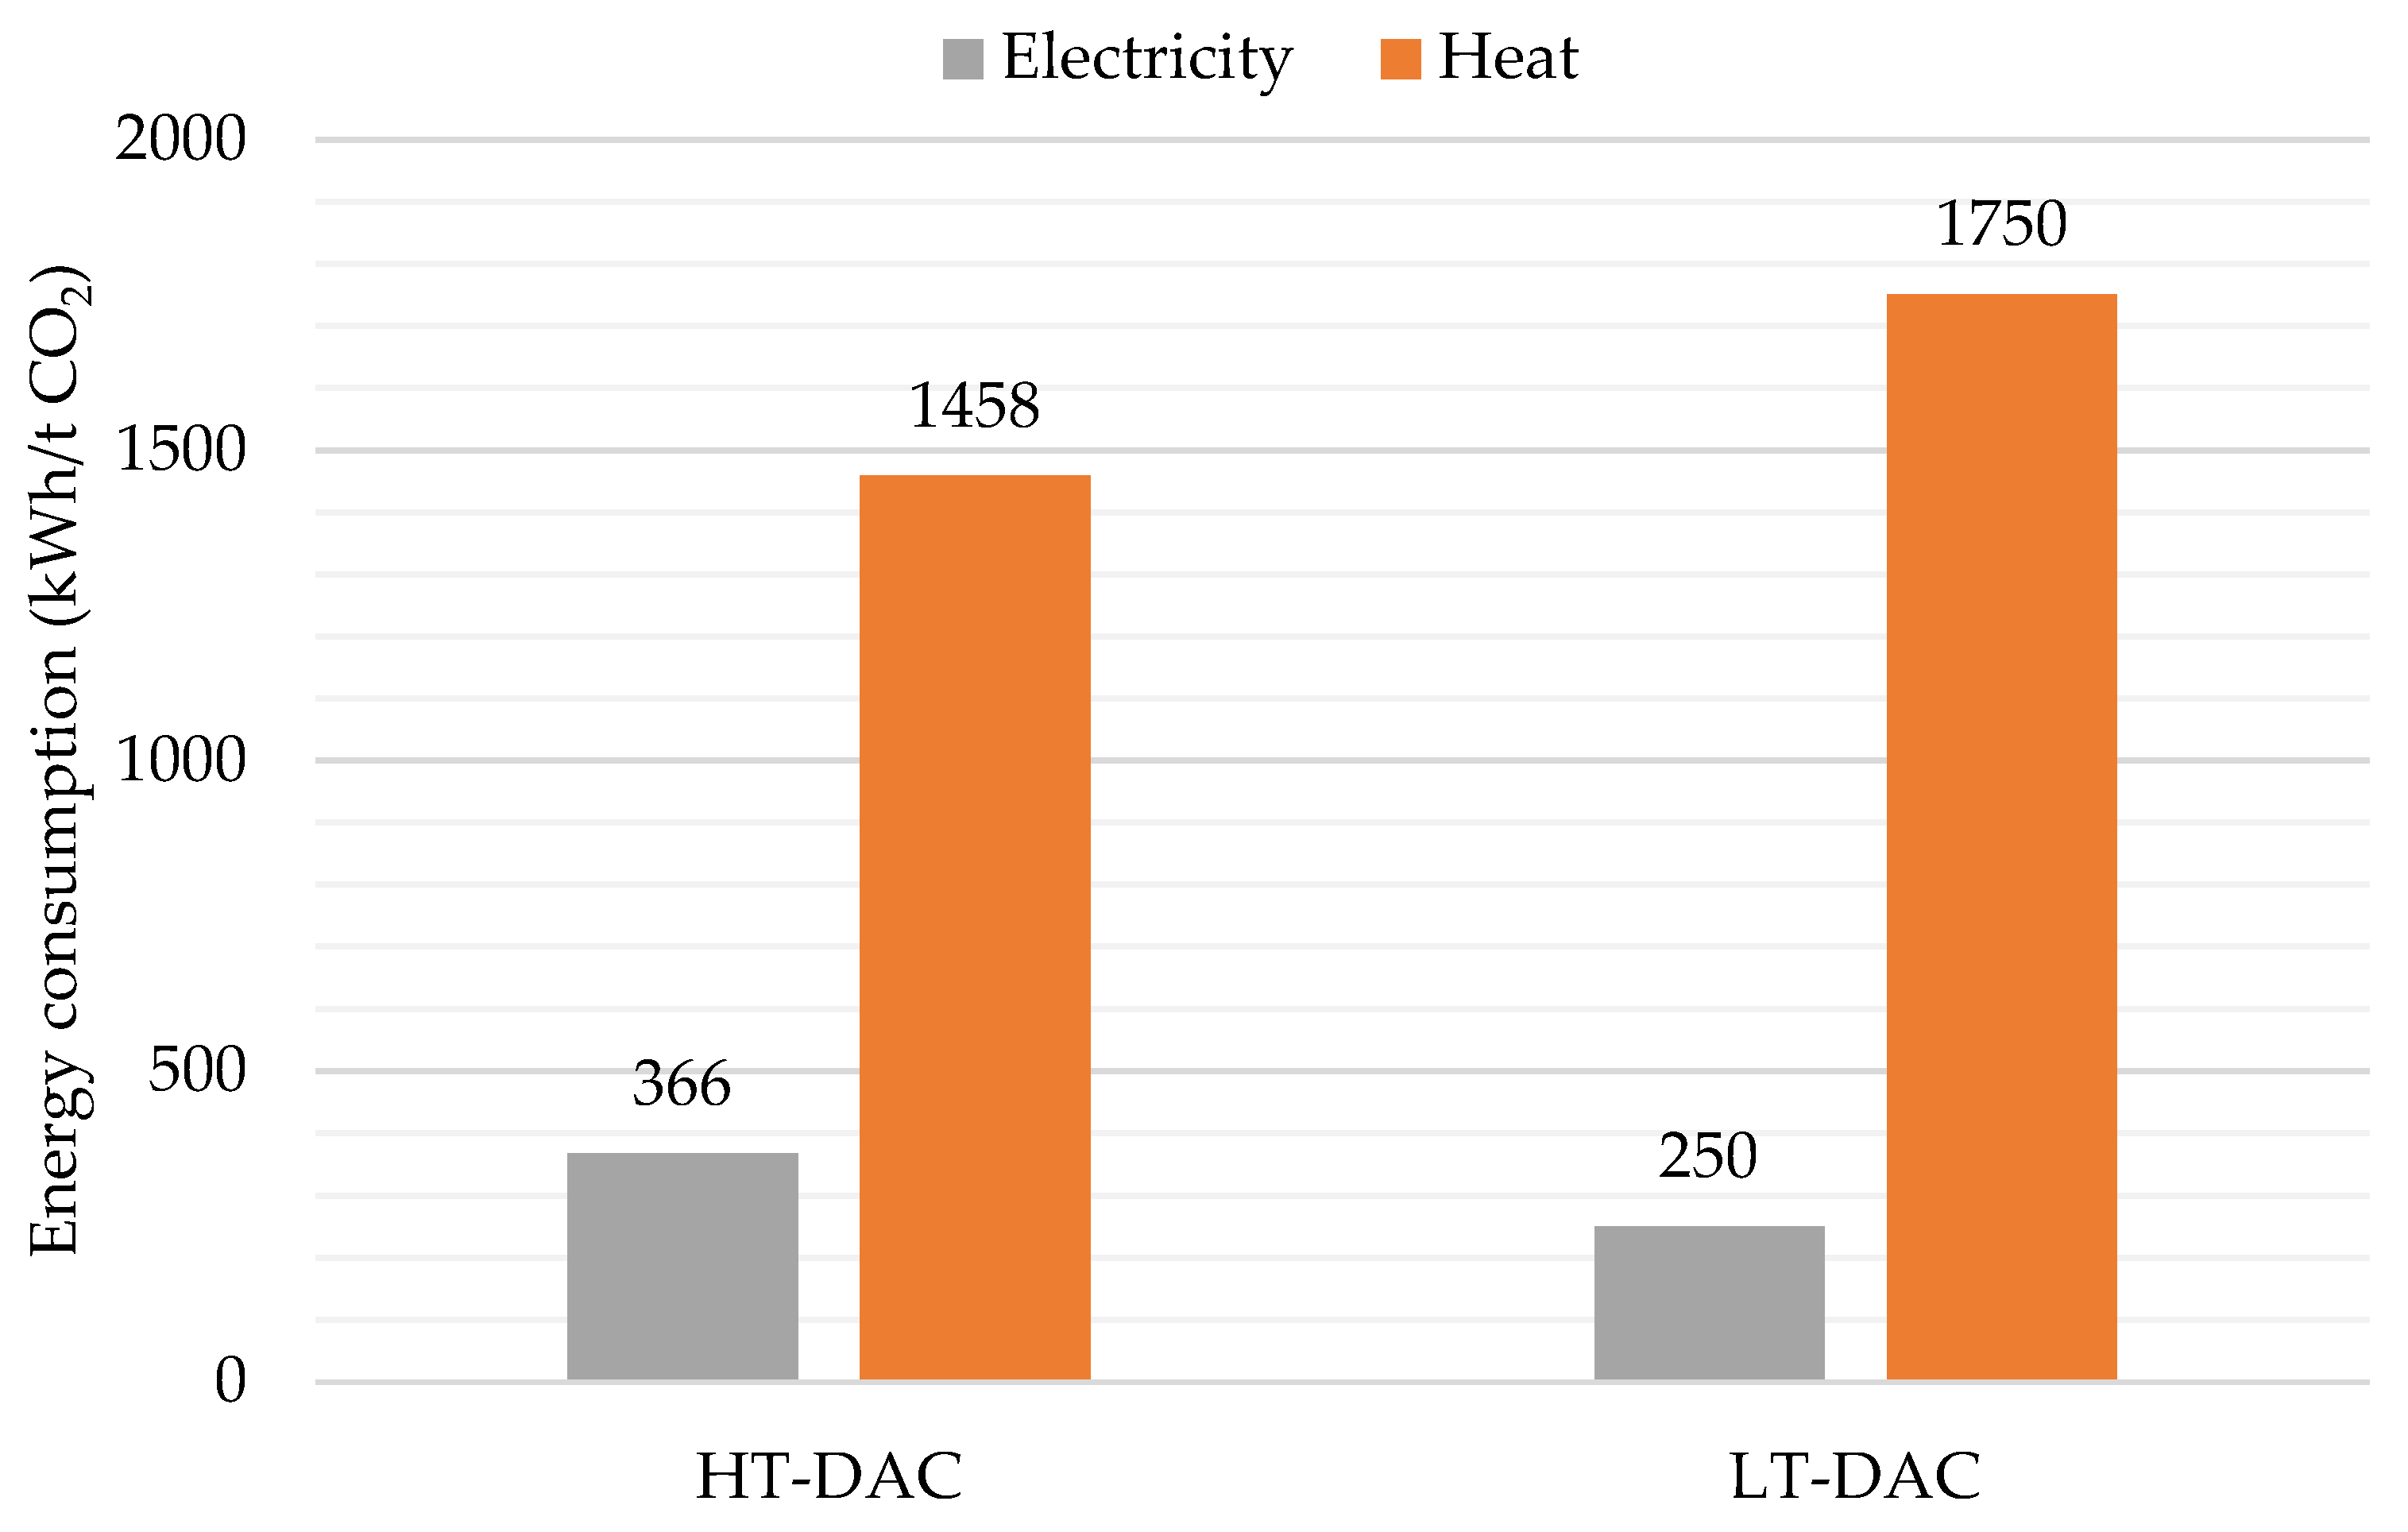
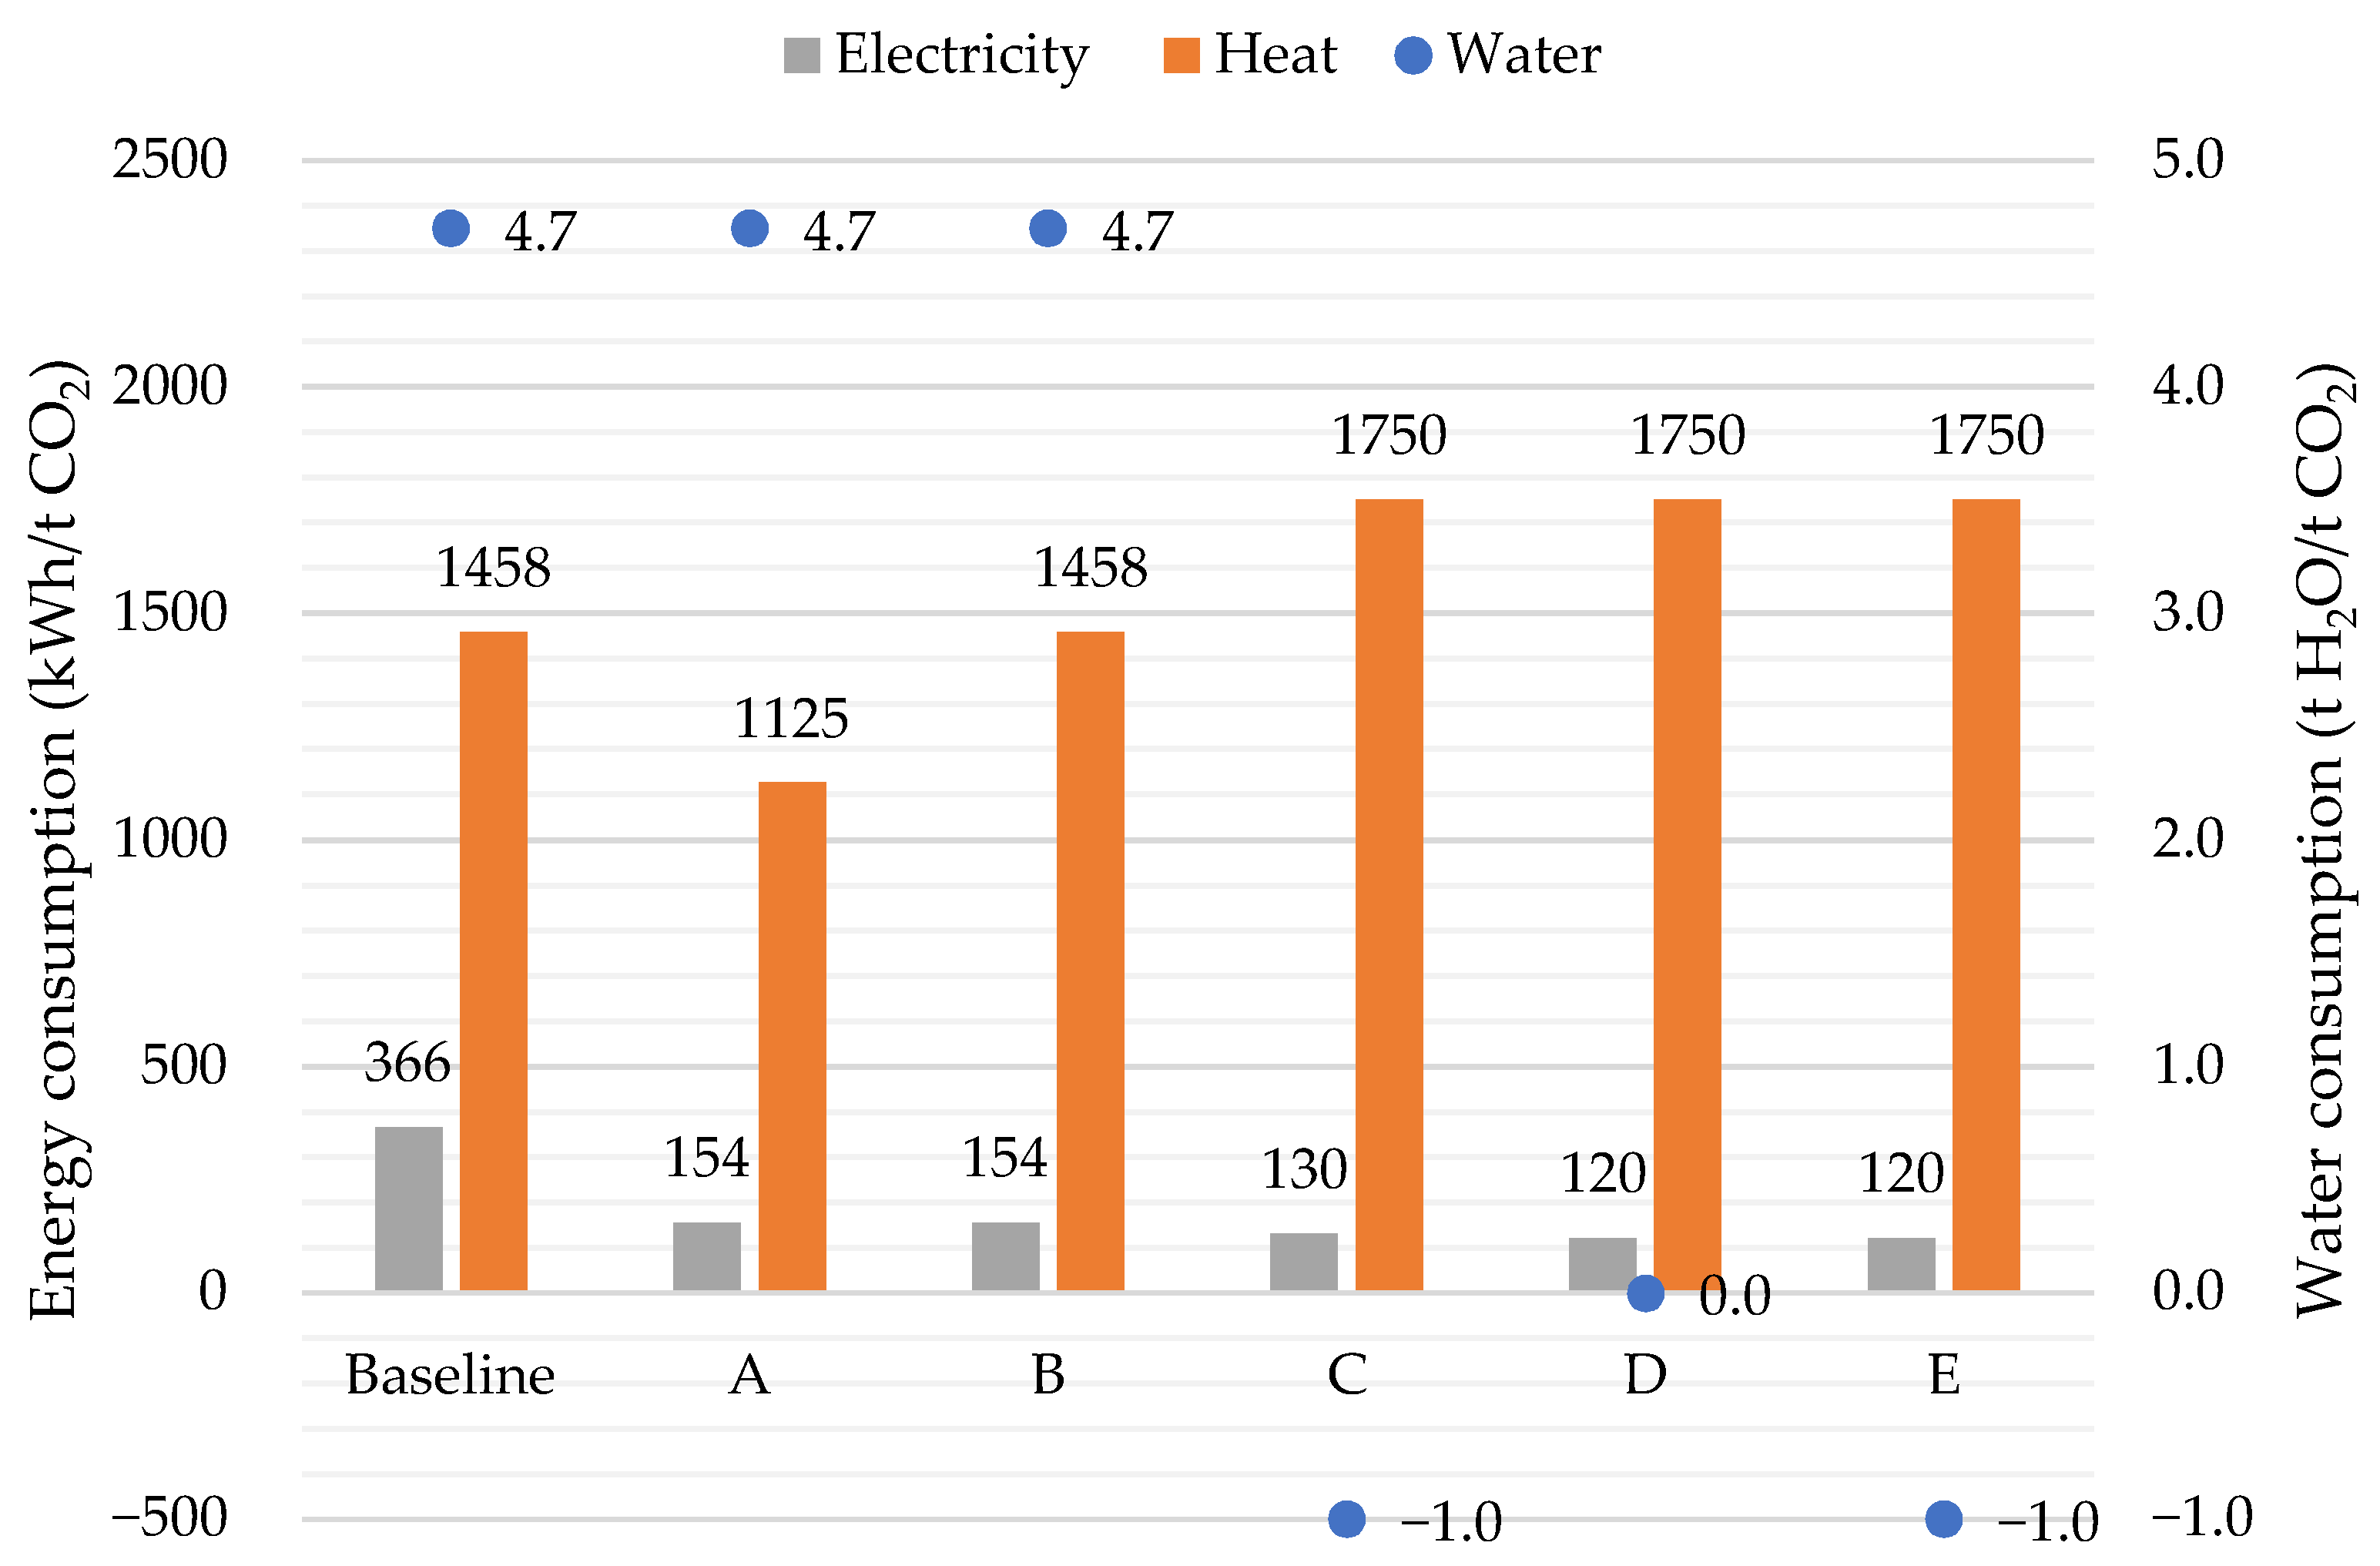
3.1. DAC: Energy and Water Consumption
3.2. Synthetic Fuel Production: Energy Consumption
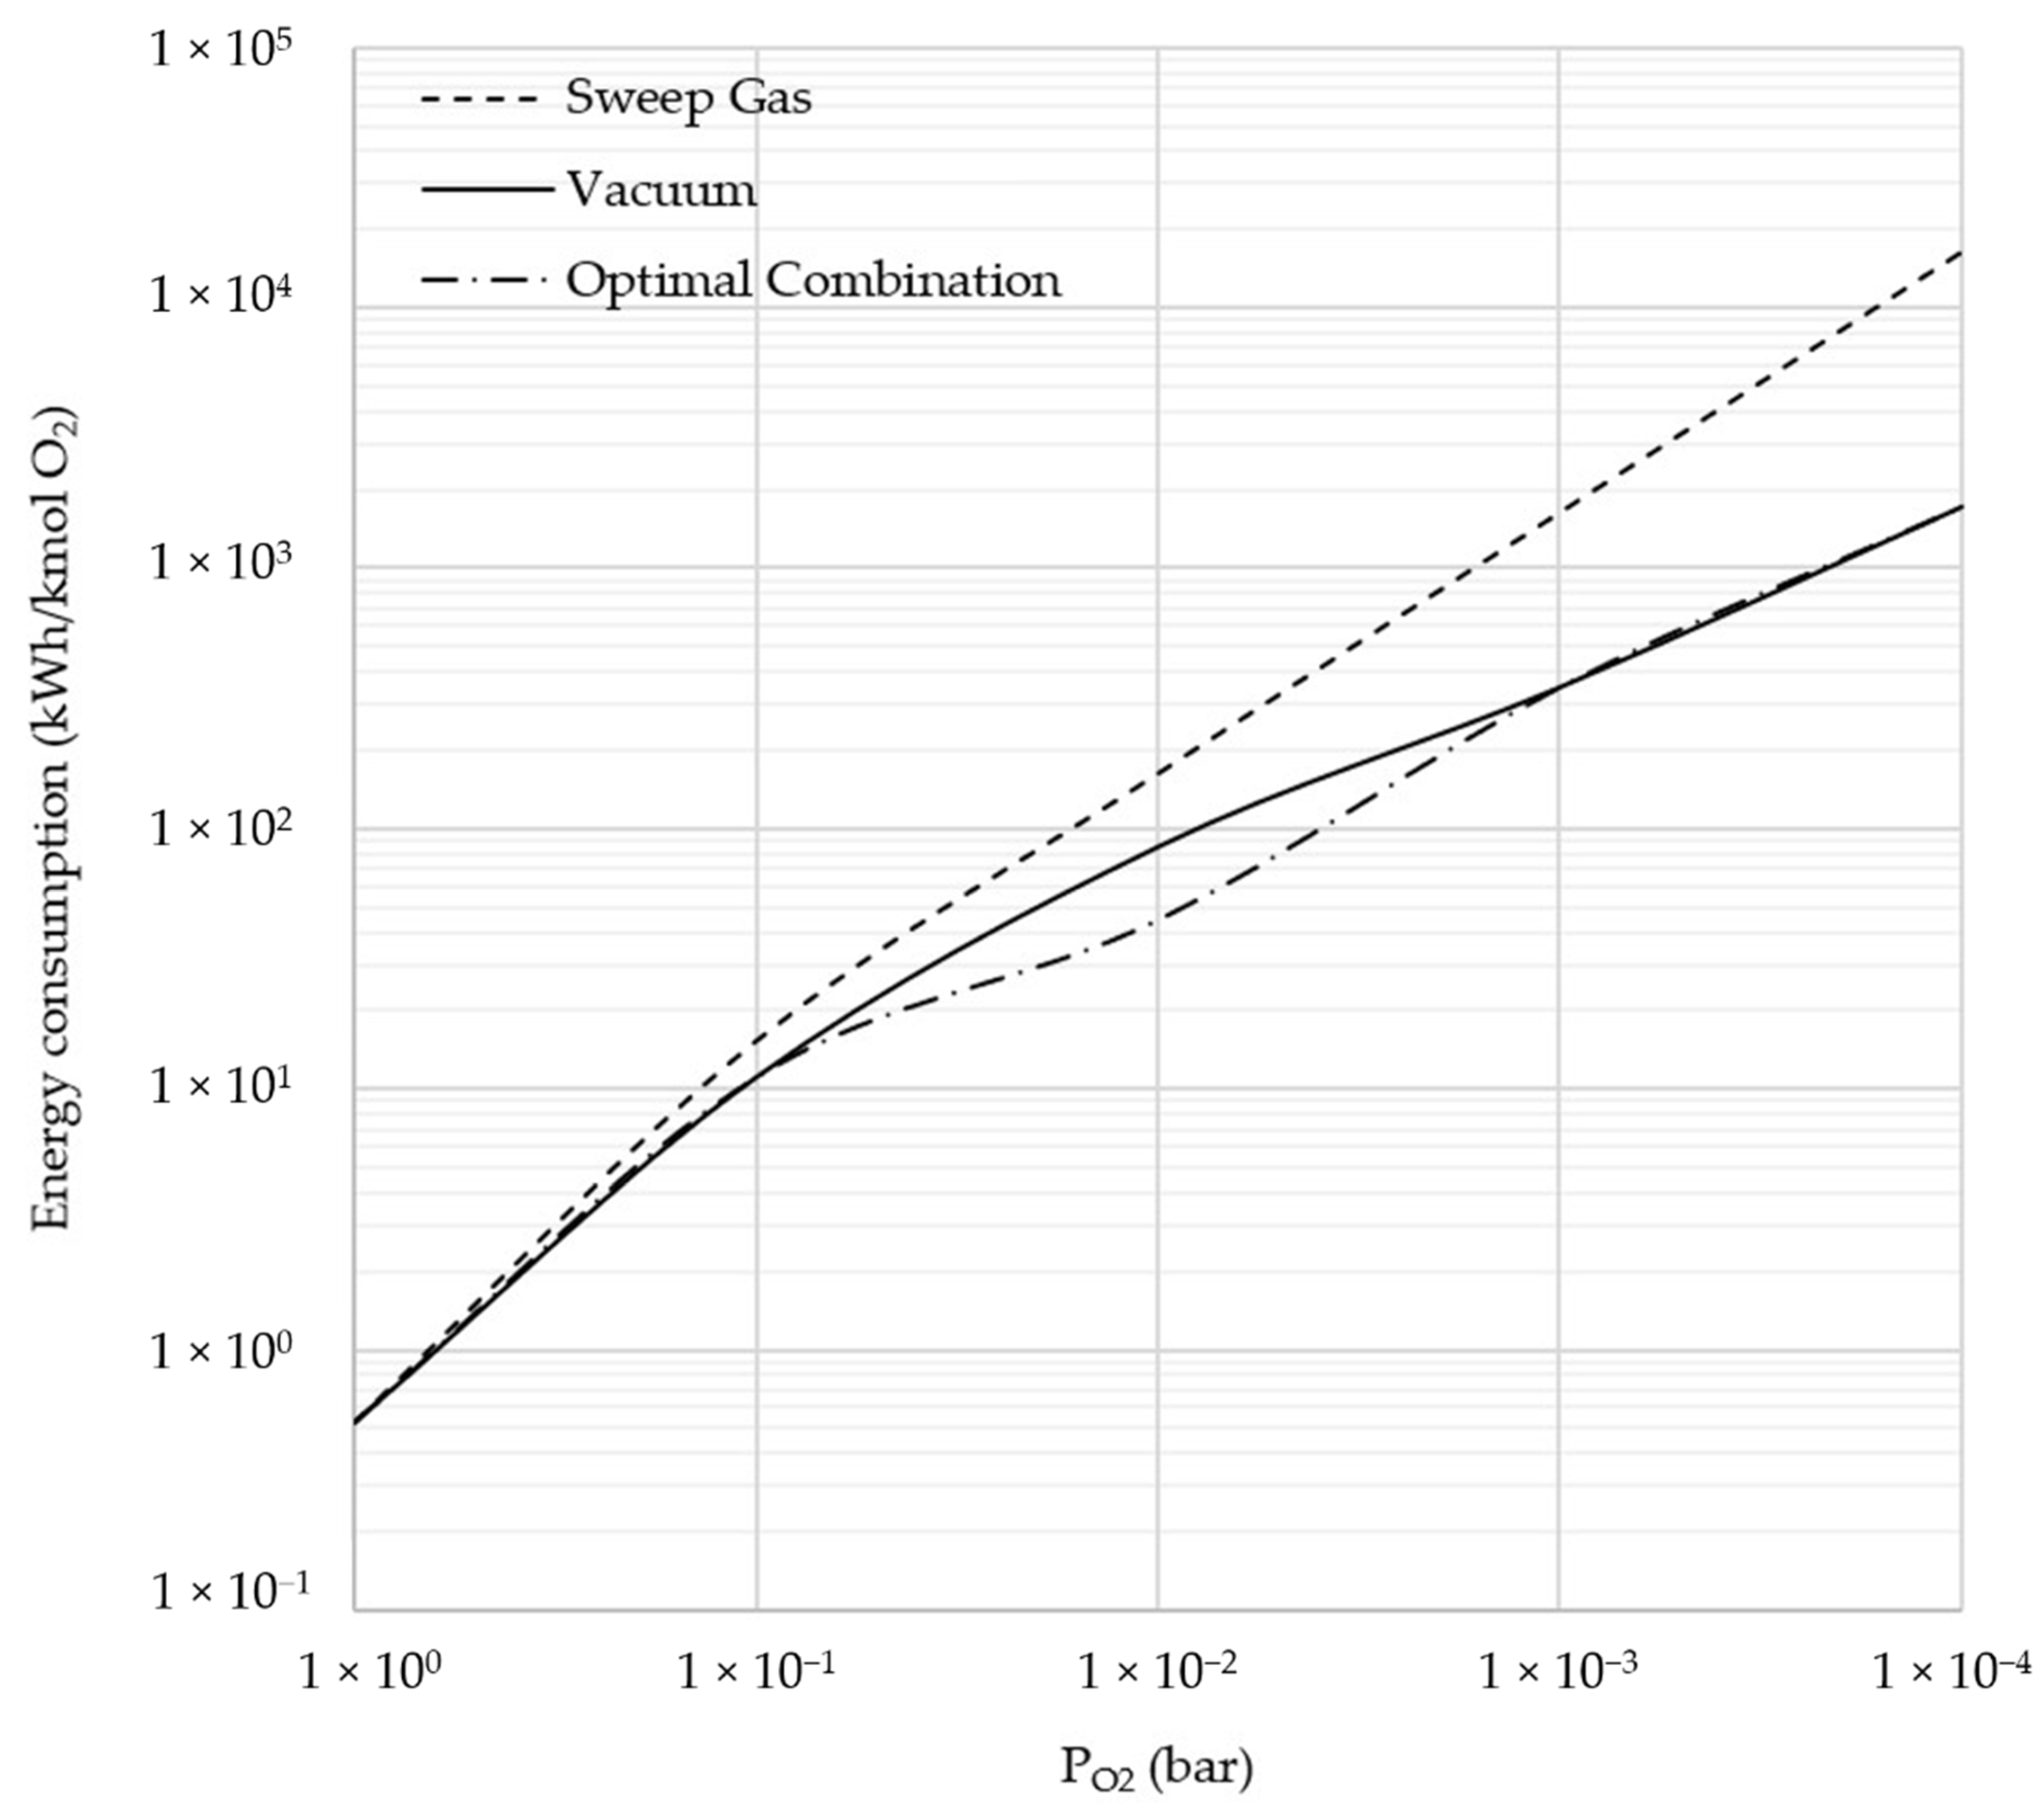
3.3. Comparison between Sweep Gas and Vacuum
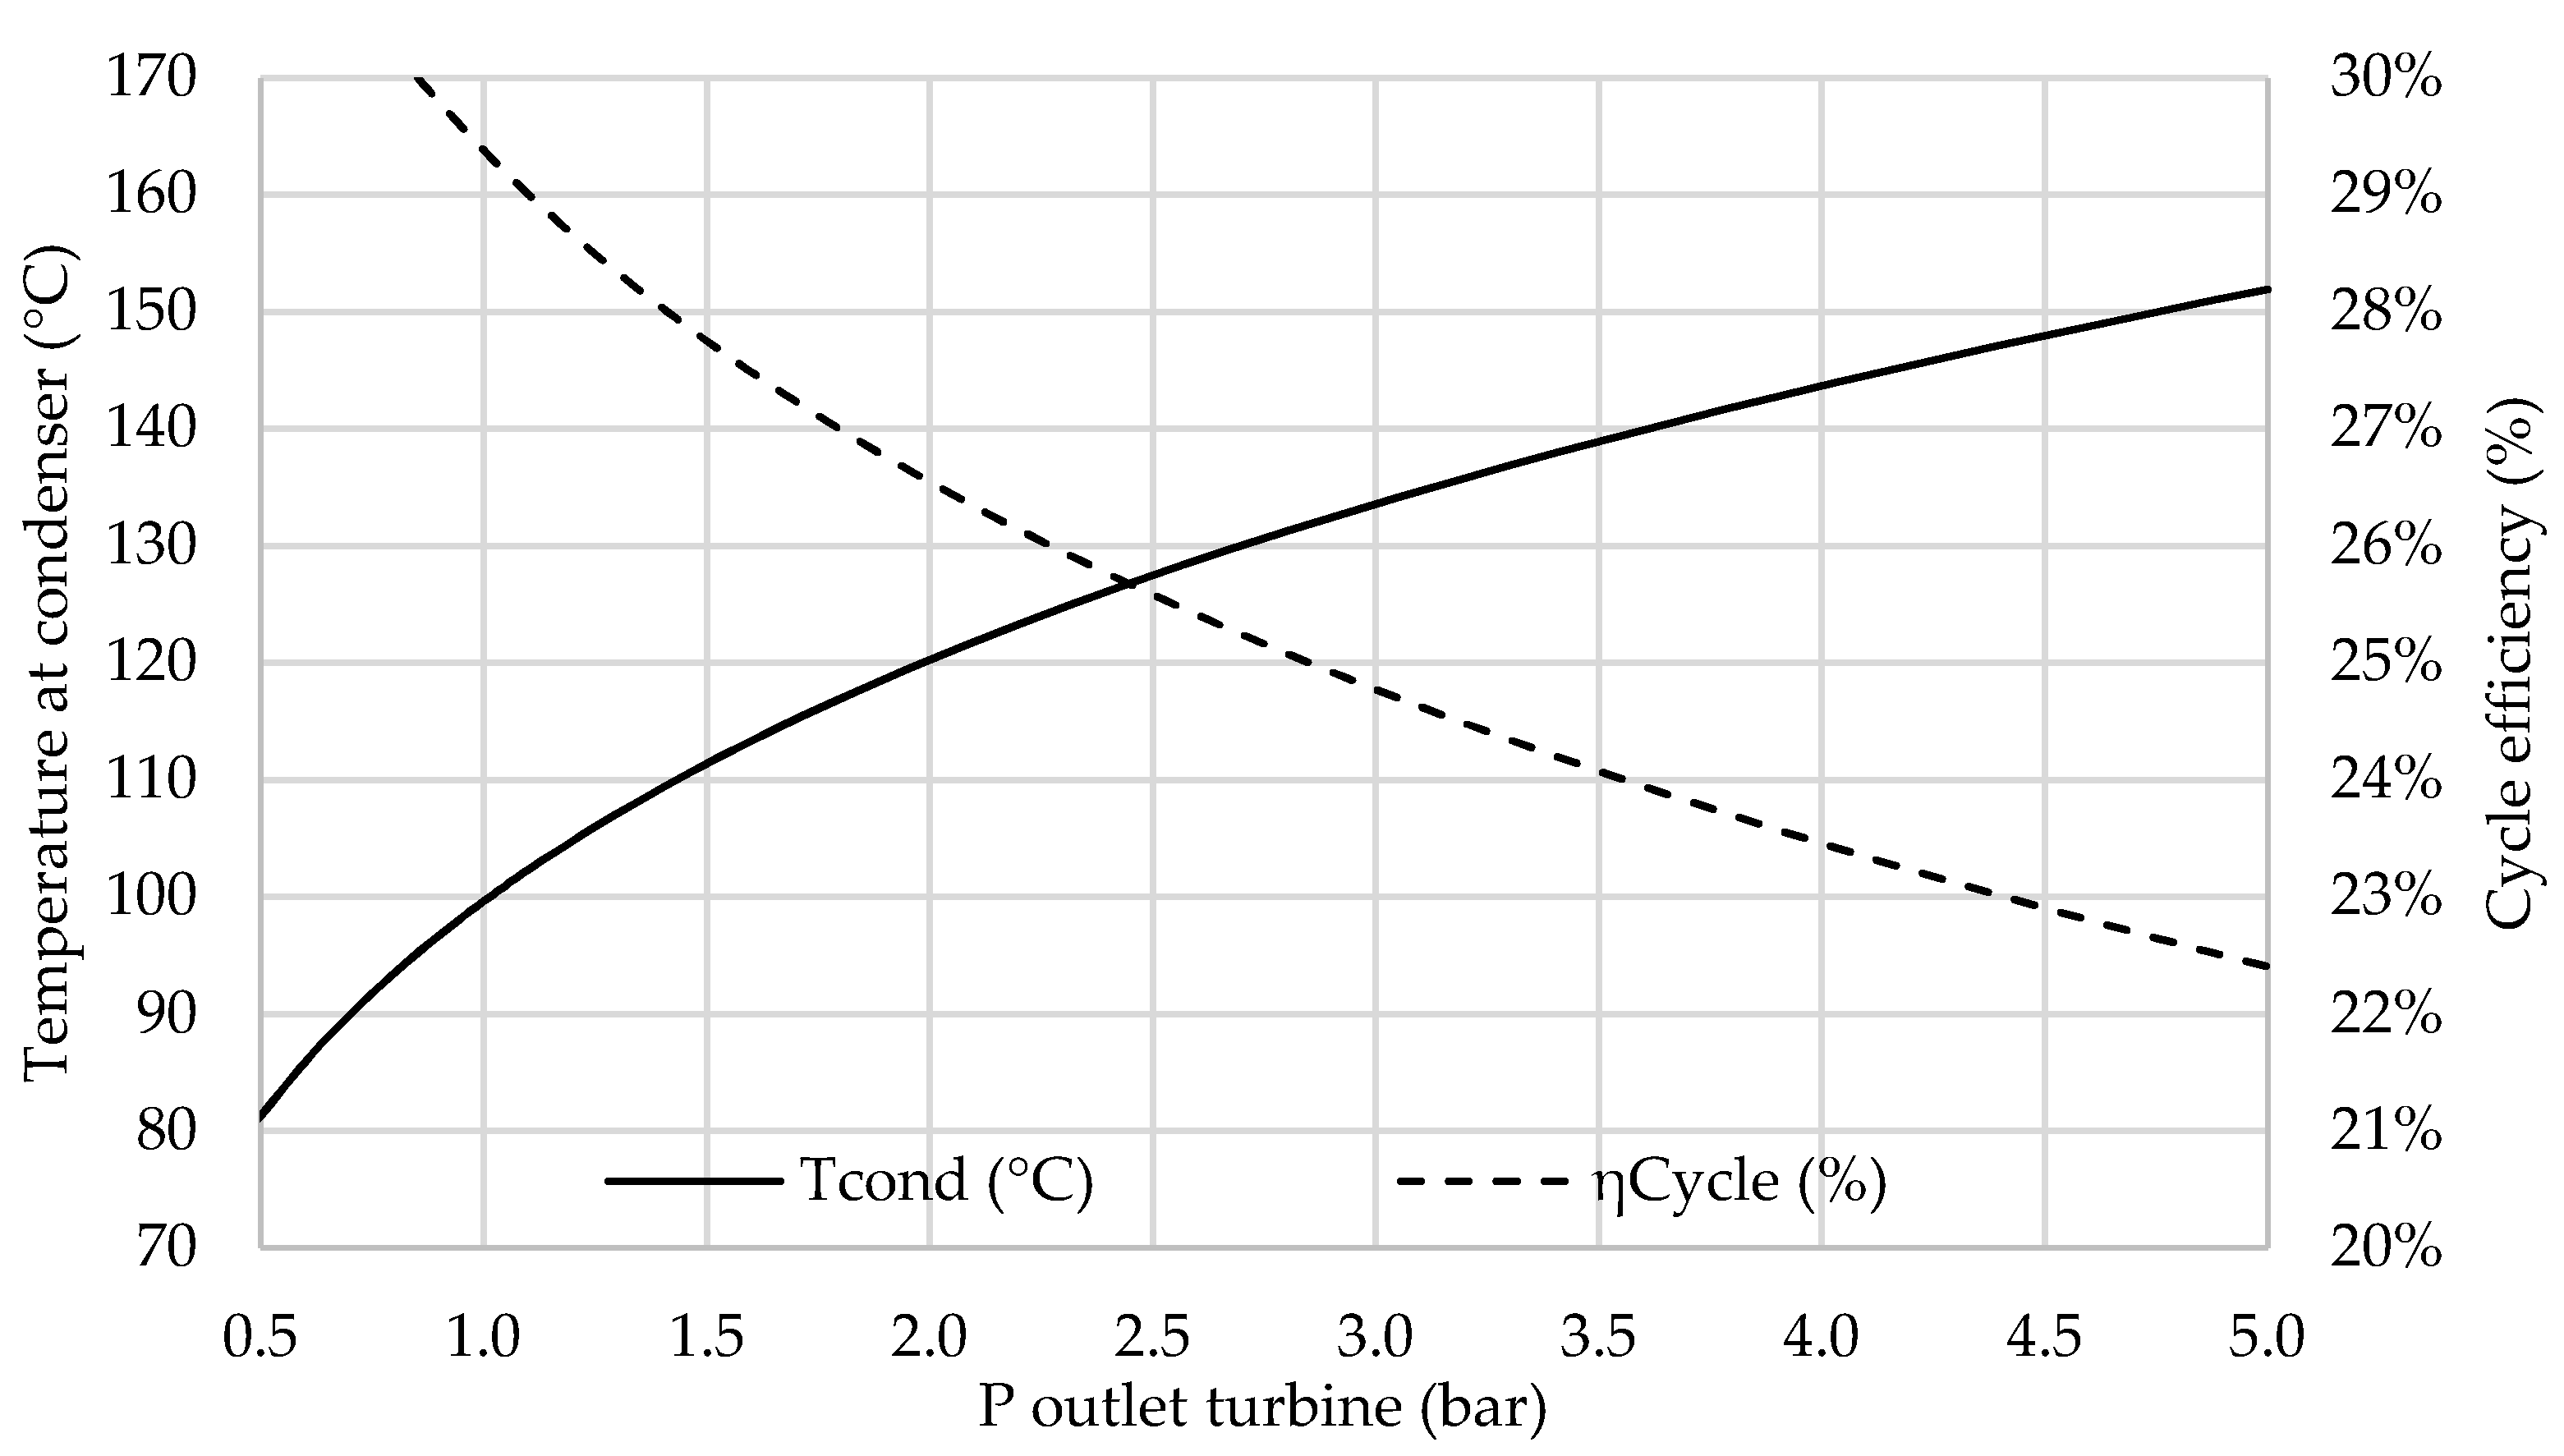
3.4. Co-Generation Performance
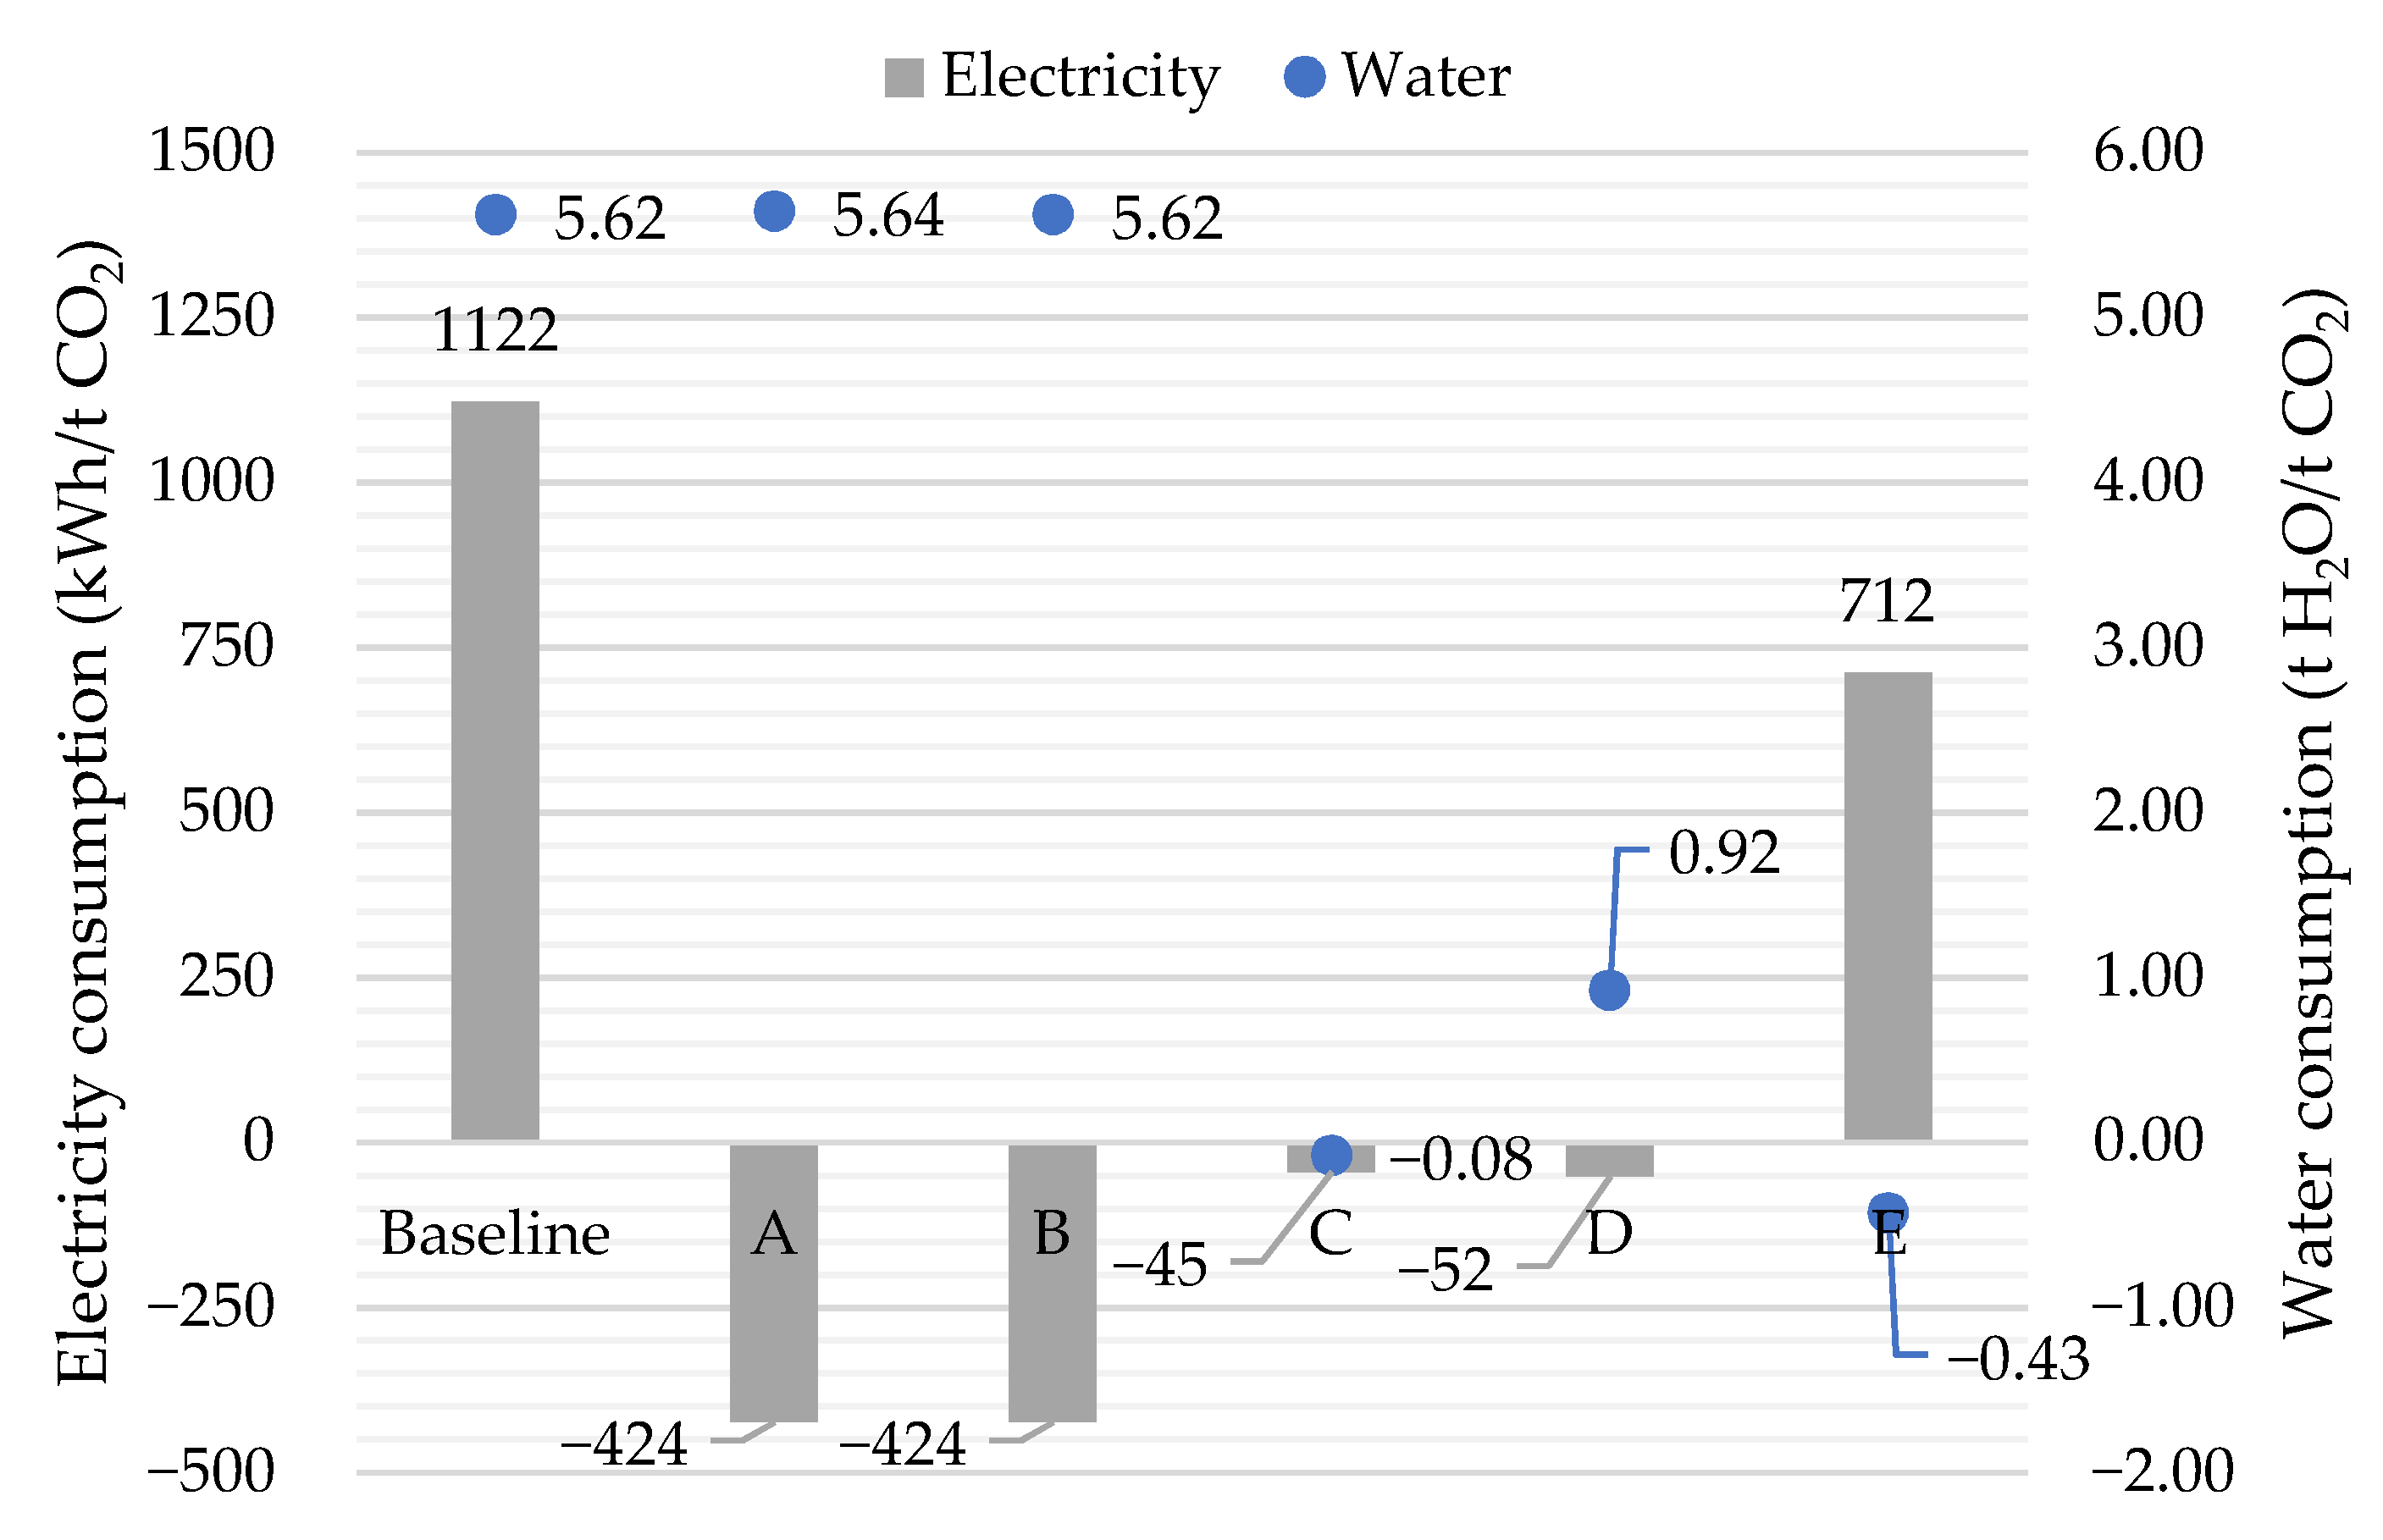
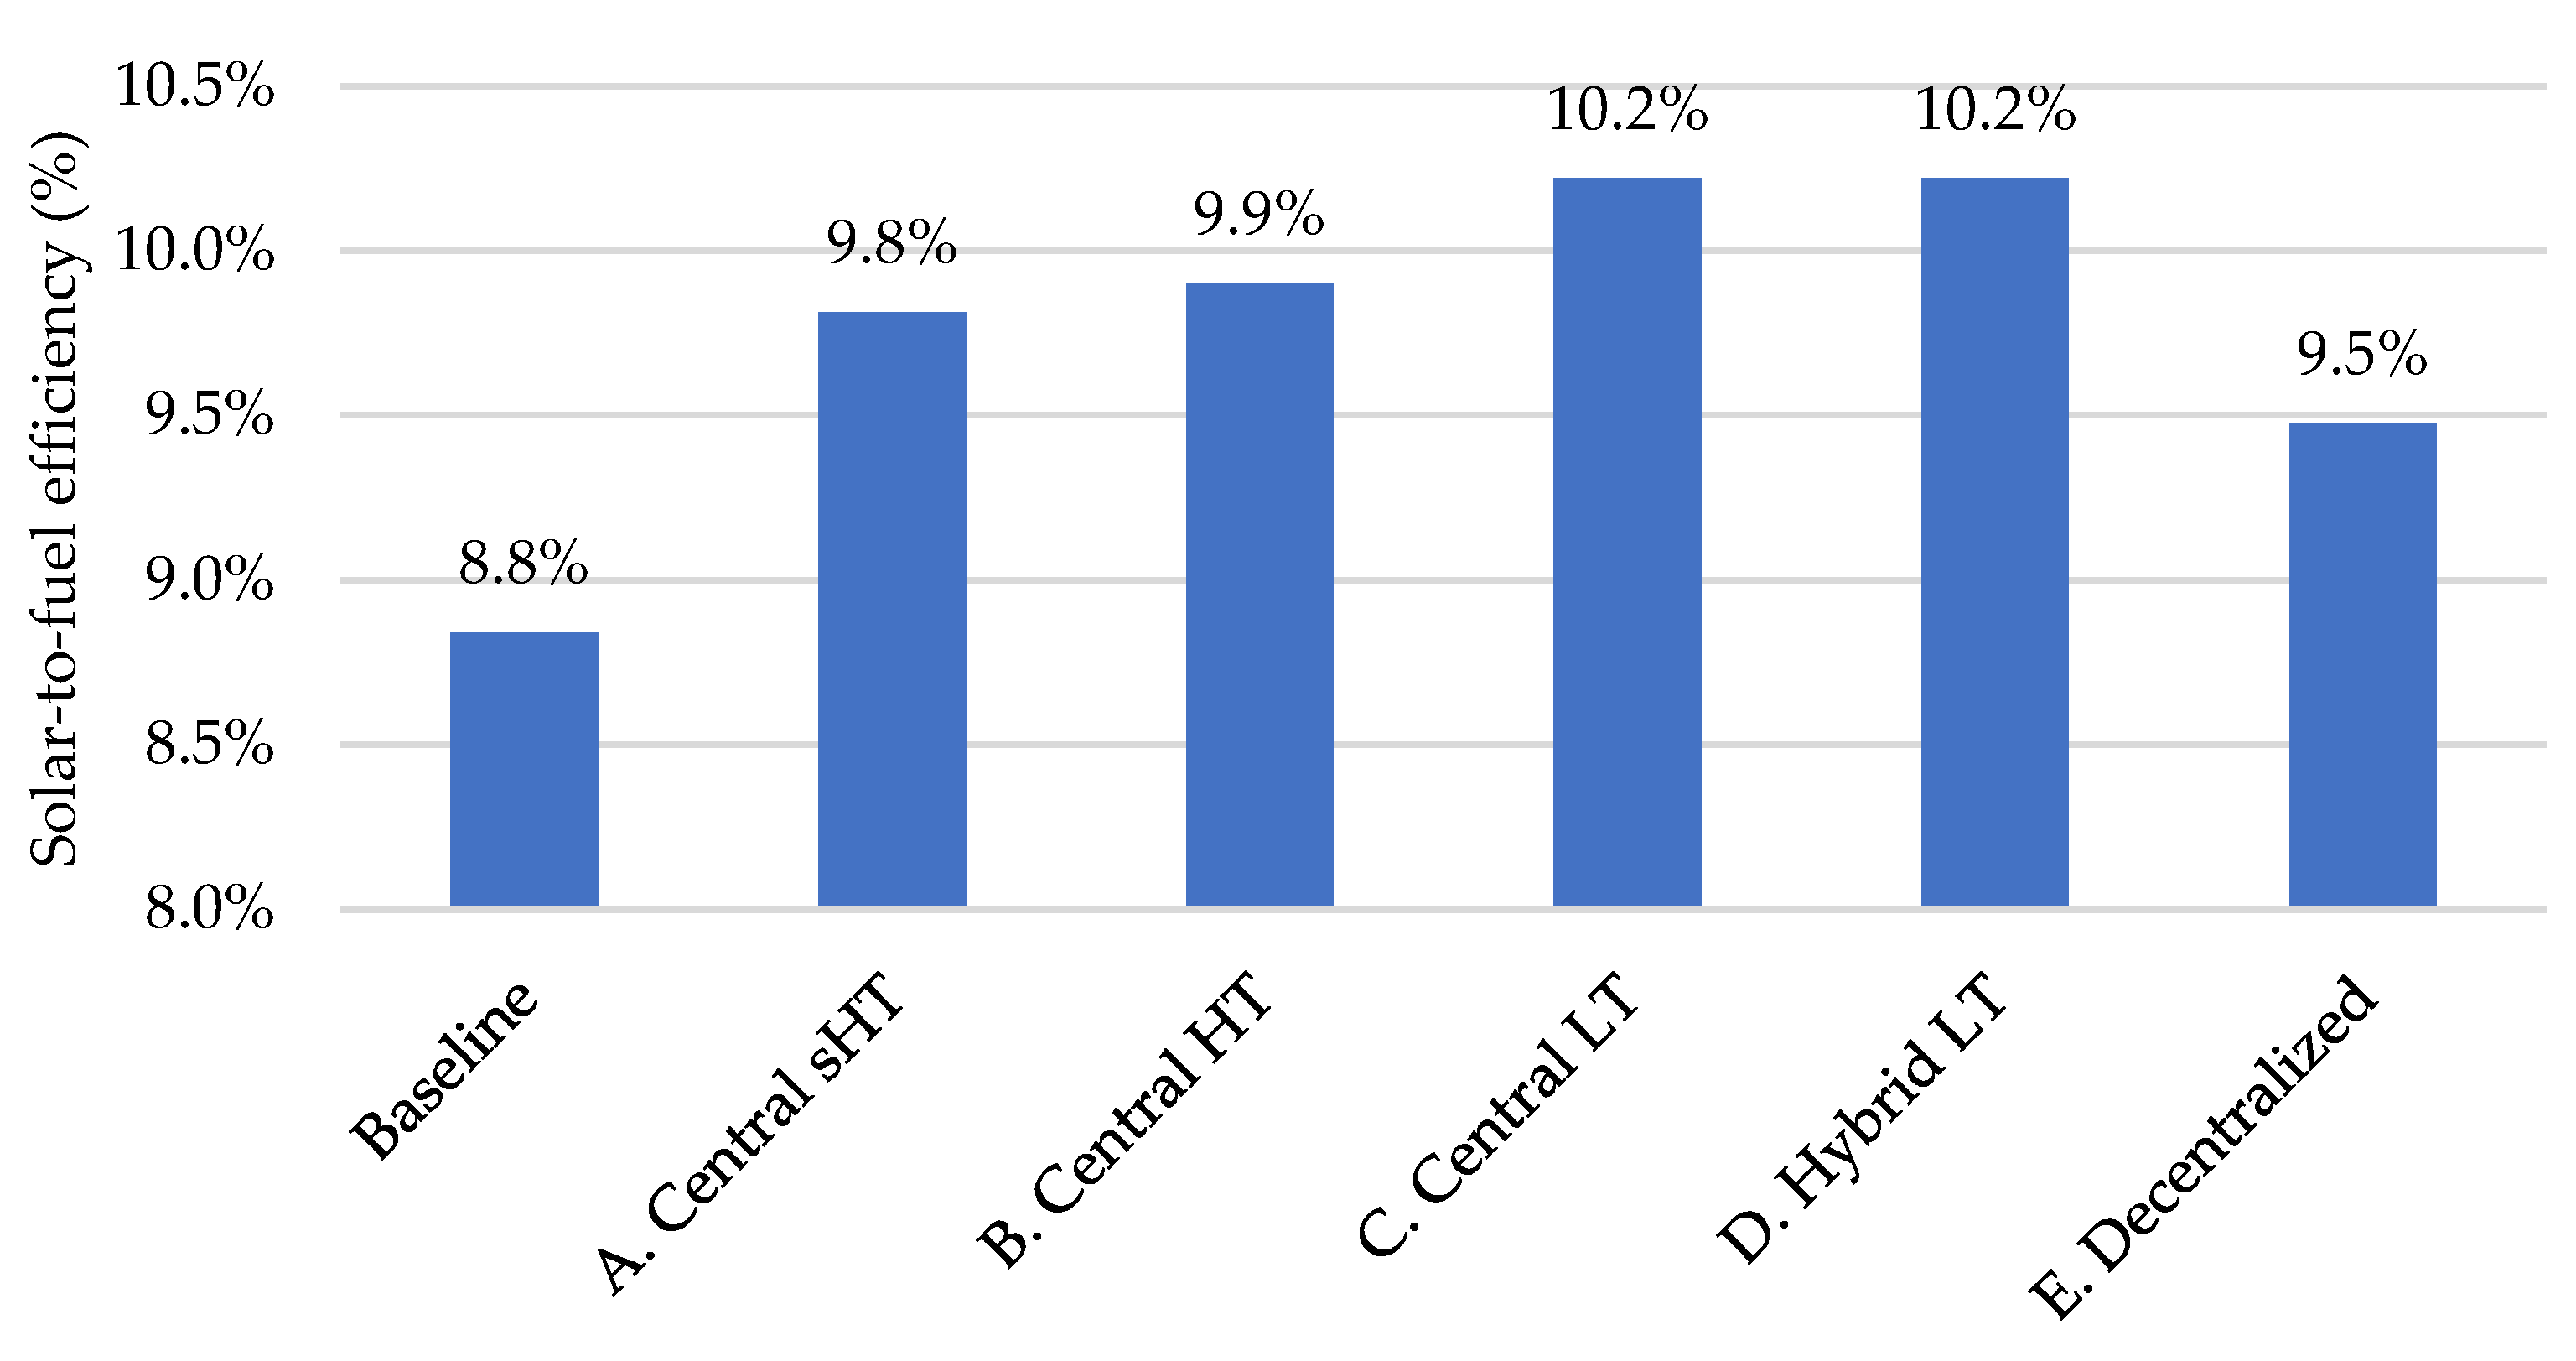
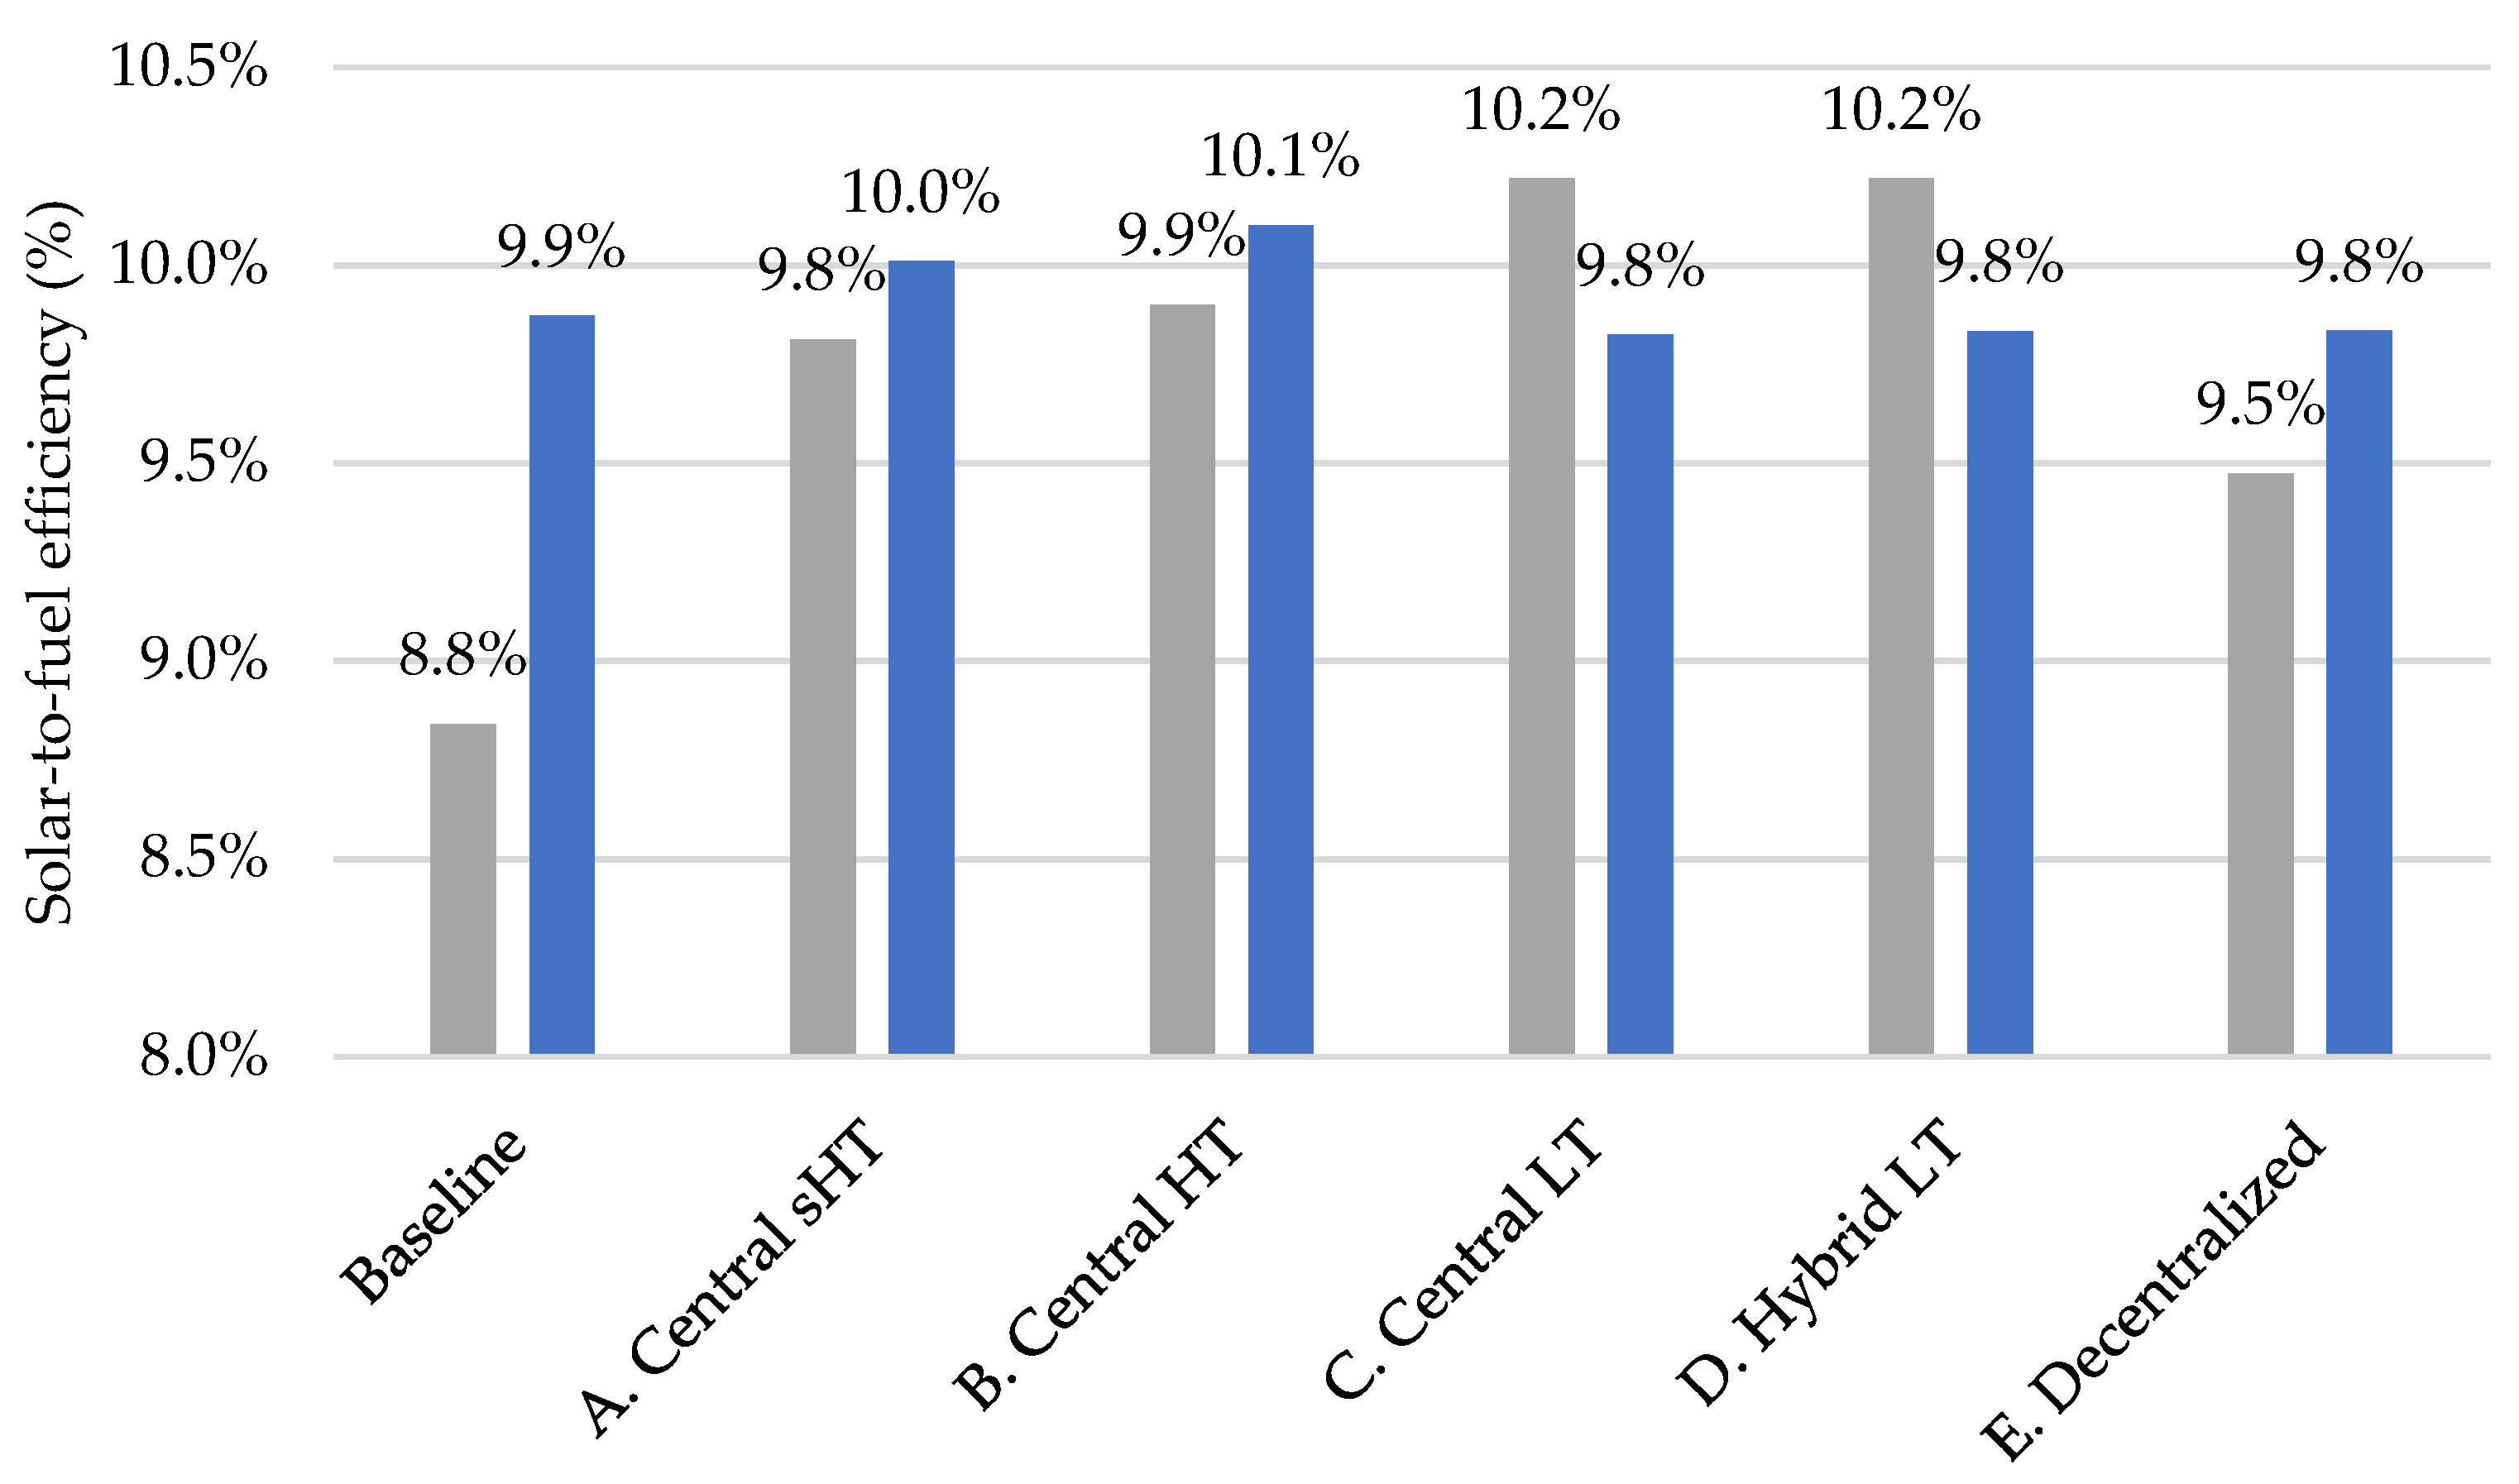
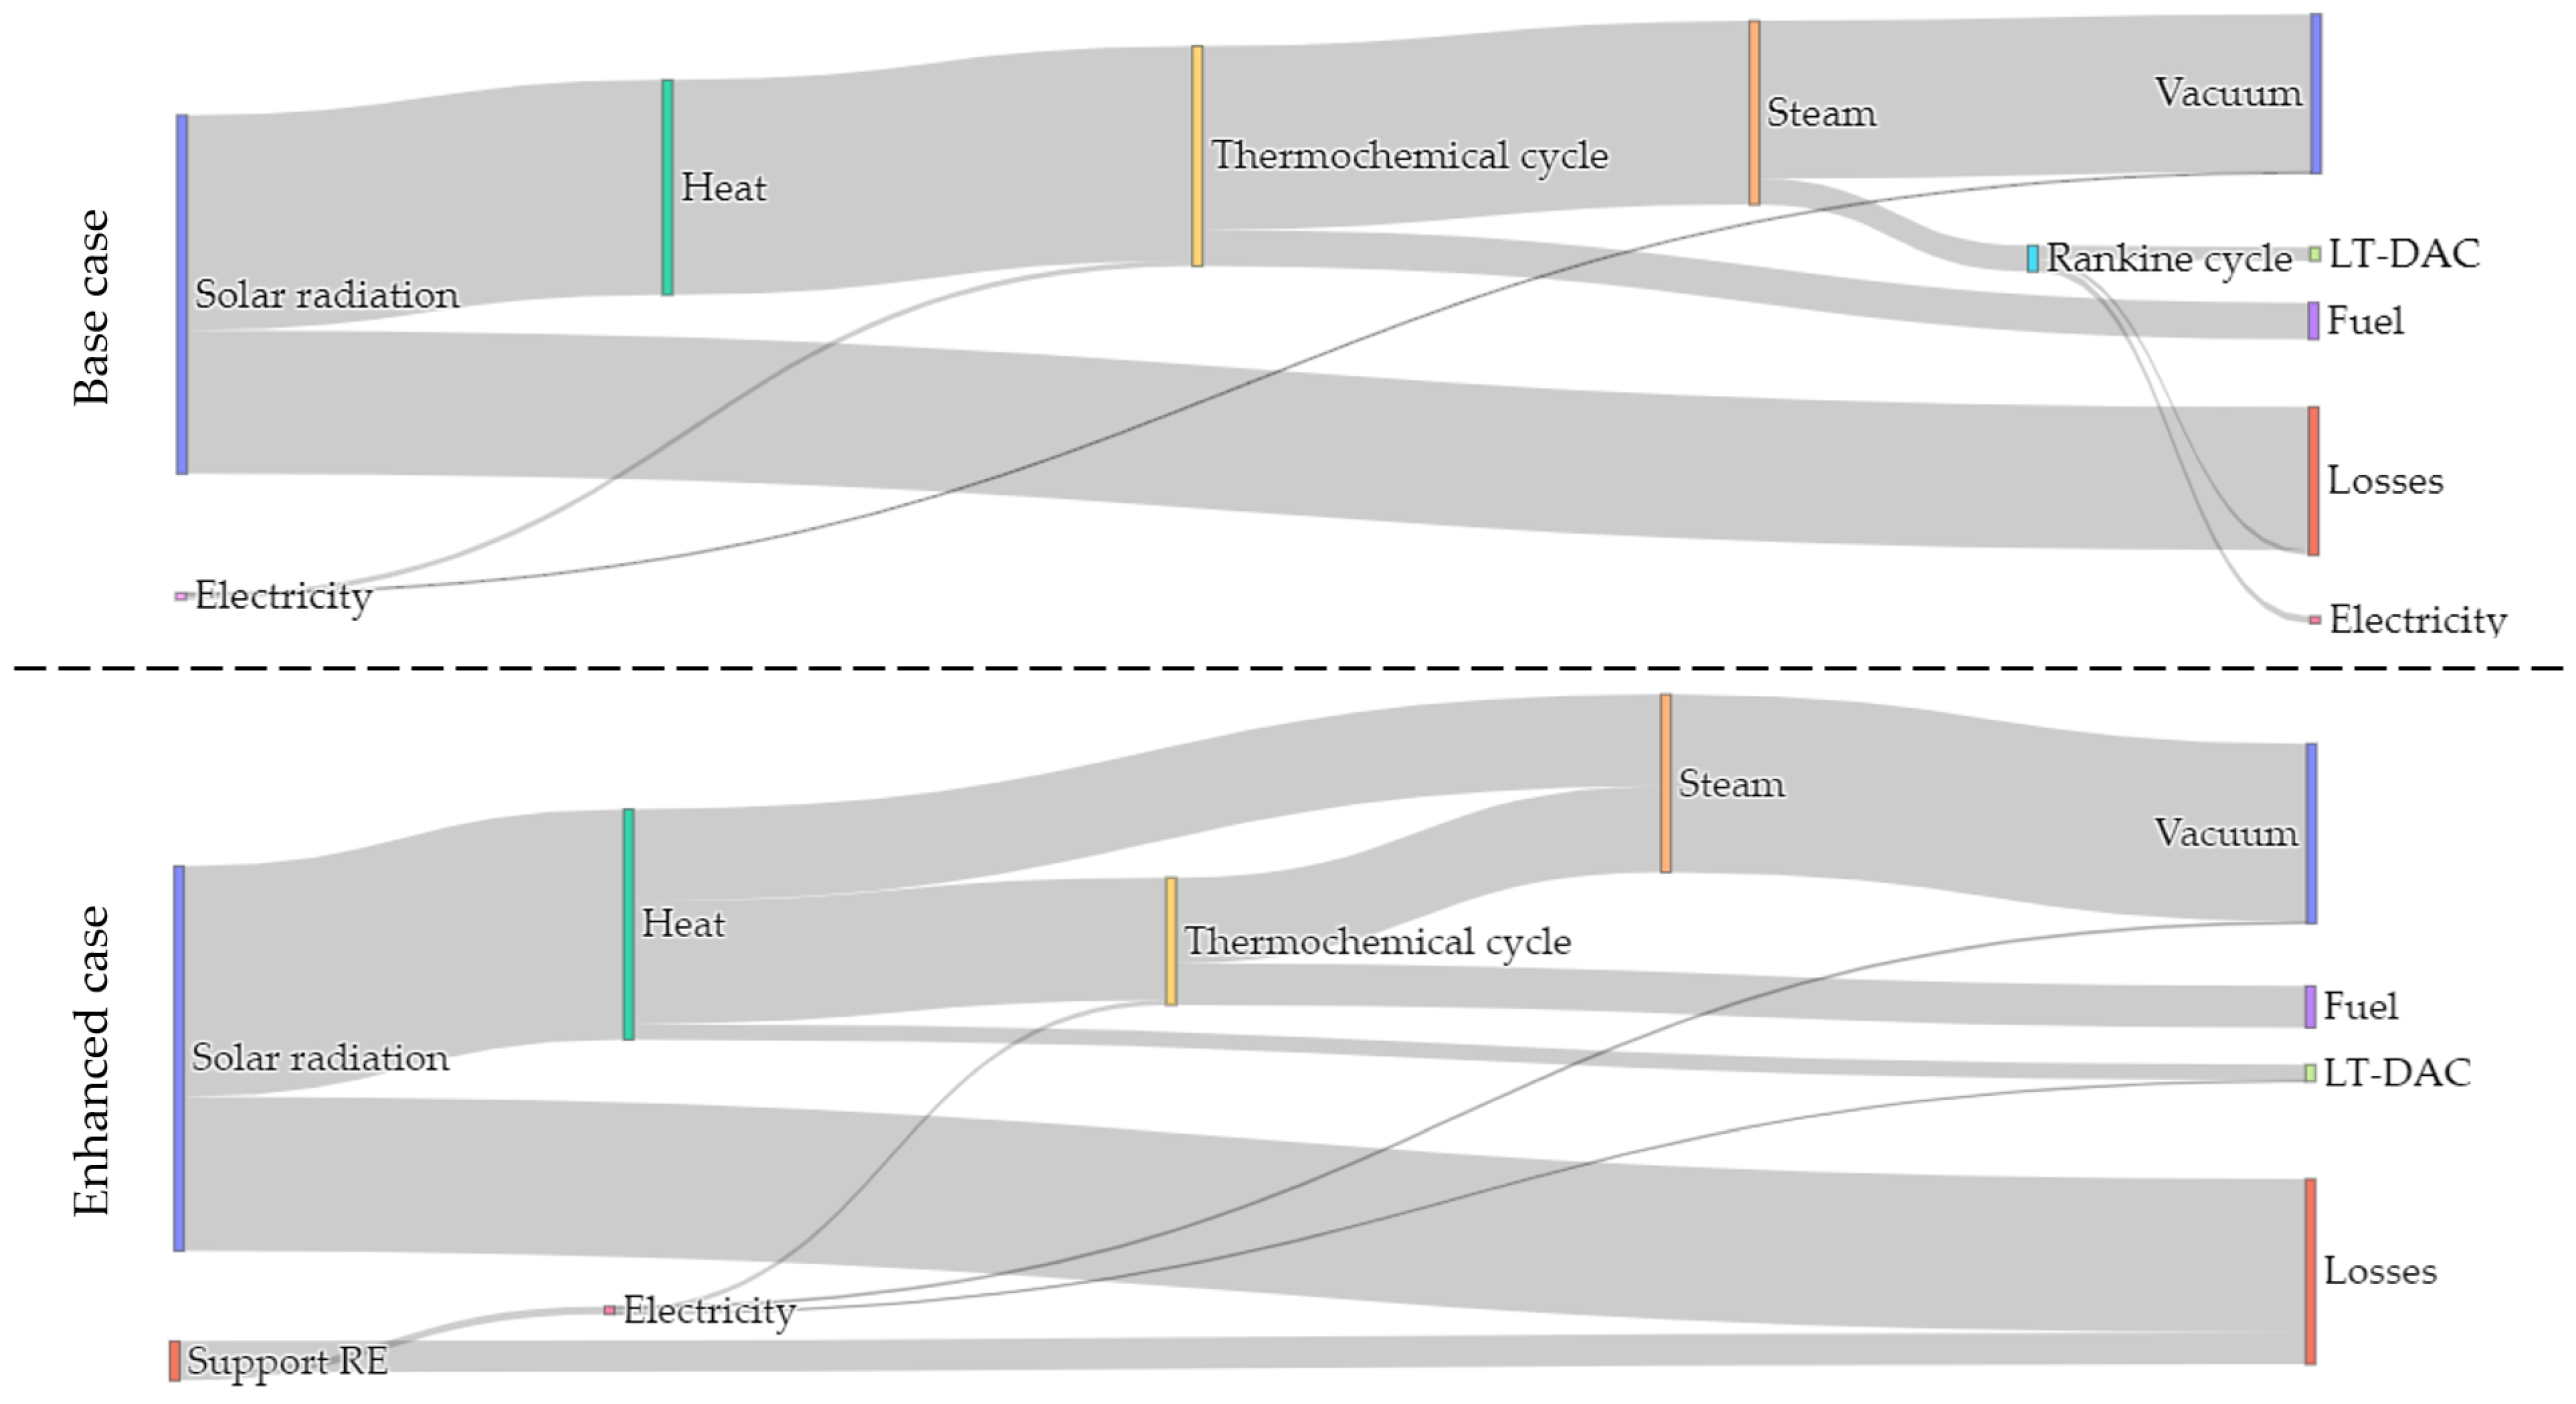
3.5. Overall Results
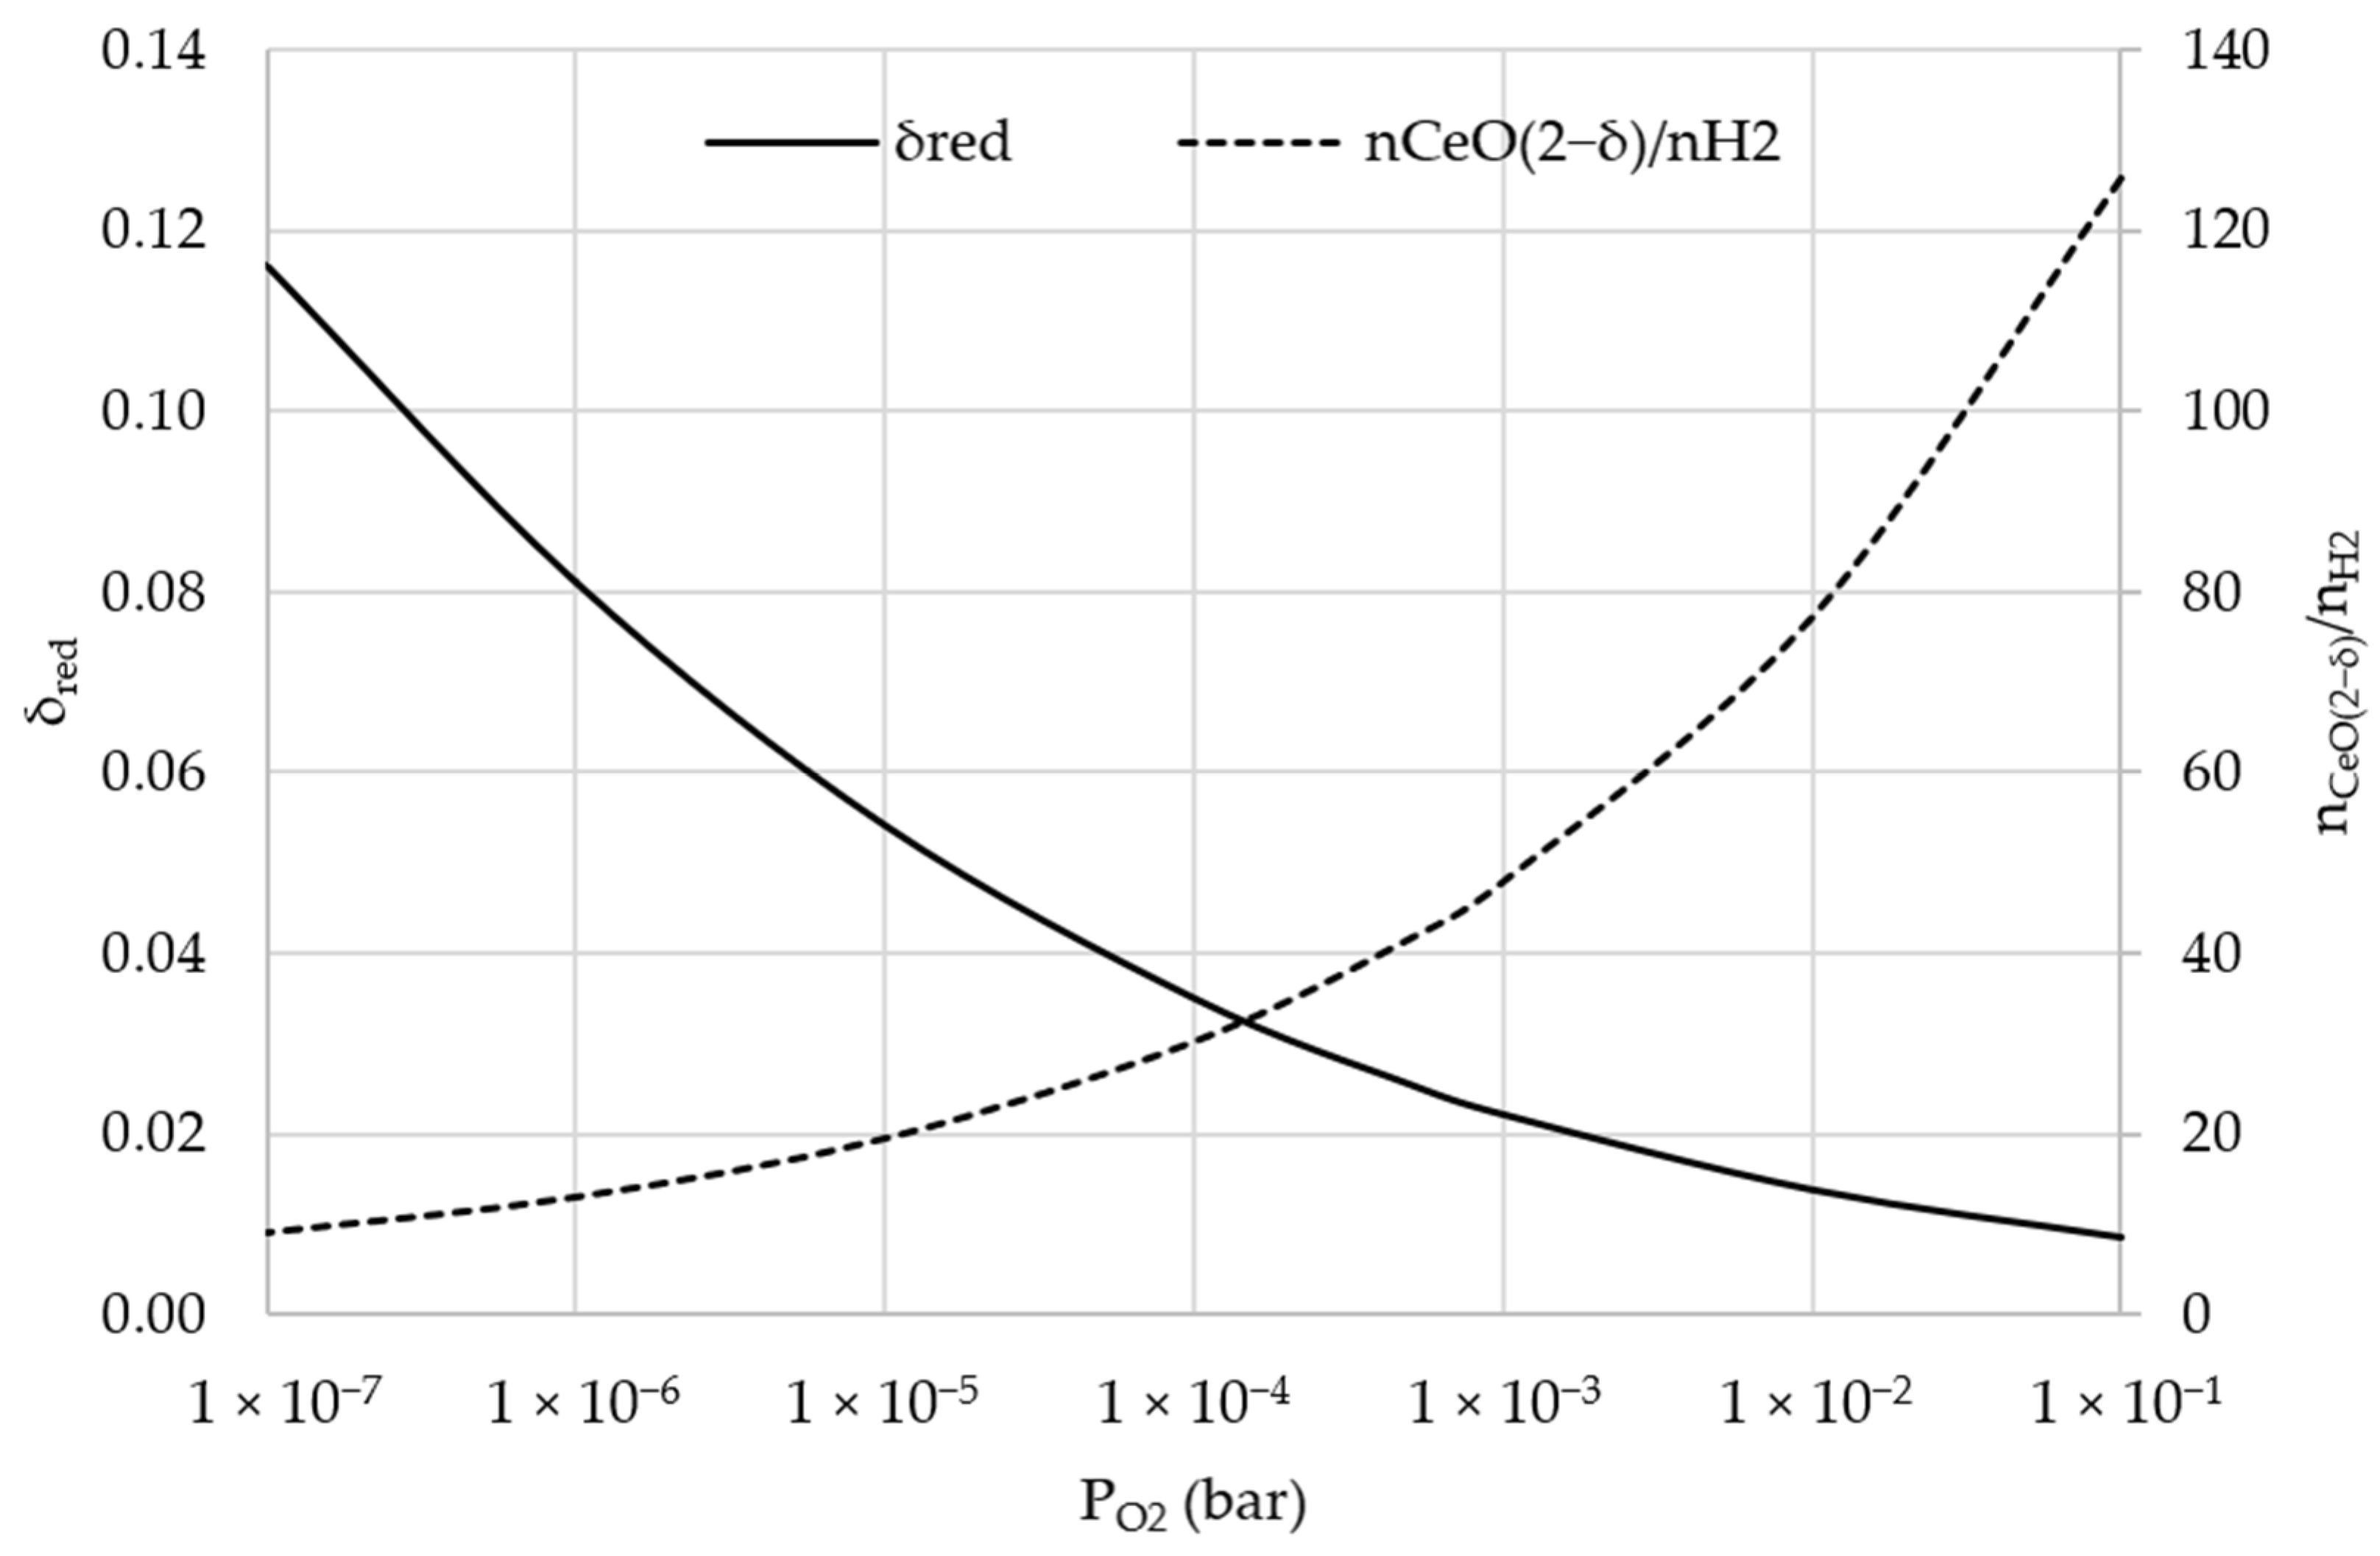
3.6. Sensitivity Analysis: Lower Oxygen Partial Pressure
4. Conclusions
Supplementary Materials
Author Contributions
Funding
Institutional Review Board Statement
Informed Consent Statement
Data Availability Statement
Conflicts of Interest
References
- Lüthi, D.; Le Floch, M.; Bereiter, B.; Blunier, T.; Barnola, J.-M.; Siegenthaler, U.; Raynaud, D.; Jouzel, J.; Fischer, H.; Kawamura, K.; et al. High-resolution carbon dioxide concentration record 650,000–800,000 years before present. Nature 2008, 453, 379–382. [Google Scholar] [CrossRef] [PubMed]
- Plass, G.N. The Carbon Dioxide Theory of Climatic Change. Tellus 1956, 8, 140–154. [Google Scholar] [CrossRef] [Green Version]
- Blunden, J.; Arndt, D.S. State of the Climate in 2019. Bull. Am. Meteorol. Soc. 2020, 101, S1–S429. [Google Scholar] [CrossRef]
- Edenhofer, O. (Ed.) Climate Change 2014: Mitigation of Climate Change Working Group III Contribution to the Fifth Assessment Report of the Intergovernmental Panel on Climate Change; Cambridge University Press: New York, NY, USA, 2014; ISBN 978-1-107-05821-7. [Google Scholar]
- The Emissions Gap Report 2020; United Nations Environment Programme: Nairobi, Kenya, 2020; ISBN 978-92-807-3812-4.
- Dittmeyer, R.; Klumpp, M.; Kant, P.; Ozin, G. Crowd oil not crude oil. Nat. Commun. 2019, 10, 1–8. [Google Scholar] [CrossRef] [Green Version]
- Brady, C.; Davis, M.E.; Xu, B. Integration of thermochemical water splitting with CO2 direct air capture. Proc. Natl. Acad. Sci. USA 2019, 116, 25001–25007. [Google Scholar] [CrossRef] [Green Version]
- Agrafiotis, C.; Roeb, M.; Sattler, C. 4.18 Solar Fuels. In Comprehensive Energy Systems; Dincer, I., Ed.; Elsevier: Amsterdam, The Netherlands, 2018; ISBN 978-0-12-814925-6. [Google Scholar]
- Götz, M.; Lefebvre, J.; Mörs, F.; Koch, A.M.; Graf, F.; Bajohr, S.; Reimert, R.; Kolb, T. Renewable Power-to-Gas: A technological and economic review. Renew. Energy 2016, 85, 1371–1390. [Google Scholar] [CrossRef] [Green Version]
- Pregger, T.; Schiller, G.; Cebulla, F.; Dietrich, R.-U.; Maier, S.; Thess, A.; Lischke, A.; Monnerie, N.; Sattler, C.; Le Clercq, P.; et al. Future Fuels—Analyses of the Future Prospects of Renewable Synthetic Fuels. Energies 2020, 13, 138. [Google Scholar] [CrossRef] [Green Version]
- Stechel, E.B.; Miller, J.E. Re-energizing CO2 to fuels with the sun: Issues of efficiency, scale and economics. J. CO2 Util. 2013, 1, 28–36. [Google Scholar] [CrossRef]
- Miller, J.E. Initial Case for Splitting Carbon Dioxide to Carbon Monoxide and Oxygen; Sandia National Laboratories: Albuquerque, NM, USA; Livermore, CA, USA, 2007. [Google Scholar]
- Irena and Methanol Institute. Innovation Outlook: Renewable Methanol; International Renewable Energy Agency: Abu Dhabi, United Arab Emirates, 2021. [Google Scholar]
- Basile, A.; Dalena, F. Methanol: Science and Engineering; Elsevier: Amsterdam, The Netherlands, 2017; ISBN 9780444639035. [Google Scholar]
- Kim, J.; Johnson, T.A.; Miller, J.E.; Stechel, E.B.; Maravelias, C.T. Fuel production from CO2 using solar-thermal energy: System level analysis. Energy Environ. Sci. 2012, 5, 8417–8429. [Google Scholar] [CrossRef]
- Scheffe, J.R.; Steinfeld, A. Thermodynamic Analysis of Cerium-Based Oxides for Solar Thermochemical Fuel Production. Energy Fuels 2012, 26, 1928–1936. [Google Scholar] [CrossRef]
- Lua, Y.; Zhua, L.; Agrafiotis, C.; Vieten, J.; Roeb, M.; Sattler, C. Solar fuels production: Two-step thermochemical cycles with cerium-based oxides. Progess Energy Combust. Sci. 2019, 75, 100785. [Google Scholar] [CrossRef]
- Rytter, E.; Souskova, K.; Lundgren, M.K.; Ge, W.; Nannestad, A.D.; Venvik, H.J.; Hillestad, M. Process concepts to produce syngas for Fischer–Tropsch fuels by solar thermochemical splitting of water and/or CO2. Fuel Process. Technol. 2016, 145, 1–8. [Google Scholar] [CrossRef]
- Brendelberger, S.; von Storch, H.; Bulfin, B.; Sattler, C. Vacuum pumping options for application in solar thermochemical redox cycles–Assessment of mechanical-, jet- and thermochemical pumping systems. Sol. Energy 2017, 141, 91–102. [Google Scholar] [CrossRef]
- Bulfin, B.; Lapp, J.; Richter, S.; Gubàn, D.; Vieten, J.; Brendelberger, S.; Roeb, M.; Sattler, C. Air separation and selective oxygen pumping via temperature and pressure swing oxygen adsorption using a redox cycle of SrFeO3 perovskite. Chem. Eng. Sci. 2019, 203, 68–75. [Google Scholar] [CrossRef]
- Bulfin, B.; Call, F.; Lange, M.; Lübben, O.; Sattler, C.; Pitz-Paal, R.; Shvets, I.V. Thermodynamics of CeO2 Thermochemical Fuel Production. Energy Fuels 2015, 29, 1001–1009. [Google Scholar] [CrossRef]
- Steinfeld, A.; Palumbo, R. Solar Thermochemical Process Technology: Encyclopedia of Physical Science & Technology. In Encyclopedia of Physical Science and Technology, 3rd ed.; Meyers, R.A., Ed.; Academic: San Diego, CA, USA; London, UK, 2002; pp. 237–256. ISBN 9780122274107. [Google Scholar]
- World Bank. Concentrating Solar Power: Clean Power on Demand 24/7; World Bank: Washington DC, USA, 2020. [Google Scholar]
- International Energy Agency. Technology Roadmap: Solar Thermal Electricity; International Energy Agency: Paris, France, 2014. [Google Scholar]
- Trieb, F.; Schillings, C.; O’Sullivan, M.; Pregger, T. Global Potential of Concentrating Solar Power. In Proceedings of the SolarPACES Conference, Berlin, Germany, 15–18 September 2009. [Google Scholar]
- Lewis, N.S.; Nocera, D.G. Powering the planet: Chemical challenges in solar energy utilization. Proc. Natl. Acad. Sci. USA 2006, 103, 15729–15735. [Google Scholar] [CrossRef] [Green Version]
- Hanna, R.; Abdulla, A.; Xu, Y.; Victor, D.G. Emergency deployment of direct air capture as a response to the climate crisis. Nat. Commun. 2021, 12, 1–3. [Google Scholar] [CrossRef]
- Deutz, S.; Bardow, A. Life-cycle assessment of an industrial direct air capture process based on temperature—Vacuum swing adsorption. Nat. Energy 2021, 6, 203–213. [Google Scholar] [CrossRef]
- Eisaman, M.D.; Rivest, J.L.; Karnitz, S.D.; Lannoy, C.-F.; de Jose, A.; DeVaul, R.W.; Hannun, K. Indirect ocean capture of atmospheric CO2: Part II. Understanding the cost of negative emissions. Int. J. Greenh. Gas Control. 2018, 70, 254–261. [Google Scholar] [CrossRef]
- Patterson, B.D.; Mo, F.; Borgschulte, A.; Hillestad, M.; Joos, F.; Kristiansen, T.; Sunde, S.; van Bokhoven, J.A. Renewable CO2 recycling and synthetic fuel production in a marine environment. Proc. Natl. Acad. Sci. USA 2019, 116, 12212–12219. [Google Scholar] [CrossRef] [Green Version]
- Fasihi, M.; Efimova, O.; Breyer, C. Techno-economic assessment of CO2 direct air capture plants. J. Clean. Prod. 2019, 224, 957–980. [Google Scholar] [CrossRef]
- Keith, D.; Holmes, G.; St. Angelo, D.; Heidel, K. A Process for Capturing CO2 from the Atmosphere. Joule 2018, 2. [Google Scholar] [CrossRef] [Green Version]
- Gebald, C.; Wurzbacher, J.A.; Tingaut, P.; Zimmermann, T.; Steinfeld, A. Amine-Based Nanofibrillated Cellulose As Adsorbent for CO2 Capture from Air. Environ. Sci. Technol. 2011, 45, 9101–9108. [Google Scholar] [CrossRef] [PubMed]
- Moumin, G.; Ryssel, M.; Zhao, L.; Markewitz, P.; Sattler, C.; Robinius, M.; Stolten, D. CO2 emission reduction in the cement industry by using a solar calciner. Renew. Energy 2019, 145, 1578–1596. [Google Scholar] [CrossRef]
- Heß, D.; Klumpp, M.; Dittmeyer, R. Nutzung von CO2 aus Luft als Rohstoff für synthetische Kraftstoffe und Chemikalien: Studie im Auftrag des Ministeriums für Verkehr Baden-Württemberg; Ministerium für Verkehr Baden-Württemberg: Stuttgart, Germany, 2020. [Google Scholar]
- Viebahn, P.; Scholz, A.; Zelt, O. The Potential Role of Direct Air Capture in the German Energy Research Program—Results of a Multi-Dimensional Analysis. Energies 2019, 12, 3443. [Google Scholar] [CrossRef] [Green Version]
- Wurzbacher, J.A.; Gebald, C.; Piatkowski, N.; Steinfeld, A. Concurrent Separation of CO2 and H2O from Air by a Temperature-Vacuum Swing Adsorption/Desorption Cycle. Environ. Sci. Technol. 2012, 46, 9191–9198. [Google Scholar] [CrossRef]
- Algarni, S.; Saleel, C.A.; Mujeebur, M.A. Air-conditioning condensate recovery and applications—Current developments and challenges ahead. Sustain. Cities Soc. 2018, 37, 263–274. [Google Scholar] [CrossRef]
- Hassan, N.M.; Bakry, A.S. Feasibility of Condensate Recovery in Humid Climates. Int. J. Archit. Eng. Constr. 2013, 2, 271–279. [Google Scholar] [CrossRef]
- Monnerie, N.; Gan, P.G.; Roeb, M.; Sattler, C. Methanol production using hydrogen from concentrated solar energy. Hydrog. Energy Publ. 2020, 45, 26117–26125. [Google Scholar] [CrossRef]
- Kim, J.; Henao, C.A.; Johnson, T.A.; Dedrick, D.E.; Miller, J.E.; Stechel, E.B.; Maravelias, C.T. Methanol production from CO2 using solar-thermal energy: Process development and techno-economic analysis. Energy Environ. Sci. 2011, 4, 3122. [Google Scholar] [CrossRef]
- Romero, M.; Gonzalez-Aguilar, J.; Sizmann, A.; Batteiger, V.; Steinfeld, A.; Zoller, S.; Brendelberger, S.; Lieftink, D. Solar-Driven Thermochemical Production of Sustainable Liquid Fuels from H2O and CO2 in a Heliostat Field. In Proceedings of the ISES SWC2019/SHC2019, Santiago, Chile, 4–7 November 2009; International Solar Energy Society: Freiburg, Germany, 2019. [Google Scholar]
- Marxer, D.; Furler, P.; Takacs, M.; Steinfeld, A. Solar thermochemical splitting of CO2 into separate streams of CO and O2 with high selectivity, stability, conversion, and efficiency. Energy Environ. Sci. 2017, 10, 1142–1149. [Google Scholar] [CrossRef] [Green Version]
- Lim, Y.-I.; Choi, J.; Moon, H.-M.; Kim, G.-H. Techno-economic Comparison of Absorption and Adsorption Processes for Carbon Monoxide (CO) Separation from Linze-Donawitz Gas (LDG). Korean Chem. Eng. Res. 2015, 54, 320–331. [Google Scholar] [CrossRef] [Green Version]
- Dutta, N.N.; Patil, G.S. Developments in CO separation. Gas Sep. Purif. 1995, 9, 277–283. [Google Scholar] [CrossRef]
- Poudel, J.; Choi, J.H.; Oh, S.C. Process Design Characteristics of Syngas (CO/H2) Separation Using Composite Membrane. Sustainability 2019, 11, 703. [Google Scholar] [CrossRef] [Green Version]
- Gao, F.; Wang, S.; Wang, W.; Duan, J.; Dong, J.; Chen, G. Adsorption separation of CO from syngas with CuCl@AC adsorbent by a VPSA process. RSC Adv. 2018, 8, 39362–39370. [Google Scholar] [CrossRef] [Green Version]
- Keller, A.; Schendel, R. The Use of COSORB II to Recover High Purity Carbon Monoxide from a Feed Gas. In Proceedings of the AIChE Summer Meeting, Denver, CO, USA, 21–24 August 1988; American Institute of Chemical Engineers: New York, NY, USA, 1988. [Google Scholar]
- Peletiri, S.P.; Rahmanian, N.; Mujtaba, I.M. CO2 Pipeline Design: A Review. Energies 2018, 11, 184. [Google Scholar] [CrossRef] [Green Version]
- Morland, B.H.; Dugstad, A.; Svenningsen, G. Corrosion of Carbon Steel in Dense Phase CO2 with Water above and Below the Solubility Limit. Energy Procedia 2017, 114, 6752–6765. [Google Scholar] [CrossRef]
- Elvers, B.; Ullmann, F. Ullmann’s Encyclopedia of Industrial Chemistry, 7th ed.; Wiley-VCH: Weinheim, Germany, 2011; ISBN 978-3-527-32943-4. [Google Scholar]
- Bader, R.; Venstrom, L.J.; Davidson, J.H.; Lipinski, W. Thermodynamic Analysis of Isothermal Redox Cycling of Ceria for Solar Fuel Production. Energy Fuels 2013, 27, 5533–5544. [Google Scholar] [CrossRef]
- Jousten, K.; Nakhosteen, C.B. Handbook of Vacuum Technology, 2nd ed.; Wiley-VCH: Weinheim, Germany, 2016; ISBN 9783527413386. [Google Scholar]
- Pein, M.; Agrafiotis, C.; Vieten, J.; Giasafaki, D.; Brendelberger, S.; Roeb, M.; Sattler, C. Redox thermochemistry of Ca-Mn-based perovskites for oxygen atmosphere control inasm solar-thermochemical processes. Sol. Energy 2020, 198, 612–622. [Google Scholar] [CrossRef]
- Holzemer-Zerhusen, P.; Brendelberger, S.; Roeb, M.; Sattler, C. Oxygen Crossover in Solid–Solid Heat Exchangers for Solar Water and Carbon Dioxide Splitting: A Thermodynamic Analysis. J. Energy Resour. Technol. 2021, 143, 071301. [Google Scholar] [CrossRef]
- Budama, V.K.; Johnson, N.G.; McDaniel, A.; Ermanoski, I.; Stechel, E.B. Thermodynamic development and design of a concentrating solar thermochemical water-splitting process for co-production of hydrogen and electricity. Int. J. Hydrogen Energy 2018, 43, 17574–17587. [Google Scholar] [CrossRef]
- Budama, V.K.; Johnson, N.G.; Ermanoski, I.; Stechel, E.B. Techno-economic analysis of thermochemical water-splitting system for Co-production of hydrogen and electricity. Int. J. Hydrogen Energy 2021, 46, 1656–1670. [Google Scholar] [CrossRef]
- Van Putten, H.; Colonna, P. Dynamic modeling of steam power cycles: Part II–Simulation of a small simple Rankine cycle system. Appl. Therm. Eng. 2007, 27, 2566–2582. [Google Scholar] [CrossRef]
- Rahbar, K.; Mahmoud, S.; Al-Dadah, R.K.; Moazami, N.; Mirhadizadeh, S.A. Review of organic Rankine cycle for small-scale applications. Energy Convers. Manag. 2016, 134, 135–155. [Google Scholar] [CrossRef]
- Beér, J.M. High efficiency electric power generation: The environmental role. Prog. Energy Combust. Sci. 2007, 33, 107–134. [Google Scholar] [CrossRef] [Green Version]
- Kaya, A.; Tok, M.; Koc, M. A Levelized Cost Analysis for Solar-Energy-Powered Sea Water Desalination in The Emirate of Abu Dhabi. Sustainability 2019, 11, 1691. [Google Scholar] [CrossRef] [Green Version]
- Falter, C.; Pitz-Paal, R. Water Footprint and Land Requirement of Solar Thermochemical Jet-Fuel Production. Environ. Sci. Technol. 2017, 51, 12938–12947. [Google Scholar] [CrossRef]
- SENER-NOOR III. Available online: https://www.energy.sener/pdf-sener-special/NOORoIII-thermosolar-plant (accessed on 9 July 2021).
- SolarPACES-Maricopa Solar Project. Available online: https://solarpaces.nrel.gov/maricopa-solar-project (accessed on 22 April 2021).
- Collado, F.J.; Guallar, J. Quick design of regular heliostat fields for commercial solar tower power plants. Energy 2019, 178, 115–125. [Google Scholar] [CrossRef]
- Dähler, F.; Wild, M.; Schäppi, R.; Haueter, P.; Cooper, T.; Good, P.; Larrea, C.; Schmitz, M.; Furler, P.; Steinfeld, A. Optical design and experimental characterization of a solar concentrating dish system for fuel production via thermochemical redox cycles. Sol. Energy 2018, 170, 568–575. [Google Scholar] [CrossRef]


| Parameter | Oxidation (CO2) | Oxidation (H2O) | Reduction |
|---|---|---|---|
| Temperature | 900 °C | 1500 °C | |
| Pressure | 1 bar | 0.5 mbar | |
| Conversion | 40% | 40% | |
| δ | 1.37 × 10⁻³ | 1.36 × 10⁻³ | 0.0254 |
| - | Baseline | A. Central sHT | B. Central HT | C. Central LT | D. Hybrid LT | E. Decentralized |
|---|---|---|---|---|---|---|
| Solar Input | Central receiver | Central receiver | Central receiver | Central receiver | Central receiver | Solar dish |
| DAC | HT-DAC (O2 from ASU) | sHT-DAC | HT-DAC (O2 from TCC) | LT-DAC | LT-DAC in HVAC | LT-DAC in HVAC |
| CO2 Treatment | Compression + Transport | - | - | - | Compression + Transport | Compression |
| Waste heat use | - | SRC | SRC | Co-generation (DAC) | Co-generation (District Heat) | LT-DAC and ORC |
| Parameter | Units | Value |
|---|---|---|
| Solar heat input | kWh/t CO2 | 27,194 |
| Waste heat (>500 °C) | kWh/t CO2 | 3290 |
| Electricity needed | kWh/t CO2 | 746 |
| Water input | t H2O/t CO2 | 568 |
| Methanol produced | kg/t CO2 | 728 |
| Parameter | Units | SJ-1 | SJ-2 | LRP |
|---|---|---|---|---|
| Pressure at inlet | mbar | 0.5 | 5 | 50 |
| Pressure at outlet | mbar | 5 | 50 | 1000 |
| Steam | kg/kmol O2 | 172 | 561 | - |
| Electricity | kWh/kmol O2 | - | - | 6.09 |
Publisher’s Note: MDPI stays neutral with regard to jurisdictional claims in published maps and institutional affiliations. |
© 2021 by the authors. Licensee MDPI, Basel, Switzerland. This article is an open access article distributed under the terms and conditions of the Creative Commons Attribution (CC BY) license (https://creativecommons.org/licenses/by/4.0/).
Share and Cite
Prats-Salvado, E.; Monnerie, N.; Sattler, C. Synergies between Direct Air Capture Technologies and Solar Thermochemical Cycles in the Production of Methanol. Energies 2021, 14, 4818. https://doi.org/10.3390/en14164818
Prats-Salvado E, Monnerie N, Sattler C. Synergies between Direct Air Capture Technologies and Solar Thermochemical Cycles in the Production of Methanol. Energies. 2021; 14(16):4818. https://doi.org/10.3390/en14164818
Chicago/Turabian StylePrats-Salvado, Enric, Nathalie Monnerie, and Christian Sattler. 2021. "Synergies between Direct Air Capture Technologies and Solar Thermochemical Cycles in the Production of Methanol" Energies 14, no. 16: 4818. https://doi.org/10.3390/en14164818