Article

Exploring Avoided Environmental Impacts as Well as Energy and Resource Recovery from Microbial Desalination Cell Treatment of Brine

1
Department of Science and Technology, Parthenope University of Naples, 80143 Naples, Italy
2
Department of Chemical Sciences, University of Naples Federico II, 80126 Naples, Italy
3
State Key Joint Laboratory of Environment Simulation and Pollution Control, School of Environment, Beijing Normal University, Beijing 100875, China
*
Authors to whom correspondence should be addressed.
Energies 2021, 14(15), 4453; https://doi.org/10.3390/en14154453
Submission received: 21 May 2021 / Revised: 2 July 2021 / Accepted: 13 July 2021 / Published: 23 July 2021
(This article belongs to the Collection Feature Papers in Energy, Environment and Well-Being)

Abstract

:
Seawater represents a potential resource to ensure sustainable availability of water for population and irrigation purposes, especially in some areas of the world. Desalination processes allow the production of fresh water, but they generate also brine as waste product. Sustainable brine management should be identified to ensure proper disposal and potentially resource recovery. This experimental study showed that emerging technologies such as Microbial Desalination Cells (MDCs) may provide a valuable contribution to the sustainability of the seawater desalination sector. In this paper, we report results on lab-scale desalination brine treatments applying MDCs, which allow energy savings, resource recovery, environmental impact minimization, and reduction of the organic load in municipal wastewater. Our results showed that MDCs’ treatment allows the removal of approximately 33 g of salts (62% of the total)—including chlorides, bromides, and sulphates—from 20 mL of brine within 96 h. The MDCs, according to the source of energy and the presence of mature biofilm at the anode, spent 7.2 J, 7.9 J, and 9.6 J in the desalination process, with the higher amount of energy required by the abiotic system and the lesser by the MDCs fed with just wastewater. Our approach also showed environmental and energy reductions because of potential metal recovery instead of returning them into marine environment. We quantified the avoided life cycle of human and marine eco-toxicity impacts as well as the reduction of cumulative energy demand of recovered metals. The main benefit in terms of avoided toxicity would arise from the mercury and copper recovery, while potential economic advantages would derive from the recovered cobalt that represents a strategic resource for many products such as battery storage systems.

Graphical Abstract

1. Introduction

1.1. Brine Production

Brine is the hypersaline concentrate produced as the main by-product of a seawater desalination process, which is a viable option for freshwater recovery, removing salts, and meeting the quality requirements for human uses [1,2].
However, brine production from desalination represents a critical environmental issue because of residual organic chemicals and heavy metals (such as copper, nickel, iron, chromium, zinc), high salinity, and relatively high temperature [3,4,5], which affect water ecosystems, soil, and groundwater [6]. The potential damages to the environment include eutrophication, pH fluctuations, and heavy metals and chemicals discharge in marine environments [4,5,6,7]. Recent estimates showed that for each m3 of freshwater water produced, approximately 1 ½ m3 of brine may be discharged [2]. Globally, desalinated water production is estimated to be 95.4 million m3/day, while associated generation of brine is 141.5 million m3/day [2].
Usually, brine is discharged in seawater and water bodies, applied on land, injected into deep wells, or treated in evaporation ponds, with environmental consequences for marine and soil ecosystems and then, indirectly, for human health [1,2,8]. Considering the significant impacts that brine disposal can generate and the increasing number of desalination plants worldwide, technological and research efforts are needed to address this challenge [5,6,9]. One of the main approaches investigated is the brine prevention leading to the setup of Zero Liquid Discharge (ZLD) systems [10], based on brine thermal treatment [11]. Other technologies for brine treatment are membrane-based processes such as reverse osmosis and thermal-based technologies such as brine concentrator and crystallizer [8]. All the listed processes require a certain amount of energy and, thus, they contribute to the greenhouse gases’ (GHGs’) emissions [6]. Different approaches have been applied with the aim of improving desalination processes’ sustainability, such as the utilization of renewable energies and waste heat, the use of high-quality materials, and proper maintenance plans [6,8]. In comparison to cost- and energy-intensive current water desalination technologies such as thermal and membrane-based desalination processes, MDCs can take advantage of microbial catalysis to produce bioenergy from wastewater (or other substrates able to sustain microbial growth) to drive the desalination process. thus reducing, or even avoiding, the use of energy from other sources (first and foremost, fossil fuels). As a result, MDCs not only are able to perform a significant reduction of salts’ content in salty waters, but also remediate wastewater by decreasing the organic load and nitrogen and phosphorous compounds’ concentration. Recently, researchers from different parts of the world set up MDCs with four or more chambers able to produce molecules such as hydrogen, ammonia, sulphate, and volatile fatty acid [12,13]. The last, but not the least, the possibility to develop a bio-desalination process by using membranes of cyanobacteria, has been demonstrated in MDCs, at least as a proof of concept [12]. For all the abovementioned reasons, MDCs can develop as an energy- and cost-effective and environmentally sustainable technology for saline water desalination [12,13].

1.2. Microbial Desalination Cells (MDCs): An Emerging Technology

Bio-electrochemical Systems (BESs) represent an emerging technology—that may be scaled up at the industrial level—useful for many sectors. Among them, the main applications are to wastewater treatment, production of bioenergy from biomass, sediment/soil remediation, biosynthesis of commodity chemicals, and the setup of biomedical devices [14,15,16,17,18,19]. Recently, an innovative process, able to combine wastewater treatment and salty waters’ desalination, captured the interest of the scientific community, the Microbial Desalination Cells (MDCs). MDCs are based on the metabolism of electroactive bacteria, which provide the energy needed to drive the desalination process [15,20,21]. Sources of energy (namely, the feedstock provided to bacteria) can be wastewater, activated sludge, dyed industrial effluents, cattle manure, nitrates in groundwater, and many others even though, especially at lab scale, sodium acetate is provided as a source of carbon and energy [22,23]. As essentially based on microbial metabolism, MDCs are listed among the renewable energy-based technologies, even though they can be in need for external potentials to control the desalination process itself [15,22]. Recently, some authors reported the recovery of value-added products (such as H2, HCl, fulvic and humic acids, volatile fatty acids, SO42−) and the removal of pollutants from wastewater in association with the desalination process in four- or even five-chambers MDCs [22,24]. Other applications explored are groundwater remediation and hardness removal in water [23]. MDCs are interesting also because of their behavior as supercapacitors [25]. Santoro et al. [21] showed the increase of power outputs (up to 3.01 ± 0.01 W m−2) and desalination efficiency (about 60% removal in 44 h) in comparison with their negative control (traditional MDCs) by connecting a third electrode to the cathode and applying a pulse current of 2 and 3 mA every 2 s. Briefly, model MDCs are generally made up by three chambers (anode, cathode, and central chambers) separated by ions- exchanging membranes, even though multiple-chambers systems are used for the recovery of chemicals [15,23]. Figure 1 shows the schematic diagram of three- and four-chambers MDCs, according to Rahman et al. [22].
Even though much progress has been achieved in recent years, some bottlenecks have to be overcome in order to realize scalable applications of MDCs such as membrane fouling, high internal resistance and electric outputs, and pH fluctuations [23,26].

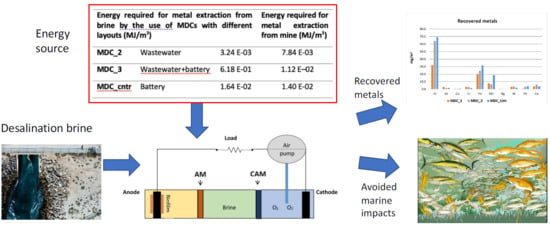
1.3. Goals of the Paper

With the aim of providing sustainable brine management options, in this work we explored the application of MDCs as brine treatment and, as a benefit of metal recovery, we evaluated the avoided human toxicity impacts by applying Life Cycle Analysis (LCA). The main research outcomes are MDCs can act as a stand-alone, energy self-sufficient solution for brine treatment removal of salt content in brine and organic load from a mix of municipal wastewater and mineral medium; potential recovery of metals contained in brine; and minimization of the life cycle of human and eco-toxicity impacts, as well as reduction of cumulative energy demand associated with the recovered metals.

2. Materials and Methods
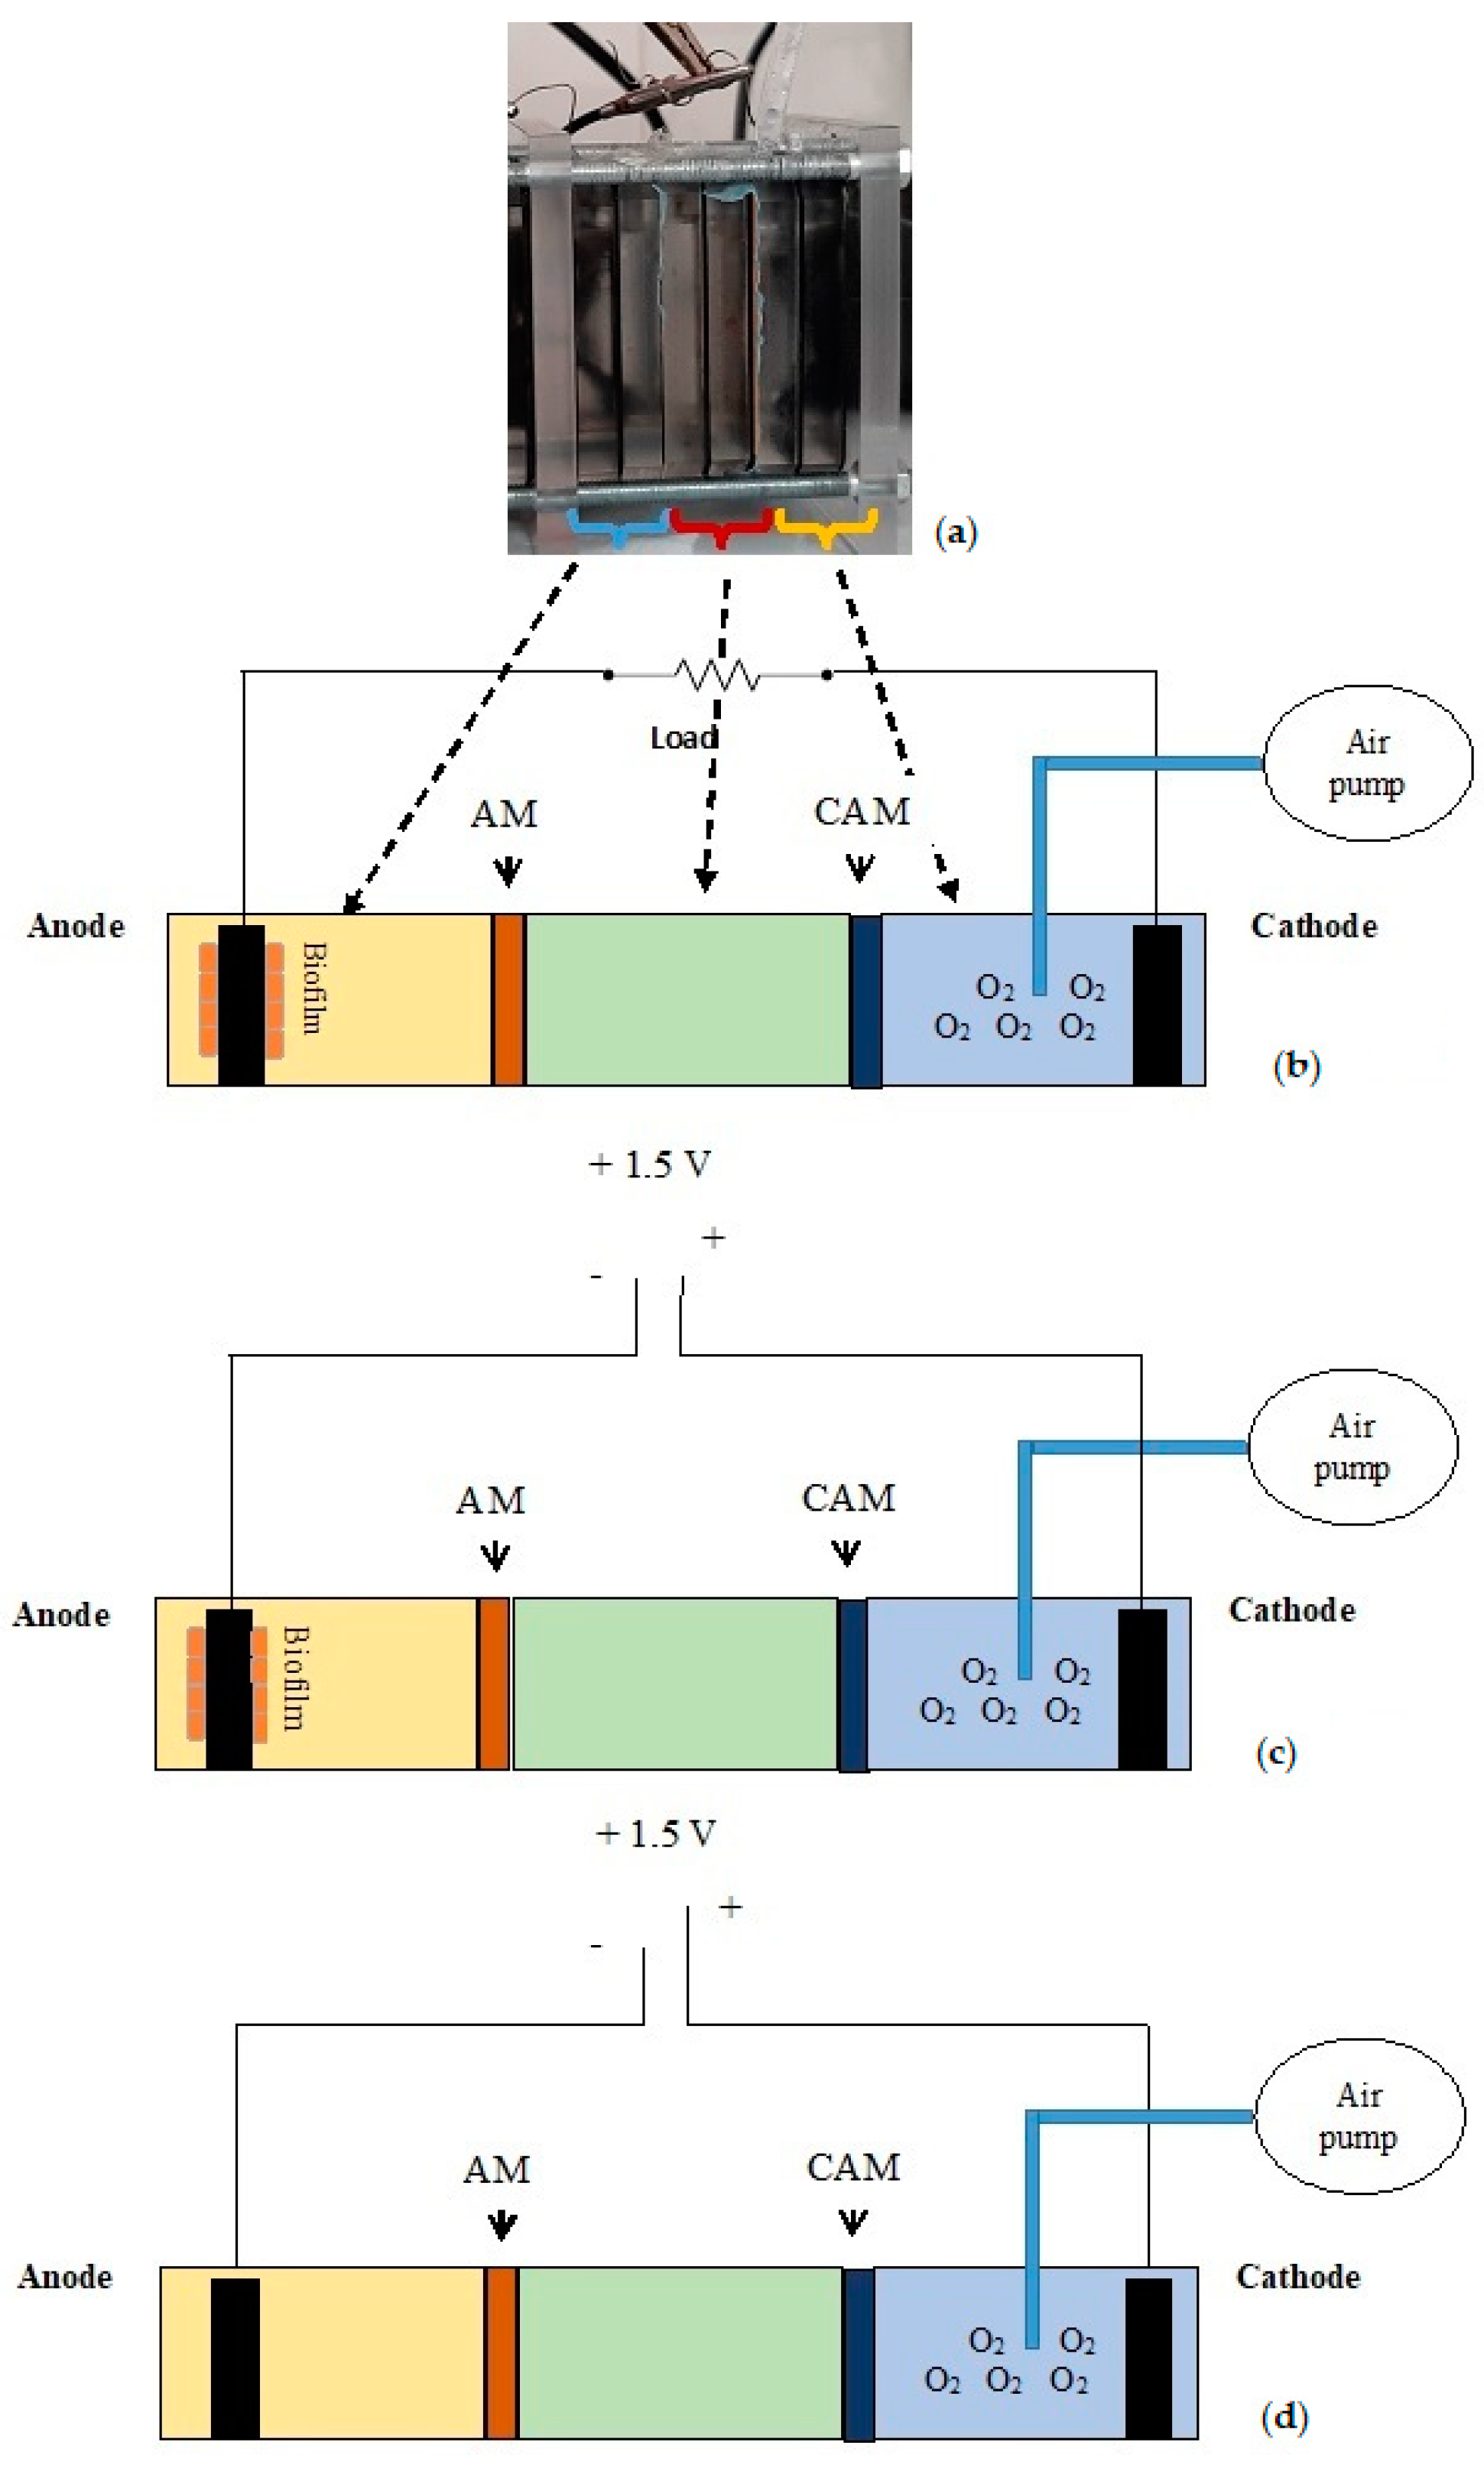
2.1. MDCs’ Setup

Three-chamber MDCs were assembled using acrylic bodies, screws, rubber gaskets, and carbon cloth material purchased at the University of Reading (UK). We filled the anodic, central, and cathodic chambers with 20 mL of anolyte, brine, and catholyte, respectively. A detailed description of the liquid media is reported in Section 2.2.
We used Fumasep® FAS-50 and Fumasep® FKM (Fumatech Inc., Sankt Ingbert, Germany) as anion- and as cation-exchanging membranes. Before being used, the membranes were soaked in a 0.5 M NaCl solution for 24 h, according to manufacturer’s instructions. Synthetic tissues were applied at the interface between membranes and liquids, to limit membranes fouling. Both anode and cathode electrodes were crafted using carbon cloth pieces of 6 cm × 4 cm, folded to form a double layer with overall surface of 52 cm2, and fixed with a titanium wire of 0.5 mm in diameter, which acted also as an electrons’ collector at the anode. All catholytes were constantly aerated by an air pump. As to microbial inocula, we incubated the anodes of MDC_2 and MDC_3 in 300 mL of activated sludge—previously sampled at a wastewater treatment plant in Naples District—for 1 month at 20 ± 2 °C. In order to foster the formation of anodic mature electroactive biofilms, we applied a potential of +550mV vs. Ag/AgCl reference electrode for 2 weeks, with the aim to reduce MDC_2 and MDC_3 start-up phase [19].
Then, we set up and evaluated the performance of MDCs (1) with (MDC_2 and MDC_3) and without (MDC_cntr) mature biofilm at the anode, and (2) with (MDC_3 and MDC_cntr) and without (MDC_2) the application of + 1.5 V external voltage at the electrodes, as reported in Figure 2. For evaluating MDCs’ performance, we calculated the following parameters: current density (CD), power density (PD), columbic efficiency (CE), and polarization behavior [16,19,23]. CD and PD referred to the cathode surface. In addition, in MDC_2 (mature anode biofilm, closed-circuit operation), we estimated the amount of energy (expressed in Joule) produced by the chemical energy stored in the fuel, which drove the desalination process.

2.2. Liquid Media

MDCs were applied to treat the brine produced by a desalination plant in Italy (Sicily Region). The collected brine was stored at 4 °C and then added to the central chamber of MDCs (20 mL). We used as anolyte a mixture of wastewater and mineral salt medium (GM Medium) in a 1:1 ratio. Wastewater samples were collected at the sewage treatment plant of Marcianise, in Naples District. As to GM Medium, it was prepared according to Logan et al. [26] by adding 4.09 g Na2HPO4, 2.93 g NaH2PO4 × H2O, 0.31 g NH4Cl, 0.13 g KCl, 12.5 mL metal salts solution, and 5 mL vitamin solution to one liter of distilled water. Sodium acetate (2g/L) was used as an additional source of carbon and energy in GM Medium, with a final concentration in the fuel of 0.01 M. A 100-mM PBS solution (pH 7.4, Applichem, Darmstadt, Germany) was used as catholyte. The latter was constantly aerated by means of an air pump. All experiments were performed in triplicate.

2.3. DMCs’ Operational Conditions

Unlike MDC_2 and MDC_3, MDC_cntr was not inoculated with an anode previously colonized by bacteria in order to evaluate essentially the contribution of the 1.5-V external potential on the desalination process. Immediately, the MDCs were left in Open Circuit Voltage (OCV) for 2 hours before performing a first polarization experiment, which was carried out using MBED NXP LPC1768 microcontroller and GNU OCTAVE 5.1.0 software. Then, MDC_2s were connected to an external resistor of 47 Ω for the first 24 h, then to 120 Ω for a further 48 h and, finally, to 220 Ω for about 24 h. MDC_3 and MDC_cntr were connected to a 1.5-V battery following the same time schedule of MDC_2s (Figure 1). The applied voltage range was 1.5 ± 0.1 V. Once disconnected, respectively, from the loads and the batteries, all MDCs were left in OCV until they achieved a stable voltage. Then, we performed a new polarization experiment. Voltacraft DL191V dataloggers were used to record V values of all MDCs. Columbic Efficiency (EC) was calculated according to Nastro et al., 2014 [14]. The energy produced by MDC_2 and used to drive the desalination process was expressed, as usual, in J. After 96 h of operation at 20 ± 2 °C, we sampled brine, anolyte, catholyte, and membranes for chemical analyses. We also investigated the microbial populations at the anode of MDC_2 and MDC_3, using a Next Generation Sequencing method (ILLUMINA) to screen the rRNA 16S of both Proteo- and Archeobacteria in biofilms.

2.4. Chemical Analyses

We collected brine from MDC_2, MDC_3, and MDC_cntr replicates, obtaining a single sample of average composition for each system. In order to evaluate the recovery of metals and other ions, membranes from MDCs and negative controls were collected and stored in distilled water to avoid drying. Then, cation-exchange membranes were soaked in 3% v/v HNO3 solution to dissolve the absorbed cations. The obtained elutriates were analyzed for their content in Al, Cd, Cr, Fe, Mn, Hg, Ni, Pb, Cu, and Sb by inductively coupled plasma with mass spectrometry (Aurora M90, Bruker Daltonics, Bremen, Germany). The anion membranes were soaked in a solution of 3.6 mM Na2CO3 solution. The determination of chloride and sulphate was performed by ionic exchange chromatography with conductivity detector (IC 856, Metrohm, Herisau, Switzerland). With the aim of evaluating the desalination process efficiency, we analyzed treated brine for its Na+, Cl, Br-, K+, Mg2+, SO42−, and Ca2+ concentration after MDCs’ treatment. The concentration of all anions and cations was measured by ionic exchange chromatography, coupled with a conductivity detector. Cations were separated by a Metrosep C4 250/4.0 column using 3.0 mM HNO3 as eluent and a flow rate of 0.9 mL/min, whereas anions were separated by a Metrosep A supp7 250/40 column using 3.6 mM Na2CO3 as eluent at a flow rate of 0.7 mL/min. (IC 856, Metrohm, Herisau, Switzerland). The pH was measured by potentiometric methods (Mod 856/867, Metrohm, Herisau, Switzerland). Chemical Oxygen Demand (COD) in the anolytes was determined by oxidative acid digestion, followed by colorimetric measure (Hach, DR 3900, Düsseldorf, Germany). We carried out a Χ2 Test (α = 0.05) to analyze the results obtained by the three layouts.

2.5. MDCs’ Energy Inputs

The amount of current intensity provided by the external batteries to MDC_3 and MDC_cntr was calculated according to the Kirchhoff’s law:
Ib = (VbOCVMDC)/RMDC
where Ib is the current intensity provided by the battery b and OCVMDC is the Open Circuit Voltage of MDCs (MDC_3 and MDC_cntr). RMDC is the internal resistance of MDCs. The overall power provided to MDCs’ systems was calculated as follows:
Pb = VbIb = Vb ∗ [(VbOCVMDC)/RMDC]
where Pb and Vb are, respectively, the electric power and the voltage provided by the batteries, Ib is the current intensity flowing through the systems, and OCVMDC and RMDC are as above. Starting from Pb values, we calculated the overall energy amount provided to the systems for the entire duration of the experiments, expressed in J.
Further, we estimated the energy spent by the MDCs to remove from brine the metals captured by membranes (Al, Cd, Cr, Fe, Mn, Hg, Ni, Pb, Cu, Sb). Using Faraday’s law for electrochemical solutions and assuming as negligible the resistance of the brine to ions’ migration, we calculated the electrical equivalent Ei of each metal and the corresponding electric charge carried by each metal by means of Equations (3) and (4):
Ei = (ni/zi)
Qi = EiF
where Qi is the electric charge carried by a specific ion and expressed in Coulomb, F is the Faraday constant (96,500 C mol−1), and ni is the amount and zi is the charge of each considered metal. Then, we obtained the current (in Ampere) produced by the ions, according to Equation (5):
I = Qi/t
where t is the operation time, expressed in seconds. The power (P) used by the system to move and separate metals from brine was calculated according to Ohm’s law. Then, we calculated the amount of energy (expressed in Joule) needed to move and sequestrate metals from brine as:
E = Pt
We reported, then, the energy values in MJ/m3 of treated brine.

2.6. Life Cycle Analysis (LCA)

Life Cycle Analysis (LCA) is an analytical methodology that is considered to be the most comprehensive approach for the evaluation of potential environmental impacts of a system, service, or product, through its entire life cycle [27,28]. LCA allows the quantification of all energy and material inputs, outputs, and emissions, in each stage of a product’s life cycle from the extraction of raw materials to the component and product manufacturing, transport, distribution, operation phase, maintenance, reuse, recycling, and disposal. It has been standardized by the Society of Environmental Toxicology and Chemistry (SETAC) and the International Organization for Standardization (ISO) Standards 14,040 and 14,044 [29,30].
LCA allows the impact quantification from resource extraction, raw material production, manufacturing, refining, distribution, use and re-use, maintenance, and end of life [31,32]. Among all the impact categories, LCA allows the calculation of the total primary energy harvested from the environment in order to produce a given amount of end product (such as electricity), commonly named cumulative energy demand (CED). CED breakdowns provide useful details on the energy demand needed for the life cycle stages, including mining activities. Moreover, LCA estimates the human toxicity potential (HTP), which quantifies the potential harm of a unit of chemical released into the environment based on the inherent toxicity of a compound and its potential dose, and marine eco-toxicity potential (ETP), which refers to the impact on marine ecosystems as a result of toxic emissions to air, water, and soil.
The life cycle impact assessment method used in this analysis was ReCiPe Midpoint (H) that provides characterization factors (CFs) calculated with USES-LCA [33]. Specifically, CFs of human and marine eco-toxicity account for the environmental persistence (fate), accumulation in the human food chain (exposure), and toxicity (effect) of each chemical, assuming chemicals in brine are not recovered, being instead released to the marine environment. Due to potential uncertainties of fate, exposure, and effect of each substance, toxicity impacts should be intended as first estimates to be further investigated. Toxicity results calculated at the mid-point level are expressed using as reference unit “kg 1,4-dichlorobenzene equivalent” (kg 1,4-DBeq). In order to be as complete as possible, in this study ReCiPe Endpoint (H) was also applied with the aim of calculating avoided toxic impacts expressed also in terms of disability-adjusted life years (DALY), which take into account the years lost due to premature death or reduced quality of life due to illness. This metric is a combination of years of life lost due to premature mortality and the years of life lost due to disability as result of disease or its consequences. Finally, we also calculated the avoided biodiversity loss in terms of species disappeared per year. Mid-point and End-point avoided impacts provide useful first indications for potentially avoided damage impacts, although, as mentioned above, it should also be considered that these metrics include high uncertainties due to complex dynamic interaction between chemicals, humans, and ecosystems as well as potential variations in the exposure time and different geographical criticalities. Regarding the data sources, the foreground life cycle inventory used in this study corresponded to the specific mass of each recovered metal, applying MDC_2 treatment to the produced brine, while the background life cycle inventory database was based on the Ecoinvent database version 3 [34]. As a practical standpoint, the analysis was performed using the SimaPro software version 9.

3. Results and Discussion

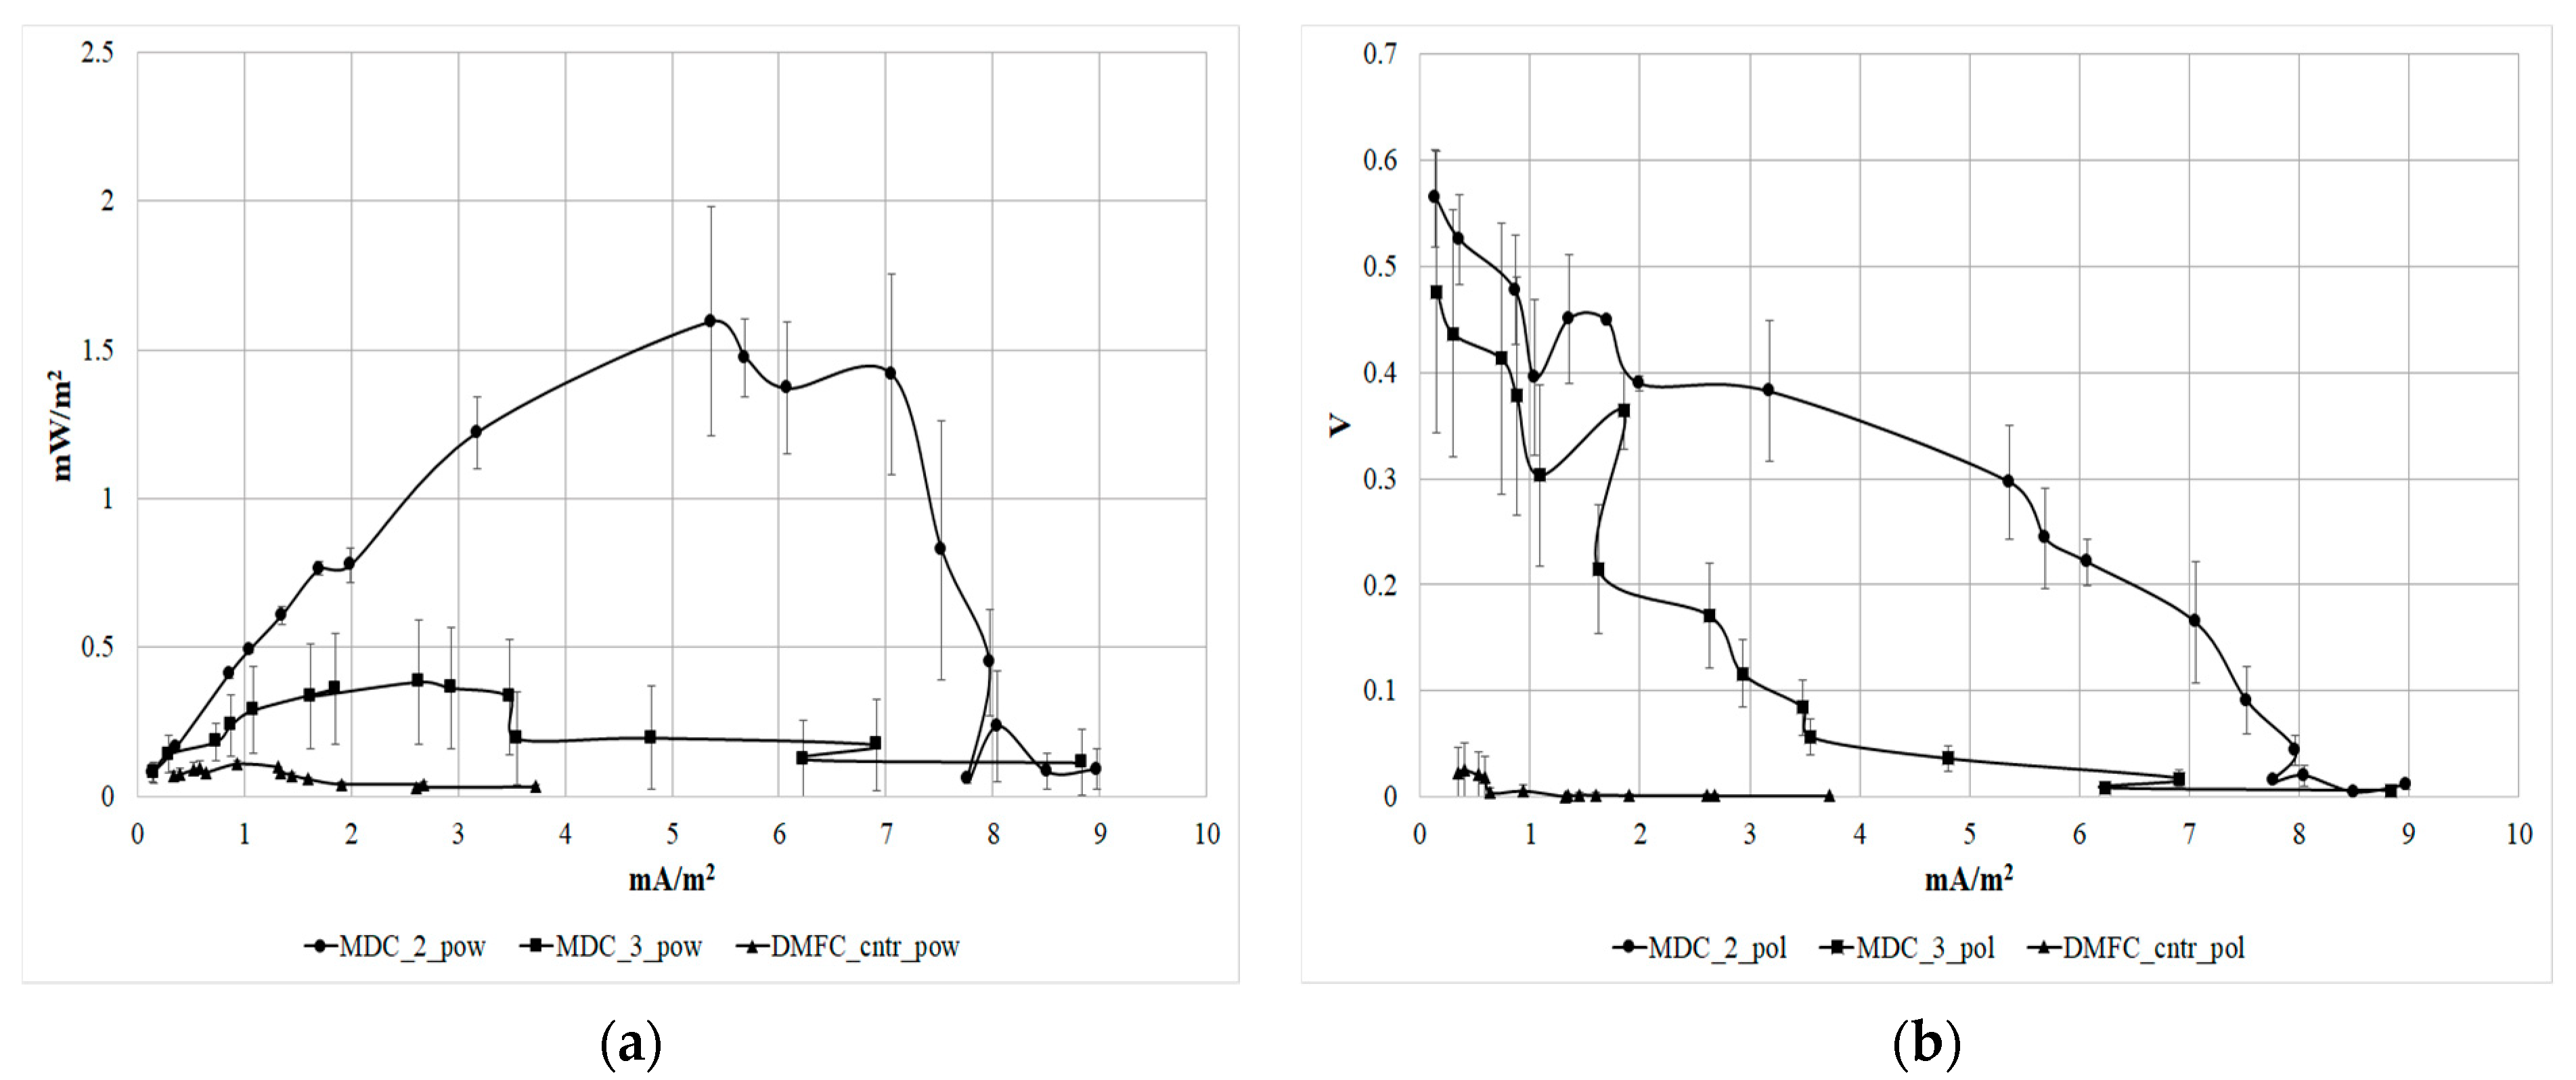
3.1. Polarization Behavior and Energy Outputs

MDC_2s and MDC_3s showed a proper polarization about 24 h after the setup, while no significant polarization behavior was observed in the abiotic control (MDC_cntr). Among all MDCs, MDC_2 revealed the highest energy production, with 8.97 ± 4.2 mA/m2 and 1.6 ± 0.4 mW/m2 average values over 12 different polarization experiments. Less stability and PD were observed in MDC_3, with 0.38 ± 0.21 mW/m2 and 8.83 ± 6.7 mA/m2 maximum values on average. These results showed that the application of the external voltage did not improve the performance of MDCs (as setup in this experiment) in terms of polarization and power outputs (Figure 3a,b).
As expected, COD decreased significantly in MDC_2 anolyte: The residual amount (93 mg/L COD) was only 23% and 25% of COD in MDC_cntr (410 mg/L) and MDC_3 (379 mg/L), respectively. MDC_2 received by wastewater an approximate energy amount of 7.2 J to be spent in the desalination process (with a CE of 26.8%). As to MDC_3 and MDC-cntr, the overall energy (Equation (2)) provided by the external batteries was 7.7 J and 9.6 J, respectively. Further, the estimated energy provided by the wastewater in MDC_3 was 0.29 J. The overall energy spent in the desalination process in MDC_3 was 7.9 ± 0.1 J. As to the energy needed to capture Al, Cd, Cr, Fe, Mn, Hg, Ni, Pb, Cu, and Sb at the membranes, according to our estimation, MDC_2 required the smaller amount of energy (3.24 × 10⁻³ MJ/m3) in comparison to MDC_cntr (1.63 × 10⁻² MJ/m3). MDC_3 required the highest amount of energy (6.18 × 10⁻¹ MJ/m3). This result could find a possible explanation in the increase in cationic membrane resistance due to the biological activity of bacteria at the membrane interface at anode compartment. Further studies may be needed to fully explain this result.

3.2. Microbiological Analyses

The analyses of microbial communities at the anodes revealed a prevalence of Pseudomonadaceae in MDC_2 (52.5%), almost absent in MDC_3 (1.85%). This result indicates that Pseudomonadaceae played an important role in the electrogenesys. In general, MDC_2 anodic community showed less diversity in comparison to MDC_3, in consequence of the different operational conditions realized (Table 1).
As to Archeobacteria, Methanobacteriaceae were prevalent in both MDC_2 (88.2%) and MDC_3 (87.9%), followed by Methanospirillaceae (5.9% and 3.5%) and an Unclassified_Euryarchaeota (5.9% and 5.4%). It is interesting to notice the presence (just in MDC_3) of a taxa including ammonia oxidizing bacteria, the Nitrososphaeraceae.

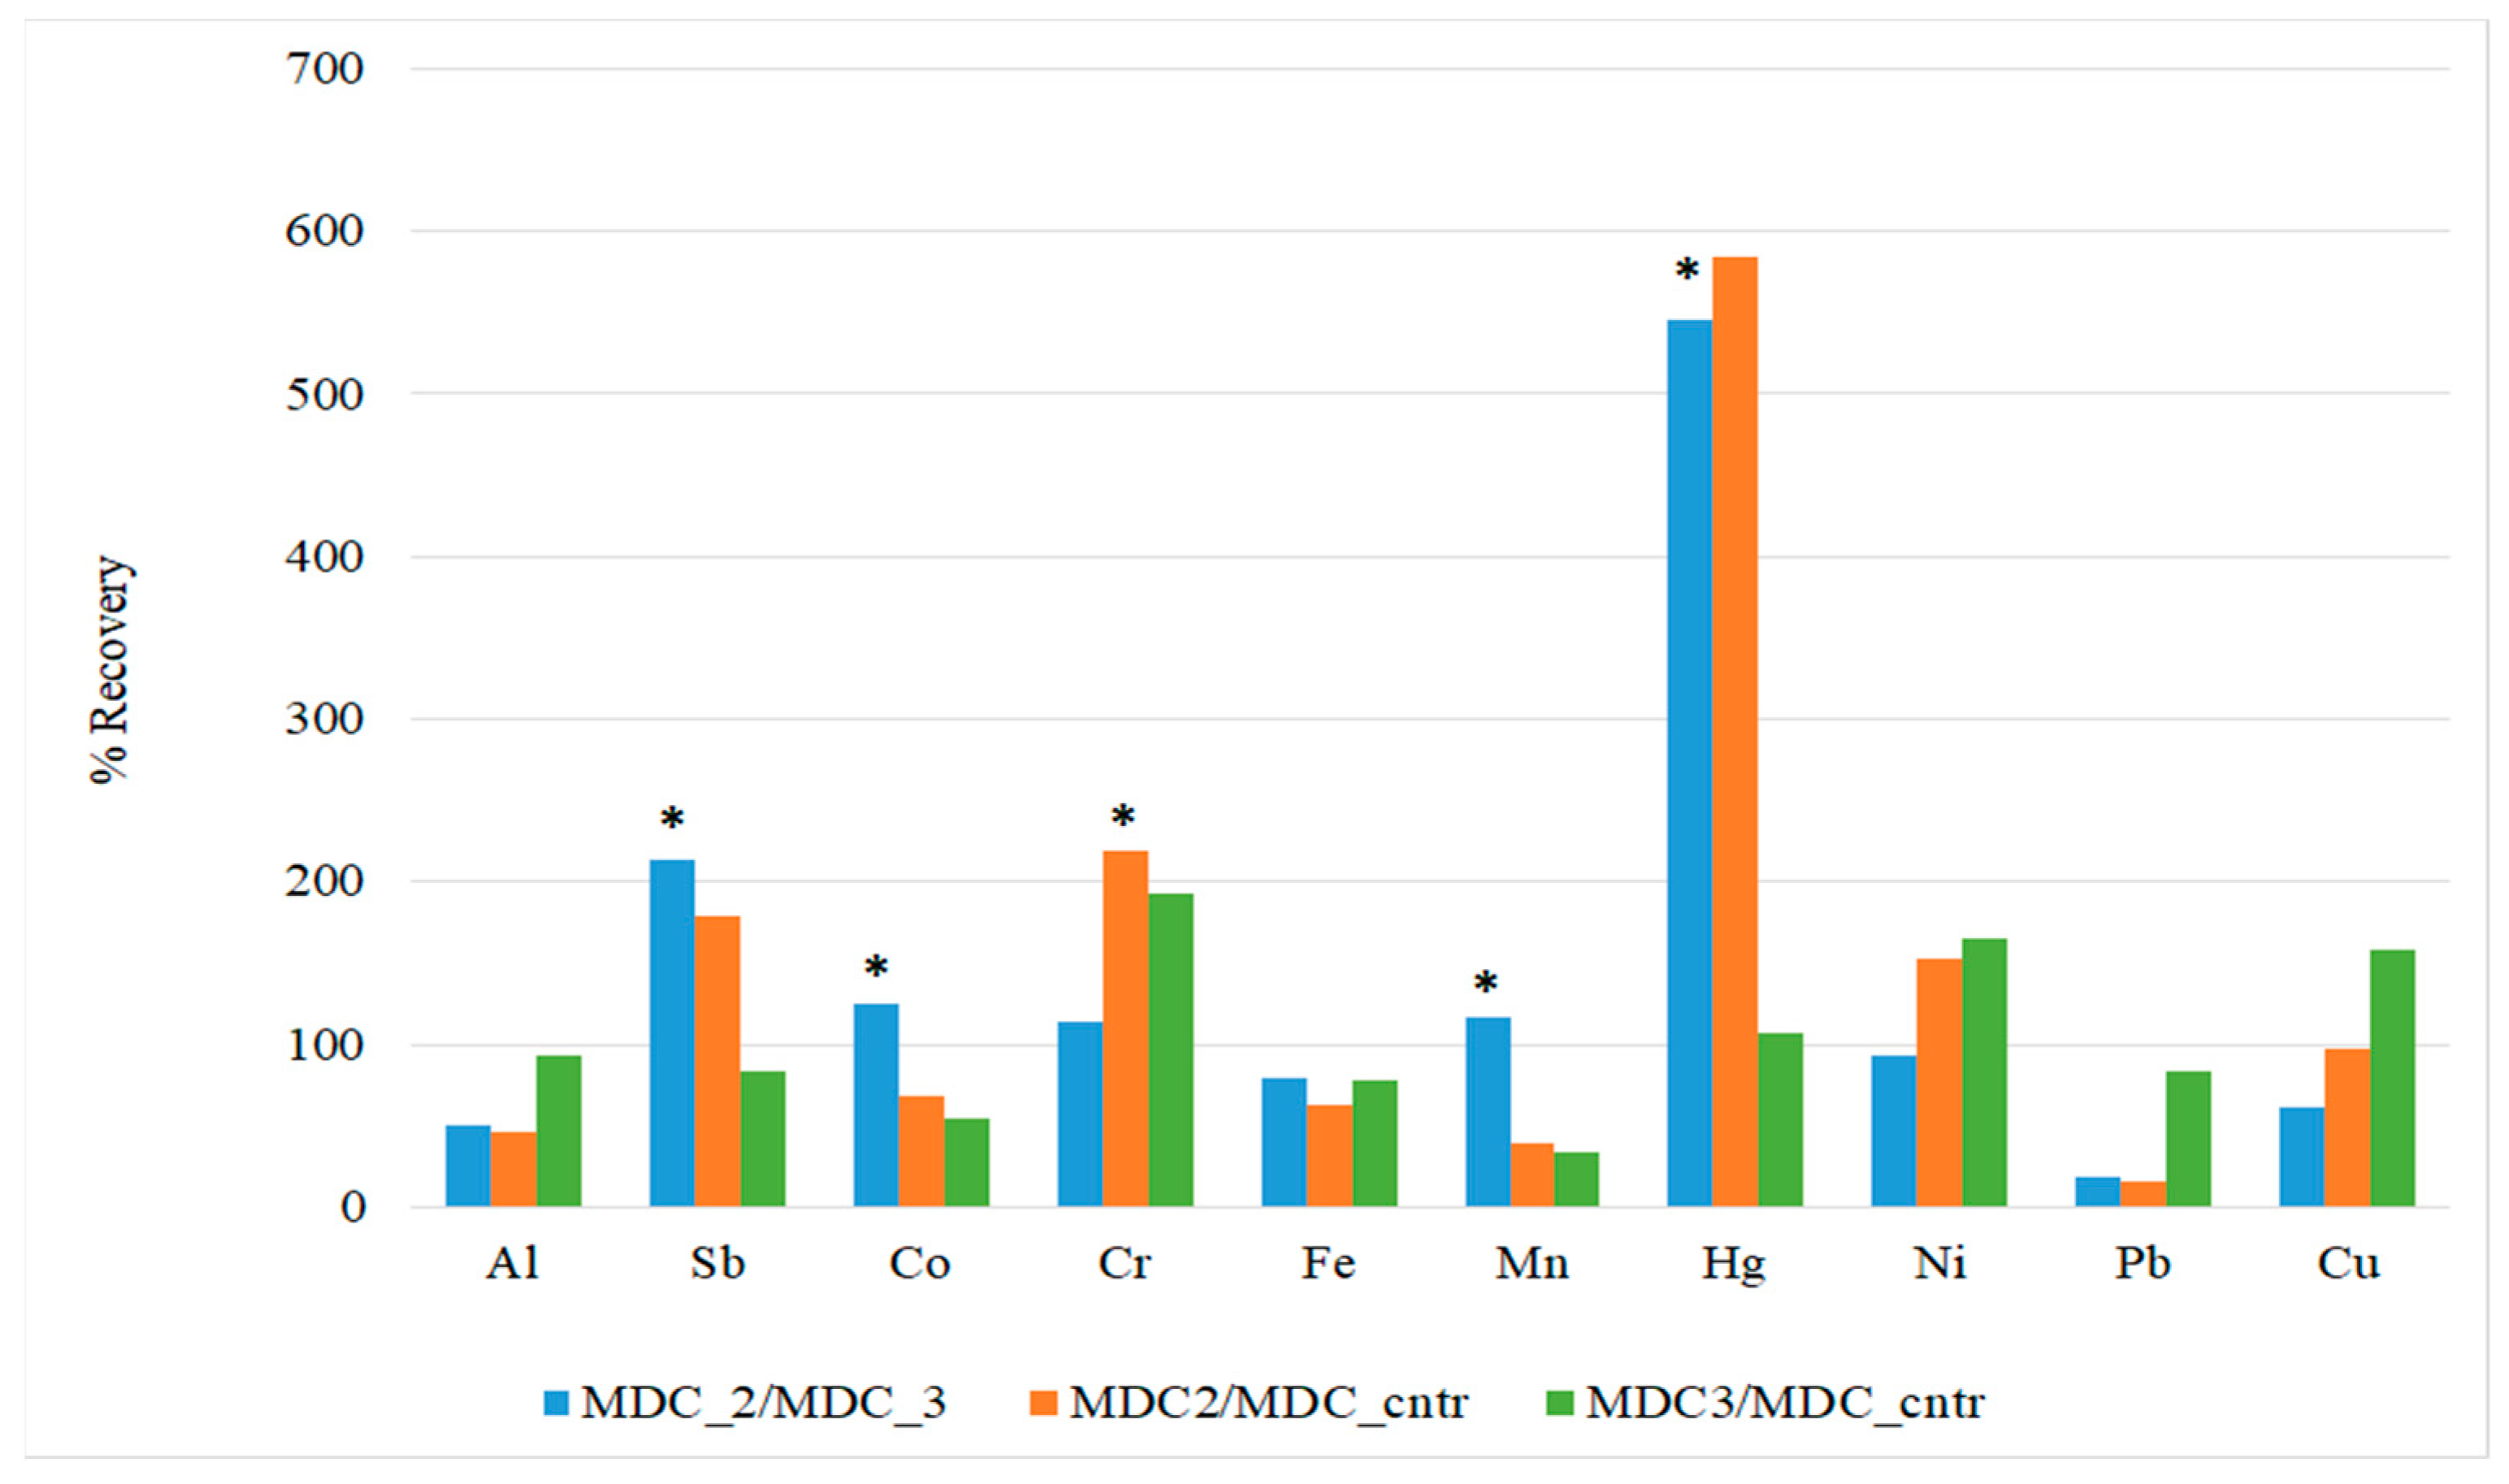
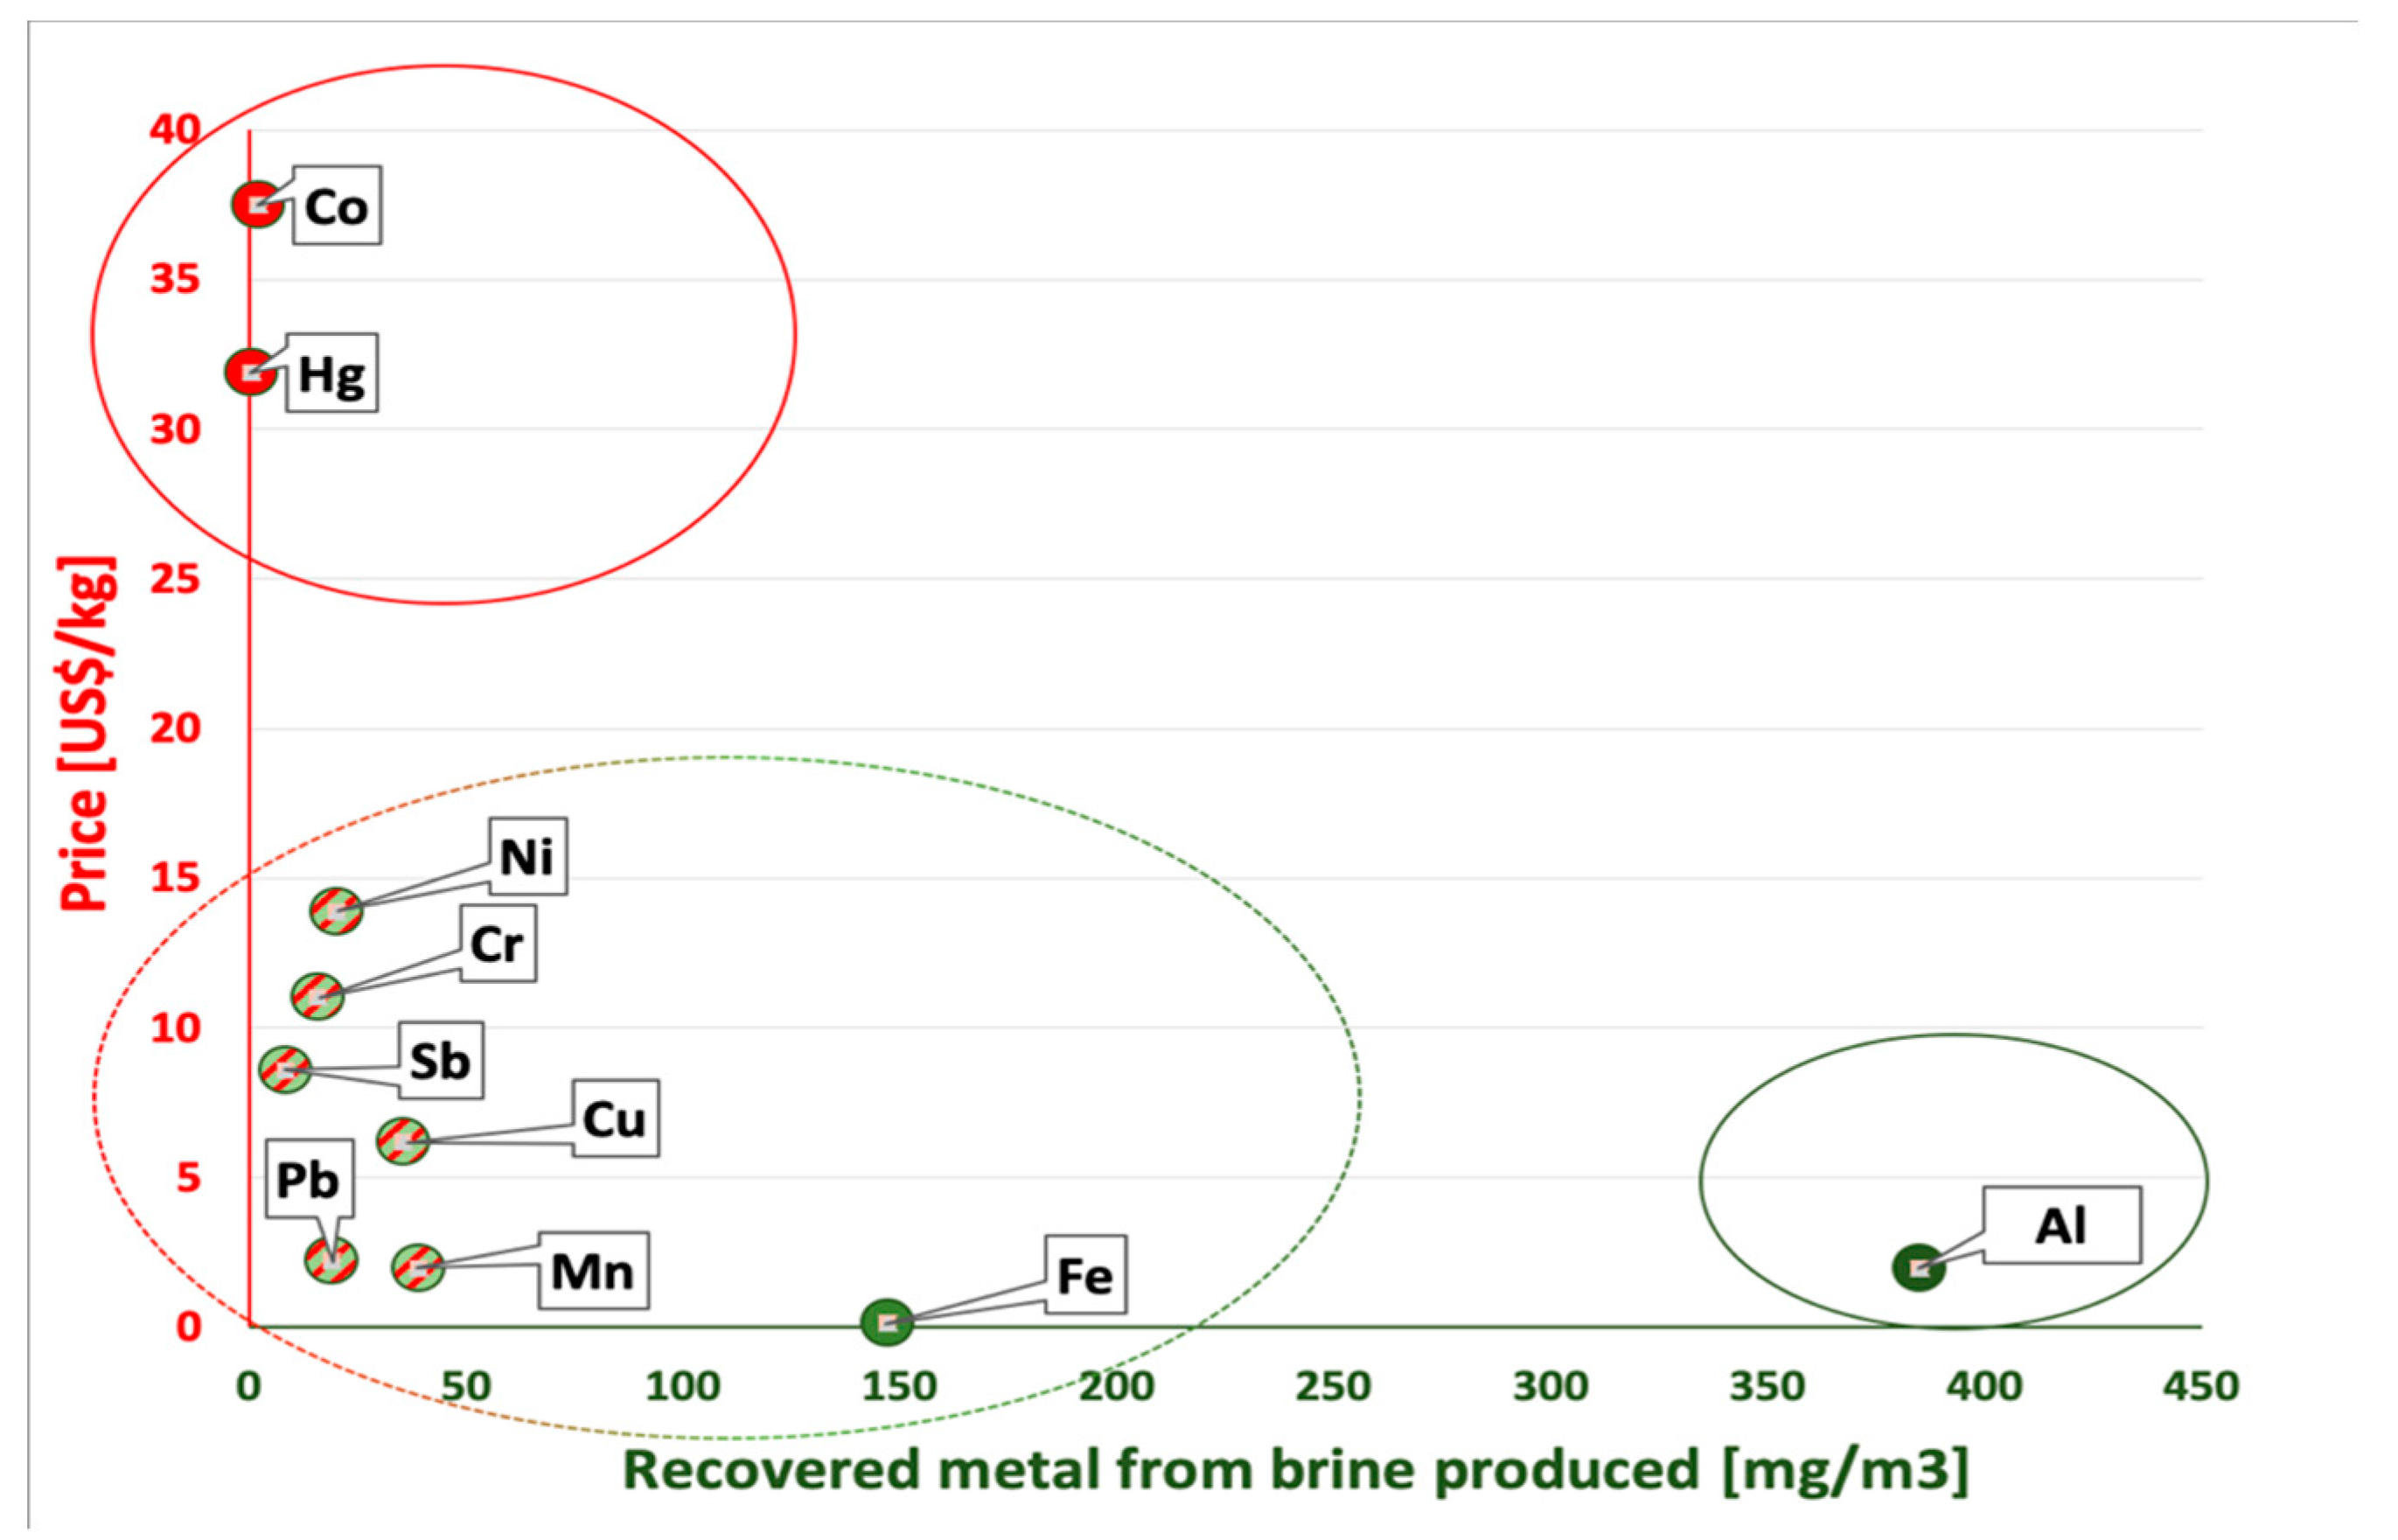
3.3. Chemical Analyses

In Table 2, we report the pH values and the concentration of the most abundant salts in brine before and after its treatment in MDCs. At the end of the treatment, we compared the residual dissolved salts’ concentration of MDC_2 and MDC_3 with the MDC_cntr to investigate the advantage of electrogenesis (in two different operational conditions) in comparison with a similar chemical–physical treatment, in which an external voltage drives the desalination process.
Overall, we measured a decrease in total salt concentration of 8.7% and 9.3% in MDC_2 and MDC_3, respectively, in comparison with MDC_cntr. Considering the salt decrease in rejected brine at the end of treatment, MDC_2, MDC_3, and MDC_cntr removed, respectively, 62.7%, 63.9%, and 59%. As for metals’ recovery, cationic membranes of MDC_2s captured Sb, Co, Cr, Fe, Mn, Pb, and Hg, with a higher rate in comparison to MDC_3s (Figure 4). Nevertheless, when only external voltage was applied (MDC_cntr) Co, Pb, Al, Fe, and Mn, were collected in higher amounts.
A simple statistical analysis by the Χ2 Test revealed significant differences between the amount of metals recovered in MDC_2 and MDC_cntr (p = 0.0039). We found a similar result between MDC_3 and MDC_cntr values (p = 0.037), which indicates that in MDCs the application of the external voltage could be not the prevalent force working. The role that microbial activity seems to play in the desalination process, with particular regards to metals’ sequestration, could prevail the application of an external voltage. Χ2 Test performed among the data obtained by MDC_2 and MDC_3 revealed the existence of a weak dependence between the two groups of data (p = 0.51). Nevertheless, this is a preliminary test and further data are needed to confirm this result.
In Figure 5 as an example, we provide an overview of potential recovered metals from brine MDC_3 system treatment compared to current metal price [$/kg] listed by the U.S. Geological Survey 2021 [35]. Considering the large amounts of brine treated by a scaled–up desalination plant, the amount of metals recovered may translate into a large economic value. Of course, economic advantages are different for the different MDCs’ systems. It is also worth noting that potential economic advantages should be evaluated also considering the effective cost of metal recovery, for which there is currently a lack of data. Therefore, future analysis should be focused also on a comparative assessment between economic advantages, recovered metals, and large-scale investments that are needed for implementing these practices.
Therefore, metal recovery may represent a potential environmental advantage in terms of circular economy [9,25], but the advantages in terms of the avoided release of potential toxic chemicals into the water bodies should not be disregarded. Hence, we applied LCA to the investigated processes with the aim of quantifying the avoided life cycle toxic impacts due to metal recovery in terms of avoided human toxicity (HTP) and marine eco-toxicity (ETP) impacts.
Specifically, we can calculate, as an example, the potential avoided impacts because of the recovery of Al, Sb, Co, Cr, Fe, Mn, Hg, Ni, Pb, and Cu for each m3 of brine treated by MDC_2 and, therefore, not released into water bodies. Overall, results—in terms of HTP—show that it would be possible to avoid the release of approximately 3.8 × 10⁻² kg 1,4DBeq per m3 of brine produced by desalination plants. Further, the total avoided potential eco-toxicity (ETP) impact due to all the metal recovery would be approximately 6.6 × 10⁻⁵ kg 1,4DBeq per m3 of brine that is not released into the marine eco-system. Detailed results in terms of avoided life cycle toxic impacts (at mid-point and end-point levels) are provided in Table 3. It should be noted that life cycle toxicity results may include uncertainties due to different exposure, fate, and effect of toxic chemicals. The main environmental advantage arises from the recovery of Hg, Cu, and Al, although any avoided impact is important, being well known that some chemicals generate impacts also at very low concentrations and that concentrations may increase through the marine metabolic chain.
From an energy perspective, metal recovery may also allow an energy saving because of the use of secondary metal production and, consequently, the avoided life cycle mining activities. Table 4 shows the estimated mining energy values of metals recovered from brine. This estimation is calculated considering the mass of recovered metals from the three MCD systems multiplied by their unit mining energy value, based on Nuss et al., 2014, and Ecoinvent database [34,36]. Results show that the main energy savings are associated with the recovery of Sb, Cu, and Al per kg of metals as the CED breakdown for mining activities is, respectively, 117 MJ/kg (83% of the total CED), 24 MJ/kg (45% of the total CED), and 24 MJ/kg (18% of the total CED). It should also be noted that the metal recovery could also represent a combined environmental benefit [31,37], due to finite resource availability of some strategic metals and potential economic gain due to the high cost of some metals such as Co. This last one is commonly used as cathode in battery storage systems as well as in other sectors (as an example, the current price of Co is $37.48 /kg, according to the latest report released by the U.S. Geological Survey).
Being aware that the three MDC systems are able to extract different amounts of each metal, if we compare the cumulative energy demand (Table 4) with the estimated energy required by MDCs to separate and capture the same metals from brine, we can see that MDC_2, MDC_3, and MDC_cntr may require, respectively, a smaller, a higher, and a similar amount of energy compared to the mining practices (Table 5). In particular, MDC_2 only fed by wastewater shows a very promising result for future research.
Future exploitation of recovered elements will entail the setup of proper and specific processes, at appropriate scale. Nevertheless, the potential advantages associated with the sequestration of metals in MDCs are undoubtedly significant.

4. Conclusions

Desalination processes represent a sustainable option for addressing water scarcity and providing fresh water for population and industry purposes. However, a sustainable management of the associated hypersaline brine production should be identified and implemented globally to reduce environmental impacts. Emerging technologies such as MDC technology are potential candidates to address this issue. This work provides a proof of concept focused on the application of MDC technology as potential brine treatment (for stand-alone devices or integrating other desalination processes). Results showed that this approach could provide several benefits, such as energy savings due to reduced metal mining activities, salt removal, resource recovery, wastewater treatment, and reduction of life cycle human and eco-toxicity impacts as well as cumulative energy demand and potential economic advantages due to metal recovery. Although MDCs’ process optimization and its scale-up represent a challenge for future industry applications, our analysis provides useful evidence that MDCs’ technology can contribute toward a greener pathway of brine treatments from desalination processes.

Author Contributions

E.L. and R.A.N. contributed to the paper outline and paper writing. R.A.N. designed and carried out the experimental activities and collected and elaborated on data. E.L. performed LCA analysis. M.T. (Maria Toscanesi) performed laboratory chemical analyses. M.T. (Marco Trifuoggi) contributed analytic tools. G.L. and S.U. supervised data elaboration, experimental activity, and text editing. All authors have read and agreed to the published version of the manuscript.

Funding

This research was founded by funding for circular economy research from H2020 EU’s Marie Skłodowska-Curie ITN program (ReTraCE Project, grant No. 814247), the Italian Ministry of Foreign Affairs and International Cooperation (MAECI, High Relevance Bilateral Projects, Grant No. PGR00954), the Sino-Italian Cooperation of NSFC Natural Science Foundation of China (Grant No. 71861137001), and COGEI S.r.l. (Costruzioni Generali Impiantistiche), Naples, Italy.

Institutional Review Board Statement

Not applicable.

Informed Consent Statement

Not applicable.

Data Availability Statement

Not applicable.

Acknowledgments

A special thanks to Raffaele Cimino, CEO of COGEI, for continuous support and to Paolo Di Giorgio for helping us with some critical calculations.

Conflicts of Interest

The authors declare no conflict of interest.

References

  1. Xevgenos, D.; Moustakas, K.; Malamis, D.; Loizidou, M. An overview on desalination & sustainability: Renewable energy driven desalination and brine management. Desalination Water Treat. 2016, 57, 2304–2314. [Google Scholar] [CrossRef]
  2. Jones, E.; Qadir, M.; van Vliet, M.T.; Smakhtin, V.; Kang, S.M. The state of desalination and brine production: A global outlook. Sci. Total Environ. 2019, 657, 1343–1356. [Google Scholar] [CrossRef]
  3. Pistocchi, A.; Bleninger, T.; Dorati, C. Screening the hurdles to sea disposal of desalination brine around the Mediterranean. Desalination 2020, 491, 114570. [Google Scholar] [CrossRef]
  4. Frank, H.; Fussmann, K.E.; Rahav, E.; Zeev, E.B. Chronic effects of brine discharge from large-scale seawater reverse osmosis desalination facilities on benthic bacteria. Water Res. 2019, 151, 478–487. [Google Scholar] [CrossRef] [PubMed]
  5. Giwa, A.; Dufour, V.; Al Marzooqi, F.; Al Kaabi, M.; Hasan, S.W. Brine management methods: Recent innovations and current status. Desalination 2017, 407, 1–23. [Google Scholar] [CrossRef]
  6. Panagopoulos, A.; Haralambous, K.J. Environmental impacts of desalination and brine treatment—Challenges and mitigation measures. Mar. Pollut. Bull. 2020, 161, 111773. [Google Scholar] [CrossRef]
  7. Garrote-Moreno, A.; Fernández-Torquemada, Y.; Sánchez-Lizaso, J.L. Salinity fluctuation of the brine discharge affects growth and survival of the seagrass Cymodocea nodosa. Mar. Pollut. Bull. 2014, 81, 61–68. [Google Scholar] [CrossRef]
  8. Panagopoulos, A.; Haralambous, K.; Loizidou, M. Desalination brine disposal methods and treatment technologies A review. Sci. Total Environ. 2019, 693, 133545. [Google Scholar] [CrossRef]
  9. Morillo, J.; Usero, J.; Rosado, D.; El Bakouri, H.; Riaza, A.; Bernaola, F.J. Comparative study of brine management technologies for desalination plants. Desalination 2014, 336, 32–49. [Google Scholar] [CrossRef]
  10. Almasri, D.; Khaled, A.; Mahmoud, K.A.; Abdel-Wahab, A. Two-stage sulfate removal from reject brine in inland desalination with zero-liquid discharge. Desalination 2015, 362, 52–58. [Google Scholar] [CrossRef]
  11. Tsai, J.H.; Macedonio, F.; Drioli, E.; Giorno, L.; Chou, C.Y.; Hu, F.C.; Li, C.; Chuang, C.J.; Tung, K.L. Membrane-based zero liquid discharge: Myth or reality? J. Taiwan Inst. Chem. E 2017, 80, 192–202. [Google Scholar] [CrossRef]
  12. Jafary, T.; Daud, W.R.W.; Aljlil, S.A.; Ismail, A.F.; Al-Mamun, A.; Baawain, M.S.; Ghasemi, M. Simultaneous organics, sulphate and salt removal in a microbial desalination cell with an insight into microbial communities. Desalination 2018, 445, 204–212. [Google Scholar] [CrossRef]
  13. Al-Mamun, A.; Ahmad, W.; Baawain, M.S.; Khadem, M.; Dhar, B.R. A review of microbial desalination cell technology: Configurations, optimization and applications. J. Clean Prod. 2018, 183, 458–480. [Google Scholar] [CrossRef]
  14. Nastro, R.A. Microbial fuel cells in waste treatment: Recent advances. Int. J. Perform. Eng. 2014, 10, 367–376. [Google Scholar]
  15. Santoro, C.; Arbizzani, C.; Erable, B.; Ieropoulos, I. Microbial fuel cells: From fundamentals to applications. A review. J. Power Sources 2017, 356, 225244. [Google Scholar] [CrossRef]
  16. Gambino, E.; Chandrasekhar, K.; Nastro, R.A. SMFC as a tool for the removal of hydrocarbons and metals in the marine environment: A concise research update. Environ. Sci. Pollut. Res. 2021, 28, 30436–30451. [Google Scholar] [CrossRef]
  17. Falcucci, G.; Nastro, R.A.; Minutillo, M.; De Santis, E.; Erme, G.; Ulgiati, S.; Jannelli, E. Microbial fuel cells fed by solid organic waste: A preliminar experimental study, EFC 2013. In Proceedings of the 5th European Fuel Cell Piero Lunghi Conference 2013, 139–140 5th European Fuel Cell Piero Lunghi Conference and Exhibition, EFC 2013, Rome, Italy, 11–13 December 2013. Code 110891. [Google Scholar]
  18. Florio, C.; Nastro, R.A.; Flagiello, F.; Minutillo, M.; Pirozzi, D.; Pasquale, V.; Ausiello, A.; Toscano, G.; Jannelli, E.; Dumontet, S. Biohydrogen production from Solid Phase-Microbial Fuel Cell spent substrate: A preliminary study. J. Clean Prod. 2019, 227, 506–511. [Google Scholar] [CrossRef]
  19. Endreny, T.; Avignone-Rossa, C.; Nastro, R.A. Generating electricity with urban green infrastructure microbial fuel cells. J. Clean Prod. 2020, 263, 121337. [Google Scholar] [CrossRef]
  20. Jegathambal, P.; Nisha, R.R.; Parameswari, K.; Subathra, M.S.P. Desalination and removal off organic pollutants using electrobiochemical reactor. Appl. Water Sci. 2019, 9, 113. [Google Scholar] [CrossRef] [Green Version]
  21. Santoro, C.; Abad, F.B.; Serov, A.; Kodali, M.; Howe, K.J.; Soavi, F.; Atanassov, P. Supercapacitive microbial desalination cells: New class of power generating devices for reduction of salinity content. Appl. Energy 2017, 208, 25–36. [Google Scholar] [CrossRef]
  22. Rahman, S.; Jafary, T.; Al-Mamun, A.; Baawain, M.S.; Choudhury, M.R.; Alhaimali, H.; Siddiqi, S.A.; Dhar, B.R.; Sana, A.; Lam, S.S.; et al. Towards upscaling microbial desalination cell technology: A comprehensive review on current challenges and future prospects. J. Clean Prod. 2021, 288, 125597. [Google Scholar] [CrossRef]
  23. Carmalin, S.A.; Bhalambaal, V.M.; Lima, E.C.; Thirunavoukkarasu, M. Microbial desalination cell technology: Contribution to sustainable wastewater treatment process, current status and future applications. J. Environ. Chem. Eng. 2016, 4, 3468–3478. [Google Scholar] [CrossRef]
  24. Malakootian, M.; Mahdizadeh, H.; Nasiri, A.; Mirzaienia, F.; Hajhoseini, M.; Amirmahani, N. Investigation of the efficiency of microbial desalination cell in removal of arsenic from aqueous solutions. Desalination 2018, 438, 19–23. [Google Scholar] [CrossRef]
  25. Forrestal, C.; Xu, P.; Ren, Z. Sustainable desalination using a microbial capacitive desalination cell. Energy Environ. Sci. 2012, 5, 7161. [Google Scholar] [CrossRef]
  26. Logan, B.; Cheng, S.; Watson, V.; Estadt, G. Graphite Fiber Brush Anodes for Increased Power Production in Air-Cathode Microbial Fuel Cells. Environ. Sci. Technol. 2007, 41, 3341–3346. [Google Scholar] [CrossRef]
  27. Guinée, J.B.; Lindeijer, E. Handbook on Life Cycle Assessment: Operational Guide to the ISO Standards; Springer Science & Business Media: Berlin/Heidelberg, Germany, 2002. [Google Scholar]
  28. Consoli, F.; Allen, D.; Boustead, I.; de Oude, N.; Fava, J.; Franklin, R.; Jensen, A.A.; Parrish, R.; Perriman, R.; Postlethwaite, D.; et al. Guidelines for Life-Cycle Assessment: A “Code of Practice”. In Proceedings of the SETAC Workshop, Sesimbra, Portugal, 31 March–3April 1993. [Google Scholar]
  29. International Organization for Standardization, Standard ISO, 14040 Environmental Management—Life Cycle Assessment—Principles and Framework. 2006. Available online: https://www.iso.org/standard/37456.html (accessed on 15 April 2021).
  30. International Organization for Standardization, Standard ISO, 14044 Environmental Management—Life Cycle Assessment—Requirements and Guidelines. Available online: https://www.iso.org/standard/38498.html (accessed on 15 April 2021).
  31. Corcelli, F.; Ripa, M.; Leccisi, E.; Cigolotti, V.; Fiandra, V.; Graditi, G.; Sannino, L.; Tammaro, M.; Ulgiati, S. Sustainable urban electricity supply chain–Indicators of material recovery and energy savings from crystalline silicon photovoltaic panels end-of-life. Ecol. Indic. 2018, 94, 37–51. [Google Scholar] [CrossRef] [Green Version]
  32. Buonocore, E.; Mellino, S.; De Angelis, G.; Liu, G.; Ulgiati, S. Life cycle assessment indicators of urban wastewater and sewage sludge treatment. Ecol. Indic. 2018, 94, 13–23. [Google Scholar] [CrossRef] [Green Version]
  33. Goedkoop, M.; Heijungs, R.; Huijbregts, M.; De Schryver, A.; Struijs, J.; Van Zelm, R. ReCiPe 2008. In A Life Cycle Impact Assessment Method Which Comprises Harmonized Category Indicators at the Midpoint and the Endpoint Level, 1st ed.; Version 1.08; Ministry of Housing Spatial Planning and the Environment: The Hague, The Netherlands, 2009; Volume 6, pp. 1–26. [Google Scholar]
  34. The Ecoinvent Database. Available online: https://www.ecoinvent.org/references/references.html (accessed on 15 April 2021).
  35. U.S. Geological Survey. Mineral Commodity Summaries 2020: U.S. Geological Survey; U.S. Geological Survey: Reston, VA, USA, 2020; ISBN 978-1-4113-4362-7. [Google Scholar] [CrossRef] [Green Version]
  36. Nuss, P.; Eckelman, M.J. Life cycle assessment of metals: A scientific synthesis. PLoS ONE 2014, 9, e101298. [Google Scholar] [CrossRef]
  37. Loganathan, P.; Naidu, G.; Vigneswaran, S. Mining valuable minerals from seawater: A critical review. Environ. Sci. Water Res. Technol. 2017, 3, 37–53. [Google Scholar] [CrossRef] [Green Version]
Figure 1. In (a), a three-chambers MDCs for salty water desalination is sketched. In (b), the layout of more recent MDCs with four-chambers, able to realize the synthesis of HCl in addition to desalination, is displayed. In all MDCs, ion-exchanging membranes realize the separation between compartments. AEM: anionic-exchanging membrane; CEM: cationic-exchanging membrane (with permission of Rahman et al., 2021) [22].
Energies 14 04453 g001
Figure 2. MDCs’ experimental scheme. (a) Image of lab-scale MDCs; (b) MDC with mature biofilm, no external source of potential connected; (c) MDC with mature biofilm, 1.5-V external voltage applied; (d) MDC with no microbial inoculum (negative control). AM: anions-exchanging membrane; CAM: cations-exchanging membrane; Load: external load.
Energies 14 04453 g002
Figure 3. Power (a) and polarization (b) curves obtained by interpolating average values of PD, CD, and V ± Standard Error.
Energies 14 04453 g003
Figure 4. Percentage of metal recovery from MDC_2 membranes in comparison to MDC_3 (MDC_2/MDC_3) and MDC_CNTR (MDC_2/MDC_CNTR). MDC_3/MDC_CNTR: percentage of the metal recovery in MDC_3 in comparison with MDC_CNTR. The asterisks are placed over the histograms of metals, whose recovery was higher in MDC_2.
Energies 14 04453 g004
Figure 5. Recovered metals from brine MDC_3 system treatment [mg/m3] versus their market price [$/kg]. Market prices are based on [35].
Energies 14 04453 g005
Table 1. Microbial taxa (families) in MDC_2 and MDC_3.
TaxaMDC_2MDC_3
Bacillales_Incertae Sedis XII01.90
Bifidobacteriaceae0.161.38
Clostridiaceae 11.485.41
Clostridiales_Incertae Sedis XI0.161.35
Coriobacteriaceae0.001.55
Incertae Sedis XI0.161.35
Moraxellaceae30.8753.72
Parachlamydiaceae02.53
Peptostreptococcaceae0.162.43
Pseudomonadaceae52.551.85
Unclassified_Acidimicrobiales01.07
Unclassified_Actinomycetales01.73
Unclassified_Alphaproteobacteria2.460.48
Unclassified_Gammaproteobacteria7.063.02
Xanthomonadaceae01.24
Others < 1%4.9318.99
Table 2. Main salts’ content in brine before and after the treatment in MDCs.
ParametersUnits of MeasureBrineMDC_2_MDC_3_MDC_cntr_
pH 6.7 ± 0.26.6 ± 0.26.8 ± 0.26.8 ± 0.2
Cl-mg/L228718767718067489636
Br-mg/L17674.38386.3
SO4−2mg/L3937172415211700
Na+mg/L149934636815541264921
K+mg/L4120188108122
Ca2+mg/L18531037852886
Mg2+mg/L19116510096.7
Table 3. Life cycle human toxicity potential (HTP) and marine eco-toxicity potential (ETP) avoided impacts due to recovered metals [mg per m3 of brine] calculated with ReCiPe mid-point (expressed as kg1,4DB-eq/m3 brine) and end-point (expressed as DALY/m3 brine) life cycle impact assessment method, in the case of MDC_2 system. Life cycle toxicity results should be interpreted as a first indication as they may include uncertainties due to different exposures, fates, and effects of toxic chemicals. Recovered metals from brine in the three MDC systems are indicated in Table 4.
Method: ReCiPe Midpoint (H)Metals
MetricUnitAlSbCoCrFeMnHgNiPbCuTotal Impact
Mid-point Human toxicity potential (HTP)kg 1,4-DB eq/mg of recovered metal1.22 × 10−31.12 × 10−41.31 × 10−63.10 × 10−52.03 × 10−45.45 × 10−63.47 × 10−24.33 × 10−57.95 × 10−51.60 × 10−33.80 × 10−2
Mid-point Marine eco-toxicity potential (ETP)kg 1,4-DB eq/mg of recovered metal3.69 × 10−63.32 × 10−71.56 × 10−82.89 × 10−75.04 × 10−71.12 × 10−73.98 × 10−53.91 × 10−68.52 × 10−81.74 × 10−56.61 × 10−5
Method: ReCiPe Endpoint (H)Metals
MetricUnitAlSbCoCrFeMnHgNiPbCuTotal Impact
End-point Human toxicity (HTP)DALY/mg of recovered metal8.50 × 10−107.82 × 10−119.14 × 10−132.17 × 10−111.42 × 10−103.82 × 10−122.43 × 10−83.04 × 10−115.57 × 10−111.12 × 10−92.67 × 10−8
End-point Marine ecotoxicity (ETP)Species.yr/mg of recovered metal6.50 × 10−165.85 × 10−172.75 × 10−185.08 × 10−178.86 × 10−171.97 × 10−176.98 × 10−156.90 × 10−111.50 × 10−173.06 × 10−151.16 × 10⁻¹⁴
Table 4. Energy values of metals mining vs extraction from brine, based on Nuss et al., 2014 [36].
AlSbCoCrFeMnHgNiPbCuTotal Energy
  • MDC_3 Recovered metals (g/m3)
0.3840.0080.0020.0160.1470.0380.00050.0200.0190.035n.a.
  • MDC_cntr_Recovered metals (g/m3)
0.4130.009n.a.0.0030.0080.1880.1130.00040.0120.022n.a.
  • MDC_2 Recovered metals (g/m3)
0.1920.0170.0020.0180.1170.0450.0020.0180.0030.021n.a.
  • Mining Energy Demand (MJ/g)
0.0240.117n.a.0.0020.00020.012n.a.n.a.0.0080.024n.a.
  • MDC_3 Extraction Energy value of metals recovered from brine (MJ/m3)
9.2 × 10−39.7 × 10−4n.a.3.2 × 10−52.9 × 10−54.7 × 10−4n.a.n.a.1.5 × 10−48.5 × 10−41.12 × 10−2
  • MDC_cntr Extraction Energy value of metals recovered from brine (MJ/m3)
9.93 × 10−31.16 × 10−3n.a.7.74 × 10−61.66 × 10−62.26 × 10−3n.a.n.a.9.84 × 10−55.51 × 10−41.40 × 10−2
  • MDC_2 Extraction Energy value of metals recovered from brine (MJ/m3)
4.61 × 10−32.07 × 10−3n.a.3.64 × 10−52.35 × 10−55.43 × 10−4n.a.n.a.2.90 × 10−55.23 × 10−47.84 × 10−3
Table 5. Energy provided to the MDCs’ systems by either battery and/or wastewater (energy unit/treated brine volume) to separate metals from brine and cumulative energy demand (Nuss et al., 2014). All values are expressed as MJ/m3 brine.
Desalination
Process
Mining
Practices
Source of Energy
(Desalination)
MDC_23.24 × 10−37.84 × 10⁻³Wastewater
MDC_36.18 × 10−11.12 × 10⁻²Wastewater + battery
MDC_cntr1.64 × 10−21.40 × 10⁻²Battery
Publisher’s Note: MDPI stays neutral with regard to jurisdictional claims in published maps and institutional affiliations.

