
The Causal Linkage between Energy Price and Food Price


1
Department of Banking and Finance, Faculty of Economic and Administrative Sciences, European University of Lefke, Lefke 99780, Turkey
2
Department of Business Administration, Faculty of Economic and Administrative Sciences, European University of Lefke, Lefke 99780, Turkey
*
Author to whom correspondence should be addressed.
Energies 2021, 14(14), 4182; https://doi.org/10.3390/en14144182
Submission received: 17 May 2021
/
Revised: 24 June 2021
/
Accepted: 2 July 2021
/
Published: 11 July 2021
(This article belongs to the Special Issue Behavioral Models for Energy with Applications)
Abstract
:This paper aims to reveal the causal relationship between energy prices and food prices and whether this relationship is similar in the food sub-groups forming the food price index used. As food prices more than doubled during the 2008 economic crisis, this relationship has received considerable attention from researchers. Many researches have been conducted to determine the causes and consequences of the 2008 food price crisis. Researches are mainly focused on crude oil and bio-energy in terms of “energy”. This research is not only differentiated by the data used but also by the methodology employed. The study attempts to add new findings to the empirical food price literature by utilizing relatively newly developed methods, namely Toda–Yamamoto causality, Fourier Toda–Yamamoto causality, and spectral BC causality tests. The spectral BC causality test clearly reveals that there is bidirectional causality between the energy price index and food price indexes (grains, other food, and oils) at different frequencies.
1. Introduction
The COVID-19 crisis has once again shown that food security is one of the most important problems in today’s world and the future. The World Food Summit took place in Rome in 1996 and defined food security as “when all people at all times have access to sufficient, safe, nutritious food to maintain a healthy and active life” [1]. According to the United Nations’ World Population Prospects 2019 report [2], it was projected that the existing global population of 7.7 million in 2019 would exceed 9.7 billion by 2050 due to the expectation that the populations of less developed countries will double. While global food demand is increasing in parallel with the rise in the world population, available agricultural lands are decreasing due to urbanization. Additionally, the quality and quantity of water that can be used in agriculture is decreasing and agricultural lands are becoming arid due to intensive use and salty irrigation water. When all this is evaluated, it is clear that agriculture will have to feed more people using less soil and water over the coming years [3]. Although this risk was evident before the COVID-19 pandemic, it has now become more serious. In the last half of the twentieth century, although the world population has almost doubled, food production has also increased and the number of hungry people significantly decreased [3]. The “green revolution” that took place in the twentieth-century played an important role in this situation. Productivity increased rapidly and the food that people needed could be produced as a result. However, despite the fact that the increase in productivity has come to a halt in the current century, the demand for food continues to increase rapidly. This has caused prices to turn upwards.
The global commodity price crisis in 1974 ended post-war economic growth and gave rise to serious concerns. In the crisis of 1974, food prices were affected by the rise in general commodity prices, particularly of oil, metal, and energy. Both the 2007–2008 and 1974 crises were reasoned with loose monetary policies and enormous monetary liquidity. Unlike the crisis of 1974, the 2007–2008 crisis led to a more sustained rise in commodity prices [4].
Leaving aside past food price crises, as the world suffers from the COVID-19 pandemic, governments are serving record capital outflows, many currencies are depreciating, and it is strongly believed that the pandemic could become the most serious crisis ever [5].
In this research, the interactions between energy prices and different food indexes are investigated. When the research literature on energy prices versus food prices is examined, can be seen that researchers are mainly focused on crude oil and bio-energy in terms of “energy”. However, in the present study, the World Bank’s Commodity Price Data is used. The energy dependency of agricultural production is obvious; however crude oil is not the only form of energy used by agriculture. Agricultural production also uses coal and natural gas. In this manner, it was evaluated that using an energy index is more meaningful than using just crude oil to represent energy use in agriculture. This research is not only differentiated by the data used but also by the methodology employed. The empirical tests employed consist of a combination of the widely used Toda–Yamamoto time domain frequency test, the recently developed Fourier Toda–Yamamoto time domain frequency test, and the frequency domain causality test—spectral BC causality. The study attempts to add new findings to the empirical food price literature with considerably stronger methods.
2. Literature Review
Between 2007 and 2008 global food prices increased by more than double [6]. This phenomenon has received considerable attention and most of the literature on the area was published in the following years. However, the next food prices crisis in 2011 did not attract as much attention. Many studies determined the causes and consequences of the 2005–2008 food price crisis [6,7,8,9]. Schnepf [10] stated that unfavourable weather conditions in production reduced global supply and stocks and this affected prices. Some researchers have demonstrated that rising input costs, such as energy and chemical fertilizers, are influential factors [7,8]. Headley and Fan, noted that economic growth in the BRIC countries led to a shift in people’s spending habits towards higher agricultural products. Many other studies have focused on factors such as increasing oil prices, the weak dollar rate, high energy prices, and increased biofuel production.
The price of food can be affected by crude oil prices in several ways. On the supply side of food price increases, higher crude oil prices increase the production costs and as a result, the supply curve shifts to the left, which means higher food prices. This phenomenon was shown in the research of Baffes [11] in a paper examining the pass-through of crude oil price movements to 35 primary commodities by a reduced-form econometric framework (OLS regression), between the period of 1960–2005. The researcher showed that the index for food commodities has a significant pass-through and that crude oil prices should be a part of the aggregate production function [11]. Most agricultural products consume high energy inputs. The production of fertilizer uses energy in most phases. Agricultural machinery uses either electric energy or diesel fuel. Irrigation, product processing, and transportation also use either electric energy or diesel fuel. The costs of these stages are directly or indirectly affected by crude oil prices. On the demand side of food price increases, there is competition with bio-fuels. Increasing crude oil prices and environmental concerns encourage governments to support the energy crop production of farmers. High crude oil prices increase the demand for bio-fuels and thus the demand for corn and soybeans. The higher demand for corn and soybeans increases the price of these commodities, but the price increase is not limited to these products. Since agricultural lands are considered a scarce resource, high energy crop prices increase the planted area of these crops and reduce those of others. As a consequence, the prices of other crops also rise.
The researchers investigated the joint impacts of oil price and food price uncertainties and their correlations with food prices by using a non-linear least squares regression and by calculating comparative statistics for the period of 1974–2007 [12]. Theoretical predictions were confirmed by applying the model to Trinidad and Tobago. The results obtained from Trinidad and Tobago showed that an increase in oil price or oil price volatility caused food prices to increase [12]. Another study revealed that changes in the crude oil price significantly affected the price of each grain during the period between 3rd week of 2005 and the 20th week of 2008. Researchers explained this relationship based on the competition between grain commodities and the increased demand for bio-fuels derived from grains [13]. Researchers used a minimum Lagrange multiplier unit root test with two structural breaks to estimate structural break points and then performed an autoregressive distributed lag (ARDL) model to estimate the relationships.
Researchers investigated the co-movement of food prices and macroeconomic indexes by using component analysis. In terms of food prices, seven major products were taken into account: eggs, meat, milk, oilseeds, rice, sugar, and wheat. In terms of macroeconomic variables, crude oil prices, consumer price indexes, food production indexes, and GDP around the world were used. The time period was accepted as 1961–2005. The researchers explained that the oil price index had an influence on the food production index and as a result, crude oil prices had an indirect effect on food prices [14]. Pal and Mitra [15] aimed to discover the fluctuating interdependence between crude oil and world food prices in different periods. Researchers used detrended cross-correlation analysis to explore the interdependent changes (if any) between the pre- and post-crisis period. Tests showed that there were three break dates; therefore, the researchers divided the study period into four samples. The results provided corroborative evidence for the increasing positive interdependence between the crude oil price and the world food price index [15]. Pal and Mitra [16] performed another study on the subject with a less common but promising wavelet-based analysis. Researchers investigated the association between crude oil prices and world food price indices between the period of 1990 and 2016. Time domain Johansen cointegration analysis was applied as an initial test of a cointegrated relationship, and then wavelet coherence analysis incorporating the frequency information of data was continued. The researchers found a significant relationship between crude oil and food prices between mid-2001 and the 3rd quarter of 2012 [16].
Another study investigated the influence of oil price changes on food prices. The study was carried out on oil-exporting developing countries and the time period studied was 2001–2014. Analyses were conducted by using a non-linear panel autoregressive distributed lag (ARDL) model. The analysis showed that in the long term, there was a significant and positive relationship between oil price increases and food prices. However, the same relationship was not found with respect to oil price reductions. Moreover, the model used suggested an asymmetry in the behaviour of food prices in the short term [17].
Unlike other studies in the field, an empirical study on the effects of oil prices on agricultural commodity prices in South Africa showed no long-term relationship between oil prices and agricultural commodity prices. Similar results were obtained by applying nonlinear causality tests. As a consequence, researchers concluded that agricultural commodity prices are neutral to global oil prices in South Africa [18]. Researchers used Johansen cointegration for assessing long-term relationships and non-parametric Diks–Panchenko for Granger causality between the period of 2003–2014.
In terms of the literature on biofuels versus food prices, Barnard [19] proposed that ethanol fuel has the potential to be disruptive to global agricultural food prices. However, one of the most influential papers in the field is the study of Mitchel [20]. This paper investigated the factors behind food price increases between 2002–2008 and attempted to estimate the contribution of different factors such as high crude oil prices and the weak dollar. The study deduced that the most influential factor was the large increase in the production of biofuels in the US and EU [20].
Another important study and the most cited in the area of biofuels versus agricultural commodities is the work of Zhang et al. [21]. The study aimed to investigate the long-term cointegrations and short-term multivariate interactions of biofuels and agricultural commodities. Researchers applied the Johasen trace test for long-term relations while using th vector error corrections model (VECM) for short-term dynamics for the period of 1989–2008. Unlike the previous studies, the results indicated no direct long-term relationship and a limited short-term relationship [21]. Filip et al. [22] replicated the study of Zhan et al. [21] with an extended time series till 2017. The study confirmed the findings of the original paper in the replication part. Moreover, the study introduced the concept of significant co-movement between biofuel prices and food prices in the extended part [22].
Vo et al. [23] studied the causal relationship between agricultural products and oil markets by taking into account alternative oil shocks and aggregate demand. Researchers divided the period of study into three; 2000–2006, 2006–2013, and 2013–2018. Researchers applied a structural vector autoregressive (SVAR) model, variance decomposition technique, and impulse response function (IRF) to sub-periods of the time series and showed that not every crude oil and demand shock contributes in the same manner food prices. Researchers concluded that crude oil prices have an important influence on food price movements. The study is significant in terms of dividing the period of study into sub-periods, together with the studies of Al-Maadid et al. [24] and Roman et al. [25].
Nazlioglu [26] integrated the non-parametric causality method of Diks–Panchenko and the linear causality of Toda–Yamamoto in the literature. The study concentrated on three agricultural commodities; corn, wheat, and soybeans. The results of the linear approach indicated that there is no causal relationship between crude oil and the selected commodities, while the non-parametric approach showed that there is a non-linear causality between crude oil and the selected commodities.
Karakotsios et al. [27] provide one of the most recent articles in the field studied on crude oil prices and world food prices. Researchers applied both linear and asymmetric approaches to analysed variables for the short- and long-term dynamic causality, for the period of 2000–2015. Linear results showed a unidirectional causality while asymmetric framework supported long-term feedback features. The researchers pointed to a potential asymmetric causality.
3. Data and Methodology
This paper aims to reveal the causal relationship between the energy price index and food price indexes, and ascertain whether this relationship is similar across different food groups. Monthly commodity price data from 1980M1 to 2019M01 from the World Bank was used as the source in the empirical tests of this study. Table 1 reports the descriptive statistics of the variables. The energy price index and the food price index were considered as variables. The energy price index consists of coal, crude oil, and natural gas, with shares of 4.7%, 84.6%, and 10.8%, respectively. The food price index consists of grains, vegetable oil/meals, and other food, with shares of 28.2%, 40.8%, and 31%, respectively. Grains in the price index include rice, wheat, maize, and barley. Vegetable oils/meals include soybeans, soybean oil, soybean meal, palm oil, coconut oil, and groundnut oil. Lastly, the other food component includes sugar, bananas, beef meat, chicken meat, and oranges.
The time series used in this study were subjected to unit root tests for stationarity. These tests are known to exist in parts because each has different advantages and none is complete. Hence, the Zivot–Andrews unit root test is employed as it allows testing of the unit root in the presence of one structural break in the time series [28].
Different approaches were used to investigate the causality between the two variables. As a base causality test, the widely used Toda–Yamamoto causality test was applied. Toda and Yamamoto [29] developed this test, which is based on time domain causality and uses Wald test statistics, which means the test cannot be falsified by the integration order or the cointegration behaviour of the time series. Furthermore, while the data are used in raw form, no information is lost and the test procedure is more flexible. The Fourier Toda–Yamamoto test was developed very recently by Nazlioglu, et al. [30] and is another test performed in the present study. The test shares the advantages of the original Toda–Yamamoto test and extends it, as it enables the researcher to account for structural breaks. This means that the test is superior to the conventional causality test as it eliminates problems related to structural breaks.
As the main causality test in the present study, a frequency domain causality test—the spectral BC causality test—is employed to identify the causality between the energy price index (ENG) and food price indexes (FPC). The causality test was developed by Breitung and Candelon [31] based on the studies of Geweke [32] and Hosoya [33]. The test is differentiated from other causality tests performed, as it is a frequency domain causality test. Therefore, the causality test allows the researchers to measure the degree of variation in the series and the causality in high or low frequencies.
4. Empirical Findings
The energy price index and food price indexes variables were subjected to the Zivot–Andrews unit root test to determine the order of integration under the assumption that the variables might have structural breaks. The results of these tests are collected and documented in Table 2. The null hypothesis is that the variables have a unit root at their level. Based on the test results, while the oils variable seems stationary at levels, the other time series variables are stationary at the first difference.
To reveal the causal relationship between the energy price index and food price indexes, the Toda–Yamamoto and Fourier Toda–Yamamoto tests were employed within the time domain causality framework. The result of these tests are documented in Table 3. According to the Toda–Yamamoto causality test results, energy price changes cause the oil and other food price changes at a 5% significance. However, there is no causality from the energy price index to the grains price index. The same results were also obtained when the Fourier Toda–Yamamoto test was employed in the same direction. Furthermore, both the Toda–Yamamoto and Fourier Toda–Yamamoto tests support the bidirectional causal relationship between the energy price index and other food price indexes at the 5% significance level. Causality is also found from the oils price index to the energy price index, at the 10% significance level. However, both tests showed that there is a causal relationship flowing from the grains price index to the energy price index at the 5% significance level.
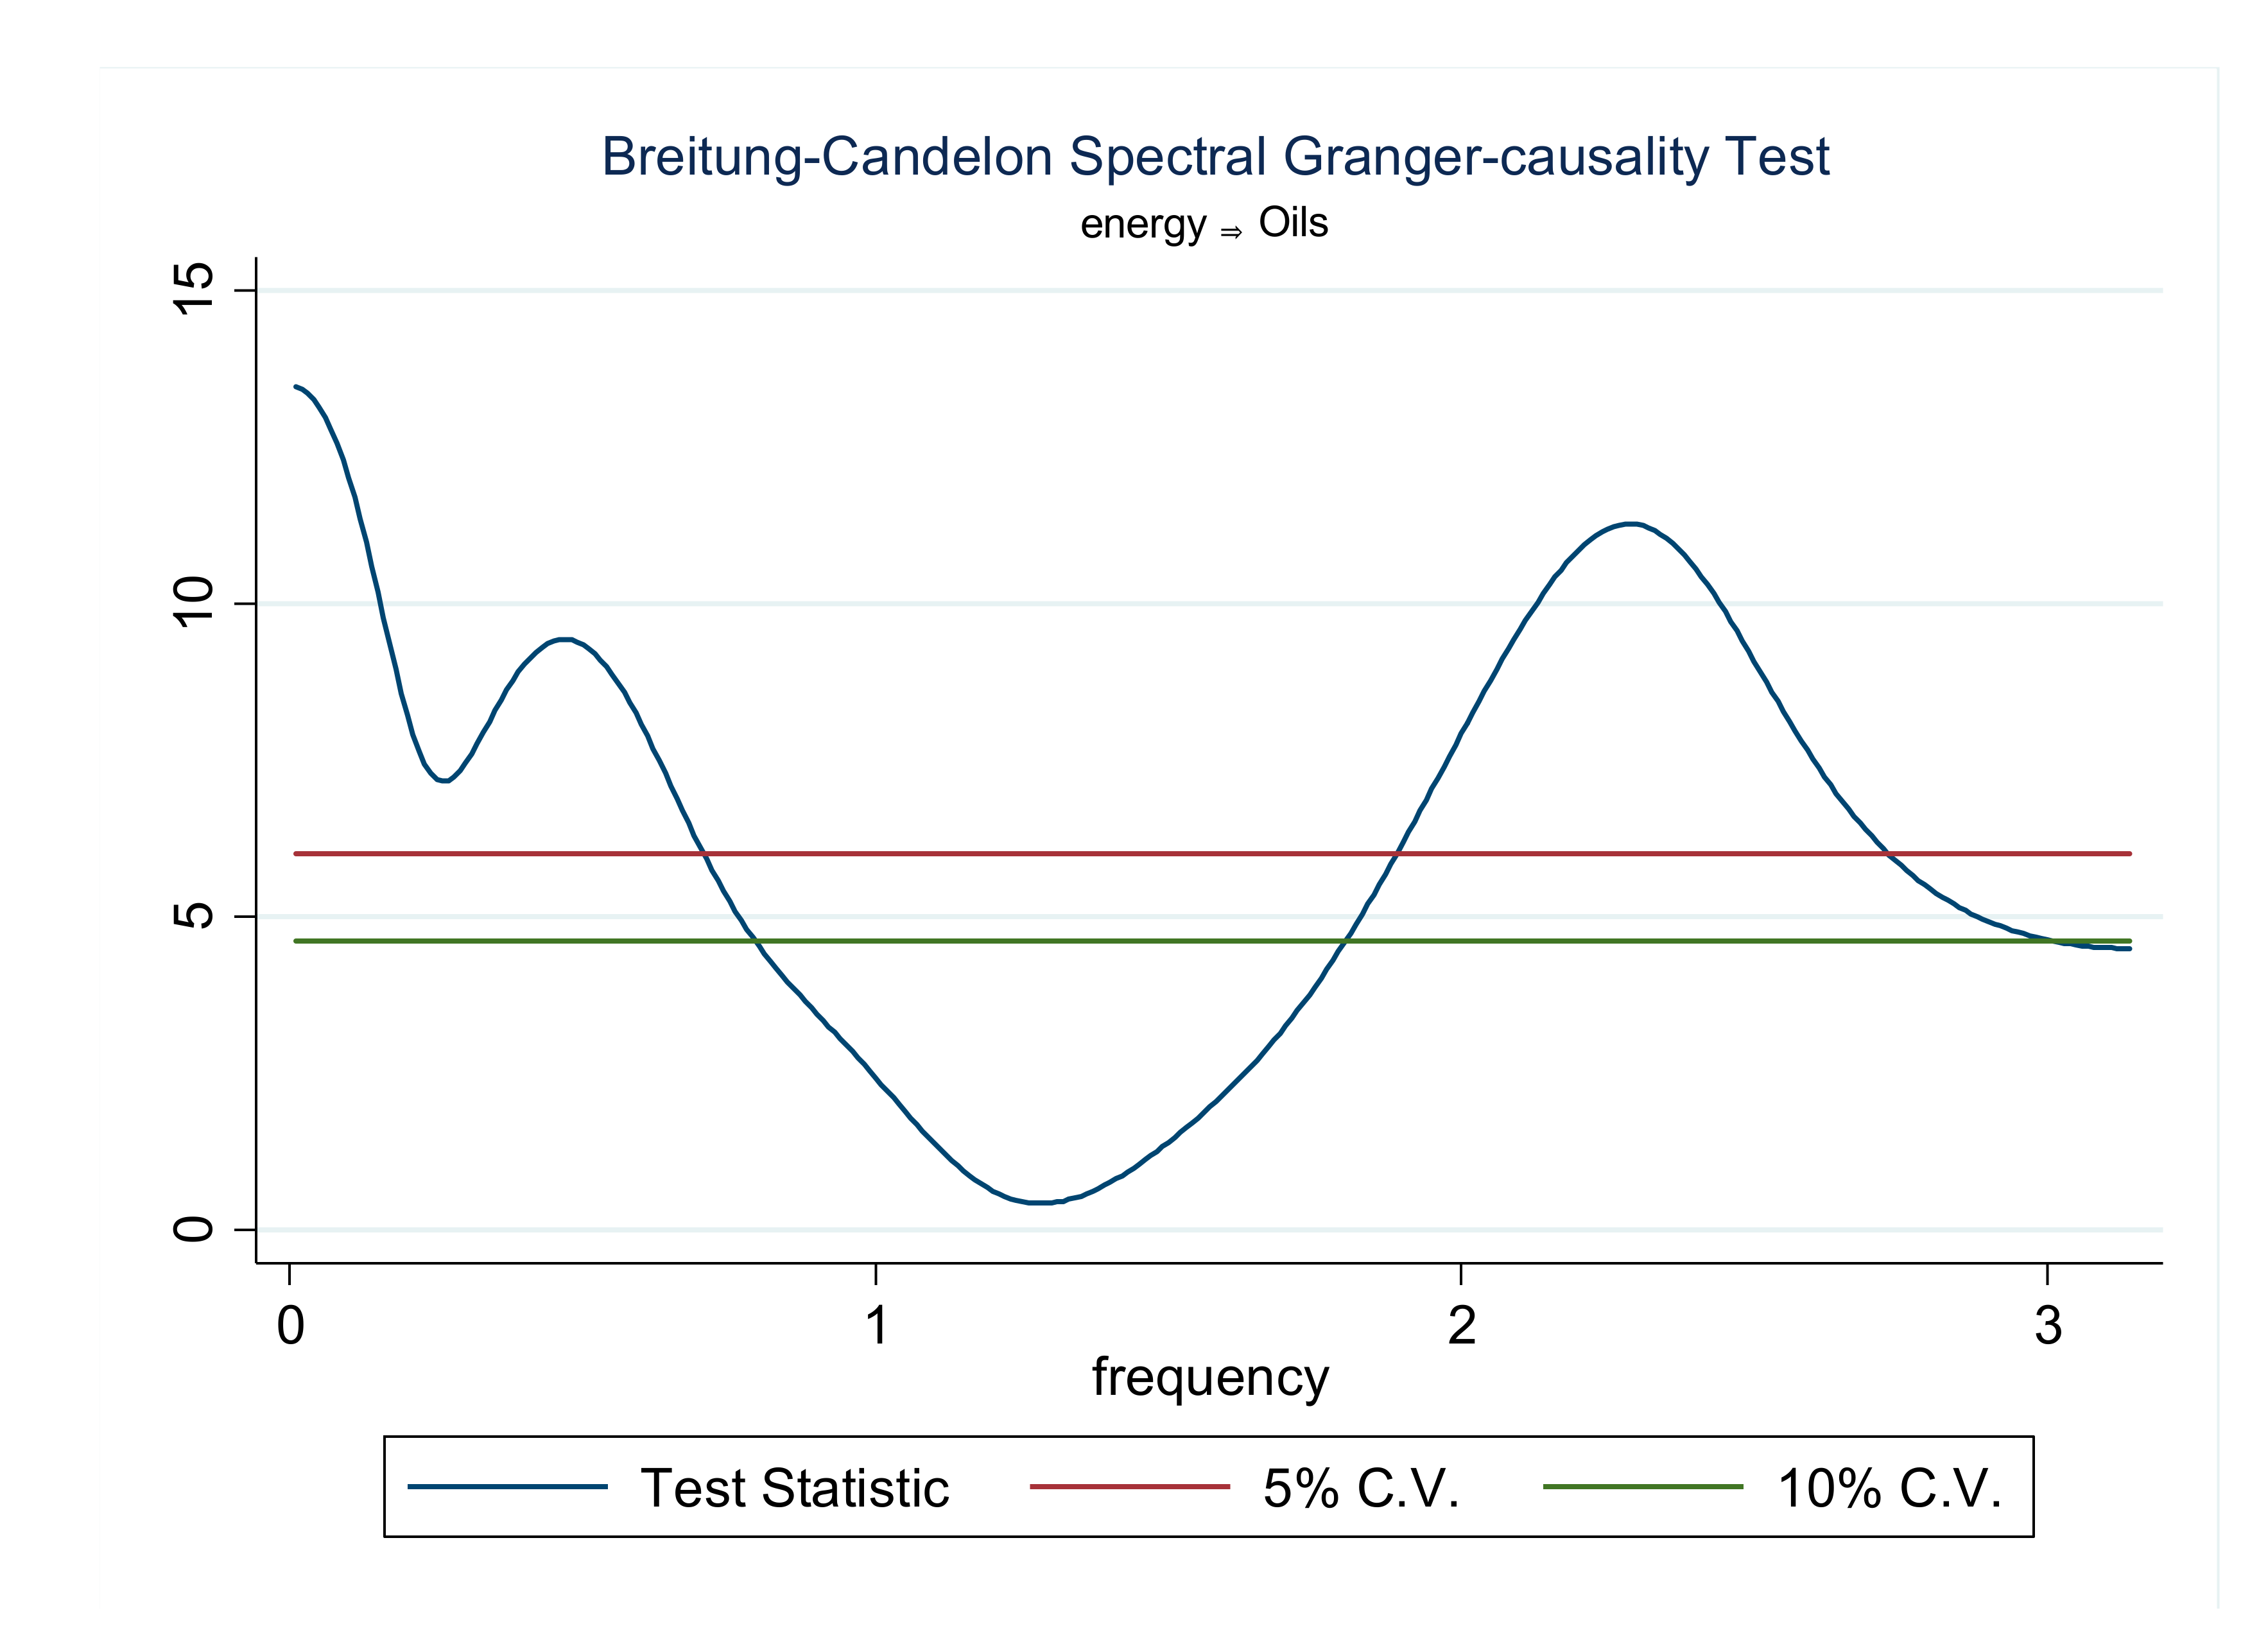
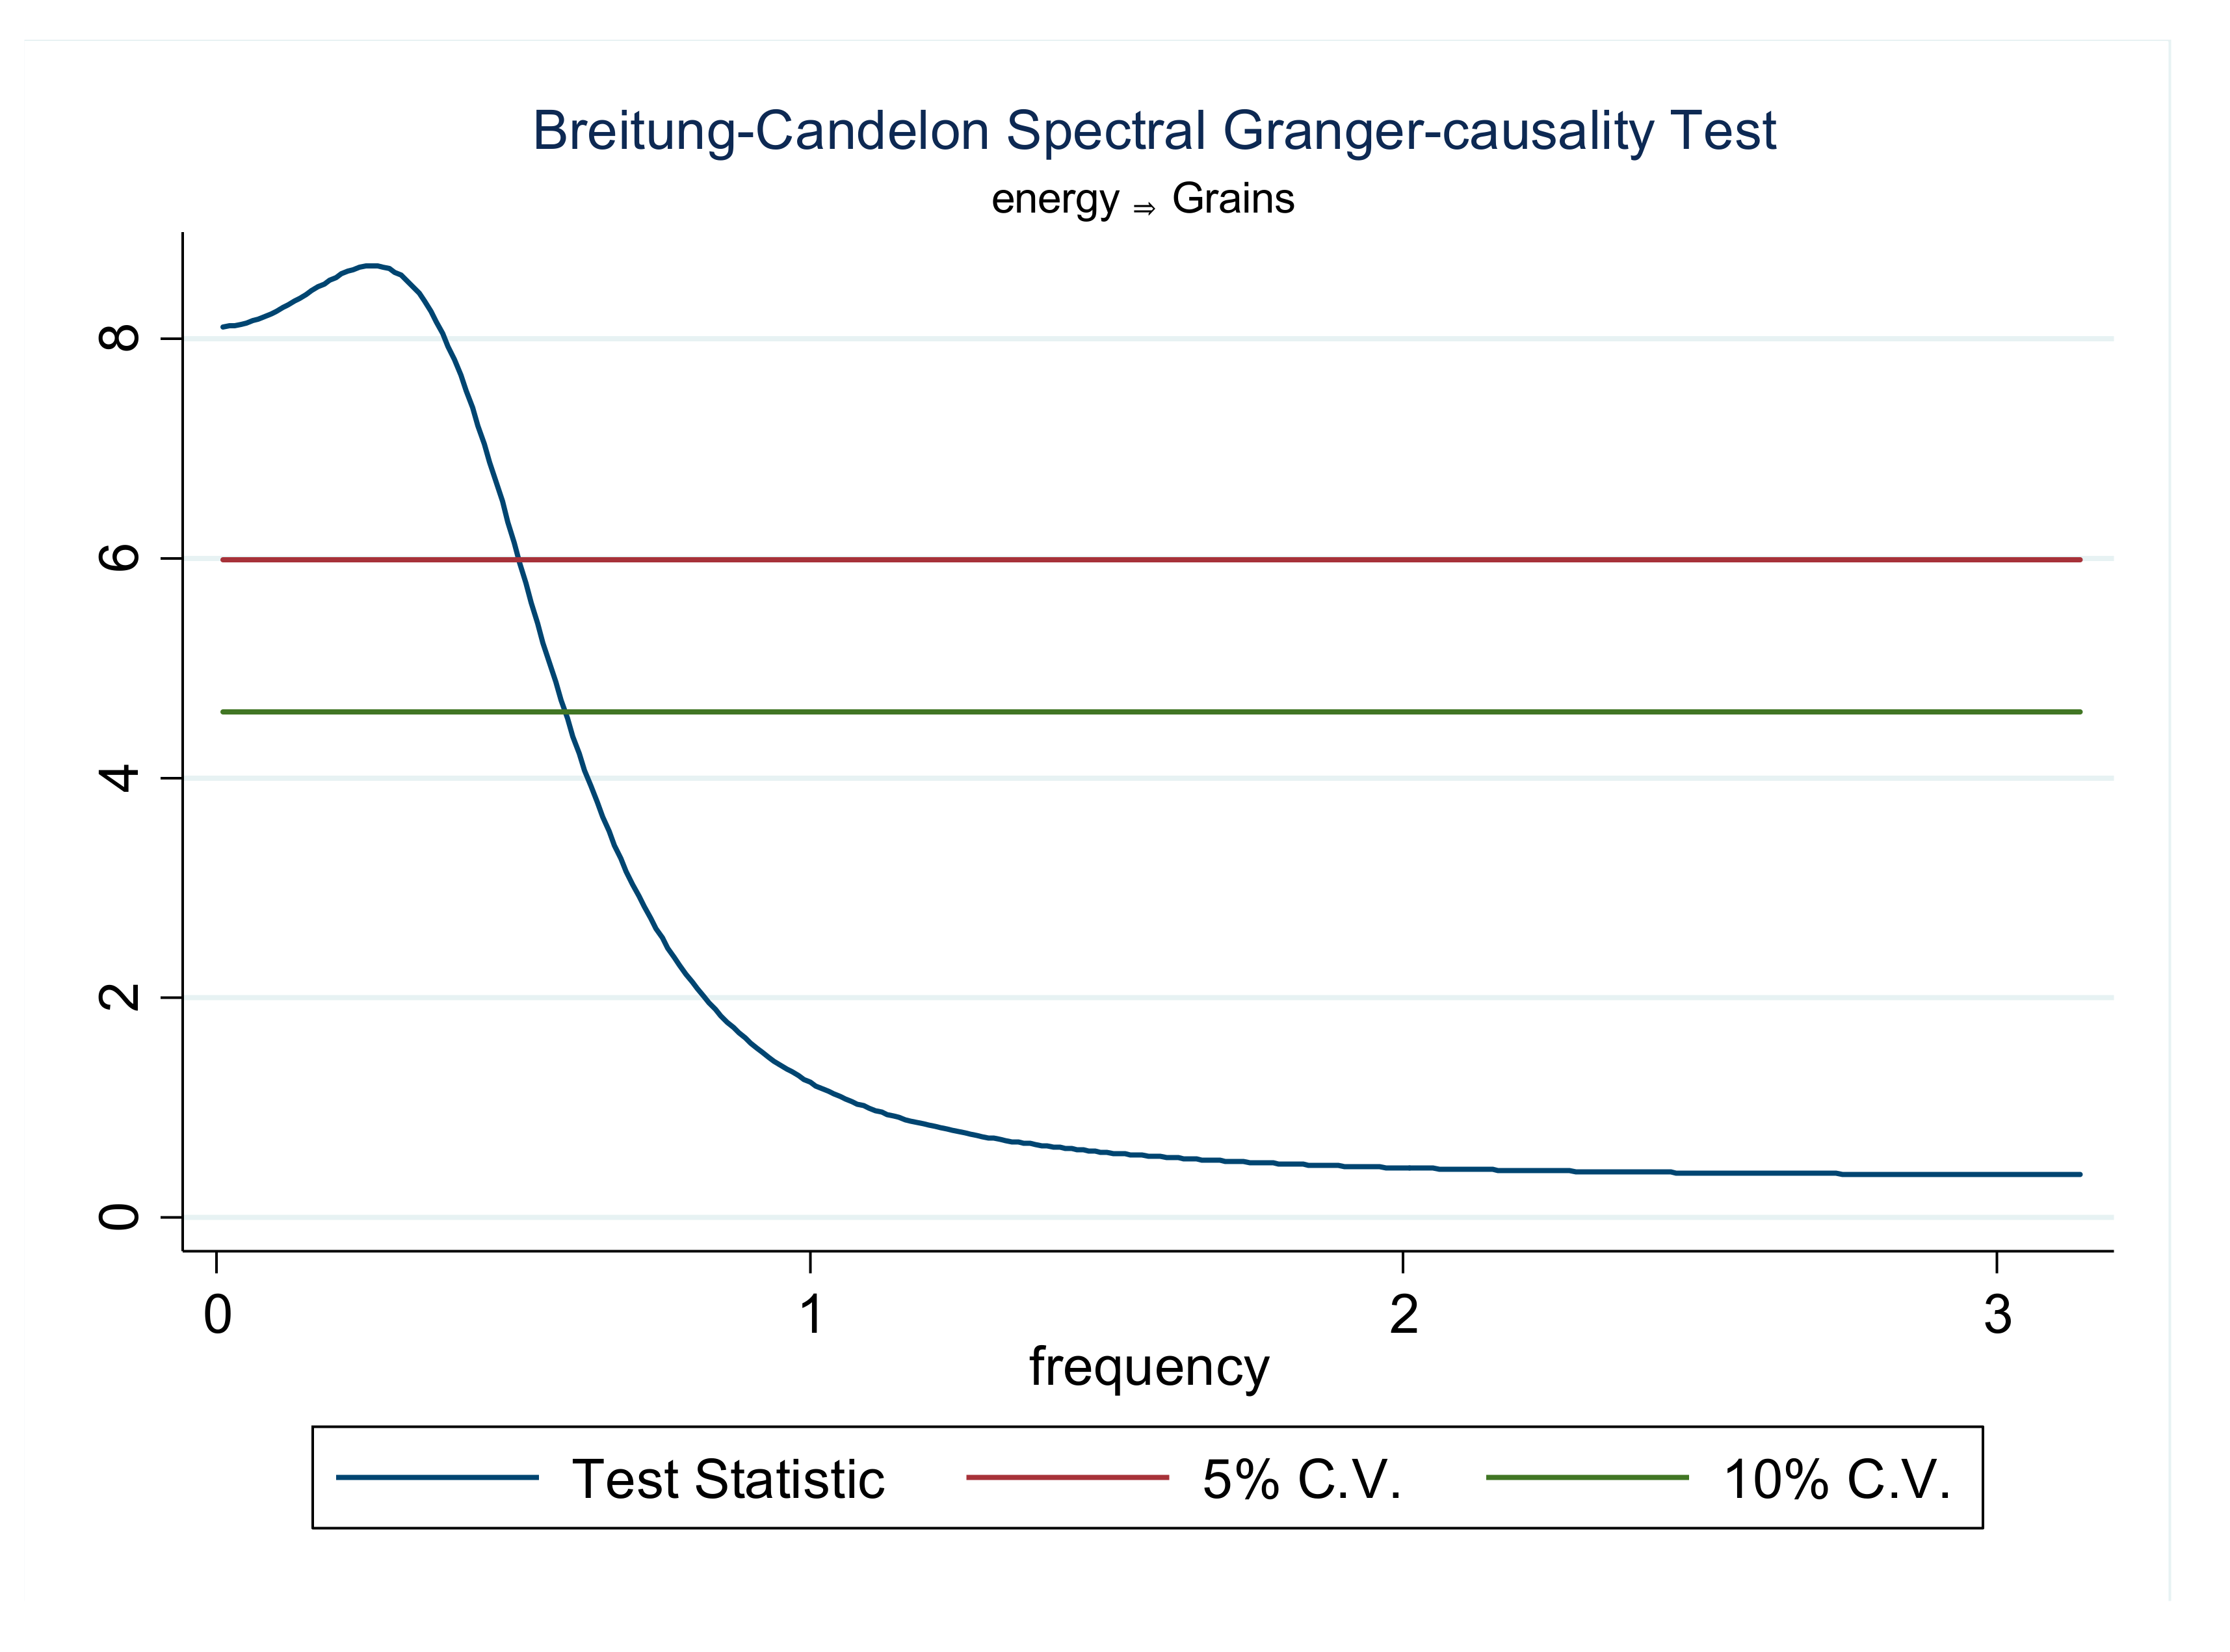
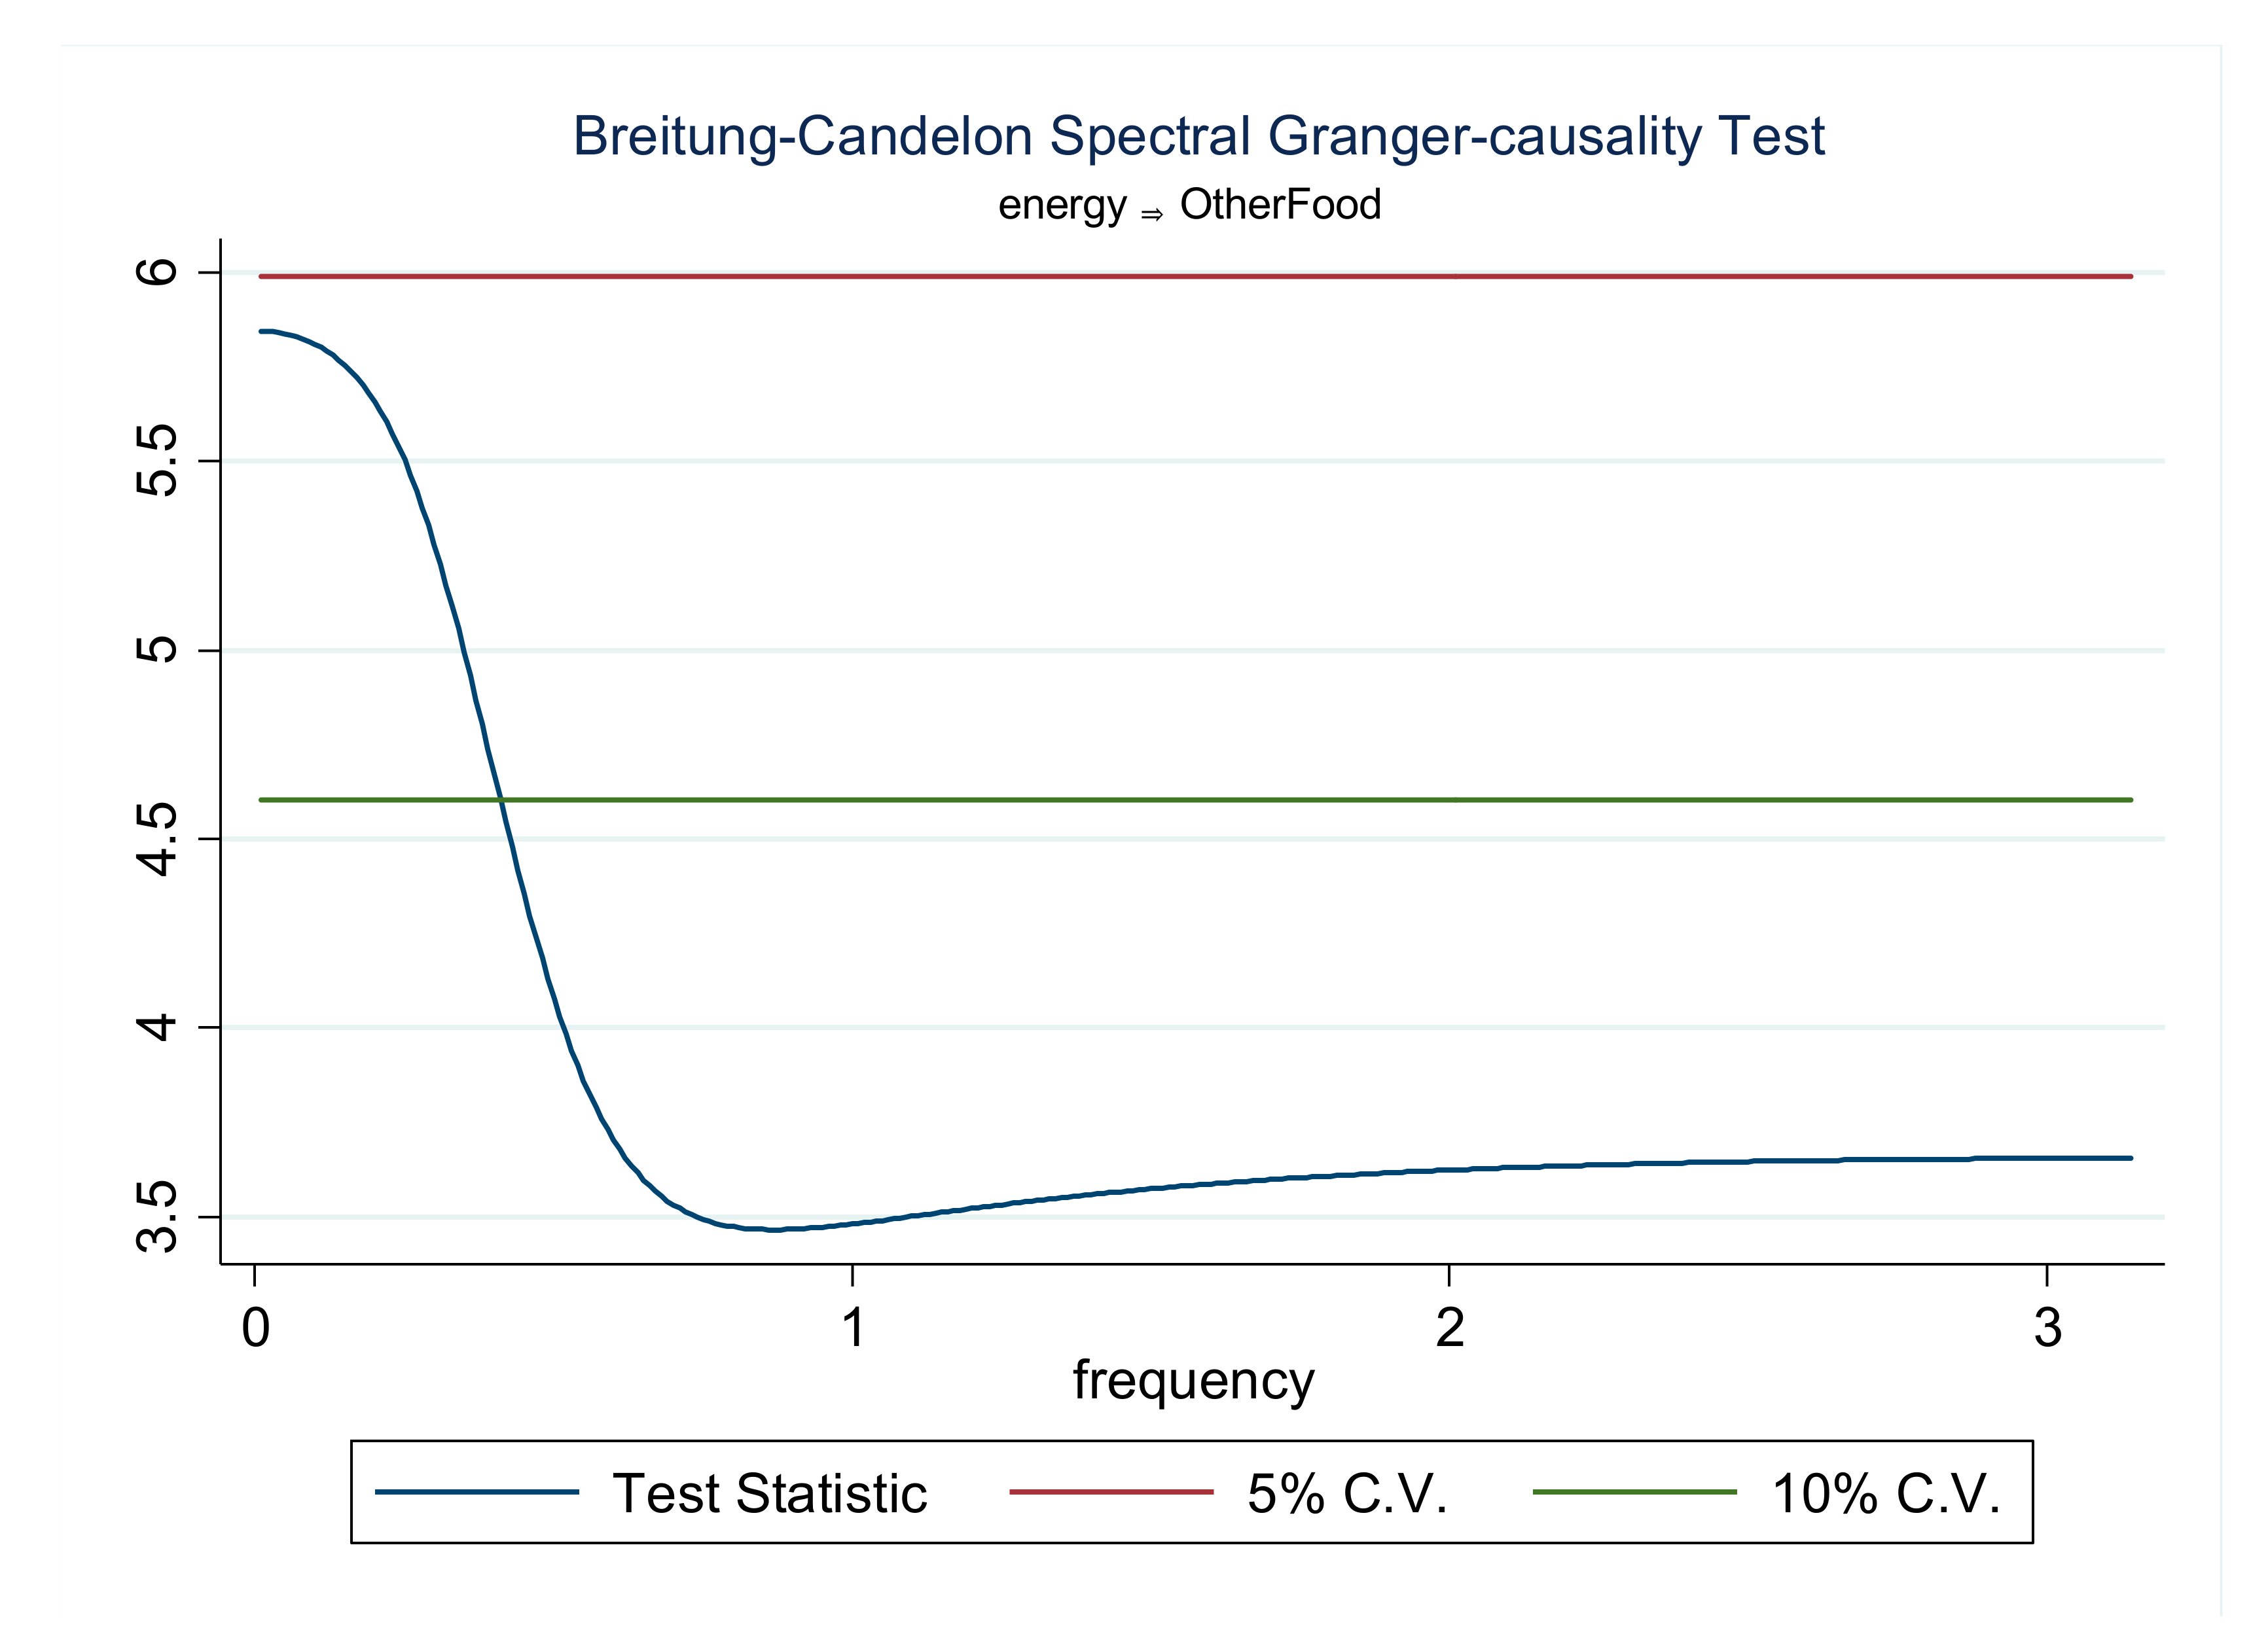
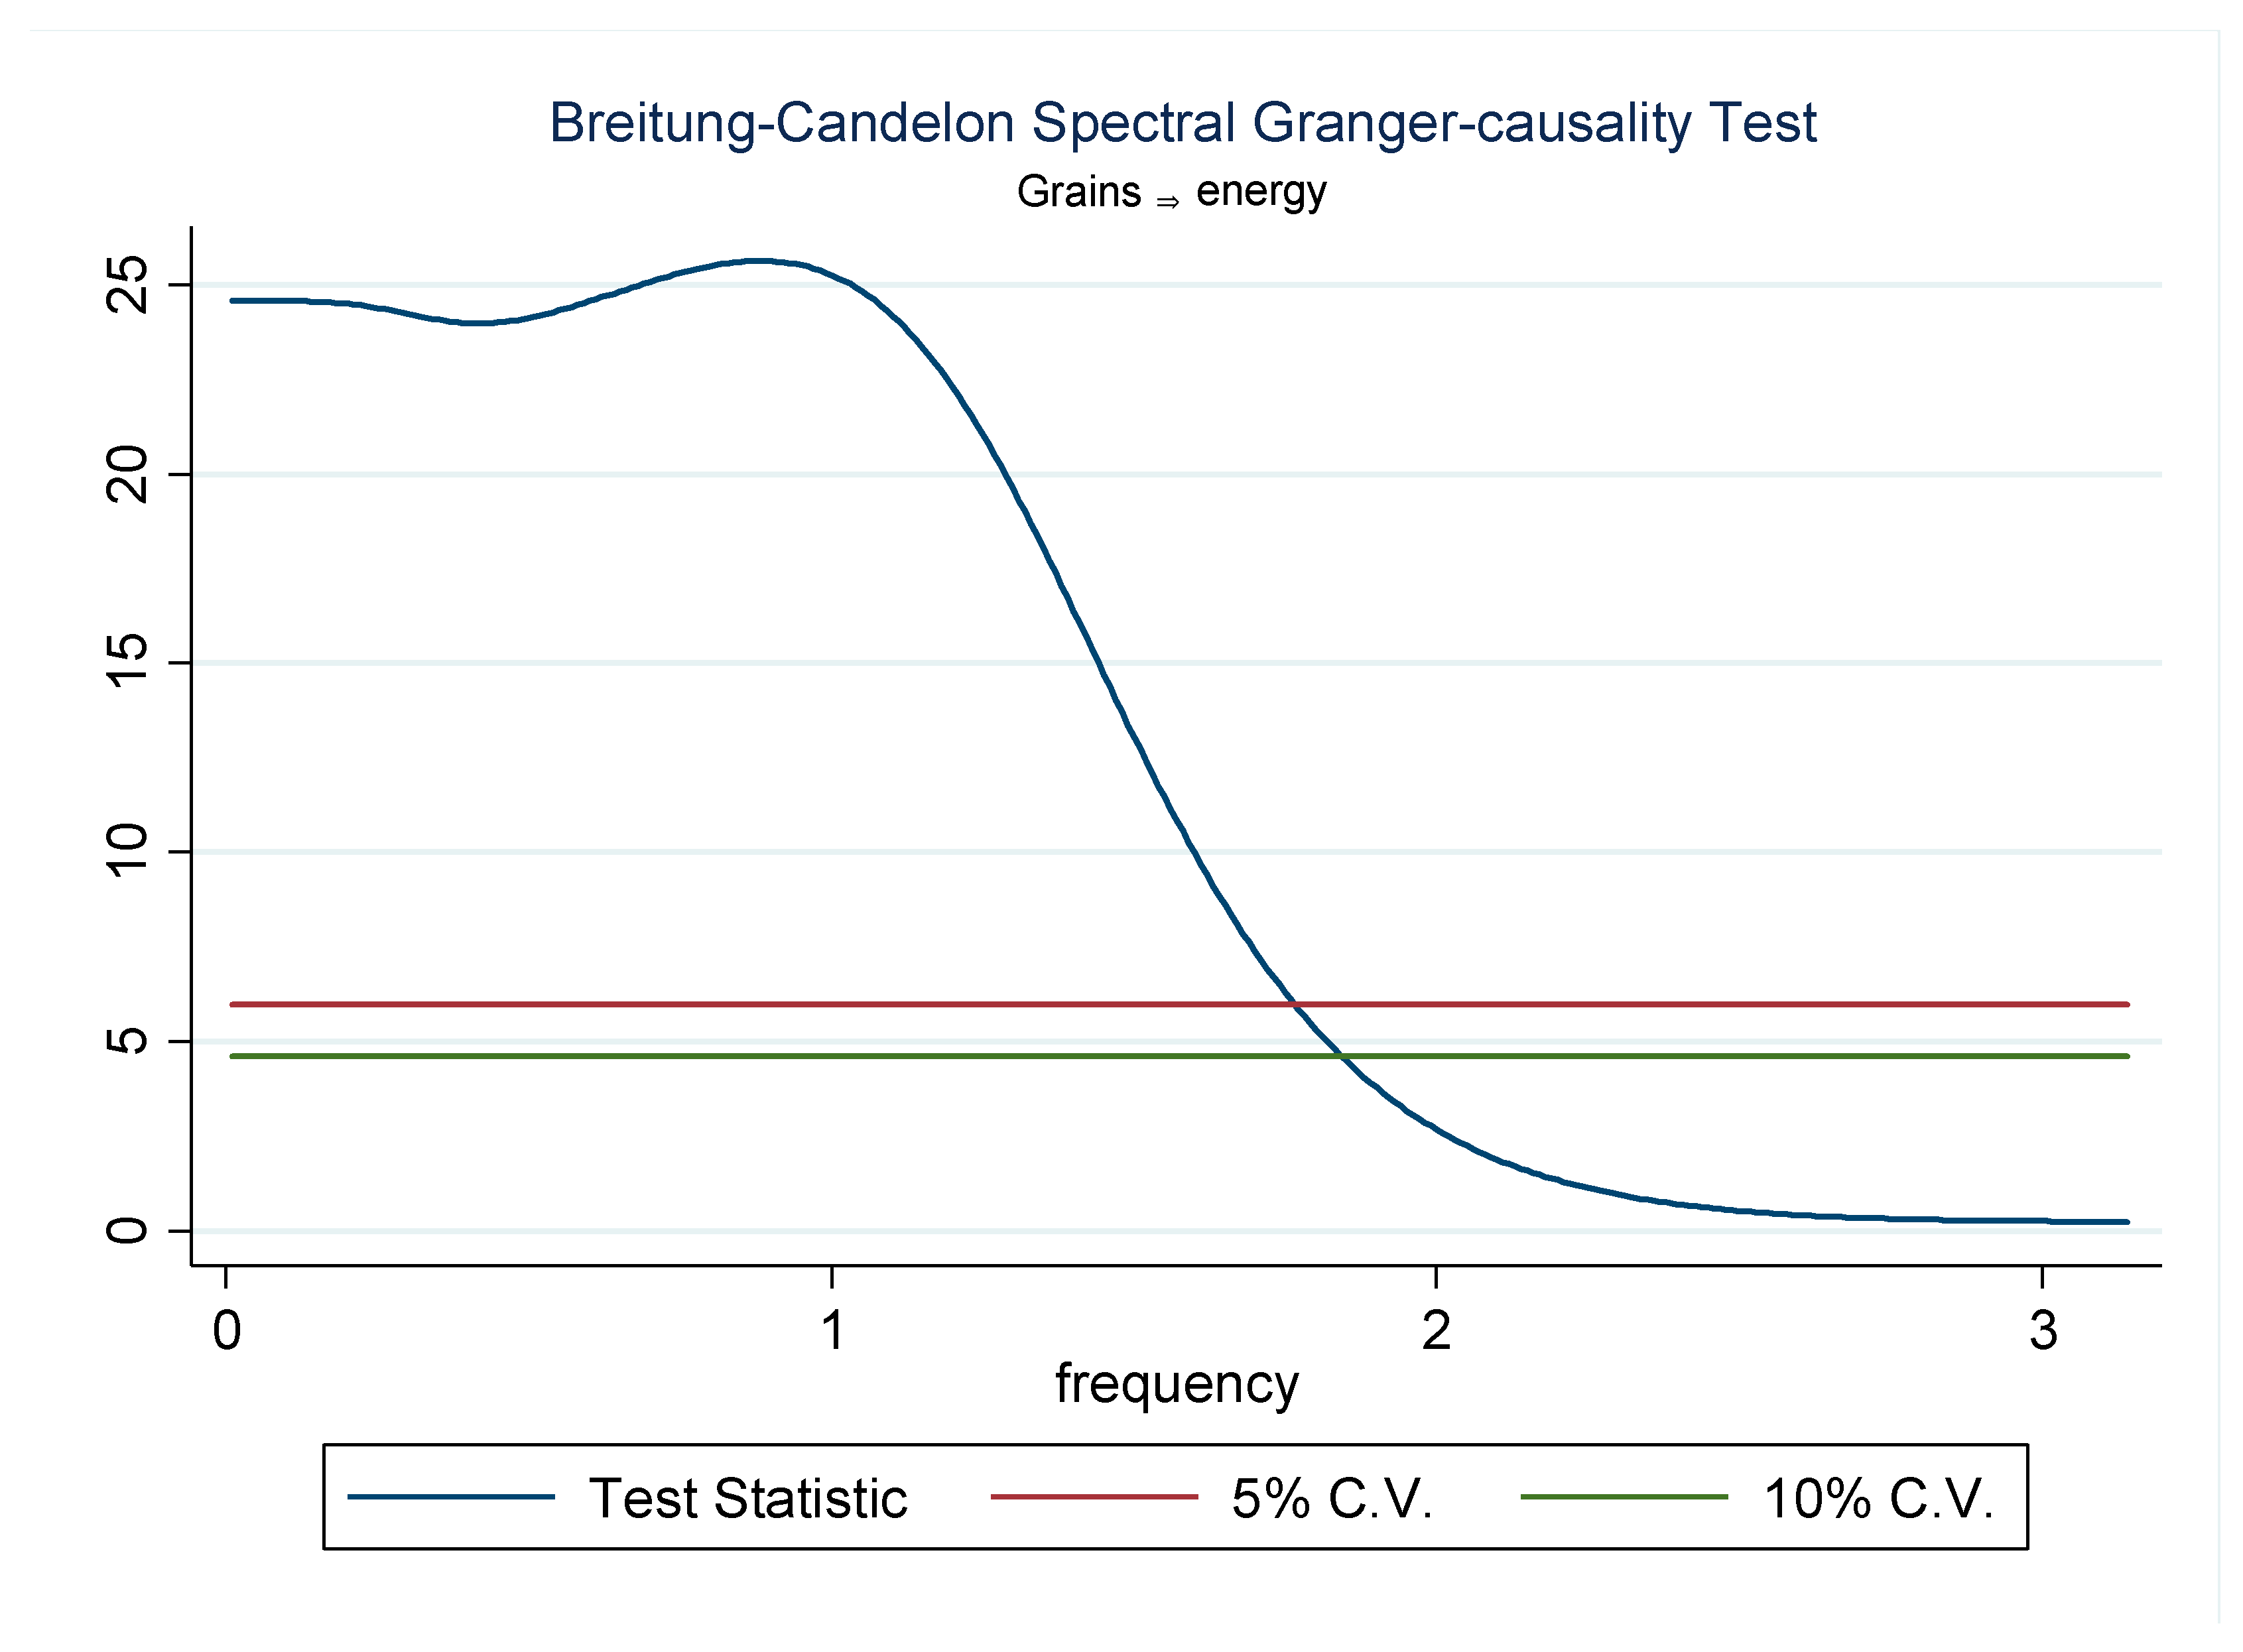
Following the time domain causality tests, the Breitung–Candelon frequency domain spectral causality test is performed to explore the causal relationship between the energy price index and food price indexes at different frequencies. The results of this test are illustrated in Figure 1, Figure 2, Figure 3, Figure 4, Figure 5 and Figure 6. Straight lines indicate a 5% level of significance, while dashed lines indicate a 10% significance at different frequencies between the intervals of (0, π). In Figure 1, it is shown that at the 5% significance level, the null hypothesis that the energy price index does not Granger-cause the oils price index can be rejected for frequencies in the intervals of 0–0.75 and 1.9–2.75. This result suggests that there is both a permanent (long-term) and temporary (short-term) causality. The null hypothesis that the energy price index does not Granger-cause the grains price index can also be rejected for frequencies in the intervals of 0 and 0.6, as the frequencies indicate permanent long-term causality at the 5% significance level (Figure 2). The results from Figure 3 suggest that the energy price index permanently Granger-causes the other food price index in the long-term at the 10% significance level.
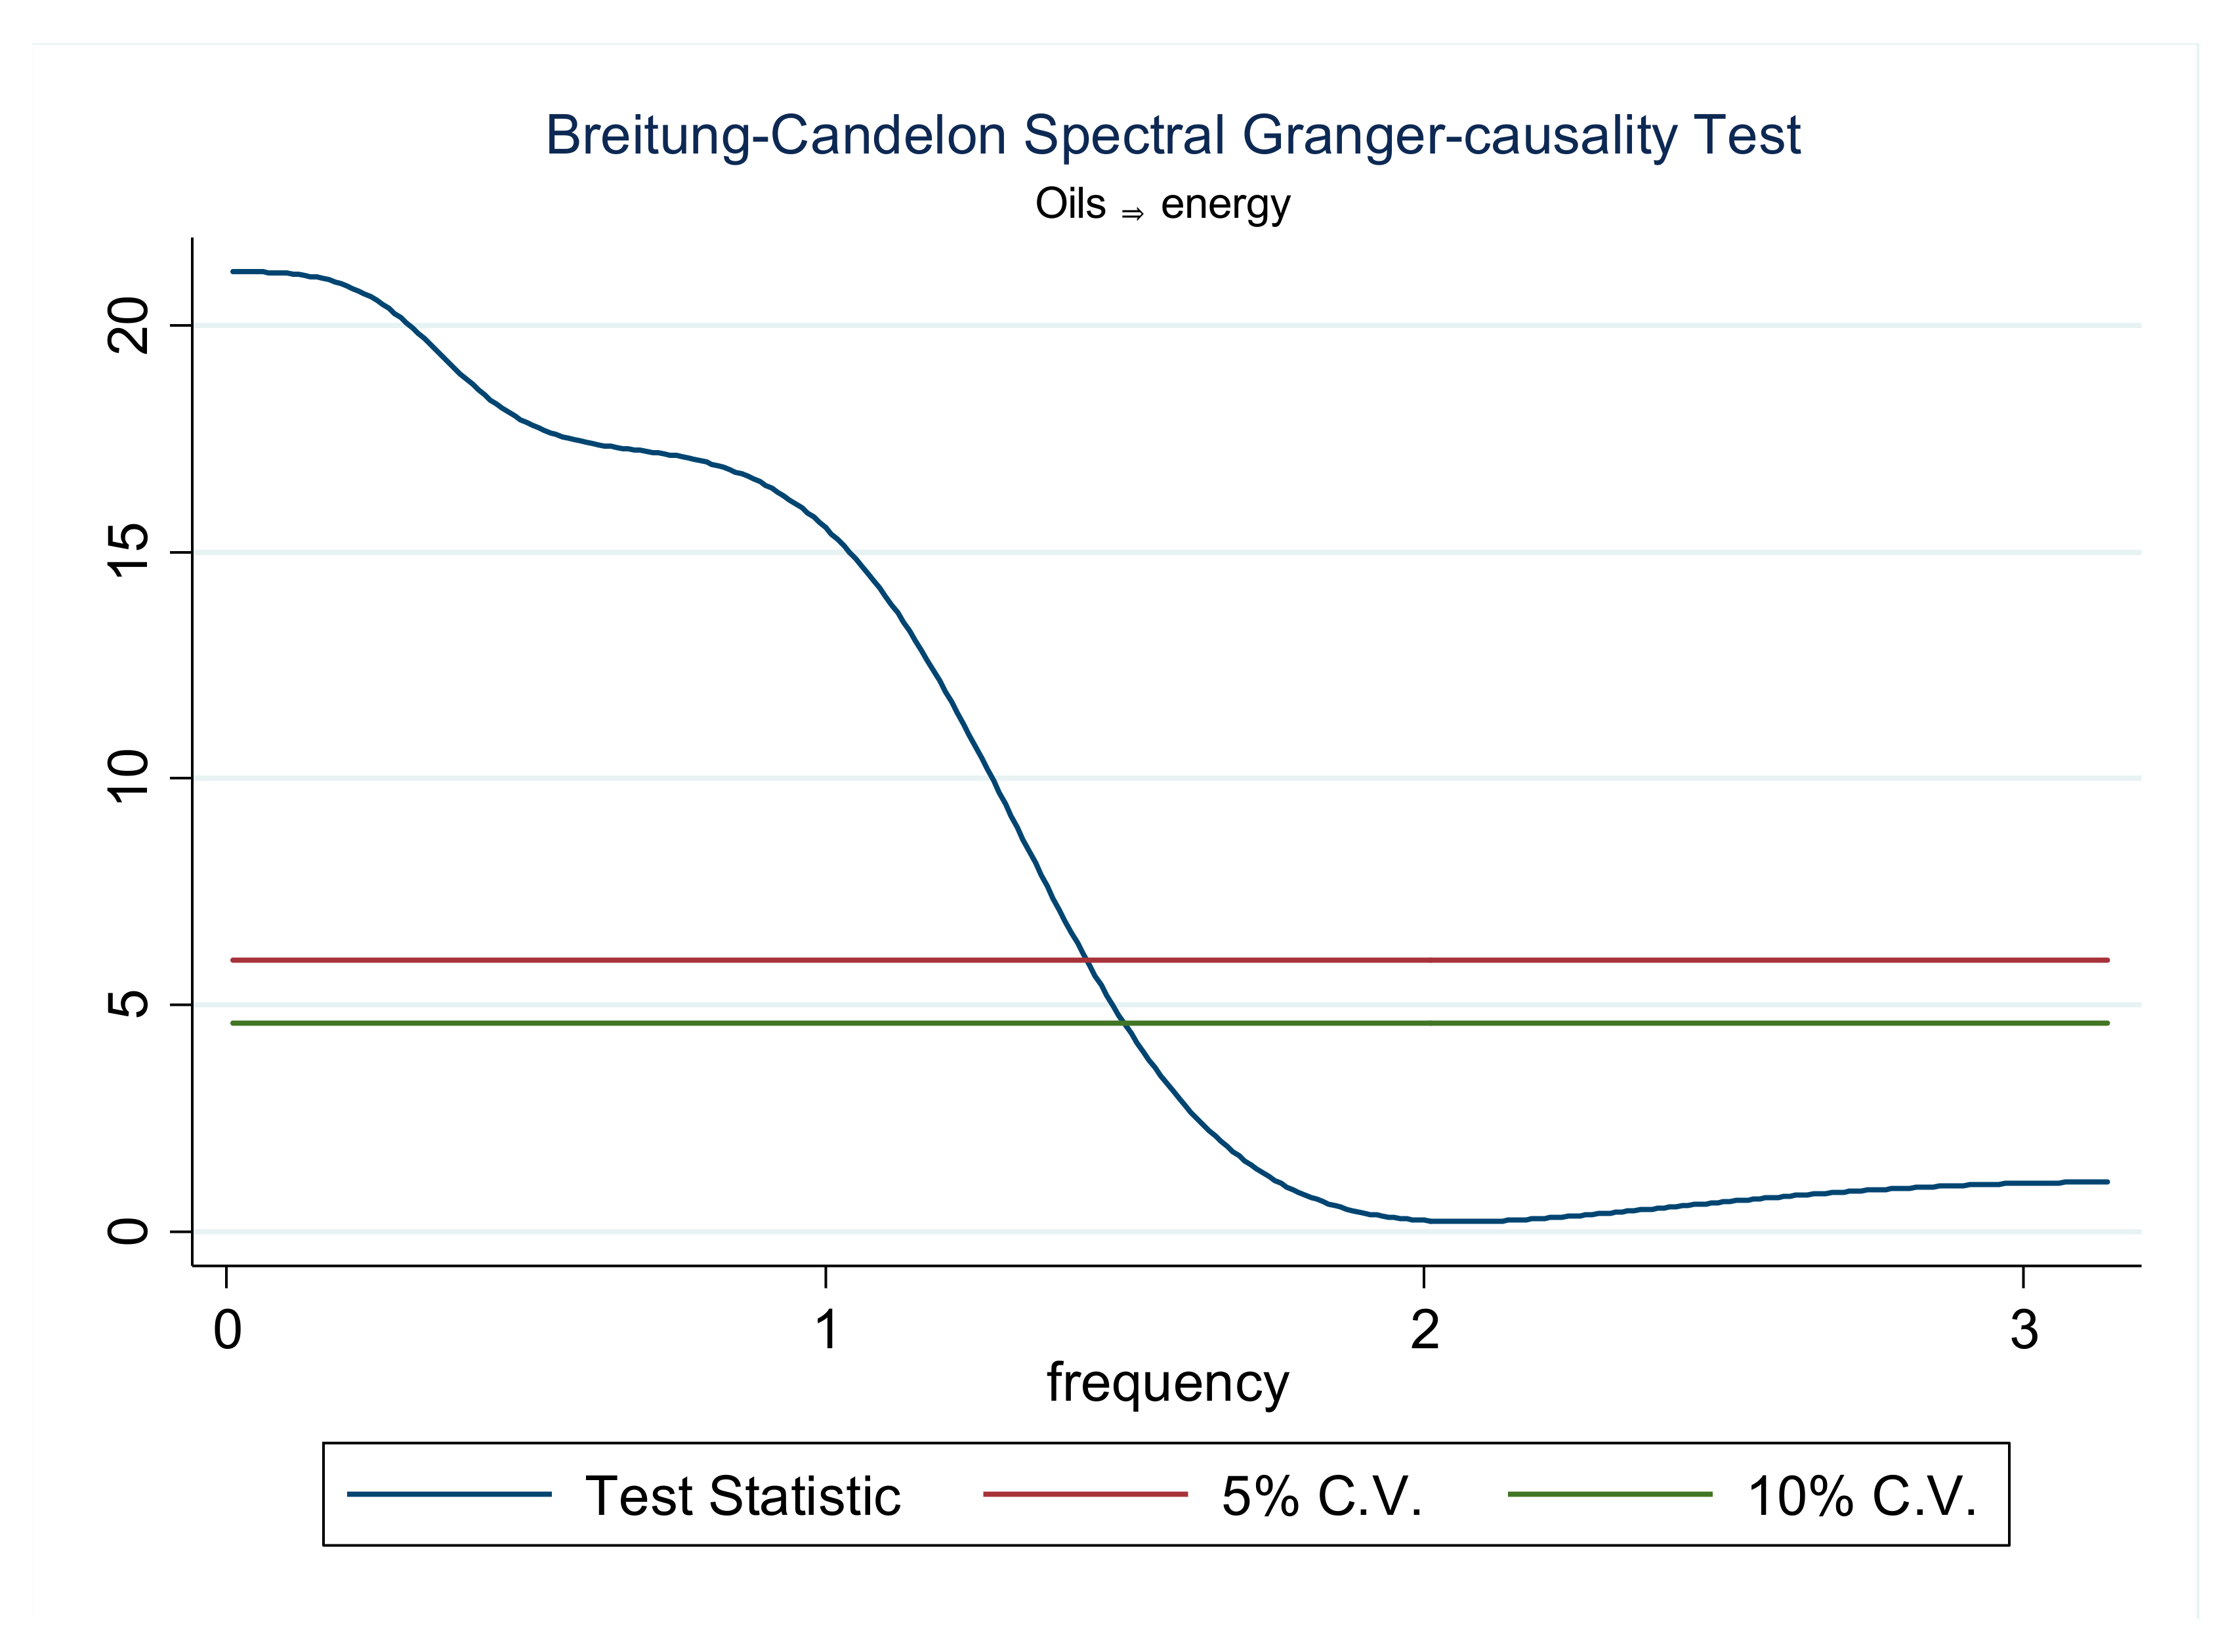
In the reverse direction, it is demonstrated that at the 5% significance level, the null hypothesis that the oils price index does not Granger-cause the energy price index can be rejected for frequencies in the intervals of 0 and 1.45 (Figure 4), thus suggesting that there is a permanent and long-term causality from the oils price index to the energy price index. The results are very similar for the grains price index and energy price index interaction. Frequencies in the intervals of 0–2.75 suggest that the grains price index Granger-causes the energy price index in the long term at the 5% significance level (Figure 5). The null hypothesis that the other food price index does not Granger-cause the energy price index can also be rejected for frequencies in the intervals of 0–0.35 and 0.65–1.25, which indicates a permanent long-term causality at the 5% significance level (Figure 2). Overall, the Breitung–Candelon frequency domain spectral causality test supports a unidirectional causal relationship between the energy price index and other food price index at the 5% significance level.
5. Discussion
Interactions between energy prices and food prices were investigated. The World Bank’s energy price index and food price index were accepted as variables. Unlike the literature, an energy price index combined with coal, crude oil, and natural gas was used for the paper. It was observed that literature on the subject is based on crude oil and bio-energy in terms of energy. The energy dependency of agricultural production is clear; however crude oil is not the only form of energy used by agriculture. Agricultural production also uses coal and natural gas. In this manner, it was evaluated that using an energy index is more meaningful than using just crude oil, contrary to the literature on the subject. The literature shows differences in what is accepted as food price. In some studies, food price is represented by an index as it is in this study, while in others, food price is represented by an individual food commodity.
Time and frequency domain causality tests were integrated to obtain robust results. The results are presented in the previous section. The results indicated long-term unidirectional causal relationships.
According to supply-side theory, higher crude oil prices increase production costs and cause the supply curve to shift to the left, resulting in higher food prices. Consistent with demand-side theory, higher energy prices increase the demand for energy crops, which causes an increase in the planted area. Thus, grain prices increase as a result of reduced production. Both sides of the theory need time to occur, which means that there is a long-term impact. Increasing energy prices cause a gradual increase in production costs over time. Agricultural production is comprised of many phases. These phases generally start with land preparation and continue as planting, irrigating, fertilising, spraying for pests, harvesting, transporting, and storing. This is an operation that lasts for months. Gradually increasing energy prices affect each production phase at different intensities and times. This means that the effect of increased energy prices on the prices of food products on supermarket shelves is very limited and there is a greater impact on the price of crops in the field. The impact of increased energy prices is only at full power for the crop of a new season. According to demand-side theory, higher energy prices increase the demand for bio-fuels and therefore raise prices. However, it takes time for farmers to switch from other crops as some farmers need to wait for the new season, some have a lack of knowledge, some want to wait and see, some have insufficient machinery, some are conservative about new crops, and so on. Therefore, the impact is observed in the long term.
The time and frequency domain causality tests provided similar results to the recent literature. Meyer et al. [17] analysed the asymmetric impacts of oil prices on food prices. Similar to this study, food prices were measured by the food price index. According to the study findings, there is a long-term, significant, and positive relationship between oil price increases and food prices. Furthermore, the study showed that there is no asymmetry in the behaviour of food prices in the short term [17]. Parallel to this study, Mawejje [34] examined the importance of energy prices over food prices by using the food price index. The study showed that energy prices and food prices have a long-term relationship [34]. However, it should be noted that the study is not conducted globally but regionally for Uganda. Nazlioglu and Soytas [35] studied the interactions between crude oil price, agricultural commodity prices and exchange rate. Similar to this study, global prices were used, however, the analysis was performed by panel approach. Researchers showed significant findings on the impact of world crude oil prices on food prices [35]. Pal and Mitra [16] is another study on the subject. Researchers investigated the association between crude oil prices and world food price indices between the period of 1990 and 2016. The researchers indicated a significant relationship between crude oil and food prices between mid-2001 and the 3rd quarter of 2012 [16]. Some comparable studies found similar results with this paper; however, there are other studies that show contrary results, such as the studies of Fowowe [18] and Roman et al. [25].
The study of Fowowe [18] on the effects of oil prices on agricultural commodity prices in South Africa showed that there is no long-term relationship between oil prices and agricultural commodity prices. As a consequence, researchers reached the conclusion that agricultural commodity prices are neutral to global oil prices in South Africa [18]. Unlike to this study, the research covers South Africa.
Roman et al. [25] investigated the linkages between crude oil prices and five selected food group prices similar to this study. The study used several powerful tools such as; the Augmented Dickey–Fuller test, Granger causality test, the vector autoregression (VAR) model, and the vector error correction (VEC) model. Moreover, researchers presented a detailed review on crude oil price. Researchers used dairy, meat, oils, cereals, and sugar foods groups. Contrary to this study, the results of the research indicated long-term linkage between meat and crude oil only. Researchers explained this linkage through the energy-dependent mechanization of animal husbandry.
6. Conclusions
The present study attempts to provide new findings to the empirical food price literature by investigating the causal interactions between the energy price index and food price indexes using relatively new methods. By using modern causality techniques, empirical estimations aimed to produce strong results. In this regard, the Toda–Yamamoto and Fourier Toda–Yamamoto causality tests revealed that there is a bidirectional causal relationship between energy and other food. Both of the tests also showed that there is a unidirectional causal linkage running from grains to energy. Conversely, the tests showed slightly different results in terms of the interactions between energy and oils. While both tests showed that there is bidirectional causality between energy and oils, the Toda–Yamamoto test found a weaker linkage in the direction from oils to energy.
To investigate the causal relationship between energy and food prices, spectral Granger causality was used in addition to more common causality approaches. The test was used due to its superior qualities. The tests showed that there is a bidirectional long-term and permanent causality between energy and food price components, which also supports the aforementioned theory. In this regard, the results differ from those of the time domain causality. According to the Toda–Yamamoto and Fourier Toda–Yamamoto causality test results, the null hypothesis that suggests there is no causal relationship from energy to grains is accepted. On the other hand, the frequency domain test result showed that there is a long-term and permanent causality between the variables at a 5% significance level.
The study also offers policy implications. In the second half of the twentieth century, the “green revolution” took place and shifted the food supply globally. Production increase reduced and stabilized food prices, thus, the number of hungry people decreased significantly. However, this increase in productivity has come to a halt in the current century. This has caused prices to be more volatile than ever before. Agricultural lands and irrigation water are scarce resources. Besides that, the world population is increasing and more agricultural lands are being used for energy crops. The world agricultural production system is in desperate need of another “green revolution” to overcome food security issues.
Food security concerns of countries have resulted in increased food subsidies and stricter price controls for restricted exports to protect their interest. However, these policies trigger market volatility. Countries that in food deficit and are also net crude oil importers are the most vulnerable. Food security and food price problems should be addressed globally. Agricultural investment and development should be supported by international policies.
Energy use and dependence in agricultural production has increased in the process of agricultural development. Now it is time to produce policies and acts to decrease the energy use and dependency of agricultural production without diminishing production. This means developing and disseminating more energy-efficient applications and processes. Alternatively or supportively, energy sources used by agriculture should be switched to alternative “free” energy sources.
This study aimed to explain the causal relationship between energy prices and food prices in a global context. The results offered an overview of the relationship between food prices and energy prices. However, these results do not offer an explanation for individual food commodities or individual regions of the world. This is the main limitation of this research. Yet, the research lays the groundwork for future research. Each country/region and each food commodity have different dynamics. Yes, modern agriculture is energy-dependent however, there are some countries that still use traditional, less mechanized approaches. There are some countries that produce their own crude oil, and the citizens use it cheaply and thus are protected from price fluctuations. Some countries are net food exporters and some are net food importers. Some countries apply food price subsidies. Some countries have energy price stability policies and mechanisms. These, and many other factors, can influence energy price and food price interactions. Future research should aim to examine the influence of regional energy prices on regional and individual food commodities. In this way, together with the results of this study, energy price and food price interactions can be better explained.
Author Contributions
Conceptualization, D.K. and I.D.; methodology, I.D.; software, D.K.; validation, D.K.; formal analysis, D.K.; investigation, I.D.; resources, I.D.; data curation, D.K.; writing—original draft preparation, I.D.; writing—review and editing, D.K.; visualization, D.K.; supervision, D.K.; project administration, D.K.; funding acquisition, I.D. All authors have read and agreed to the published version of the manuscript.
Funding
This research received no external funding.
Data Availability Statement
Monthly Commodity Price Data over the period of 1980M1 to 2019M01 from the World Bank were used as the source for the empirical tests of this study.
Conflicts of Interest
The authors declare no conflict of interest.
References
- Tiffin, R. Food security. In The Companion to Development Studies, 3rd ed.; Desai, V., Potter, B., Eds.; Routledge: London, UK, 2014; pp. 1–9. [Google Scholar] [CrossRef]
- United Nations. World Population Prospects 2019: Highlights. United Nations: New York, NY, USA, 2019. [Google Scholar] [CrossRef]
- Godfray, H.C.J.; Beddington, J.R.; Crute, I.R.; Haddad, L.; Lawrence, D.; Muir, J.F.; Pretty, J.; Robinson, S.; Thomas, S.M.; Toulmin, C. Food Security: The Challenge of Feeding 9 Billion People. Science 2010, 327, 812–818. [Google Scholar] [CrossRef] [Green Version]
- Headey, D.; Fan, S. Anatomy of a crisis: The causes and consequences of surging food prices. Agric. Econ. 2008, 39, 375–391. [Google Scholar] [CrossRef] [Green Version]
- Çakmaklı, C.; Demiralp, S.; Kalemli-Özcan, S.; Yesiltas, S.; Yildirim, M. COVID-19 and Emerging Markets: A SIR Model, Demand Shocks and Capital Flows. Natl. Bur. Econ. Res. 2020, 27191. [Google Scholar] [CrossRef]
- Gilbert, C.L. How to Understand High Food Prices. J. Agric. Econ. 2010, 61, 398–425. [Google Scholar] [CrossRef]
- Abbott, P.; Hurt, C.; Tyler, W. What’s Driving Food Prices, 1st ed.; Farm Foundation: Chicago, IL, USA, 2008. [Google Scholar] [CrossRef]
- Baltzer, K.; Hansen, H.; Lind, K. A note on the causes and consequences of the rapidly increasing international food prices. Res. Rep. Inst. Food Resour. Econ. Univ. Copenhagen 2008, 56–78. Available online: https://curis.ku.dk/portal/files/128471817/29_maj_A_note_on_the_causes_and_consequences_of_the_rapidly_increasing_international_food_prices.pdf (accessed on 11 December 2020).
- Trostle, R. Global Agricultural Supply and Demand: Factors Contributing to the Recent Increase in Food Commodity Prices; Diane Publishing: Darby, PA, USA, 2010; WRS-0801. [Google Scholar]
- Schnepf, R. High Agricultural Commodity Prices: What Are the Issues? CRS Rep. Congr. 2008, 16–24. Available online: https://www.grainnet.com/pdf/CRS_CommodityPrices.pdf (accessed on 28 December 2020).
- Baffes, J. Oil spills on other commodities. Resour. Policy 2007, 32, 126–134. [Google Scholar] [CrossRef] [Green Version]
- Alghalith, M. The interaction between food prices and oil prices. Energy Econ. 2010, 32, 1520–1522. [Google Scholar] [CrossRef]
- Chen, S.-T.; Kuo, H.-I.; Chen, C.-C. Modeling the relationship between the oil price and global food prices. Appl. Energy 2010, 87, 2517–2525. [Google Scholar] [CrossRef]
- Esmaeili, A.; Shokoohi, Z. Assessing the effect of oil price on world food prices: Application of principal component analysis. Energy Policy 2011, 39, 1022–1025. [Google Scholar] [CrossRef]
- Pal, D.; Mitra, S.K. Interdependence between crude oil and world food prices: A detrended cross correlation analysis. Phys. A Stat. Mech. Its Appl. 2018, 492, 1032–1044. [Google Scholar] [CrossRef]
- Pal, D.; Mitra, S.K. Time-frequency contained co-movement of crude oil and world food prices: A wavelet-based analysis. Energy Econ. 2017, 62, 230–239. [Google Scholar] [CrossRef]
- Meyer, D.F.; Sanusi, K.A.; Hassan, A. Analysis of the asymmetric impacts of oil prices on food prices in oil-exporting developing countries. J. Int. Stud. 2018, 11, 82–94. [Google Scholar] [CrossRef]
- Fowowe, B. Do oil prices drive agricultural commodity prices? Evidence from South Africa. Energy 2016, 104, 149–157. [Google Scholar] [CrossRef]
- Barnard, J.R. Gasohol/Ethanol: A Review of National and Regional Policy and Feasibility Issues. J. Reg. Anal. Policy 1983, 13, 3–14. [Google Scholar] [CrossRef]
- Mitchell, D. A Note on Rising Food Prices, World Bank. 2008. Available online: http://www-wds.worldbank.org/external/default/WDSContentServer/IW3P/IB/2008/07/28/000020439_20080728103002/Rendered/PDF/WP4682.pdf (accessed on 20 January 2021).
- Zhang, Z.; Lohr, L.; Escalante, C.; Wetzstein, M. Food versus fuel: What do prices tell us? Energy Policy 2010, 38, 445–451. [Google Scholar] [CrossRef]
- Filip, O.; Janda, K.; Kristoufek, L.; Zilberman, D. Food versus fuel: An updated and expanded evidence. Energy Econ. 2019, 82, 152–166. [Google Scholar] [CrossRef] [Green Version]
- Vo, D.H.; Vu, T.; Vo, A.T.; McAleer, M. Modeling the Relationship between Crude Oil and Agricultural Commodity Prices. Energies 2019, 12, 1344. [Google Scholar] [CrossRef] [Green Version]
- Al-Maadid, A.; Caporale, G.M.; Spagnolo, F.; Spagnolo, N. Spillovers between food and energy prices and structural breaks. Int. Econ. 2017, 150, 1–18. [Google Scholar] [CrossRef]
- Roman, M.; Górecka, A.; Domagała, J. The Linkages between Crude Oil and Food Prices. Energies 2020, 13, 6545. [Google Scholar] [CrossRef]
- Nazlioglu, S. World oil and agricultural commodity prices: Evidence from nonlinear causality. Energy Policy 2011, 39, 2935–2943. [Google Scholar] [CrossRef]
- Karakotsios, A.; Katrakilidis, C.; Kroupis, N. The dynamic linkages between food prices and oil prices. Does asymmetry matter? J. Econ. Asymmetries 2021, 23, e00203. [Google Scholar] [CrossRef]
- Zivot, E.; Andrews, D.W.K. Further Evidence on the Great Crash, the Oil-Price Shock, and the Unit-Root Hypothesis. J. Bus. Econ. Stat. 1992, 10, 251. [Google Scholar] [CrossRef] [Green Version]
- Toda, H.Y.; Yamamoto, T. Statistical inference in vector autoregressions with possibly integrated processes. J. Econ. 1995, 66, 225–250. [Google Scholar] [CrossRef]
- Nazlioglu, S.; Gormus, N.A.; Soytas, U. Oil prices and real estate investment trusts (REITs): Gradual-shift causality and volatility transmission analysis. Energy Econ. 2016, 60, 168–175. [Google Scholar] [CrossRef]
- Breitung, J.; Candelon, B. Testing for short- and long-run causality: A frequency-domain approach. J. Econ. 2006, 132, 363–378. [Google Scholar] [CrossRef]
- Geweke, J. Measurement of Linear Dependence and Feedback between Multiple Time Series. J. Am. Stat. Assoc. 1982, 77, 304–313. [Google Scholar] [CrossRef]
- Hosoya, Y. The decomposition and measurement of the interdependency between second-order stationary processes. Probab. Theory Relat. Fields 1991, 88, 429–444. [Google Scholar] [CrossRef]
- Mawejje, J. Food prices, energy and climate shocks in Uganda. Agric. Food Econ. 2016, 4, 2070. [Google Scholar] [CrossRef] [Green Version]
- Nazlioglu, S.; Soytas, U. Oil price, agricultural commodity prices, and the dollar: A panel cointegration and causality analysis. Energy Econ. 2012, 34, 1098–1104. [Google Scholar] [CrossRef]
Figure 1.
Spectral BC causality from energy to oils.

Figure 2.
Spectral BC causality from energy to grains.

Figure 3.
Spectral BC causality from energy to other foods.

Figure 4.
Spectral BC causality from oils to energy.

Figure 5.
Spectral BC causality from grains to energy.

Figure 6.
Spectral BC causality from other food to energy.


Table 1.
Descriptive Statistics.
| Energy | Oils | Other Food | Grains | |
|---|---|---|---|---|
| Mean | 54.80615 | 67.67073 | 71.07951 | 73.76045 |
| Median | 40.68582 | 58.48079 | 62.67809 | 63.81761 |
| Maximum | 173.4324 | 140.9597 | 115.0557 | 156.6351 |
| Minimum | 15.93188 | 35.06014 | 39.65527 | 37.78754 |
| Std. Dev. | 35.78253 | 25.0985 | 20.70141 | 26.60199 |
| Skewness | 1.100317 | 1.045649 | 0.603865 | 1.324149 |
| Kurtosis | 3.129759 | 3.131528 | 2.013908 | 4.135037 |
| Jarque–Bera | 94.96525 | 85.80414 | 47.50556 | 162.2308 |
| Probability | 0.000 | 0.000 | 0.000 | 0.000 |
| Sum | 25,704.09 | 31,737.57 | 33,336.29 | 34,593.65 |
| Sum Sq. Dev. | 599,222.4 | 294,809.4 | 200,560.6 | 331,187.7 |
Table 2.
Zivot–Andrews unit root test.
| Series in Levels | ||||
|---|---|---|---|---|
| Energy | Oils | Grains | Other Food | |
| C | −4.380 (2003M10) ** | −4.941 ** (2006M10) ** | −4.371 (2006M09) ** | −4.363 (2008M01) ** |
| C&T | −4.493 (2005M01) ** | −5.247 ** (2007M04) | −4.958 (2007M05) ** | −4.326 (2008M01) ** |
| Series in First Differences | ||||
| C | −10.230 ** (2008M07) ** | −14.704 ** (2008M07) ** | −9.534 ** (2012M08) | −10.953 ** (2003m10) * |
| C&T | −10.249 ** (2008M07) ** | −14.688 ** (2008M07) * | −9.683 ** (2012M08) | −11.361 ** (2003m10) |
Note: C and C&T denote constant and constant and trend in the ZA unit root test, respectively. ** and * denote statistical significance at 0.05 and 0.10 levels, respectively. The numbers in parenthesis ( ) represent break points.
Table 3.
Causality tests.
| Energy → Oils | Energy → Grains | Energy → Other Food | |
|---|---|---|---|
| TY Causality | <16.078> ** (0.024) | <0.289> (0.865) | <5.905> ** (0.015) |
| Gradual Shift Causality | [8.791] ** (0.032) | [0.646] (0.885) | [6.057] ** (0.049) |
| Oils → Energy | Grains → Energy | Other Food → Energy | |
| TY Causality | <30.268> * (0.000) | <26.571> ** (0.000) | <7.927> ** (0.004) |
| Gradual Shift Causality | [20.848] ** (0.000) | [27.093] ** (0.000) | [8.340] ** (0.015) |
Note: the values within the [ ], ( ), and < > symbols indicate test stat, p-value, and MWALT, respectively. The optimal lag for our causality models is selected using the AIC technique. → denotes the direction of causality. ** and * denote statistical significance at 0.05 and 0.10 levels, respectively. C and C&T denote constant and constant and trend respectively.
Publisher’s Note: MDPI stays neutral with regard to jurisdictional claims in published maps and institutional affiliations. |
© 2021 by the authors. Licensee MDPI, Basel, Switzerland. This article is an open access article distributed under the terms and conditions of the Creative Commons Attribution (CC BY) license (https://creativecommons.org/licenses/by/4.0/).
Share and Cite
MDPI and ACS Style
Kirikkaleli, D.; Darbaz, I. The Causal Linkage between Energy Price and Food Price. Energies 2021, 14, 4182. https://doi.org/10.3390/en14144182
AMA Style
Kirikkaleli D, Darbaz I. The Causal Linkage between Energy Price and Food Price. Energies. 2021; 14(14):4182. https://doi.org/10.3390/en14144182
Chicago/Turabian StyleKirikkaleli, Dervis, and Ibrahim Darbaz. 2021. "The Causal Linkage between Energy Price and Food Price" Energies 14, no. 14: 4182. https://doi.org/10.3390/en14144182
Note that from the first issue of 2016, this journal uses article numbers instead of page numbers. See further details here.