Article

Assessing the Cost of Biomass and Bioenergy Production in Agroindustrial Processes

by
Elias Martinez-Hernandez
*,
Myriam A. Amezcua-Allieri
* and
Jorge Aburto
*
Biomass Conversion Division, Mexican Institute of Petroleum, Mexico City 07730, Mexico
*
Authors to whom correspondence should be addressed.
Energies 2021, 14(14), 4181; https://doi.org/10.3390/en14144181
Submission received: 19 April 2021 / Revised: 17 June 2021 / Accepted: 21 June 2021 / Published: 11 July 2021
(This article belongs to the Special Issue Advances in Biomass for Energy Technologies)

Abstract

:
This paper presents bioenergy value chain modelling to estimate the biomass and bioenergy cost of production and biomass netback in combined heat and power (CHP) systems. Modelling compares biomass cost and netback to analyse the feasibility of CHP systems, as well as the internal rate of return (IRR) and payback period (PBP). Models are implemented into the IMP Bio2Energy® software (Instituto Mexicano del Petróleo, Mexico City, Mexico) for practical application and demonstrated for bioenergy generation in the agroindustrial processes of tequila production, coffee and orange processing using as biomass the agave bagasse, coffee pulp and orange peels coproducts, respectively. Results show that the CHP systems are economically feasible, i.e., biomass cost of production is lower than netback, PBP between 3 and 4 years and IRR > 20%. The cost of bioenergy is lower than the cost of fuel oil and grid electricity being replaced. The sensitivity analysis for boiler steam pressure showed that there is an optimal pressure for coffee pulp (40 bar), a threshold pressure for orange (60 bar) and agave bagasse (70 bar). Sensitivity to biomass input indicated a maximum capacity where economy of scale does not produce any improvement in the indicators. Results demonstrate the usefulness of the modelling approach and IMP Bio2Energy® in analysing biomass CHP systems.

Graphical Abstract

1. Introduction

Biomass has become an important resource for energy generation worldwide as a sustainable alternative to fossil fuels. The most widely spread modern use of biomass is in combined heat and power (CHP) generation systems either by direct combustion or through biomass gasification [1]. The techno-economics of biomass CHP has been studied for various biomass sources, with wood and agricultural biomass being the most widely studied [2,3], with a few focusing on residues from the agroindustry [4,5,6,7]. Assessing the cost of biomass and bioenergy generation to establish competitiveness with current fossil fuel systems is a crucial step for the establishment of successful bioenergy projects [3,8]. Biomass feedstock is usually a major cost component in biomass conversion to energy and biofuels. Furthermore, biomass cost is a source of uncertainty for bioenergy projects, and the nature of biomass and the design parameters of the bioenergy system should also be considered [8,9]. For example, biomass moisture, ash content, elemental compositions, as well as system operating pressure affect both efficiency and economic viability. Therefore, models that allow costing biomass generation and the impact of biomass nature on the cost of bioenergy are required. Such models also determine cost savings, due to fossil energy replacements and operating and capital costs of bioenergy so that biomass netback, i.e., the price that results in economic break-even, can be calculated. The netback indicates the net value of a feedstock from its products selling, and it is also a cost threshold that indicates the value at which bioenergy generation from given biomass is no longer economically feasible [10].
Modelling biomass and bioenergy cost is generally complex in the case of dedicated crops, or biomass from forest or agricultural fields, due to their variety, widespread and temporal availability. Several efforts have been performed, especially in the case of dedicated crops, forest and agricultural residues going from value chain costing approaches to regional and global economic equilibrium models [11,12,13,14]. Case studies for the economic assessment of lignocellulosic biomass pellets have been recently reported [15]. Biomass CHP systems have also evolved to include carbon capture and storage (CCS). For example, the techno-economic assessment of bioenergy with CCS in a sugarcane mill has been studied [16]. The cost-effectiveness of such CHP systems in carbon credit markets has also been shown [17]. Biomass CHP systems are also recently reviewed as a key for flexible power generation from biomass and cost-effective electricity supply [18]. Other works compare different bioenergy technologies, including gasification and anaerobic digestion, and direct combustion of pelletised biomass for large scale CHP systems [19]. A wider review of biomass CHP systems is available in the literature [20].
The economic potential of alternative biomass sources for solid biofuels, such as digestate and sawdust [21], and beetle-killed trees [22], have also been evaluated. Another alternative source of biomass currently underutilised is the agroindustrial processing of major crops, which generates large amounts of residual biomass that is already collected, avoiding several logistics complexities. CHP systems are especially attractive in co-location with processes demanding both electricity and heat in the form of steam, as shown for sugar cane [23], sago [24,25], wheat [26], sunflower [27] and Jatropha processing [28]. Therefore, it would be advantageous to use such biomass in bioenergy systems for self-supply of energy in their parent agroindustrial processes [29]. The techno-economic modelling for biomass and bioenergy value chain in agroindustrial processes has not been addressed in the literature. Furthermore, the combined modelling from both biomass generation and biomass utilisation perspectives has not been reported, as studies generally, focus on one side of the bioenergy value chain, i.e., only the biomass generation and logistics side [30] or the bioenergy generation side [31,32].
The agroindustry is one of the most important economic activities in Mexico, which generates about 28 million tonnes of solid residues [33]. Only a fraction of them is utilised in animal feed, composting, or other uses and the rest is disposed of. The characterisation and technical potential of several biomass resources available in Mexico have been widely reported [34,35]. Such underutilised agroindustrial biomass has the potential for bioenergy generation in combined heat and power systems to supply energetic demands of the processes that generate them, thus promoting a circular economy and avoiding greenhouse gas emissions and other environmental problems. Bioenergy is becoming relevant in the Mexican energy sector contributing to 8% of final energy consumption in the country [36]. In this case, sugarcane bagasse is one of the main agroindustrial biomass used to generate combined heat and power in sugar mills for the sugar production process [37,38]. Another case study reported using orange peels to generate steam in the citrus processing industry [39]. However, the wider adoption and deployment of bioenergy in agroindustrial requires more capacity building and tools for aiding in the decision-making processes, especially economic evaluation tools. This type of tools would also support the development of energy services companies (ESCO) which business includes financing projects switching fossil fuels to biomass [32,40]. The models and concomitant software tool are demonstrated in this work to assess biomass and bioenergy costs for representative agroindustry in Mexico, including tequila, coffee and orange processing. Such industries generate agave bagasse, coffee pulp and orange peels as biomass. To the best of the authors’ knowledge, the techno-economic feasibility of CHP systems using such biomass feedstocks is presented here for the first time.
Based on the hypothesis that comparing the upstream cost and the downstream netback value of biomass provides the basis for assessing a bioenergy system, this paper proposes a biomass and bioenergy modelling framework for techno-economic assessment to estimate the production cost of biomass and bioenergy, as well as biomass netback. The modelling is separated into an upstream (to estimate the cost of producing biomass) and a downstream model (to estimate the cost of producing bioenergy and biomass netback). This compares the cost of biomass and the netback to establish the viability of a bioenergy value chain. Furthermore, the economic viability indicators, such as payback period and internal rate of return, can be estimated in the downstream model using the biomass cost estimated from the upstream model. The upstream model parametrisation is detailed enough for capturing different agroindustrial processes generating biomass. The downstream model captures the thermodynamics of the steam turbine cycle and uses the biomass composition to capture the effect of moisture, ash and elemental components to estimate the steam generation in boilers and the subsequent electricity generation in steam turbines. Such integrated modelling framework for biomass and bioenergy value chain used in the techno-economic assessment of bioenergy systems is presented and applied to agroindustrial settings here for the first time. The models have been implemented into IMP Bio2Energy® (Instituto Mexicano del Petróleo, Mexico City, Mexico), a user-friendly software application programmed as an Excel add-in.

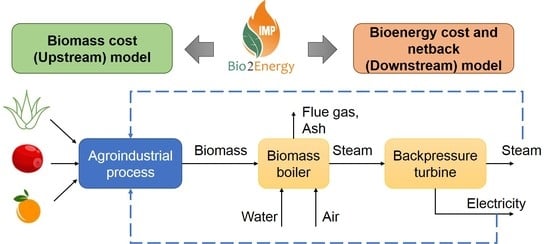
2. Materials and Methods

The modelling framework, including the two major models implemented into the IMP Bio2Energy® software tool, is shown in Figure 1. The upstream model considers all stages of biomass production from cultivation field to conditioning for use in bioenergy systems, with the calculation of biomass cost of production. The downstream model considers the bioenergy generation system to calculate biomass netback, bioenergy costs and economic feasibility indicators. The modules included are briefly described as follows. Details on the models and Equations can be found in the Supplementary Material.

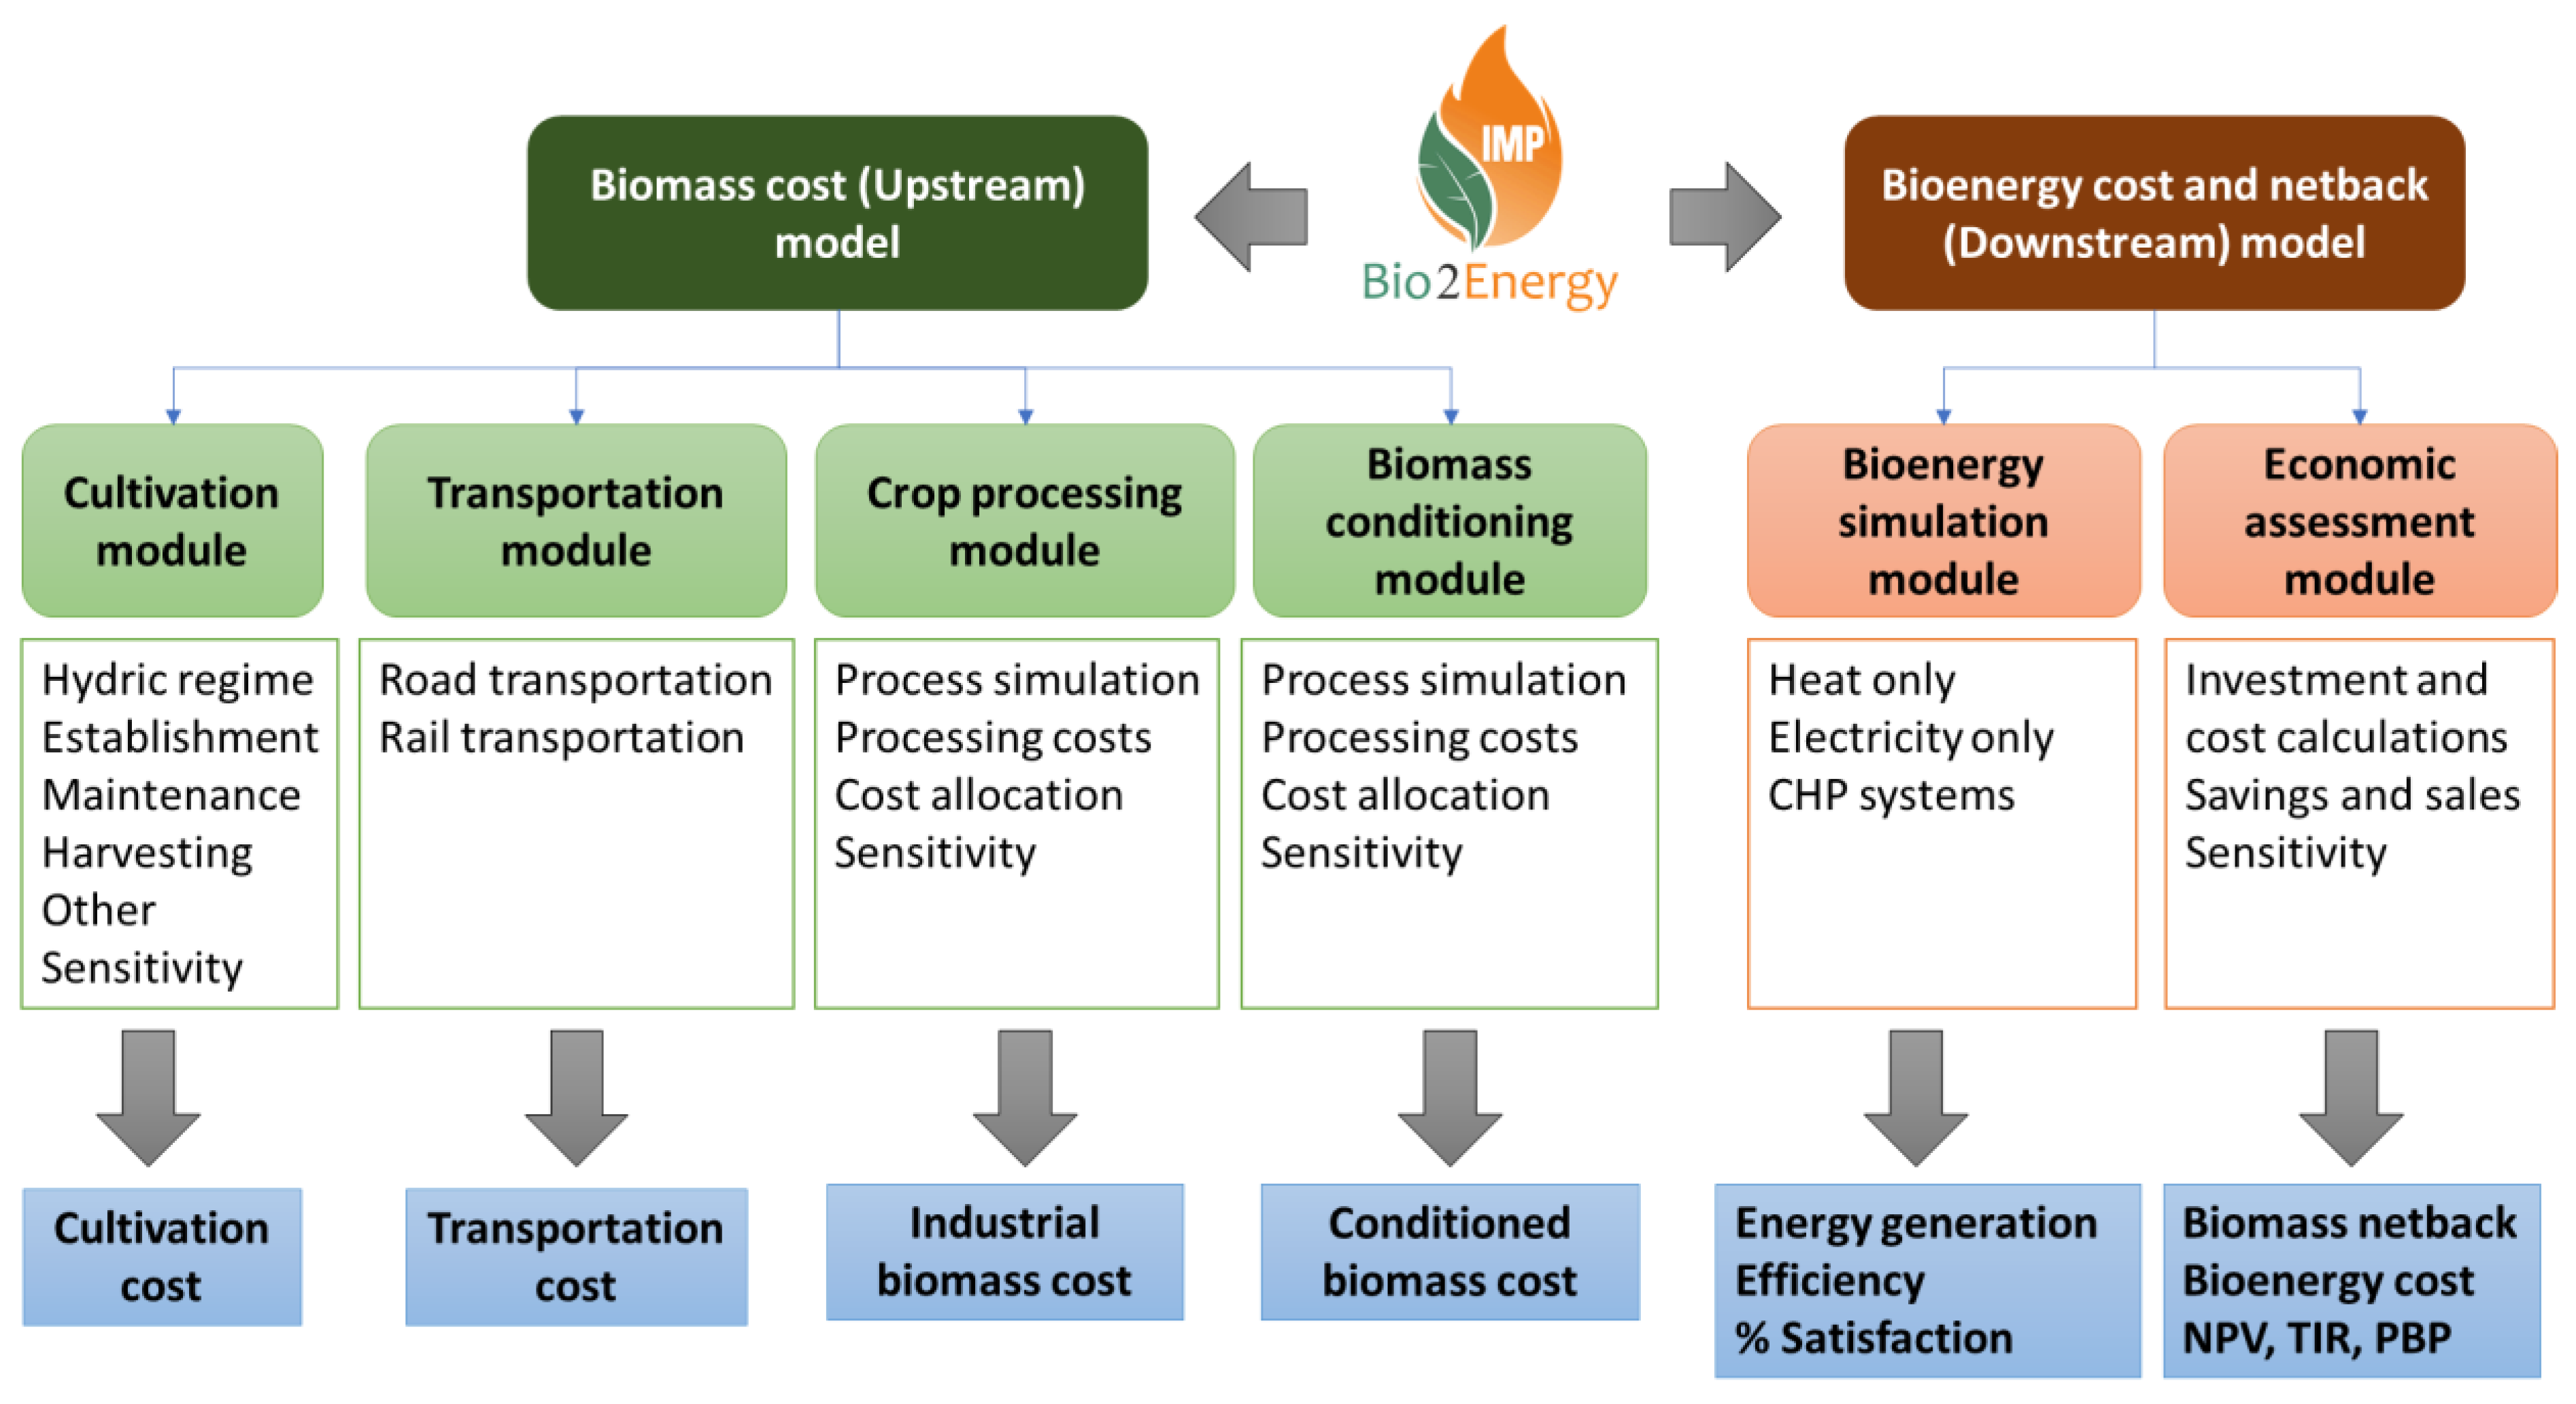
2.1. Biomass Production Cost (Upstream) Model

This model is intended to establish the cost allocated to biomass generated before being utilised in a bioenergy system. This model follows a value chain approach with stages considered depending on the system boundary and the origin of the biomass used for bioenergy. In the case of dedicated energy crops and agricultural coproducts, the value chain starts with the cultivation stage. In the case of agroindustrial biomass, the value chain starts with the crop processing stage and may include a conditioning stage (in the case of pellets, dried chips or other final form of biomass ready for utilisation in bioenergy systems). The modules capturing the aforementioned stages in this model include:

2.1.1. Cultivation

Here the cost for cultivation is determined considering agricultural inputs from establishment, maintenance, harvesting and other costs, and for both irrigation and rain-fed systems, similar to previous works [41]. For a given amount of crop, the mix from irrigation and rainfed systems can be specified. A simplified model option is provided if only total costs are already known, and itemised costs are, thus not provided as inputs. Several products may be harvested from the cultivation field, such as the main crop, or any other biomass coproduct. An economical allocation is then performed for the total costs.

2.1.2. Transportation

Here the costs for a given amount of transported material and an average distance is determined from the mix of transportation means by road and rail. The rail transportation model and two road transportation models are options using the transport Equation with fixed and variable costs terms [13]. For the case of road transportation, there is a third option with a detailed model disaggregating the operational (driver salary, fuel, insurance, etc.) and fixed costs per journey.

2.1.3. Crop Processing

In this module, the mass and energy balance of the agroindustrial process generating biomass is simulated based on information provided on the flows or input-output factors (taking the amount of crop processed as a basis). Based on the simulation results, the module calculates the operating and capital costs and allocates the total among the various products, including any stream specified as a biomass product. Allocation can be done using the mass or economic value approach, and if cultivation and transportation costs are calculated, it can take into account the calculated cost of production of the crop or the market price paid by the processing facility.

2.1.4. Biomass Conditioning

In this module, the mass and energy balance of biomass conditioning is simulated based on information provided on the flows or input and output factors taking the amount of raw biomass processed. Pelletising and drying are two conditioning processes provided by default, but any other processes can be simulated. Pelletising costs are based on the previous model [13], while drying is based on the calculation of the heat required for water vaporisation for specified initial and final desired moisture. Based on the simulation results, the module calculates the operating and capital costs and allocates the total costs to the conditioned biomass product.
The modules can be run independently to calculate the cost of each stage. In addition, total costs can be added in a final report. In this work, only the crop processing, and in some cases, the biomass conditioning modules are run as the bioenergy is produced from agroindustrial coproducts. However, when using dedicated crops or agricultural biomass collected from the field, all the modules can be used for a full analysis.

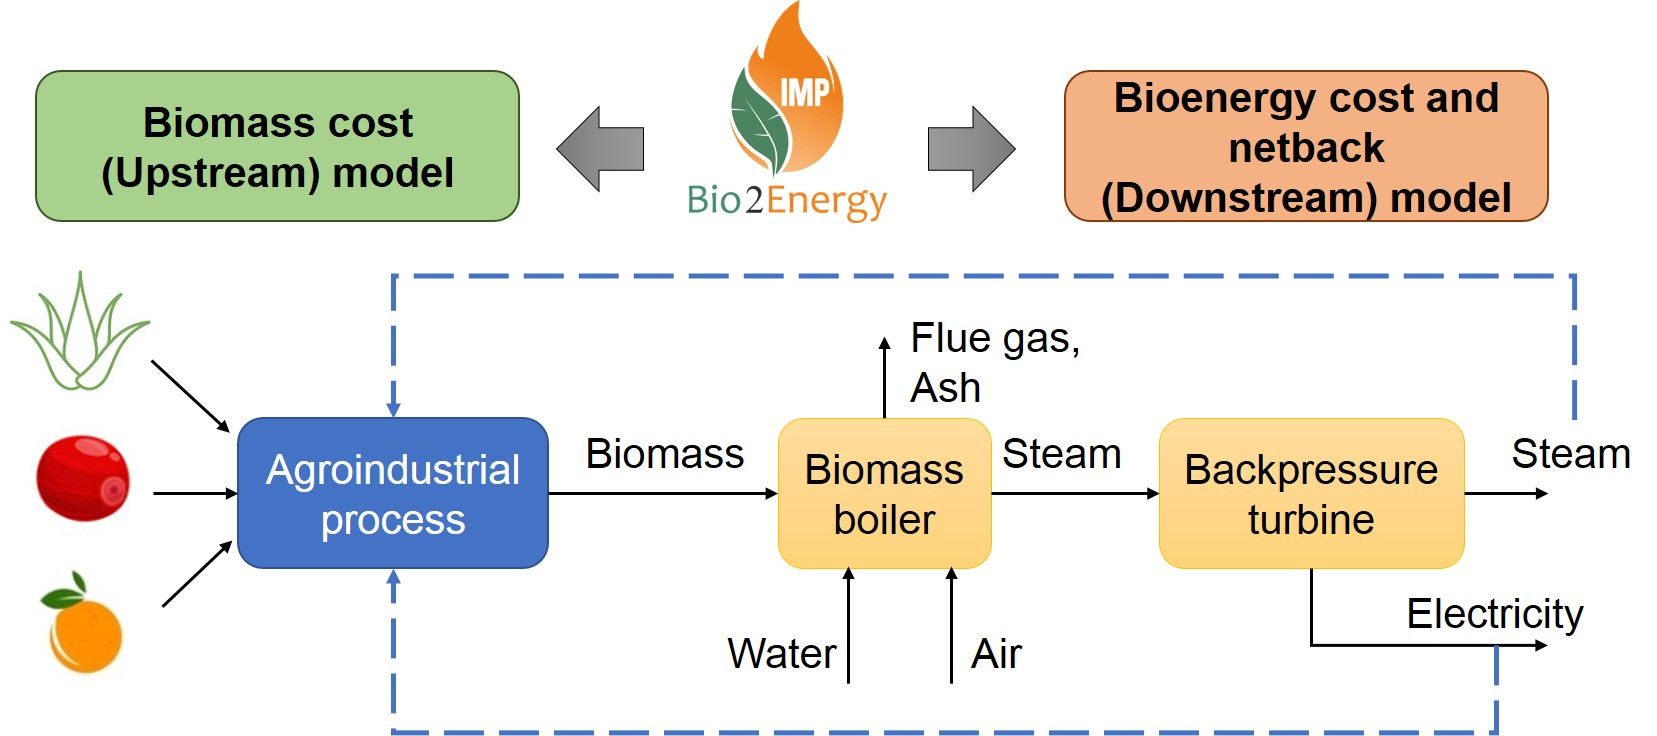
2.2. Biomass Netback and Energy Production Cost (Downstream) Model

In this model, the total cost of producing bioenergy is determined using thermodynamic modelling and simulation of a steam cycle. The energy production systems include options for electricity only, heat only or combined heat and power systems. The model includes:

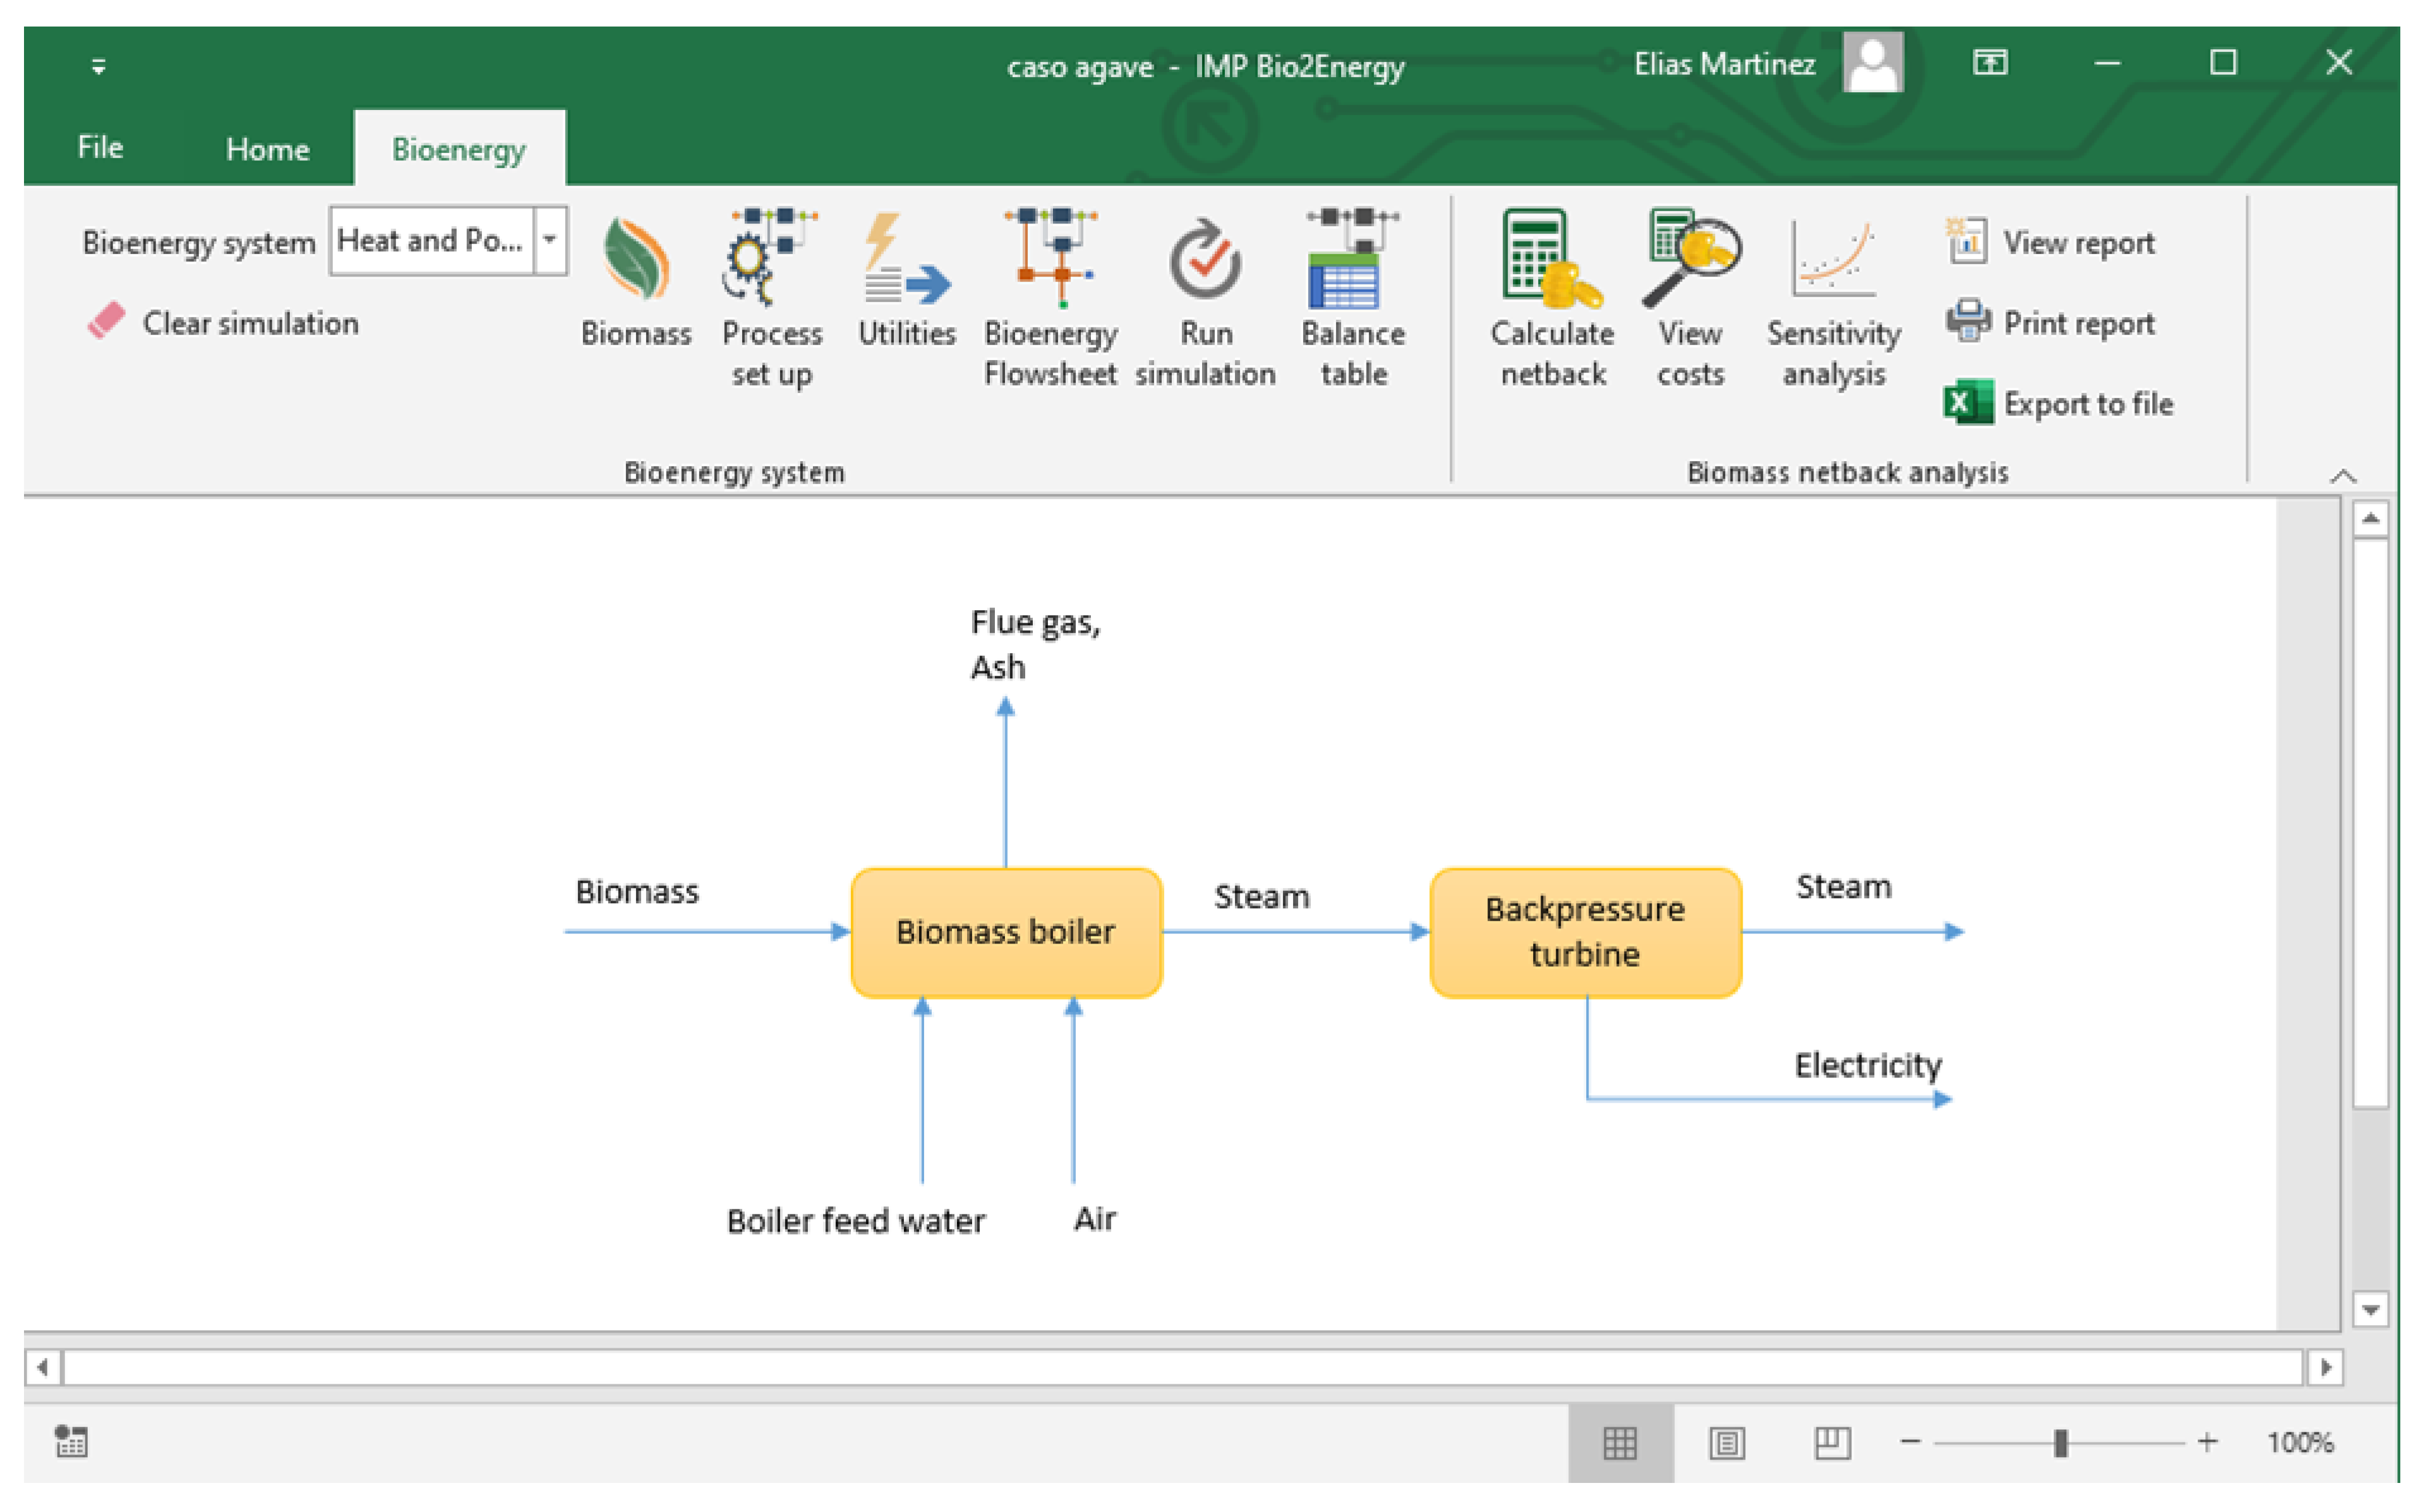
2.2.1. Bioenergy Simulation Module

This module starts with the biomass amount and composition. Correlations to estimate high heating value are provided, or value can be user-specified. The elemental composition is used to determine the stoichiometric combustion relationships for mass and energy balance in the biomass boiler. Net heat available for steam production is calculated from an enthalpy balance considering heating value minus energy losses through the boiler wall, the flue gas and the ash outputs. The parameters that can be explored in the boiler model are the steam pressure and temperature, the efficiency (as 100 minus losses through the boiler walls), the boiler feedwater and air input temperatures, the flue gas outlet temperature and the air excess ratio. Steam can be specified as saturated steam or superheated. The steam properties are calculated based on the IAPWS formulation [42]. In the CHP system option, the turbine parameters include the outlet pressure, isentropic and generator efficiencies. With this flexibility, several operating conditions can be analysed for any particular biomass-based energy system. The system calculates the turbine power, net heat and power generation, percentage of electricity and steam supply for given biomass input and demands specified, the outlet steam conditions, and the system’s efficiency. Figure 2 summarises the bioenergy CHP system simulated in a screenshot of the IMP Bio2Energy® software. The CHP system consists of combustion in a biomass boiler to generate steam, the steam is then passed on to a backpressure turbine to generate electricity, and the resulting steam is sent to the corresponding agroindustrial process.
The basic modelling equations for the bioenergy simulation are presented as follows. The net amount of usable energy in the boiler to produce steam is estimated as:
n e t Q = t o t a l Q ( e f f b o i l e r / 100 ) m a s h C p a s h ( T o u t 25 )       m f l u e g a s C p f l u e g a s ( T o u t 25 )
where e f f b o i l e r is the boiler efficiency, m a s h is the ash mass flow, Cp are the corresponding heat capacities, Tout is the outlet temperature, m f l u e g a s is the flow of flue gases coming out of the boiler. t o t a l Q is the total energy that enters the boiler in biomass and air, estimated as:
t o t a l Q = H V   ( 1 m o i s t u r e / 100 ) + m a i r C p a i r   ( T a i r 25 )  
where HV is the heating value of biomass, moisture is the percentage of moisture in biomass, m a i r is the airflow that enters for combustion, Cpair is the heat capacity of the air. The higher heating value can be specified by the user or estimated from the elemental analysis of biomass. The lower heating value is calculated from the higher heating value.
The amount of air and flue gases is calculated based on the biomass elemental composition assuming full combustion. The stoichiometric reactions assumed include:
C + O2   CO2
2H + ½ O2   H2O
2O   O2
N + O2   NO2
S + O2   SO2
Then, a percentage of excess air is a parameter specified by the user to determine the total air inlet from the theoretical oxygen flow:
m a i r = m O 2 t h e o * ( 1 + f e x c e s s 100 ) f O 2 a i r / 100
where m O 2 t h e o is the stoichiometric mass flow required for complete combustion, f e x c e s s is the percentage of excess air, f O 2 a i r is the percentage of O2 in the air.
Equations for calculation of steam properties according to IAPWS are used to determine the energy change (enthalpy) required to generate steam at the boiler operating T and P conditions:
d H w = ( H s t e a m H f e e d w a t e r )
Then, the amount of steam generated is calculated as:
m v a p o r = n e t Q d H w
This will be equal to the amount of water to be fed to the boiler, and will be used for boiler sizing and cost estimation purposes.
From the calculated steam flow, the specified turbine outlet discharge pressure and turbine efficiency, the amount of electricity generated (in kW) is calculated as:
E e l = W t h e o × e f f / 1000
The total amount in kWh/year is obtained by multiplying E e l by the annual operating time of the plant. eff is the specified efficiency factor. W t h e o is the theoretical expansion work calculated by:
W t h e o = m v a p o r   ( f e / ( f e 1 ) )   *   p 1 *   v 1   *   ( 1 ( p 2 / p 1 ) ^ ( ( f e 1 ) / f e ) )
where fe is the steam expansion factor, p1 is the vapor inlet pressure, p2 is the discharge pressure of the turbine and v1 is the specific volume of steam (m3/kg) at turbine inlet conditions. m v a p o r should be in kg/s and pressure in Pa, to get the result in Watts.
Once the amounts of steam and electricity are determined, the overall efficiency of the bioenergy generation process and the percentage of demand for steam and electricity supplied is calculated.

2.2.2. Economic Assessment Module
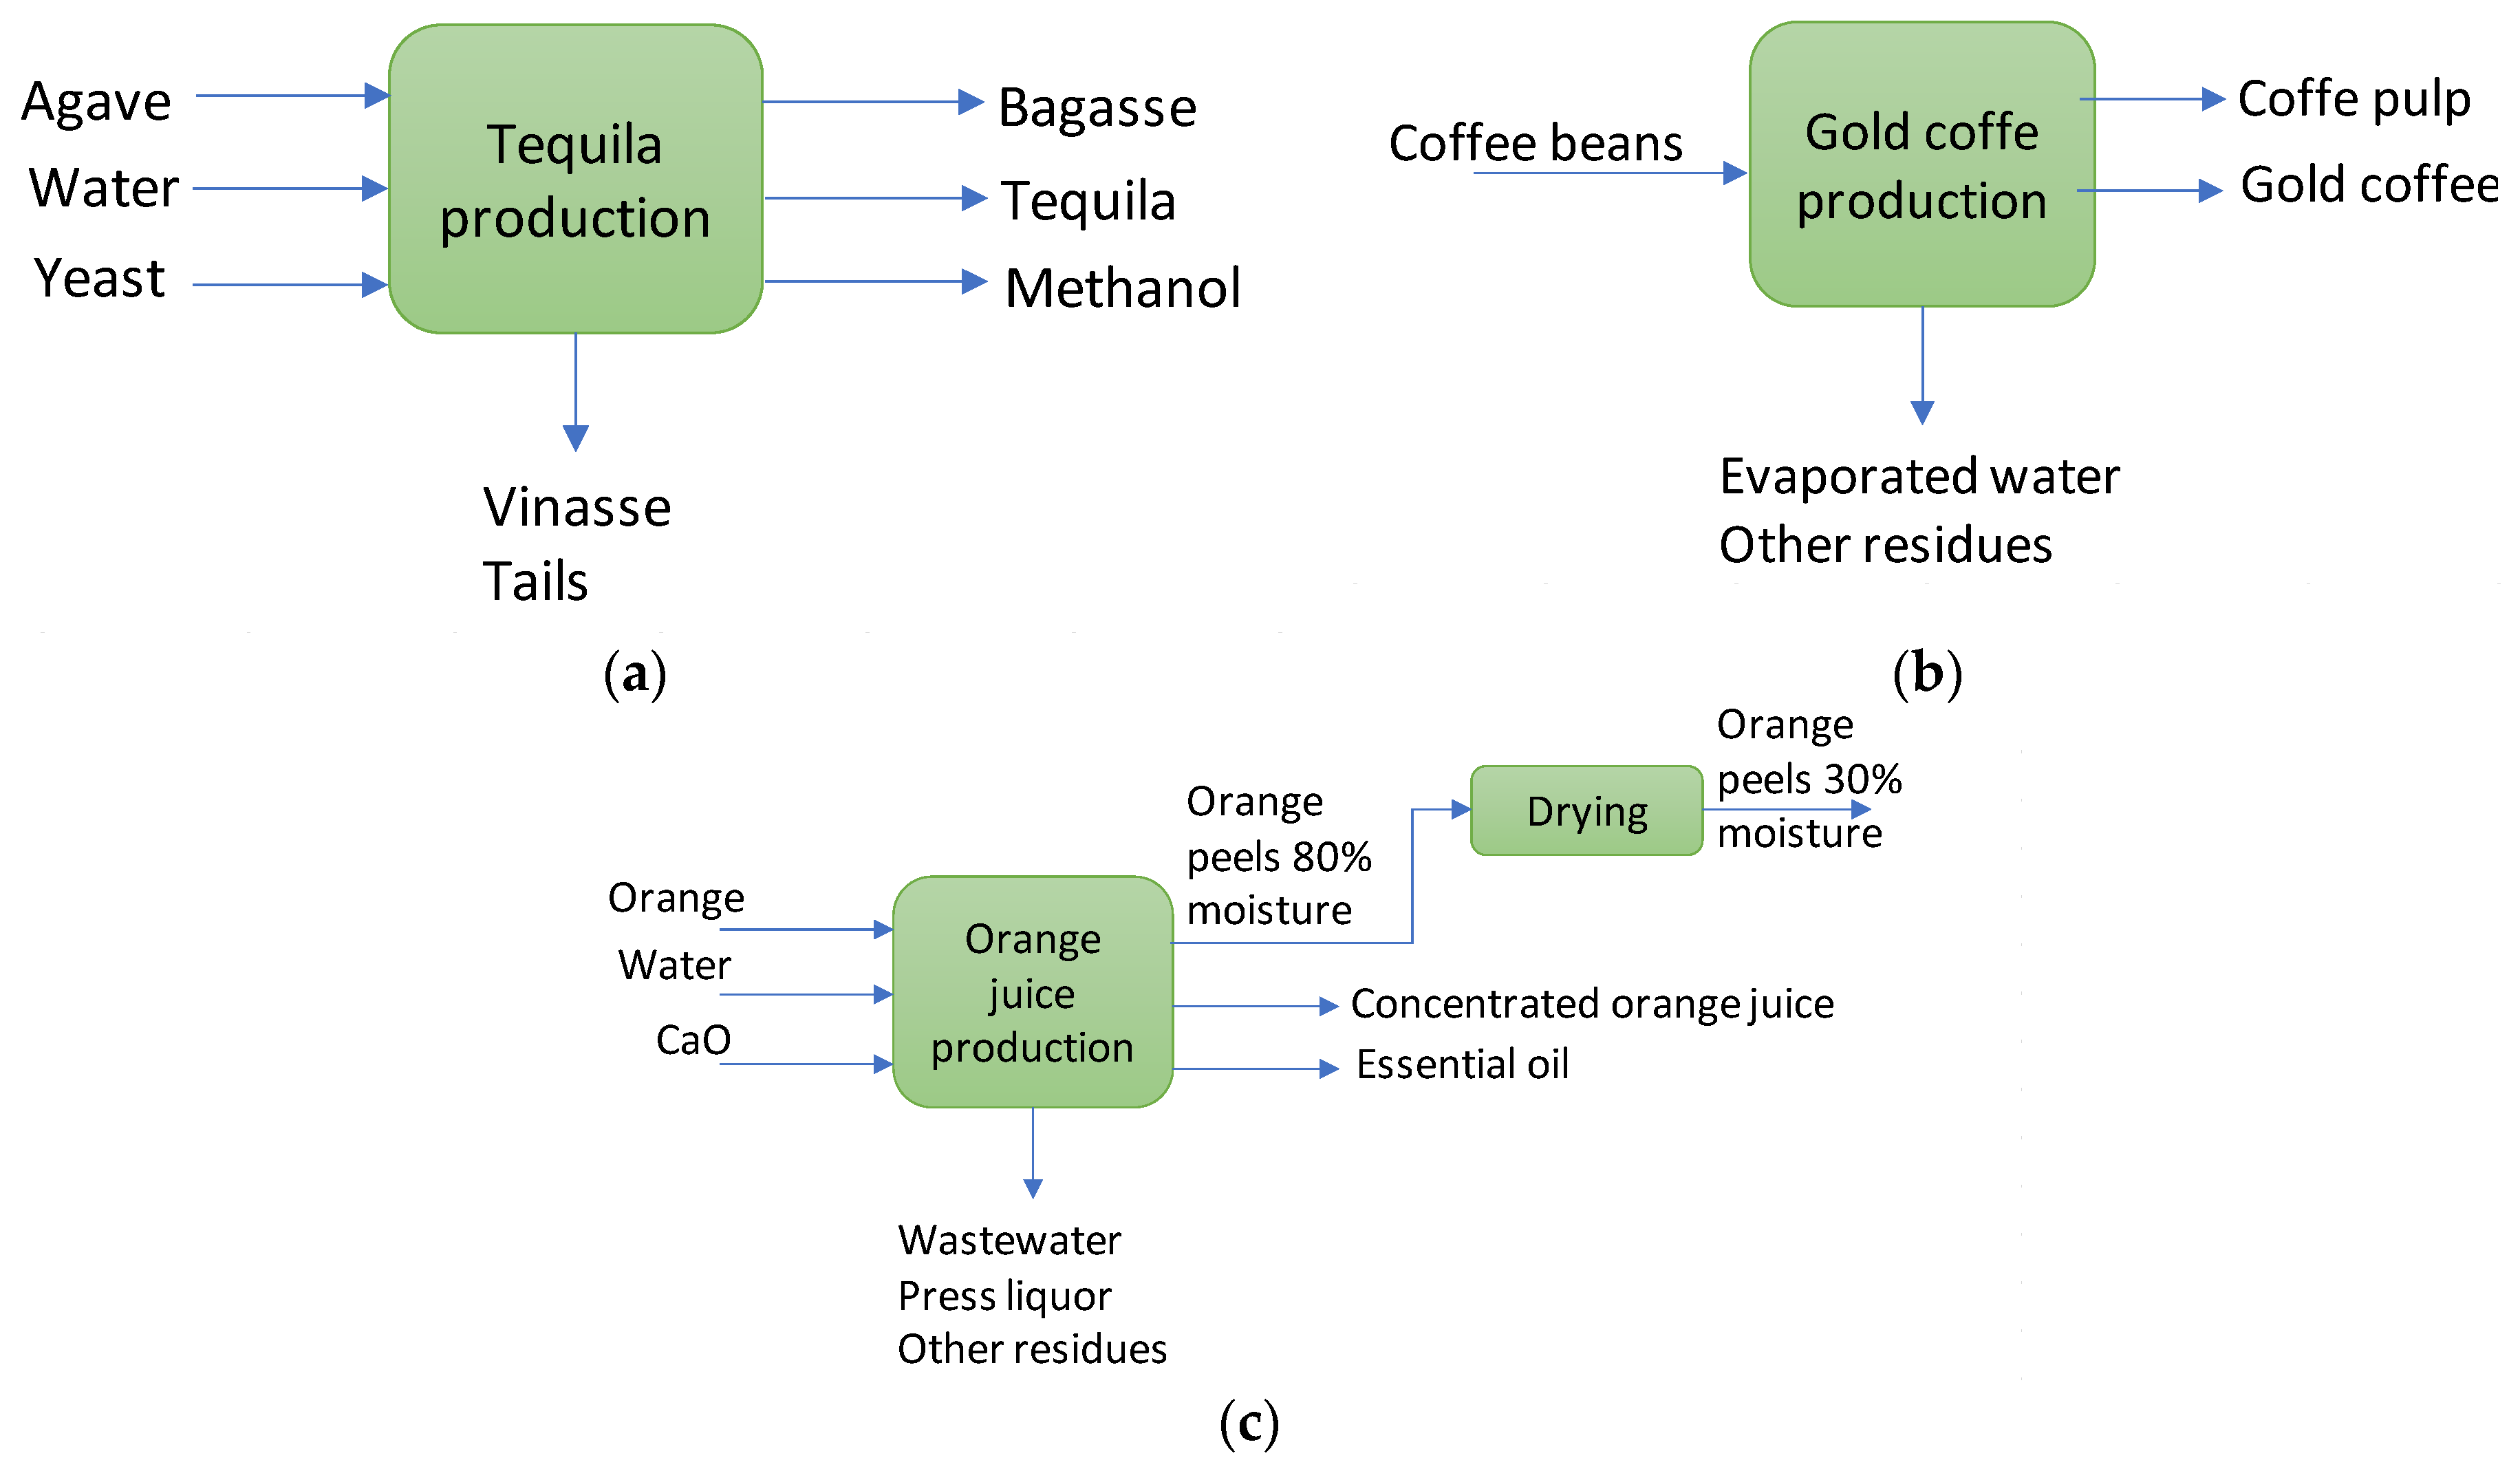
This part of the model calculates first a biomass netback using the following Equation:
N B = Energy   sales + Savings total   costs m
where NB is the biomass netback in $US/ton and m is the biomass input flow rate (ton/year). The netback considers the annual sales of any excess energy produced ($US/year), fuel and electricity bill savings ($US/year) by the co-located process (agroindustrial crop processing in this case), minus the capital and operating costs of the bioenergy system ($US/year). In this case, the cost of biomass is not considered, as the objective is to determine what biomass cost allows for economic break-even. The result can then be used to establish whether the cost of biomass production or the purchasing biomass price is below the netback, for the system to be economically feasible.
The bioenergy production costs are also calculated, but using a user-specified biomass reference price. In this case, the net present value, the payback period and internal rate of return are calculated. In this calculation, the biomass production cost determined by the upstream model can be used to perform an economic feasibility evaluation for utilising available agroindustrial biomass in a facility that is advantageous for replacing another fuel and electricity from the grid. Further details of the economic modelling Equations can be found in the Supplementary Material and in authoritative textbooks on bioenergy and biorefinery systems [10].
Although the application of Bio2Energy® for agroindustrial biomass is presented here, the software and models are flexible enough to analyse any type of biomass and bioenergy process conditions. The user interface allows for sensitivity analysis of relevant variables in each model. These capabilities are demonstrated in the following case studies.

3. Case Studies

Three agroindustrial value chains have been studied in this paper, including tequila production, gold coffee production and orange juice production. Figure 3 provide a simplified diagram showing the major inputs and outputs for these processes. The biomasses generated from these processes are agave bagasse, coffee pulp and orange peels, respectively. Mass balances and utility demands were obtained from IMP Bio2Energy® using the Crop processing module. In the case of agave bagasse and coffee pulp, it is assumed that these biomasses are used with 50% moisture directly in the CHP system. In the case of orange peels, these are dried from 80 to 30% moisture before used in the CHP system. The drying process was simulated using the Conditioning module in IMP Bio2Energy®. The main parameters for simulation of the agroindustrial processes are reported in Table 1, including the amount of crop processed and biomass used in the CHP system. All the mass balances and utility demands are reported in the Supplementary Material. The operational data was obtained from various literature sources for tequila production [43,44], coffee [45,46] and orange processing [39,47,48].
The bioenergy generation process in a CHP system was simulated using the downstream model in IMP Bio2Energy®. The biomass compositions are summarised in Table 2. The operational parameters specified for the boiler and steam turbine are reported in Table 3. The parameters used for the economic assessment are indicated in Table 4.
For the agroindustrial crop processing stage, it is considered that all processing facilities are in place, and investment has been already recovered. Therefore, no investment and only working capital was considered. For the case of the orange peels, the investment needed for drying equipment was estimated and included in the cost calculations. The cost allocation in the agroindustrial crop processing stage was carried out using the economic value method and using the average value of biomass as animal feed. Economic assessment is performed in a Mexican context using $US as currency and based on 2020 as the year of analysis. Prices for the main crop were specified and include transportation costs, thus the cultivation and transportation modules were not used in the present case studies. In the sensitivity analysis, we performed a two-way ANOVA, using Origin® v.8.5 to test whether the independent variables (biomass type and biomass input, or fossil fuel price or boiler steam pressure) have an effect on the dependent variable (unit cost, netback and PBP) with an α = 0.05; i.e., Ho = biomass type = biomass input = fossil fuel price = boiler steam pressure. All other economic data used in the assessment, as well as ANOVA results, are presented in the Supplementary Materials.

4. Results and Discussion

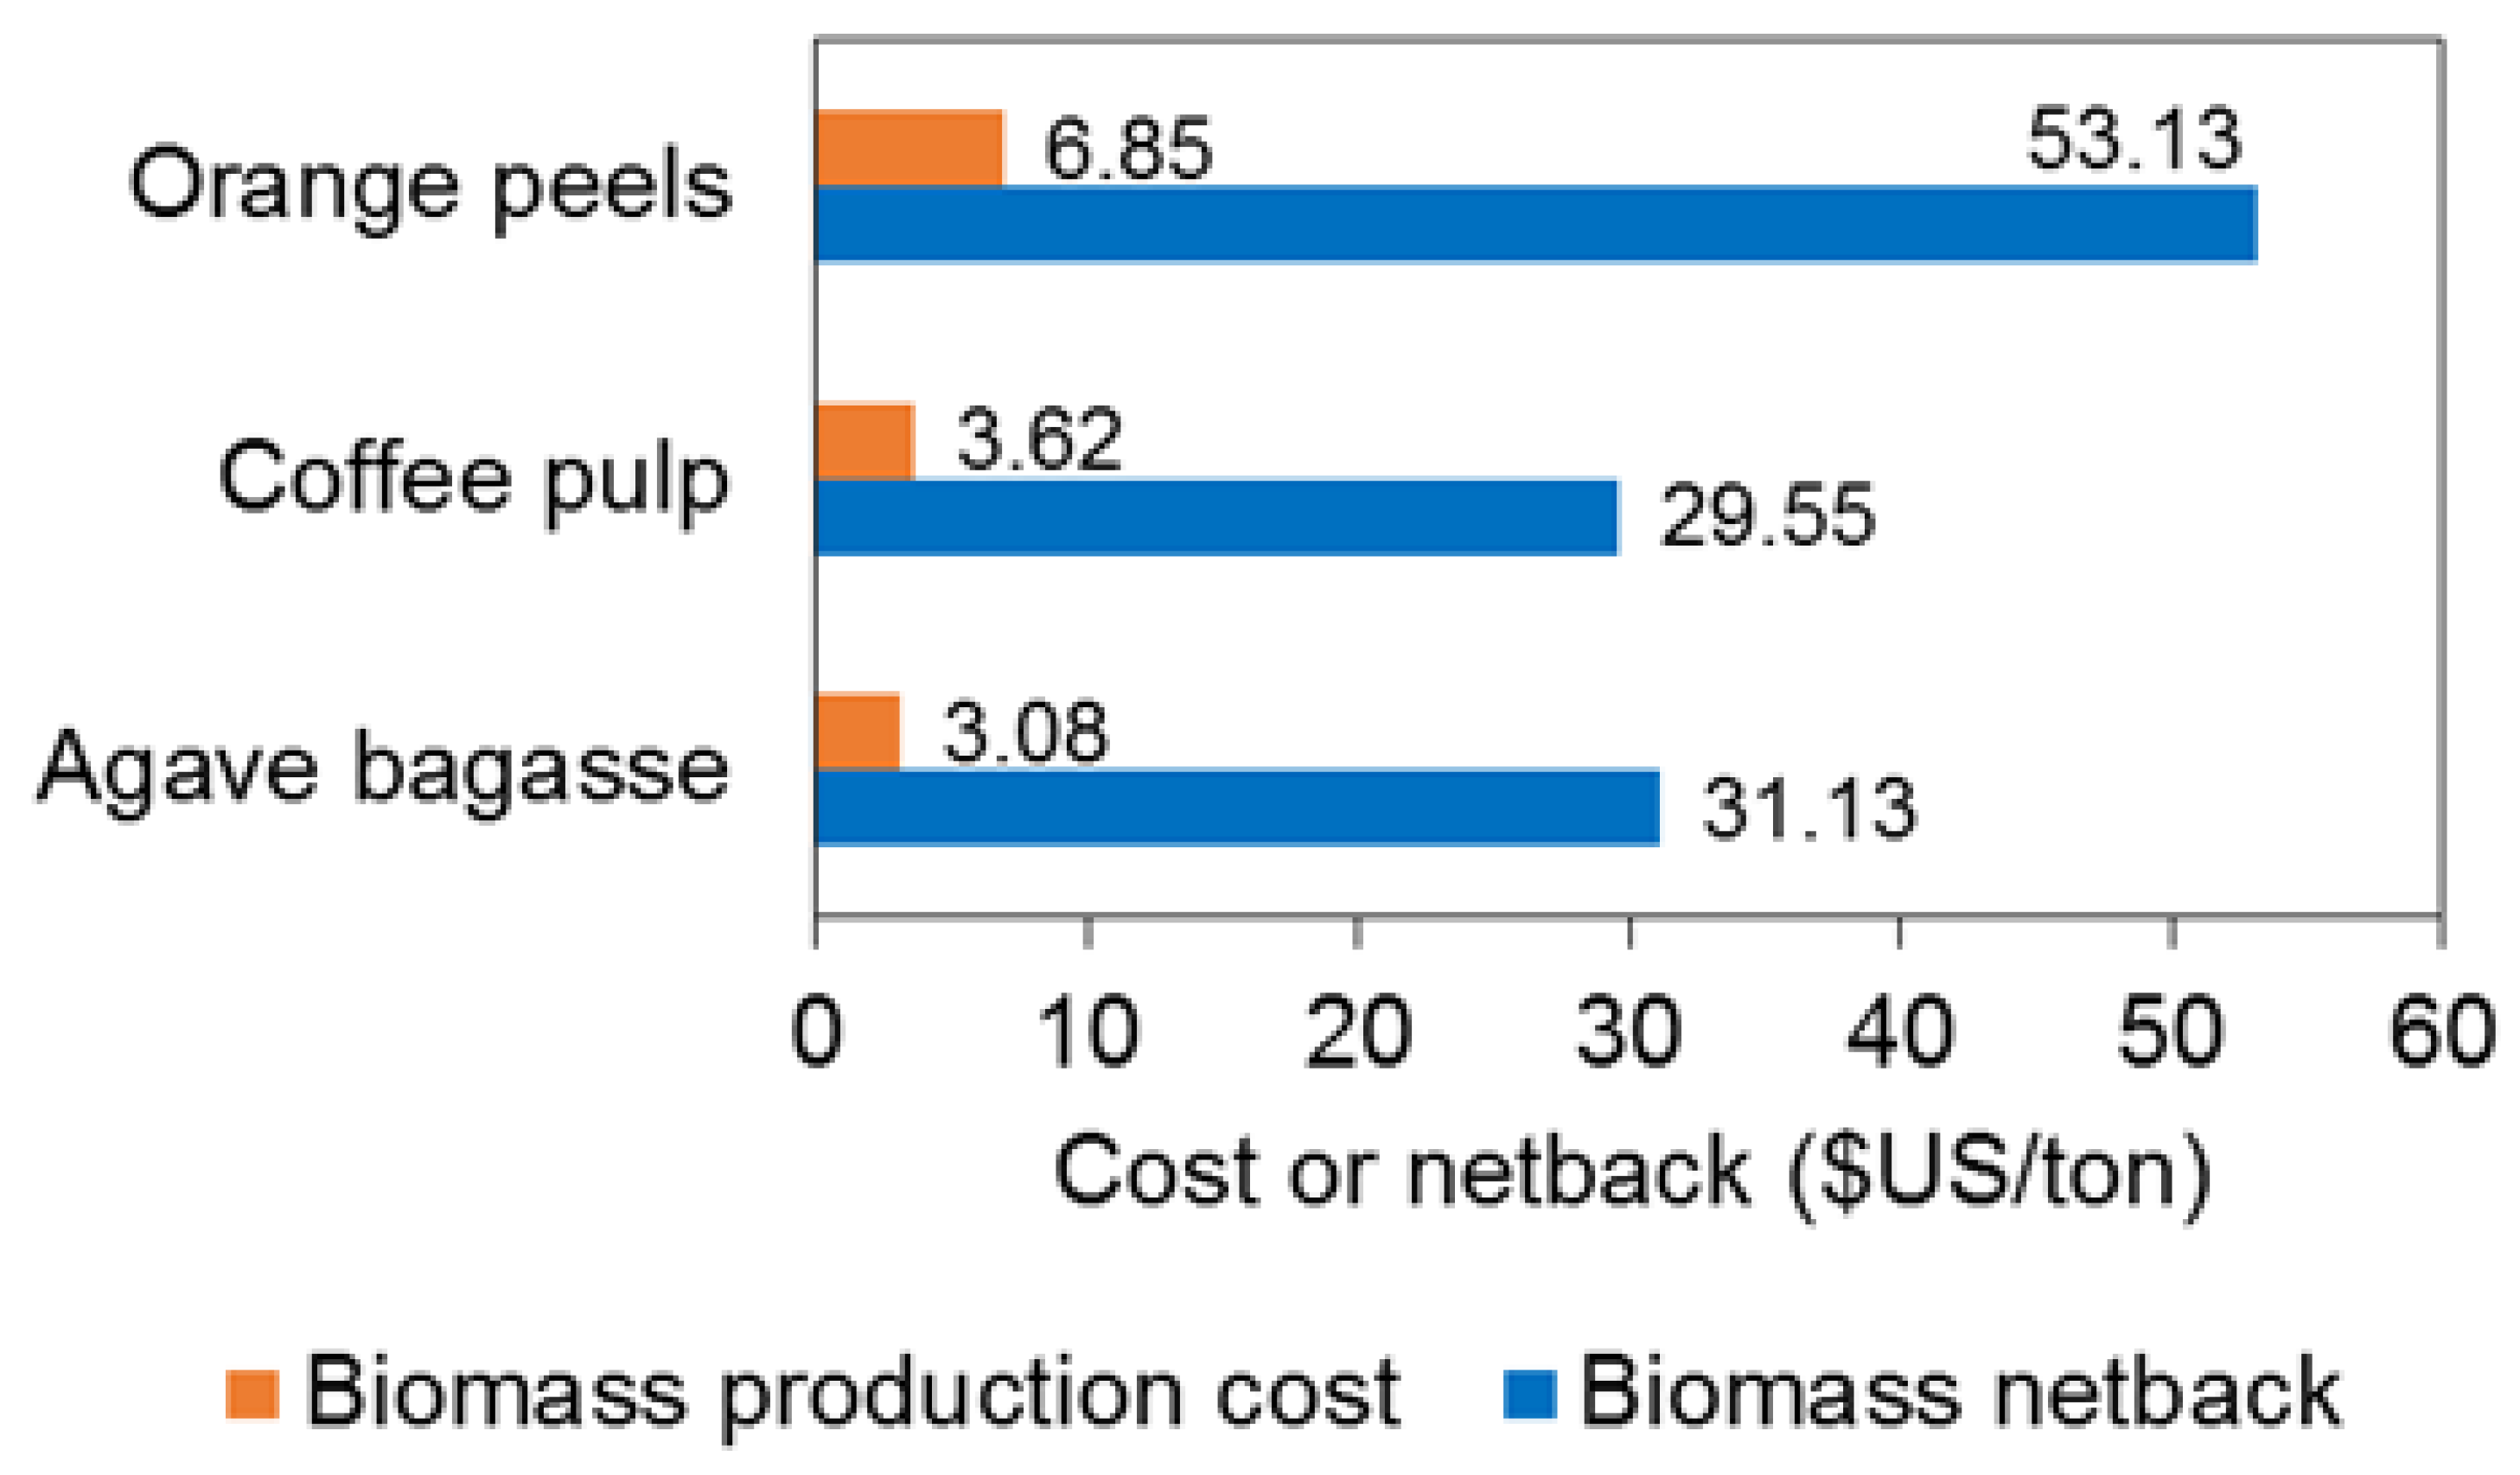
4.1. Biomass Production Cost vs. Biomass Netback

The advantage of modelling the upstream and downstream sides of a bioenergy system is that we can compare the cost of producing the biomass and the biomass netback (the biomass cost threshold for the economic feasibility of bioenergy). Figure 4 shows the results for the three case studies for the cost of biomass production on a wet basis. In all cases, biomass production cost is lower than the netback, meaning that the bioenergy value chain is economically feasible. The difference between these values is the net economic benefit obtained by implementing the biomass-based CHP systems to supply energy in each of the agroindustrial processes. This demonstrates the advantage of the whole value chain modelling and the usefulness of the approach for rapid assessment of the feasibility of a CHP system as stated in our hypothesis.
On a wet basis, the production cost of biomass is lower for agave bagasse, followed by coffee pulp, while the cost of dried orange peels is much higher. On a dry basis, the highest cost is 9.8 US$/ton for orange peels, followed by coffee pulp (7.24 US$/ton) and agave bagasse (6.16 US$/ton). This is mainly due to the cost required to produce orange peels with 30% moisture. However, this results in a higher biomass netback for the orange peels case, mainly due to the economy of scale and higher bioenergy production, as shown in the following sections. Moreover, the higher the fossil fuel replacement for steam generation, the higher the biomass netback. This is because the higher savings allow higher netback, according to Equation 8. In the cases of coffee pulp and agave bagasse, it is the electricity export sales that contributes to their netback. Although direct comparisons are not possible, due to a difference in country conditions, biomass types and model assumptions, the costs obtained here are lower than costs reported for dedicated crops or on-field agricultural biomass ($10 to more than 100 US$/ton) [1,12]. On an energy basis, the costs were 2.7 US$/GJ, 2.6 US$/GJ and 2.3 US$/GJ for agave bagasse, coffee pulp and orange peels, respectively. These costs are in line with the low range biomass costs between 2.25 US$/GJ and 4 US$/GJ reported elsewhere [1]. The costs for pellets from woody biomass were reported in the range of 8.4 and 9.6 euros/GJ [11], and in the case of Mexico, a pellet cost range between 6.3 and 12.8 US$/GJ has been reported [13]. It can be observed that these biomass costs are significantly higher, due to logistics and pellet processing costs involved, thus showing the advantage of directly using agroindustrial biomass for cost effective CHP generation. Studies on the netback value are rather scarce. One study determined the value of 48 US$/dry ton as an upper limit for the economic feasibility of biomass CHP [32], which is lower than the results obtained in this work for coffee pulp (59 US$/dry ton) and agave bagasse (62 US$/dry ton).

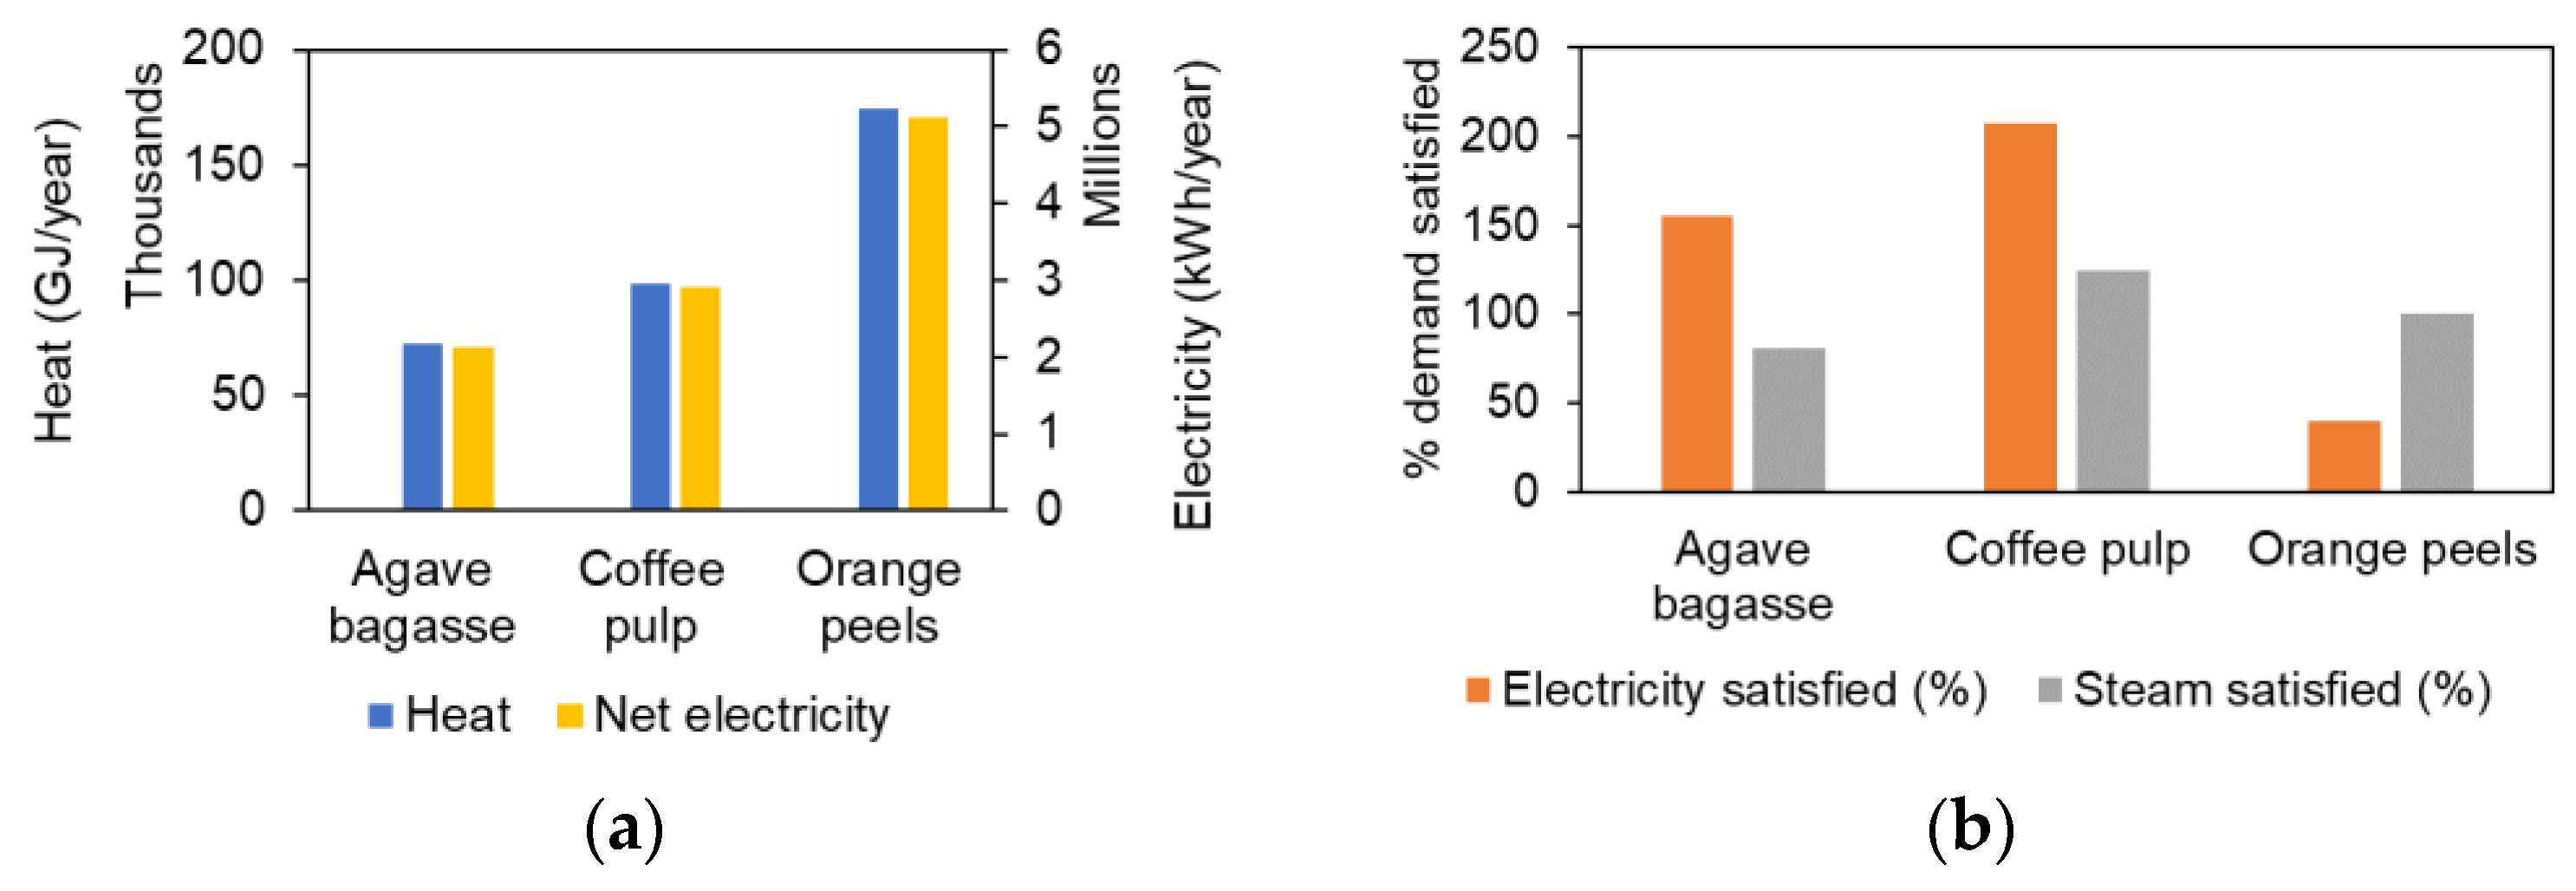
4.2. Bioenergy Production and Demand Satisfaction

Figure 5a shows the results of the net bioenergy produced from the CHP systems using the corresponding biomass in each agroindustrial process in Table 1. The resulting CHP electrical capacities are in the small size range: 0.261 MW, 0.414 MW and 1.134 MW for the agave bagasse, coffee pulp and orange peels, respectively. These are in line with the varying amounts of biomass available at each facility studied. Figure 5b shows the percentage of energy demand satisfaction for each agroindustrial process. It can be observed that in the agave bagasse case, the whole electricity demand is satisfied with 55.5% of electricity being exported (about 763,806 kWh/year), while the steam demand is satisfied only by 80.8%. This is because the tequila process is intensive in the steam requirement for the distillation unit. In the coffee pulp case, both the steam and electricity demands are satisfied, with 107% electricity being exported. This is because the coffee processing into gold coffee beans is relatively less complex and requires lower energy. Using an average electricity consumption in rural houses in Mexico of 1135 kWh/year [49], the agave bagasse CHP and coffee pulp CHP systems could supply electricity to 673 and 1324 rural houses. This shows that significant socio-economic benefits can be obtained from the tequila and coffee agroindustries using their biomass for bioenergy. In the orange peels case, while the steam demand for juice concentration is fully satisfied, the electricity demand is satisfied only by 40%. This is because part of the dried orange peels is burned to provide heat to the drying units, thus reducing biomass availability for the CHP system. Furthermore, juice extractors and centrifuges for concentration are electricity intensive unit operations in orange agroindustrial processing.
A comparison with similar systems shows different demand satisfaction percentages, due to differences in agroindustrial processing systems and biomass characteristics. For example, sugarcane bagasse was able to supply 100% of heat and generated a 30% of electricity excess for a case study in a sugarcane mill [38], while the use of orange peels can supply 65% of the heat required by orange juice processing [39].

4.3. Bioenergy Cost of Production and Other Economic Indicators
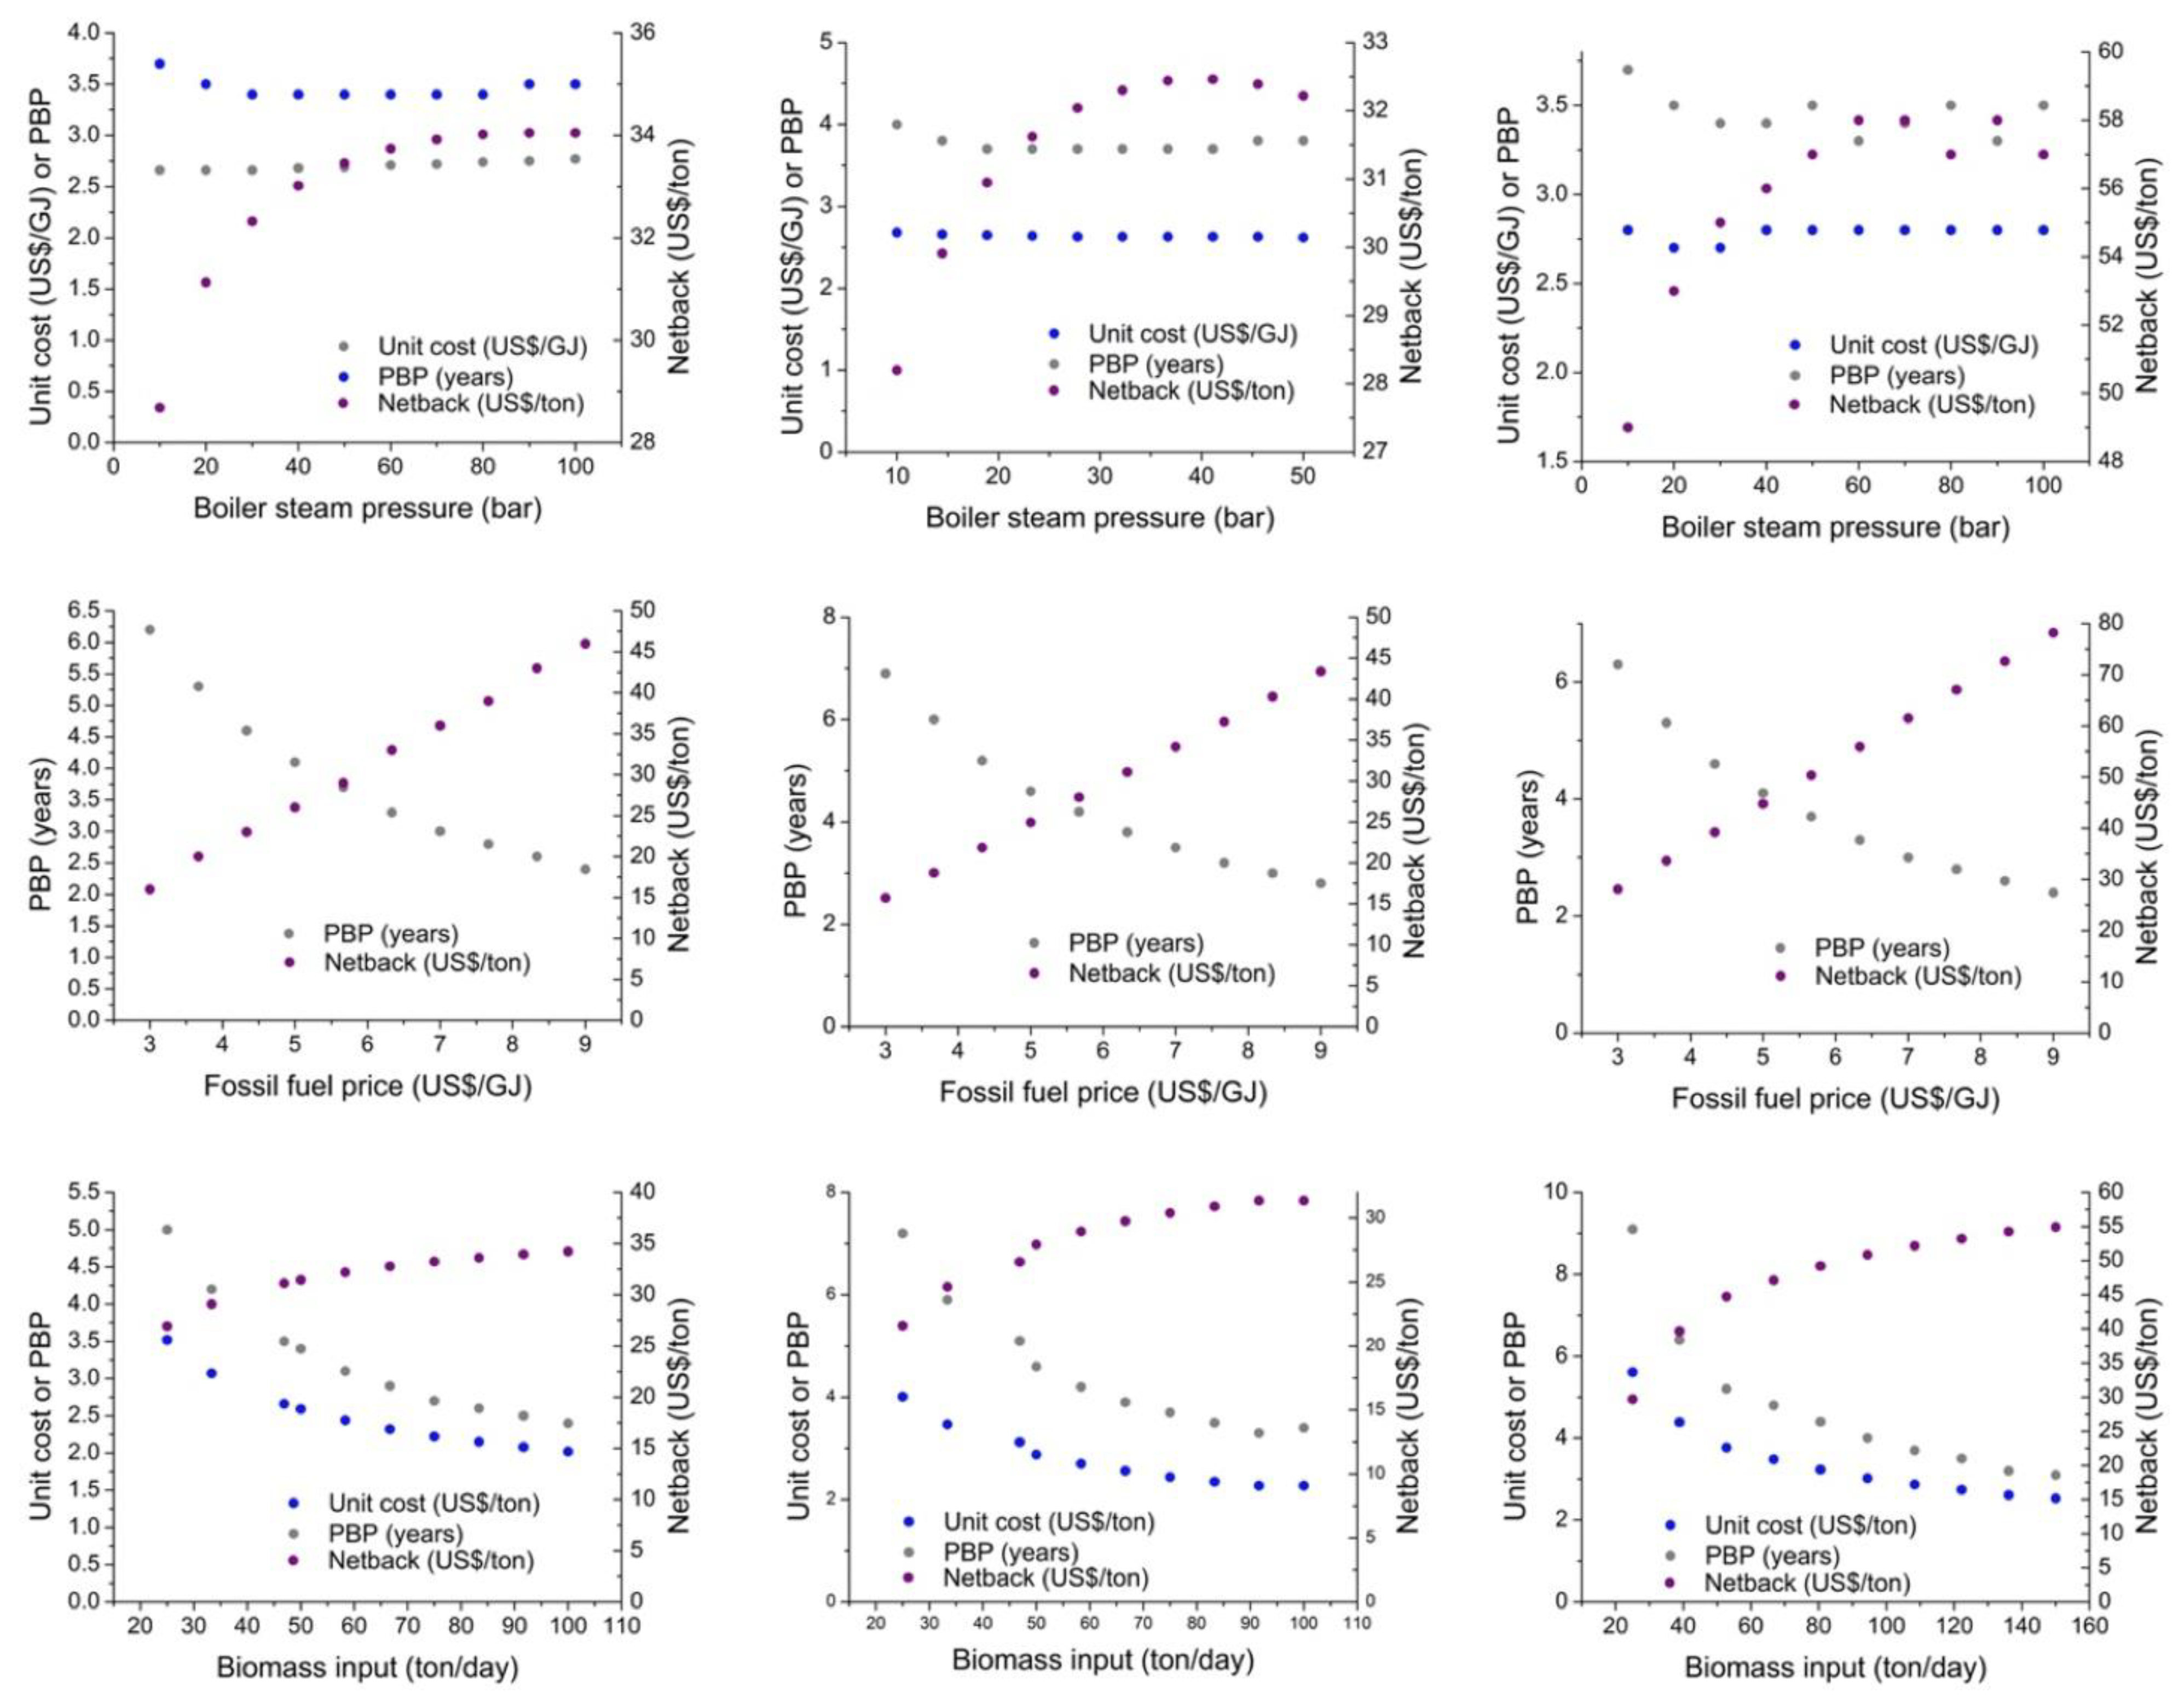
Figure 6a shows the results of the cost of bioenergy production considering capital and operating costs. The cost is lower in the orange peels case, due to the benefit of economies of scales as the CHP capacity is higher than in the other cases. The cost of bioenergy can be compared to the cost of heat from fuel oil and grid electricity. In the case of heat, the cost of production from fuel oil is (6 US$/GJ/0.8) = 7.5 US$/GJ. This means that in all cases, the cost of bioenergy is lower. The cost per kWh (0.0097, 0.0094 and 0.0083 US$/kWh for agave bagasse, coffee pulp and orange peels, respectively) is also lower than the grid electricity cost (in Table 4) in all cases. These results showed the significant advantage of using biomass from agroindustrial processes for their own supply as the collection and transport costs are avoided, resulting in lower biomass and bioenergy costs of production. However, the cost is dependent on the cost allocated to biomass, and therefore, the cost of the main crop in the upstream agroindustrial process.
Biomass-generated electricity can be very competitive where low-cost feedstocks are available onsite at industrial, forestry or agricultural processing plants. In such cases, electricity costs have been reported with a range of between 0.03 US$/kWh and 0.06 US$/kWh (lower costs are obtained in developing countries using bulk agroindustrial biomass) [1]. Thus, the bioenergy costs obtained in our results are competitive mainly due to the high benefit from using the steam for agroindustrial processing.
The investment required for the agave bagasse CHP system was estimated at 2 million USD, with a corresponding payback period of 3.5 years and IRR of 22% (Figure 6b). The investment for the coffee pulp CHP system was estimated at 2.5 million USD, with a corresponding payback period of 4 years and IRR of 20% (Figure 6b). Finally, for the orange peel case study, the investment is 4.6 million USD plus 2 million for the drying equipment, with a payback period of 3.5 years and IRR of 22%. (Figure 6b) This latter case required higher investment, but has the benefit of the economy of scale. In all cases, the investment showed positive indicators confirming the attractiveness and benefits of agroindustrial biomass CHP systems. For comparison, the PBP of 4.3 years have been obtained for sugarcane bagasse [23], and between 3 and 15 years with IRR values between 13 and 23 % for various biomass CHP case studies [40].
It is well known that the techno-economic results are sensitive to the biomass and fossil energy prices, as well as the economy of scale. Furthermore, CHP systems can be designed with different operating conditions, such as the steam pressure in the boiler. Therefore, the sensitivity to these variables was explored in the following section using the Bio2Energy® software.

4.4. Sensitivity

Sensitivity analyses were carried out for the biomass cost of production, bioenergy unit cost of production, biomass netback and PBP. For the sensitivity of biomass cost of production, the crop price was varied. For the agave case, the price was varied from 750 to 1500 US$/ton, for coffee beans from 250 to 500 US$/ton and for oranges from 75 to 150 US$/ton. The resulting range for biomass cost was 2.2–4.1 US$/ton for agave bagasse, 2.62–5.1 US$/ton for coffee pulp and 6.3–7.1 US$/ton for orange peels. In all cases, these costs are lower than the corresponding biomass netback obtained from the downstream model. From ANOVA results, we observed that the dependent variable, i.e., the unit cost of production ($US/ton) is significantly affected at α = 0.05 by all independent factors except by boiler steam pressure (see Supplementary information for ANOVA data). This is mainly because in the current model, the effect of boiler steam pressure is more directly related to the amount of energy produced and the resulting savings or sales rather than costs. It is also acknowledged that the pressure needs to be captured in the boiler cost estimation in new versions of the model.
For the sensitivity of biomass netback, bioenergy unit cost of production and PBP to variation in boiler steam pressure, fossil fuel price and biomass input, the results are shown in Figure 7. It can be observed how the operating boiler steam pressure has an interesting impact on the biomass netback. Optimum pressure is found at around 40 bar for coffee pulp. For the case of agave bagasse, the netback becomes practically constant after 70 bar, and after 60 bar for the orange peels case. The biomass netback and PBP showed a linear influence by the fuel oil price, improving when increasing the price. Sensitivity to electricity price was also performed, but the impact was less important (see Supplementary Material). Finally, the sensitivity to biomass input to the CHP system was also analysed. The asymptotic trend in Figure 7 indicated that there is a maximum capacity towards which the economy of scale does not produce any improvement in the indicators. This happens at around 100 t/d for the agave bagasse and coffee pulp cases, and at around 130 t/d for the orange peels case. The ANOVA results presented in the Supplementary Material indicate that all independent factors (biomass input, biomass type and boiler steam pressure) have a significant effect at a α = 0.05 on biomass netback and PBP. In all cases, unit cost is not greatly affected. Correlations for the significant effects were developed and presented in Table 5.

5. Conclusions

This paper presented the bioenergy value chain modelling to estimate the biomass cost of production using an upstream model, and the biomass netback and bioenergy cost of production in CHP systems using a downstream model. Such models were implemented into the IMP Bio2Energy® software for practical application to various case studies. In specific, it allowed comparing biomass cost of production and biomass netback to analyse CHP systems using agroindustrial biomass for energy supply to the industrial processes generating such biomass and considering the sales of excess electricity. The three agroindustries studied included tequila production, coffee and orange processing, using the agave bagasse, coffee pulp and orange peels, respectively, as biomass. Results showed that the CHP systems are in all cases economically feasible as the biomass cost of production is lower than the netback, while the cost of bioenergy was lower than the fuel oil and grid electricity being replaced. IMP Bio2Energy® carried out a sensitivity analysis to technical (boiler steam pressure) and economic variables (fuel oil price and biomass input). All independent factors (biomass input, biomass type and boiler steam pressure) had a significant effect on dependent variables (unit cost, netback and PBP) at α = 0.05. The only exception was for boiler steam pressure which effect was not significant on biomass unit cost. Capturing the effect of pressure on the capital cost of the boiler in the deterministic modelling is recommended. From sensitivity analysis, the optimal design pressure, and system scale thresholds were identified. These results demonstrate the usefulness of the modelling approaches and the IMP Bio2Energy® software for decision makers in analysing biomass CHP systems from a whole biomass and bioenergy value chain perspective.

Supplementary Materials

The following are available online at https://www.mdpi.com/article/10.3390/en14144181/s1, Economic and Upstream Modelling Description. Agroindustrial modelling results (Table S1 to Table S4), sensitivity to electricity prices (Figure S1 to Figure S2) and ANOVA results (Table S5 to Table S12).

Author Contributions

Conceptualization, E.M.-H., M.A.A.-A. and J.A.; Formal analysis, E.M.-H.; Funding acquisition, M.A.A.-A. and J.A.; Methodology, E.M.-H.; Project administration, M.A.A.-A. and J.A.; Software, E.M.-H.; ANOVA analysis, J.A.; Writing—original draft, E.M.-H.; Writing—review & editing, E.M.-H., M.A.A.-A. and J.A. All authors have read and agreed to the published version of the manuscript.

Funding

This research was funded by SENER CONACyT Energy Sustainability Fund, grant number 246911 and IMP, grant number Y.61025, and the APC was funded by Instituto Mexicano del Petróleo.

Institutional Review Board Statement

Not applicable.

Informed Consent Statement

Not applicable.

Data Availability Statement

Not applicable.

Acknowledgments

Authors thank SENER CONACyT Energy Sustainability Fund (Project 246911, IMP Y. 61025) for financial support. Authors thank Juan A. Zermeño Eguía-Lis for his participation in software testing, and Diana Dominguillo Ramírez for support in data collection and software logo.

Conflicts of Interest

The authors declare no conflict of interest.

References

  1. International Energy Agency (IEA). Renewable Power Generation Costs in 2017; International Energy Agency (IEA): Paris, France, 2018. [CrossRef]
  2. Dornburg, V.; Faaij, A.P. Efficiency and economy of wood-fired biomass energy systems in relation to scale regarding heat and power generation using combustion and gasification technologies. Biomass Bioenergy 2001, 21, 91–108. [Google Scholar] [CrossRef]
  3. Kempegowda, R.S.; Skreiberg, Ø.; Tran, K.-Q. Techno-economic Evaluations of Various Biomass CHP Technologies and Policy Measures Under Norwegian Conditions. Energy Procedia 2012, 20, 1–10. [Google Scholar] [CrossRef] [Green Version]
  4. Gregg, J.S.; Jürgens, J.; Happel, M.K.; Strøm-Andersen, N.; Tanner, A.N.; Bolwig, S.; Klitkou, A. Valorization of bio-residuals in the food and forestry sectors in support of a circular bioeconomy: A review. J. Clean. Prod. 2020, 267, 122093. [Google Scholar] [CrossRef]
  5. Ajila, C.M.; Brar, S.K.; Verma, M.; Rao, U.J.S.P. Sustainable Solutions for Agro Processing Waste Management: An Overview. In Environmental Protection Strategies for Sustainable Development; Springer: Dordrecht, The Netherlands, 2012; pp. 65–109. [Google Scholar]
  6. Di Fraia, S.; Fabozzi, S.; Macaluso, A.; Vanoli, L. Energy potential of residual biomass from agro-industry in a Mediterranean region of southern Italy (Campania). J. Clean. Prod. 2020, 277, 124085. [Google Scholar] [CrossRef]
  7. Anwar, Z.; Gulfraz, M.; Irshad, M. Agro-industrial lignocellulosic biomass a key to unlock the future bio-energy: A brief review. J. Radiat. Res. Appl. Sci. 2014, 7, 163–173. [Google Scholar] [CrossRef]
  8. Wright, D.G.; Dey, P.; Brammer, J. A barrier and techno-economic analysis of small-scale bCHP (biomass combined heat and power) schemes in the UK. Energy 2014, 71, 332–345. [Google Scholar] [CrossRef] [Green Version]
  9. Lo, S.L.Y.; How, B.S.; Leong, W.D.; Teng, S.Y.; Rhamdhani, M.A.; Sunarso, J. Techno-economic analysis for biomass supply chain: A state-of-the-art review. Renew. Sustain. Energy Rev. 2021, 135, 110164. [Google Scholar] [CrossRef]
  10. Sadhukhan, J.; Ng, K.S.; Hernandez, E.M. Biorefineries and Chemical Processes: Design, Integration and Sustainability Analysis. Green Process. Synth. 2014, 4, 65–66. [Google Scholar] [CrossRef]
  11. Bang, C.; Vitina, A.; Gregg, J.S.; Lindboe, H.H. Analysis of Biomass Prices; Ea Energy Analyses: Copenhagen, Dermark, 2013. [Google Scholar]
  12. Latourrette, T.; Ortiz, D.S.; Hlavka, E.; Burger, N.; Cecchine, G. Supplying Biomass to Power Plants; RAND Corporation: Santa Monica, CA, USA, 2010. [Google Scholar]
  13. Tauro, R.; García, C.A.; Skutsch, M.; Masera, O. The potential for sustainable biomass pellets in Mexico: An analysis of energy potential, logistic costs and market demand. Renew. Sustain. Energy Rev. 2018, 82, 380–389. [Google Scholar] [CrossRef]
  14. Havlíčková, K.; Weger, J.; Knápek, J. Modelling of biomass prices for bio-energy market in the Czech Republic. Simul. Model. Pr. Theory 2011, 19, 1946–1956. [Google Scholar] [CrossRef]
  15. Wang, Y.; Wang, J.; Zhang, X.; Grushecky, S. Environmental and Economic Assessments and Uncertainties of Multiple Lignocellulosic Biomass Utilization for Bioenergy Products: Case Studies. Energies 2020, 13, 6277. [Google Scholar] [CrossRef]
  16. Restrepo-Valencia, S.; Walter, A. Techno-Economic Assessment of Bio-Energy with Carbon Capture and Storage Systems in a Typical Sugarcane Mill in Brazil. Energies 2019, 12, 1129. [Google Scholar] [CrossRef] [Green Version]
  17. Ahmadi, L.; Kannangara, M.; Bensebaa, F. Cost-effectiveness of small scale biomass supply chain and bioenergy production systems in carbon credit markets: A life cycle perspective. Sustain. Energy Technol. Assess. 2020, 37. [Google Scholar] [CrossRef]
  18. Purkus, A.; Gawel, E.; Szarka, N.; Lauer, M.; Lenz, V.; Ortwein, A.; Tafarte, P.; Eichhorn, M.; Thrän, D. Contributions of flexible power generation from biomass to a secure and cost-effective electricity supply—a review of potentials, incentives and obstacles in Germany. Energy, Sustain. Soc. 2018, 8, 18. [Google Scholar] [CrossRef]
  19. Meng, L.; Alengebawy, A.; Ai, P.; Jin, K.; Chen, M.; Pan, Y. Techno-Economic Assessment of Three Modes of Large-Scale Crop Residue Utilization Projects in China. Energies 2020, 13, 3729. [Google Scholar] [CrossRef]
  20. Eksi, G.; Karaosmanoglu, F. Combined bioheat and biopower: A technology review and an assessment for Turkey. Renew. Sustain. Energy Rev. 2017, 73, 1313–1332. [Google Scholar] [CrossRef]
  21. Czekała, W.; Bartnikowska, S.; Dach, J.; Janczak, D.; Smurzyńska, A.; Kozłowski, K.; Bugała, D.; Lewicki, A.; Cieślik, M.; Typańska, D.; et al. The energy value and economic efficiency of solid biofuels produced from digestate and sawdust. Energy 2018, 159, 1118–1122. [Google Scholar] [CrossRef]
  22. Campbell, R.M.; Anderson, N.M.; Daugaard, D.E.; Naughton, H.T. Technoeconomic and Policy Drivers of Project Performance for Bioenergy Alternatives Using Biomass from Beetle-Killed Trees. Energies 2018, 11, 293. [Google Scholar] [CrossRef] [Green Version]
  23. Taner, T.; Sivrioglu, M. A techno-economic & cost analysis of a turbine power plant: A case study for sugar plant. Renew. Sustain. Energy Rev. 2017, 78, 722–730. [Google Scholar] [CrossRef]
  24. Wan, Y.K.; Sadhukhan, J.; Ng, K.S.; Ng, D.K. Techno-economic evaluations for feasibility of sago-based biorefinery, Part 1: Alternative energy systems. Chem. Eng. Res. Des. 2016, 107, 263–279. [Google Scholar] [CrossRef]
  25. Gan, S.H.; Wan, Y.K.; Leong, Y.T. Synthesize an optimum combined heat and power (CHP) system for sago industry via mathematical approach. AIP Conf. Proc. 2019, 2137, 020003. [Google Scholar] [CrossRef]
  26. Martinez-Hernandez, E.; Ibrahim, M.H.; Leach, M.; Sinclair, P.; Campbell, G.M.; Sadhukhan, J. Environmental sustainability analysis of UK whole-wheat bioethanol and CHP systems. Biomass Bioenergy 2013, 50, 52–64. [Google Scholar] [CrossRef]
  27. Havrysh, V.; Kalinichenko, A.; Mentel, G.; Mentel, U.; Vasbieva, D.G. Husk Energy Supply Systems for Sunflower Oil Mills. Energies 2020, 13, 361. [Google Scholar] [CrossRef] [Green Version]
  28. Hernandez, E.M.; Martinez-Herrera, J.; Campbell, G.; Sadhukhan, J. Process integration, energy and GHG emission analyses of Jatropha-based biorefinery systems. Biomass Convers. Biorefinery 2013, 4, 105–124. [Google Scholar] [CrossRef]
  29. Sims, R.; Flammini, A.; Puri, M.; Bracco, S. Opportunities for Agri-Food Chains to Become Energy-Smart; FAO: Washington, DC, USA; USAID: Washington, DC, USA, 2015.
  30. Ebadian, M.; Sowlati, T.; Sokhansanj, S.; Stumborg, M.; Townley-Smith, L. A new simulation model for multi-agricultural biomass logistics system in bioenergy production. Biosyst. Eng. 2011, 110, 280–290. [Google Scholar] [CrossRef]
  31. Keppo, I.; Savola, T. Economic appraisal of small biofuel fired CHP plants. Energy Convers. Manag. 2007, 48, 1212–1221. [Google Scholar] [CrossRef]
  32. Wood, S.; Rowley, P. A techno-economic analysis of small-scale, biomass-fuelled combined heat and power for community housing. Biomass Bioenergy 2011, 35, 3849–3858. [Google Scholar] [CrossRef] [Green Version]
  33. Centro Mario Molina. Bioenergía: Análisis Regional del Aprovechamiento Integral de los Residuos de la Industria Agropecuaria; Mario Molina Center: Mexico City, Mexico, 2016. [Google Scholar]
  34. Valdez-Vazquez, I.; Acevedo-Benítez, J.A.; Hernández-Santiago, C. Distribution and potential of bioenergy resources from agricultural activities in Mexico. Renew. Sustain. Energy Rev. 2010, 14, 2147–2153. [Google Scholar] [CrossRef]
  35. Parascanu, M.; Sandoval-Salas, F.; Soreanu, G.; Valverde, J.; Sanchez-Silva, L. Valorization of Mexican biomasses through pyrolysis, combustion and gasification processes. Renew. Sustain. Energy Rev. 2017, 71, 509–522. [Google Scholar] [CrossRef]
  36. SADER. Biomasa, Creación Ecológica de Energía|Secretaría de Agricultura y Desarrollo Rural|Gobierno|gob.mx n.d. Available online: https://www.gob.mx/agricultura/articulos/biomasa-creacion-ecologica-de-energia (accessed on 4 April 2021).
  37. Martinez-Hernandez, E.; Amezcua-Allieri, M.A.; Sadhukhan, J.; Anell, J.A. Sugarcane Bagasse Valorization Strategies for Bioethanol and Energy Production. Sugarcane Technol. Res. 2018. [Google Scholar] [CrossRef] [Green Version]
  38. Amezcua-Allieri, M.A.; Martínez-Hernández, E.; Anaya-Reza, O.; Magdaleno-Molina, M.; Melgarejo-Flores, L.A.; Palmerín-Ruiz, M.E.; Eguía-Lis, J.A.Z.; Rosas-Molina, A.; Enríquez-Poy, M.; Aburto, J. Techno-economic analysis and life cycle assessment for energy generation from sugarcane bagasse: Case study for a sugar mill in Mexico. Food Bioprod. Process. 2019, 118, 281–292. [Google Scholar] [CrossRef]
  39. Martinez-Hernandez, E.; Molina, M.M.; Flores, L.A.M.; Ruiz, M.E.P.; EguiaLis, J.A.Z.; Molina, A.R.; Aburto, J.; Amezcua-Allieri, M.A. Energy-water nexus strategies for the energetic valorization of orange peels based on techno-economic and environmental impact assessment. Food Bioprod. Process. 2019, 117, 380–387. [Google Scholar] [CrossRef]
  40. Pantaleo, A.; Candelise, C.; Bauen, A.; Shah, N. ESCO business models for biomass heating and CHP: Profitability of ESCO operations in Italy and key factors assessment. Renew. Sustain. Energy Rev. 2014, 30, 237–253. [Google Scholar] [CrossRef]
  41. Konieczna, A.; Roman, K.; Roman, M.; Śliwiński, D.; Roman, M. Energy Efficiency of Maize Production Technology: Evidence from Polish Farms. Energies 2020, 14, 170. [Google Scholar] [CrossRef]
  42. Wagner, W.; Pruss, A. Release of the IAPWS Formulation 1995 for the Thermodynamic Properties of Ordinary Water Substance for General and Scientific Use. J. Phys. Chem. Ref. Data 2002, 31, 387–535. [Google Scholar] [CrossRef] [Green Version]
  43. Puga Andrade, J.; Vazquez Frias, A. Ingeniería Básica Para la Producción de Tequila; Universidad Nacional Autonoma de Mexico: Mexico City, Mexico, 1998. [Google Scholar]
  44. Centro Mario Molina. Estrategia de sustentabilidad para la Cadena Productiva Agave Tequila; Mario Molina Center: Mexico City, Mexico, 2016. [Google Scholar]
  45. Gomez-Mora, J.M. Modelación del Procesamiento Agroindustrial del Café Desde la Fruta Hasta el Café Oro; Universidad de Costa Rica: San José, Costa Rica, 2019. [Google Scholar]
  46. Hernandez-Diaz, W.N.; Hernandez-Campos, F.J.; Vargas-Galarza, Z.; Rodriguez-Jimenes, G.C.; Garcia-Alvarado, M.A. Coffee Grain Rotary Drying Optimization. Rev. Mex. Ing. Quím. 2013, 12, 315–325. [Google Scholar]
  47. Pérez Ayala, M. Línea de Elaboración de Zumo de Naranja y Refrigerado de 6.000 L/h en Lorquí (Murcia); Universidad Politecnica de Cartagena: Cartagena, Spain, 2005. [Google Scholar]
  48. Barrera Naranjo, V. Proceso Industrial de Elaboración de zumo de Naranja; Universidad de Sevilla: Sevilla, Spain, 2015. [Google Scholar]
  49. Franco, A.; Velázquez, M. Una aproximación sociodemográfica al consumo de energía en los hogares mexicanos, 2014. In La Situación Demográfica México 2016, 1st ed.; Márquez Villeda, M., Ed.; CONAPO: Mexico City, Mexico, 2017; p. 24. [Google Scholar]
Figure 1. Overview of the models in IMP Bio2Energy® used for techno-economic assessment of biomass and bioenergy costs.
Energies 14 04181 g001
Figure 2. Screenshot of IMP Bio2Energy® software for the bioenergy module showing the flowsheet of the general CHP system simulated.
Energies 14 04181 g002
Figure 3. Overview of the main inputs and outputs in the agroindustrial processes for: (a) Tequila production, (b) coffee production and (c) orange juice production.
Energies 14 04181 g003
Figure 4. Biomass production cost vs biomass netback for orange peels, coffee pulp and agave bagasse.
Energies 14 04181 g004
Figure 5. Results of the bioenergy simulation module for: (a) Bioenergy production and (b) demand satisfaction of steam and electricity in the tequila, coffee and orange processes using agave bagasse, coffee pulp and orange peels, respectively.
Energies 14 04181 g005
Figure 6. Results of the Bioenergy economic assessment module for: (a) Cost of bioenergy production and (b) payback period (PBP) and internal rate of return (IRR) of the CHP systems using agave bagasse, coffee pulp and orange peels.
Energies 14 04181 g006
Figure 7. Sensitivity results for bioenergy cost of production, payback period (PBP) and biomass netback for agave bagasse (left column), coffee pulp (central column) and orange peels (right column).
Energies 14 04181 g007
Table 1. Agroindustrial operating parameters for agave, coffee and orange processing.
Agroindustry Value ChainTequilaCoffeeOrange
Main cropAgaveCoffeeOrange
Crop processing input (ton/year)19,50047,175366,000
Operating time (h/year)840072004652
Steam demand (ton/ton input)2.0870.680.125
Electricity demand (kWh/ton input)70.5129.6820.12
Main crop price ($US/ton)11002753125
Biomass generatedAgave bagasseCoffee pulpOrange peels
Biomass to CHP (ton/year)16,40919,33323,493
Table 2. Composition of agroindustrial biomass (agave bagasse, coffee pulp and orange peels).
ComponentAgave BagasseCoffee PulpOrange Peels
C17.5720.2128.89
H2.242.654.05
N0.791.170.38
S0.130.160.03
O23.4022.4423.13
Ash5.863.3713.51
Moisture50.0050.0030.00
Reference[35][35][39]
Table 3. Operation parameters for simulation of the biomass CHP systems.
ParameterValueUnit
Boiler steam pressure20bar
Boiler steam temperature212.4°C
Boiler air excess ratio50%
Flue gas exit temperature150°C
Air inlet temperature25°C
Water inlet temperature25°C
Turbine isentropic efficiency75%
Turbine mechanical efficiency90%
Turbine outlet pressure2bar
Outlet steam temperature120.2°C
Table 4. General economic evaluation parameters.
Economic ParameterAgroindustrial ProcessingBioenergyUnit
Labour costsTequila: 72,186
Coffee: 100,000O
range: 325,000
Agave bagasse: 35,414
Coffee pulp: 48,341
Orange peels: 85,575
US$/year
Working capital10-% of operating costs
Plant cost-EstimatedUS$
Project lifetime2020years
Maintenance00.5% of annual capital cost
Annual inflation rate33%
Biomass value as animal feed5-US$/ton
Grid electricity cost0.0858US$/kWh
Current steam cost14.87945US$/ton
Current fuel usedFuel oil-
Fuel price6US$/GJ
Table 5. Correlation parameters for the sensitivity results.
Independent Variable (x)Dependent Variable (y)EquationR2
Orange peels
Fuel priceNetbacky = 8.3486x + 3.04061
Fuel pricePBPy = 16.596x−0.8750.9993
Biomass inputNetbacky = 13.259ln(x) − 9.9590.9612
Biomass inputPBPy = 54.416x−0.5750.9895
Biomass inputUnit costy = 21.672x−0.4320.9935
Agave bagasse
Fuel priceNetbacky = 4.9725x + 1.29611
Fuel pricePBPy = 16.326x−0.8660.9988
Biomass inputNetbacky = 5.1375ln(x) + 10.9950.9785
Biomass inputPBPy = 27.052x−0.530.9974
Biomass inputUnit costy = 12.369x−0.3970.9959
Coffee pulp
Fuel priceNetbacky = 4.6086x + 1.90111
Fuel pricePBPy = 17.459x−0.8290.999
Biomass inputNetbacky = 7.0032ln(x) − 0.01850.9716
Biomass inputPBPy = 42.304x−0.5620.9863
Biomass inputUnit costy = 15.11x−0.420.9912
Publisher’s Note: MDPI stays neutral with regard to jurisdictional claims in published maps and institutional affiliations.

