
AC vs. DC Distribution Efficiency: Are We on the Right Path?
by
 , , ,
, , ,
Hasan Erteza Gelani
1,* ,
,
Faizan Dastgeer
1,
Mashood Nasir
2,* ,
,
Sidra Khan
3 and
Josep M. Guerrero
2
1
Department of Electrical Engineering, University of Engineering and Technology Lahore, FSD Campus, Faisalabad 38000, Pakistan
2
Energy Technology Department, Aalborg University, 9220 Aalborg, Denmark
3
Department of Electrical Engineering, Comsats Institute of Information Technology (CIIT), Lahore 54000, Pakistan
*
Authors to whom correspondence should be addressed.
Energies 2021, 14(13), 4039; https://doi.org/10.3390/en14134039
Submission received: 22 May 2021
/
Revised: 26 June 2021
/
Accepted: 29 June 2021
/
Published: 4 July 2021
(This article belongs to the Collection Featured Papers in Electrical Power and Energy System)
Abstract
:The concept of DC power distribution has gained interest within the research community in the past years, especially due to the rapid prevalence of solar PVs as a tool for distributed generation in DC microgrids. Various efficiency analyses have been presented for the DC distribution paradigm, in comparison to the AC counterpart, considering a variety of scenarios. However, even after a number of such comparative efficiency studies, there seems to be a disparity in the results of research efforts, wherein a definite verdict is still unavailable. Is DC distribution a more efficient choice as compared to the conventional AC system? A final verdict is absent primarily due to conflicting results. In this regard, system modeling and the assumptions made in different studies play a significant role in affecting the results of the study. The current paper is an attempt to critically observe the modeling and assumptions used in the efficiency studies related to the DC distribution system. Several research efforts are analyzed for their approach toward the system upon which they have performed efficiency studies. Subsequently, the paper proposes a model that may alleviate the shortcomings in earlier research efforts and be able to give a definite verdict regarding the comparative efficiency of DC and AC networks for residential power distribution.
1. Introduction
The first power system designed and operated ever in the history of electricity was DC in nature. Soon after, AC replaced DC as a result of the invention of transformers, whereas DC had no means of transforming voltage levels at the time. It was then that the “battle of currents” initiated. AC enjoyed supremacy over DC and ruled in all areas of power: generation, transmission, distribution, and utilization. The era of AC’s rule remained for a long time; however, with the advancement in the field of power electronics, the only variable, “voltage transformation”, that kept AC’s equation stronger than DC, also originated in DC’s equation. This was the time when DC started to strike back, and the “battle of currents” reignited. DC started proving itself in the fields of generation through solar and fuel cells, transmission through the construction of HVDC transmission over long distances, and utilization through the adoption of DC loads, e.g., computers, laptops, and LED lights. Distribution is the field that is still in the research phase and demands a definite verdict of whether DC is better than AC or not and, if so, whether the model forming the base of comparison is authentic enough to provide this definite verdict.
Several studies have been presented in the past regarding the feasibility of DC at the distribution level, as well as an efficiency comparison of AC and DC distribution systems. The localities targeted by researchers were mainly residential, commercial, and data centers. The main focus of most studies was, however, residential and commercial sectors. The authors of [1] presented the feasibility of DC at the distribution level for a residential colony considering daily load variation, and they concluded that there was reduced efficiency of the system during the night as a result of lower converter efficiencies. The authors of [2] compared conversion efficiencies of residential loads when powered with AC and DC. They found 3% less electricity consumption when appliances were powered with DC. The authors of [3] showed that AC and DC distribution networks can be equally beneficial when equal AC and DC loads are present in a building. In [4], the authors claimed that making direct use of DC by assuming all DC loads can yield 5% energy savings of total home electricity usage. Furthermore, ref. [5] showed comparable efficiencies, differing by a factor of 1%, of AC and DC distribution systems even when variable speed drive (VSD) loads were considered as DC loads in a modern home. The studies presented so far have primarily focused on establishing the feasibility of DC systems and comparing the proposed DC systems with the conventional AC system on the basis of energy savings. For the purpose, the authors have (1) proposed various network schemes e.g., AC/DC systems with/without distributed generation, (2) assumed different load models, e.g., actual or averaged loads and single or multiple category loads, and (3) considered multiple technical parameters such as fixed or varying converter efficiencies, direct DC appliances or DC internal appliances, and 48 V DC or 326 V DC.
In the end, all authors presented a quantitative comparison, i.e., whether AC or DC distribution was better by a certain percentage or value. A question arises here with regard to whether the proposed model in a specific study is valid enough to give the conclusive verdict that one is better than the other. This question forms the base of the current study.
This current research effort critically reviews the research efforts presenting the efficiency analysis of DC distribution systems alone or in comparison with AC distribution systems. This paper highlights the loopholes in the present body of knowledge by considering the employment of various parameters that affect distribution system efficiency. This paper then presents the employment of these parameters in a fashion that can present a comparative efficiency analysis of AC and DC distribution systems in a true sense.
The research presented in this paper has two parts. First, a critical analysis of the models shown in the previous studies is performed on the basis of the employment of significant parameters affecting the efficiency analysis. The selection of the parameters was established as a result of in-depth analysis of a number of research efforts that explicitly cognate with efficiency analysis of DC or comparative efficiency analysis of AC–DC distribution systems. The authors possess vast experience in the related field and, after performing various theoretical and experimental analyses, they sorted the most significant parameters and, in turn, the research efforts encompassing these parameters.
Second, the current effort highlights the true employment of the parameters in a model that has the ability to produce a realistic and definite comparison of AC and DC distribution. Moreover, an effort is made to encompass futuristic scenarios with regard to the utilization of these parameters in the AC–DC efficiency analyses considering the technological advancements.
2. Critique of Various Parameters of AC–DC Distribution System Efficiency
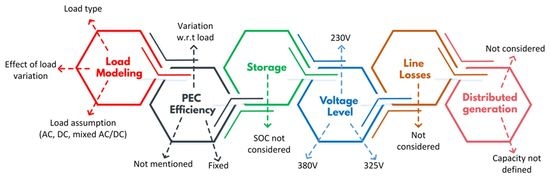
The significant parameters that affect the comparative efficiency analysis of AC and DC distribution systems include load modeling, power electronic converter (PEC) efficiency, storage, line losses, voltage level, and distributed generation. This section provides a critical review of the employment of the stated parameters in the research efforts specifically related to the efficiency of AC–DC distribution systems. Load modeling or architecture is a broad term. It encompasses the types of loads selected for the analysis, e.g., AC, DC, or mixed AC–DC, high power loads or low power loads, the load variation with time of the day, and the load division among AC and DC. Load modeling can be regarded as one of the most influential parameters in the efficiency analysis. The efficiency of PECs stands in line with load modeling with regard to its significance in determining the efficiency of distribution systems, because the efficiency of PECs varies with the loading. Line losses and voltage level are interrelated. At distribution scale, the line losses are comparable for AC and DC distribution systems; however, to account for the factor of fairness, line losses should be given due consideration. Distributed generation and storage are also interrelated; the reason for considering these parameters lies in the fact that these relieve the grid from continuous supply, thereby affecting the efficiency of the distribution systems.
2.1. Critical Review of Load Models Presented in the Past
Load models are important to discuss as they form the base of the analyses of DC distribution efficiency, as well as the comparison of AC and DC distribution systems. The targeted localities are mostly residential and commercial; however, a few data center facilities have also been analyzed on the basis of load modeling. The models have been discussed on the basis of load types, i.e., AC or DC, consideration of the effect of load variations, a variety of loads/appliances considered, and the proportion of load type in a model (e.g., half AC and half DC loads).
The authors of [1] presented a residential model comprising averaged loads. The term “averaged loads” refers to the power consumption of loads averaged over a specific period of time. The authors claimed that the load variation effect was considered, but the load profile considered in the study was for only three periods of the day rather than a continuous load profile. The author of [2] presented a comparative analysis of AC and DC distribution systems for a residential locality. The residential data taken under consideration were again averaged, similar to [1], but the load variation effect was not considered. A strong major assumption was made that each AC load in a residence has a DC counterpart, making the model under consideration completely DC.
The work presented in [3] was another attempt at the evaluation of efficiency comparison of residential distribution systems. Unlike the research efforts in [1,2], where appliances installed in a residence were considered, ref. [3] assumed buildings as individual loads; therefore, the study did not present any idea of proper appliance distribution among AC or DC. The research work of [4] was another study making the same strong assumption as [2] regarding load modeling, i.e., that all loads in the system were DC. Even in the case of the AC system, the loads were internally DC. The effect of load variation was considered but only for two levels, i.e., part load and full load, where the part load was 20% of the full load.
Similar to [1,2,3,4], an average load model was presented in [5]. The authors adopted the same mechanism of load division among AC, DC, and independent categories, as presented in [1]. However, a slight difference is that certain AC loads employing variable speed drives were considered internally DC. The model of [5] for the AC distribution case is presented in Figure 1. The authors did not present the effect of load variation as compared to [1].
The model of [6] was similar to that of [1] with assumptions based on load categorization. As in [2,5], the effect of load variation was not considered in the study, and the average load model was considered. The work of [7] further reduced the model of a home to kitchen appliances. The scope of the work was quite limited because only kitchen appliances with an assumption of all DC internal loads cannot describe a valid comparison of AC or DC distribution systems.
The work presented in [8] is somewhat unique as it considered a data center facility for modeling. The comparison of AC and DC distribution systems was established assuming highly efficient DC loads, whose commercial availability is indeed an issue. The work presented in [9] is another unique case, whereby the loads were arbitrarily distributed among different voltage levels, i.e., 48% loads were assumed to operate on 325 V, another set of 48% loads were assumed to operate on 230 V DC, and the remaining 4% were assumed to operate on 20 V. However, there was some similarity with [2,4] in that all loads were assumed to be DC.
The authors of [10] proposed an office model with equal 300 W loads throughout, i.e., in the AC, the DC, and the mixed AC–DC networks. Although this study presented a comparison of three scenarios, the load model assumption weakened the overall worth of the study. This work was not a reflection of a realistic model of a locality because of the constant power consumption of all the loads. Another research effort concerning the data center was presented in [11]. As compared to [8], it presented a generalized DC microgrid model, with no significant explanation of load modeling.
The model presented in [12] considered selective office loads. The load division among AC and DC was also arbitrary, quite similar to [1,5]. The scheme employed for lighting was almost similar to [10], whereby lights were assumed as AC in nature in the AC system and DC in nature in the DC system. The study was a straightforward comparison of two systems considering five loads and did not present a variety of scenarios. The work presented in [13] presented an averaged load interface, where all the loads were averaged to produce a single interface, which was DC in nature for both AC and DC distribution networks. Furthermore, the study was based on a futuristic approach as the loads were taken from a reference considering forecasted data of the year 2020.
The authors of [14] compared AC and DC distribution networks on the basis of lighting load only. Furthermore, lights were assumed to be DC in both AC and DC distribution networks. Selection of a single load and its further assumption as being purely DC weakened the model for a comparative analysis of AC and DC distribution systems. The model presented in [14] driving LED loads is presented in Figure 2.
The work of [15] was somewhat related to the work presented [3] with regard to a fixed ratio of AC and DC loads, whereas [16] focused on the model of a commercial facility. Office loads were considered but the selection of loads seemed inclined toward kitchen appliances. This made it an office analogue of the work presented in [7], where kitchen loads were considered in a residence.
The load division presented in [17] was quite similar to [1,5,6], where loads were arbitrarily distributed among AC–DC categories. All lights were assumed DC in [1,5,7], whereas, in [17], all lights were considered AC. Furthermore, constant loads were considered in the study; thus, the effect of load variation is not considered. The authors of [18,19] presented similar load models; the scope of the work was limited, similar to [7], as only two loads (lamp and motor) were considered in the model. The authors of [20] made the same assumption as [14] regarding load and its type, i.e., only lighting load was considered in the study, assuming the whole lighting system as DC-based. It was further assumed that all the lights were switched on at 6:00 a.m. and off at 8:00 p.m. Hence, the actual effect of load variation was not considered. The paper lacked a comprehensive comparative analysis between AC and DC distribution systems, as a single model was divided into two subsets, i.e., AC and DC.
In [21], selective office loads were considered in quite a similar fashion to that presented in [12,16]. The complete analysis was performed on four load types, i.e., electric hybrid vehicle (EHV), information technology (IT), lighting, and heating, ventilation, and air-conditioning (HVAC). The authors of [22] presented a variety of scenarios, and the study can be considered futuristically concrete regarding the efficiency analysis of AC and DC distribution systems. The study aimed at office models and assumed all loads to be DC, as assumed by the authors of [13,20]. The loads were classified as ‘native DC’ (loads which require a rectifier in the AC system) and ‘direct DC’ (loads which are connected to the DC system directly or via a DC–DC converter).
The model did not present the effect of a variety of loads, i.e., the targeted loads were HVAC (which was assumed as a 24 A packaged unit), lights (assumed to be operating at constant 75% of rated power), computers, laptops, and power over Ethernet (PoE).
The importance of [23] was equivalent to [22] as it presented various scenarios and discussed the comparison of AC and DC distribution systems considering seven different topologies and five load classes (refrigeration, AC motor, electric vehicle, resistance heating, and other). Certain assumptions within the topologies, however, made the study unrealistic or futuristic. For instance, in five architectures, AC motors were considered to be replaced by brushless DC motors. Moreover, for each appliance class assumed to be served by DC, a new profile was established as a function of the “proposed” power supply and new end-use efficiencies. In some topologies, a load class was further divided on the basis of an unknown criterion into AC-operated and DC-operated, e.g., refrigeration was divided into “BLDC-based” and “other refrigeration”.
Similarly, ref. [24] assumed all the loads as internally DC, similar to the assumption made in [4,7,22]. Similar to [7,12], the work did not provide a comprehensive study, as only a specific set of loads were considered in a residential model. In comparison to [24], ref. [25] considered even fewer loads for the study. Only lighting, elevator, and “other” loads were considered in the study.
Summarizing the above discussion regarding the assumptions and gaps in the consideration of load models for a definite efficiency comparison of AC and DC distribution networks, it can be concluded that each study made unrealistic or futuristic assumptions in the model considered.
The common assumptions included models comprising DC loads only [2,4,8,9,13,14,18,19,20,21,22,23], a fixed proportion of AC and DC loads [3,15], consideration of a single or small set of loads for analysis [7,12,18,19,20,21], uneven or arbitrary distribution of loads among various classes [1,5,6,23], and neglection of the actual effect of load variation [2,5,6,17,18,19,24,25]. In contrast, a realistic load model considering a variety of loads with actual load profile and appliances divided into AC and DC classes without assumptions of being internally DC or direct DC would be the best fit for a definite comparative analysis of AC and DC distribution system efficiency. Figure 3 presents a summary of the gaps/loopholes in the load models presented in various studies.
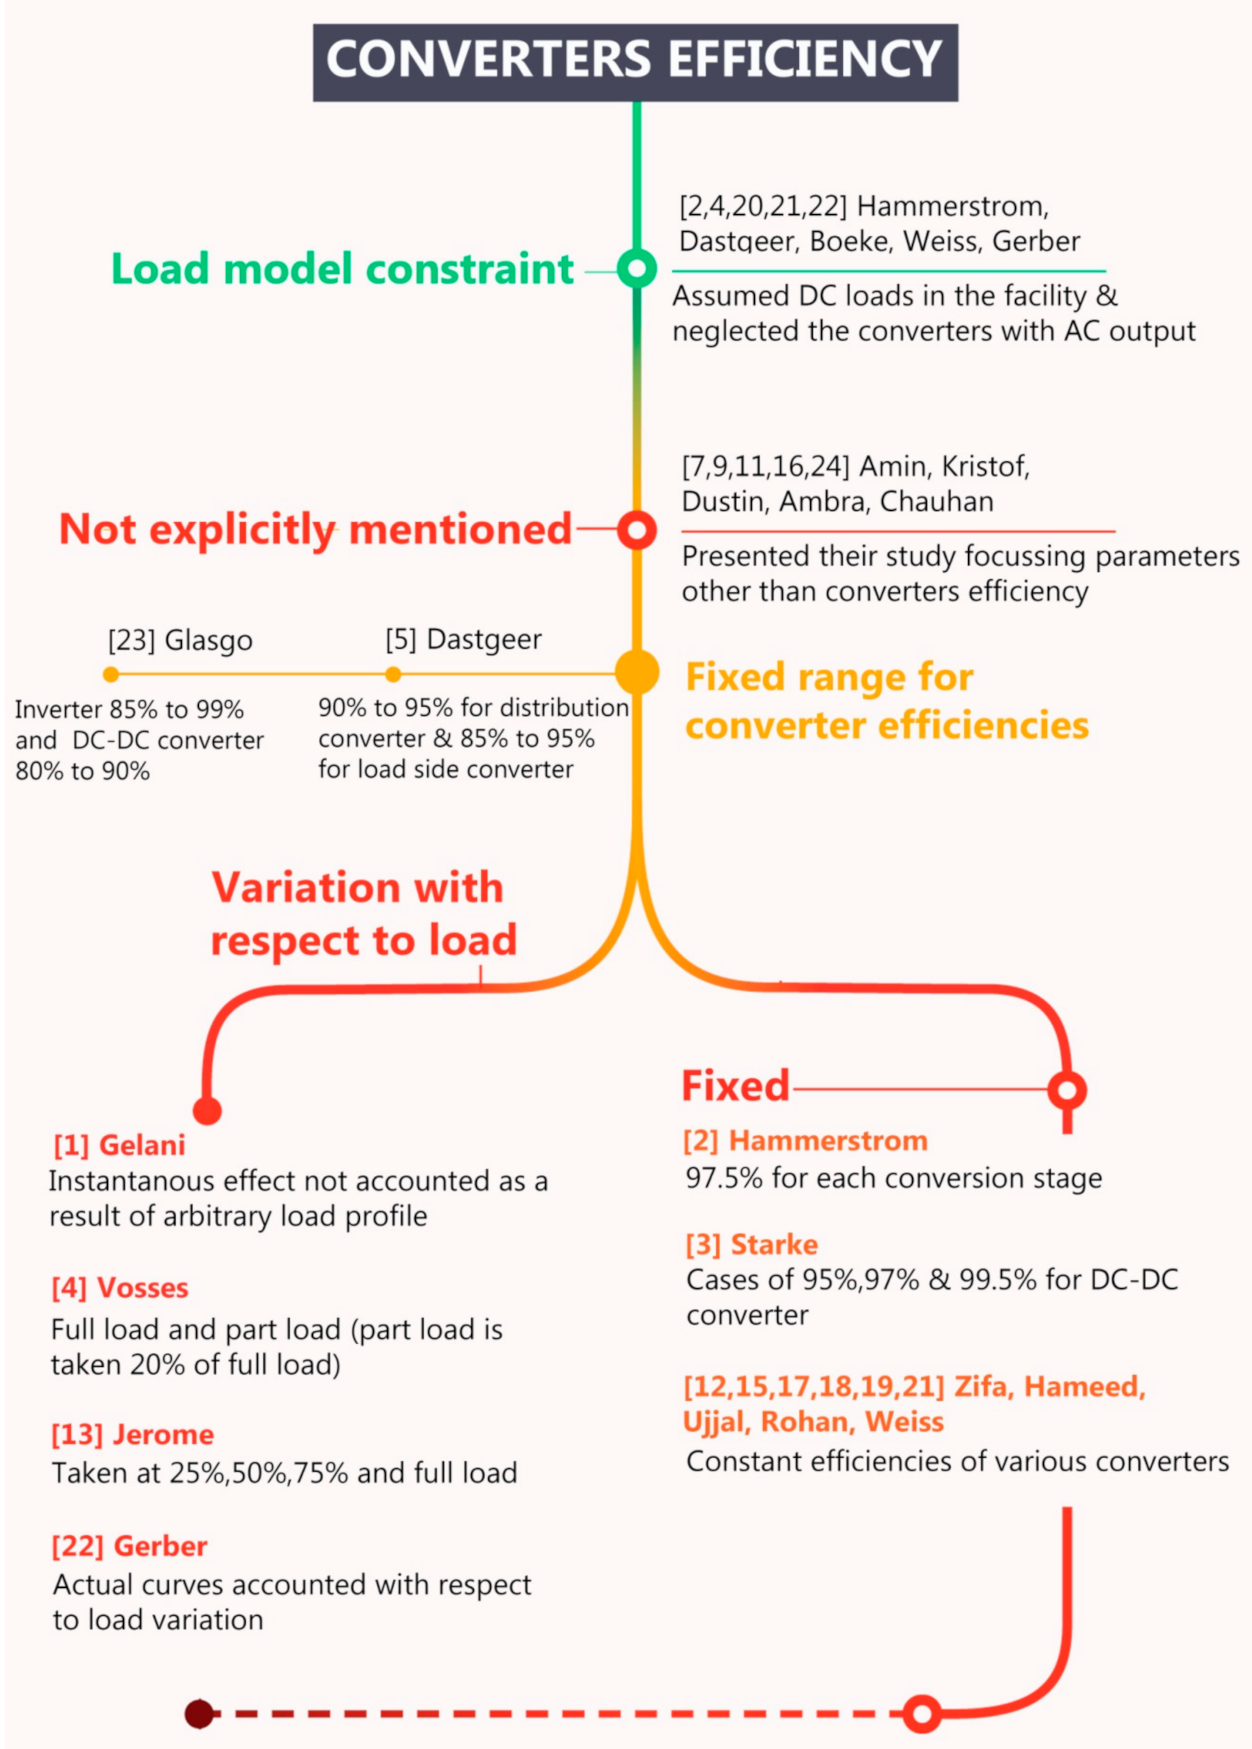
2.2. Critical Review of the Consideration of PEC Efficiency
Converters are employed for power conversion, from AC to DC and vice versa, as well as voltage transformation, in distribution systems. The revival of DC in power systems is linked to the development of PEC, capable of replacing conventional transformers. The losses exhibited by converters contribute the most to the overall facility’s electrical loss. Therefore, converters hold a strong position in defining the efficiency of AC and DC distribution systems. Generally, the efficiency of converters varies with the loading. Since the operation of appliances or loads in a facility is a randomly varying process, the efficiency of the associated converters changes accordingly. A few authors have tried to accommodate the effect of varying efficiency of the converters against loading such as [1,4,13,22]. The authors of [1] divided the whole day into three arbitrary periods: ‘Night (12:00–06:00 a.m.)’, ‘Day1 (6:00 a.m.–3:00 p.m.)’, and ‘Day2 (3:00 p.m.–12:00 a.m.)’. The effect of instantaneous load variation throughout the day was not taken into account, thereby weakening the overall consideration of the effect of variation in converter efficiencies.
The work presented in [4] considered two values: full load and part load (part load was taken as 20% of the full load) for defining converter efficiency variation with respect to load. The efficiency of converters operating between 20% loading and 100% loading was assigned a full load efficiency value, and the efficiency of converters operating at less than 20% loading was assigned a part load efficiency value. The selection of 20% loading as a boundary of part load and full load raises the question of whether a small value of load above 20% is equivalent to full load. In contrast to the two values presented in [4], the work presented in [13] accounted for converter efficiencies at four loading levels, i.e., 25%, 50%, 75%, and full load. A formula was presented in the study assuming three sources of PEC losses: constant losses , switching losses , and conduction losses . Switching and conduction losses are linear and quadratic in relation to the output power of the PEC, respectively. In order to compute the three coefficients, Equation (1) can be utilized.
where ),), and ) are three arbitrary points taken on the loading versus efficiency curve of PEC, and ‘’ and ‘’ denote loading and efficiency, respectively. The efficiency of the PEC is given by Equation (2).
The study of [22] can be regarded as better than [1,4,13] in the sense that the efficiency curves of the converters were devised on the basis of data from commercially available converters.
As compared to the aforementioned research efforts, which tried to account for the effect of variation in PEC efficiency with respect to load variation, the authors of [5,23] defined a fixed range of values representing converter efficiencies. In [5], the converters were divided into two categories, i.e., distribution side (at primary distribution voltage level) and load side (at residential voltage level). While the efficiency of one set was kept fixed, the other was varied in discrete steps within a fixed range and vice versa. On the other hand, in [23], the range of converter efficiency was not discrete as compared to [5]. However, both [5,23] presented an unrealistic selection of ranges because the converter range could not accommodate the efficiency of any converter below 80%. In reality, however, converters may operate below 50% efficiency when the loads driven through them are operated at lesser power with respect to rating.
Following on from the consideration of PEC efficiency with respect to load variation to considering PEC efficiency within a fixed range, there are certain studies which considered fixed efficiency of PEC, e.g., the authors of [2,3,12,15,17,18,19,21] assumed fixed efficiency of the converters in the efficiency analysis of distribution systems. The study in [2] assumed fixed loss associated with each conversion stage, i.e., 2.5%, and did not consider the effect of converter efficiency variation. In [3], the efficiency analysis of the distribution systems was again performed on different fixed conversion efficiencies such as 95%, 97%, and 99.5% for DC–DC converters. The authors themselves claimed that a PEC with 99.5% efficiency is rare with regard to availability. Lastly, some studies did not consider the role of converters in their model, e.g., ref. [7,9,11,16,24].
These studies based the comparison of AC and DC distribution systems on parameters other than converter efficiencies, e.g., line losses and voltage drops. The authors of [7,16] presented a comparative analysis of AC and DC distribution systems based on power losses and voltage drops, without considering the efficiency of the converters. The authors of [9] highlighted the requirement of efficient converters, particularly at partial loading, but did not actually account for the efficiency of the converters in any of the topologies presented in their study.
In addition to the categories of studies presented above with regard to the consideration of PEC efficiency, it is important to point out the basic reason for the installation for converters, i.e., power conversion or voltage transformation. The selection of loads in a model is highly related to converters, e.g., a load model with only AC loads eliminates DC–DC and AC–DC converters in the DC distribution system. As pointed out earlier for the cases presented in [21,22], there were a few instances where converters were neglected as a result of unrealistic/futuristic load assumptions, e.g., the models of [2,4,20], as mentioned in the load modeling section.
Figure 4 demonstrates the consideration of converter efficiency in various studies. Critically summarizing the discussion presented in this section, there is no doubt that converters have a strong influence on the efficiency of distribution systems. Considering fixed converter efficiencies is better than neglecting the effect of converters; similarly, considering the variation in converter efficiencies with loading is far better than employing fixed converter efficiencies in the analysis. Moreover, there are constraints associated with the consideration of the actual role of converters, e.g., in certain cases, a statement was established that devices which require an internal rectifier stage can directly operate on DC-based distribution, or that VSD-based loads (which require two conversions i.e., AC–DC and DC–AC in AC distribution systems) can be operated on DC via single conversion, i.e., DC–AC. Both these statements are true but bounded by a constraint, in that the DC input voltage demand of the loads matches the available DC supply voltage level.
2.3. Review of the Consideration of Storage Elements in AC and DC Distribution Studies
The basic aim of storage items in the conventional AC system was to provide an uninterruptible supply of power for sensitive loads. However, with the advancement in the field of distributed generation, storage has gained a notable position in distribution systems.
Generally, the parameters associated with battery are state of charge (SOC), rating/size, and efficiency. Installing a battery in a distribution network without considering any of these parameters would not be a recommended practice from an engineering point of view. The study of the effect of a battery on the efficiency analysis of AC and DC distribution systems cannot be regarded as a complete study without incorporating the stated battery parameters. Various authors considered batteries in different fashion in their respective studies, such as the author of [2], who stated the presence of a battery in the system but considered neither the associated losses nor the rating of the battery, and the authors of [7], who considered a battery for sensitive loads only, without providing any associated value for losses or rating. In contrast, completely neglecting the battery in the system would lead to an even more incomplete study of AC and DC distribution systems, such as the authors of [1,3,5,20], who did not install a battery or any storage item in the distribution system models.
A few authors [4,5,22] considered the parameters associated with the battery. The study presented in [4] provided criteria for battery sizing and then employed a 10 kWh battery in the system. The losses associated with the battery were also taken into account by assuming a 90% (one-way) efficiency of the battery. The authors of [22] considered battery losses by accounting for 90% (one-way) and 81% (round-trip) efficiencies. They also defined a battery charging algorithm as a function of excess solar power available, given by Equation (3).
where ‘’ is the hourly excess solar power, ‘’ is the total solar generation, and ‘’ is the total load demand. The controller charges the battery when and discharges when . The authors of [25] employed a 500 A·h battery assuming that utility power is only available during the night (for a few hours).
To summarize, apart from certain studies that did not incorporate a battery in their power distribution models, a variety of studies installed a battery. However, installing a battery in a system does not make a system capable enough to define the effect of storage in the efficiency analysis of AC and DC distribution systems. The state of charge (SOC) of the battery varies throughout the day while the battery is charging or discharging, as well as while it is in an idle state. The appropriate sizing of the battery holds concrete importance from a realistic point of view. Performing an efficiency analysis of AC and DC distribution systems by installing a battery without considering its losses and SOC variation or making an assumption for battery sizing, such as utility power being available for a few hours during night, raises the question of whether such an efficiency analysis of AC and DC distribution systems is valid enough to give a definite verdict that AC is better than DC or vice versa at the distribution level. Hence, appropriate sizing and consideration of losses associated with the battery are necessary for defining a realistic efficiency analysis of AC and DC distribution systems.
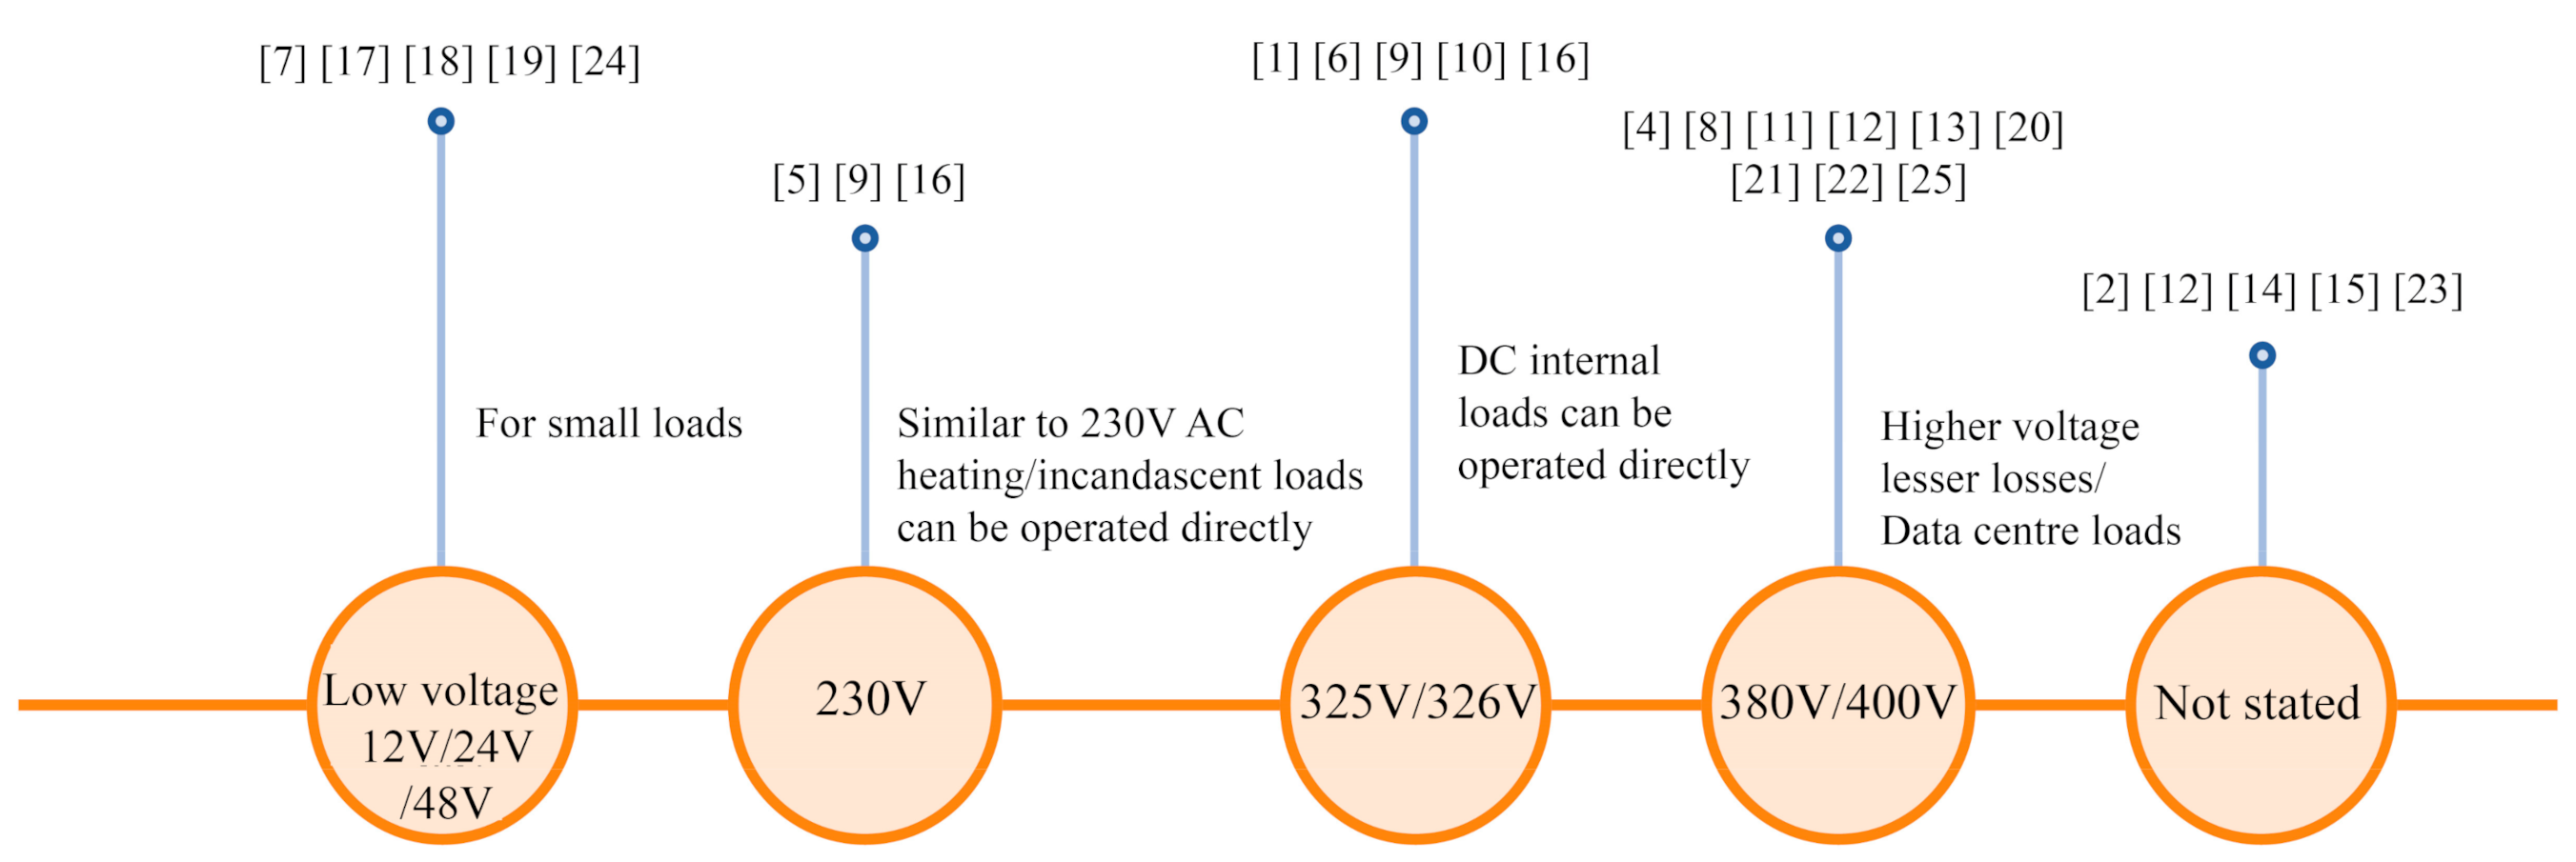
2.4. The Choice of Voltage Level in DC Distribution Efficiency Analyses
In order to compare the AC distribution network to the DC distribution network, the choice of appropriate voltage level is very important because line losses, voltage drops, and appropriate converter selection all depend on voltage level considered. AC distribution networks conventionally had almost fixed operating voltage levels in various studies, e.g., 230 V (RMS) was used in most studies in AC distribution system modeling. However, the case of DC distribution is both complex and confusing. It is complex in the sense that some studies used various voltage levels within a single facility, whereas it is confusing in the sense that the voltage level to be employed should be authentic enough to compare AC and DC distribution networks.
The availability of a particular voltage level depends on the load demand. Electronics and other small loads usually operate in the range of 12 V to 48 V. In order to drive such loads, the authors of various studies provided the respective voltage level according to load demand, e.g., ref. [7,17,24]. However, such a small voltage cannot be employed to drive high-power loads which contribute to a major portion of overall power consumption in a facility. In order to fulfill the voltage requirement of high-power loads, authors from various studies proposed 230 V, 325 V, 326 V, 380 V, or 400 V in their distribution system models. An important study in this regard was presented by the authors of [16], in which different voltage levels (326 V, 230 V, 120 V, and 48 V) were compared, and 326 V was declared most suitable from a technical and economic standpoint.
Some authors employed a particular voltage level in their respective models in the efficiency analysis of AC and DC distribution systems. The authors of [5] used 230 V in their model, in an attempt to make a fair comparison of AC and DC distribution systems, since the AC voltage level is 230 V. The authors of [1,6,10] employed 325 V in their study due to 325 V being the peak value of 230 V. With 325 V, the same conductor as AC can be employed for power flow in the DC distribution system, and loads that require a rectifier stage in the AC distribution network can be directly operated on 325 V in the DC distribution network.
On the other hand, 380 V was the choice of some authors [4,11,13,20,21,22]. The basic reason for employing 380 V in a DC distribution system is that the losses in the system are highly dependent upon the chosen voltage level. When considering 380 V in the system, the losses in the DC distribution system are minimized as compared to a DC distribution system operated with lesser voltage levels.
Claims of a particular level chosen to drive DC internal loads or a factor of fairness in the comparative analysis are not strong enough to standardize a particular voltage level for the analysis of AC and DC distribution systems. Physical factors such as conductor size and converter size are associated with the voltage level. The commercial availability of loads rated on a particular voltage level is a strong factor. Employing a specific voltage level does not mean that the load demand of the appliances matches that voltage level. Figure 5 presents the different voltage levels utilized by authors of various studies for DC systems.
2.5. Consideration of Line Losses in the Past AC/DC Distribution Efficiency Studies
Predominantly, it was the factor of line losses that supported DC in the sector of power transmission, whereby HVDC transmission gained importance over HVAC transmission. Some authors did not consider line losses when performing the efficiency comparison of AC and DC distribution systems [4,6,25]. They assumed that line losses in both AC and DC systems are comparable; therefore, they did not account for the conductor losses in the study. On the contrary, some authors included line losses in their study [1,5,10]. However, the line lengths were arbitrarily taken. In this context, ref. [16] can be regarded as a better study as the authors calculated voltage drop and power loss occurring in each conductor of an actual office network.
The authors of [17] derived an expression for comparing AC and DC distribution line losses, given by Equation (4).
where ‘’ represents DC distribution system line losses, ‘’ represent AC distribution system line losses, and ‘’ is the square of the power factor.
The consideration of line losses is important. Although there is not much difference in the line losses of AC and DC distribution systems, ignoring smaller factors may affect the overall results. The authors of [13] concluded that the power loss in conductors is equal to 1.08% and 0.32% for AC and DC distribution systems, respectively. Similarly, the authors of [20] also presented the power loss occurring in the conductors as being equal to 0.43% and 1.2% for DC and AC distribution systems, respectively. The difference in the losses for AC and DC systems is not much, but it can be a decisive factor when the efficiency of AC and DC distribution systems is equal considering factors other than line losses.
2.6. Employment of Distributed Generation in AC/DC Distribution Efficiency Studies
Distributed generation (DG) is an important factor that has helped DC, in comparison to AC, to form its influence on the power system at the distribution level. As presented in the introductory section of the paper, renewable energy resources, particularly solar, produce DC as their output. However, in residential and commercial facilities, solar PV has gained enough importance because of its easy installation and negligible maintenance [26,27,28,29]. This is the reason why studies focusing on the feasibility of DC or the comparison of AC and DC at the distribution level employed solar PV in their models. This section explores the studies regarding distributed generation, i.e., whether distributed generation was presented in the study and, if yes, how distributed generation was modeled in the network so as to consider its effect on the overall system.
Various authors utilized solar as a source of DG in their studies. There are certain factors linked to solar-based DG, which were incorporated by a few authors to some extent, whereas some authors neglected those factors while performing the efficiency analysis of AC and DC distribution systems. The output of solar-based DG varies throughout the day. Furthermore, the efficiency of the converters employed with solar, for voltage transformation to DC or power conversion to AC, varies with the output power of the converter. Another important factor associated with solar-based DG is the size/capacity of the system.
The variation of solar output with respect to time was considered by the authors of [4,13]; however, the authors did not account for the variation in the efficiency of the converters with output power. The authors of [14] presented a PV energy efficiency metric called PV utilization fraction (PVUF), which defines the usefulness of PV energy i.e., the fraction of PV energy that is delivered to the load or grid.
The numerator of Equation (5) includes useful PV energy, i.e., energy delivered to the load ‘’ and energy exported to the grid ‘’ when PV generation exceeds the load, plus the portion of PV energy supplied to the load when loads exceed the PV generation. The PVUF is an annual metric in which ‘’ is an arbitrary time period in a set of time periods that span the entire year. The time periods are separated by duration ‘Δt’ and, within each time period ‘t’, the system is assumed to operate at steady-state energy ‘Eat’, ‘Ebt’, and so forth. The denominator sums the overall PV generation.
The authors of [22] performed an efficiency comparison of AC and DC distribution systems for various solar capacities.
A proper efficiency analysis of AC and DC distribution systems demands the consideration of all the factors associated with DG that directly or indirectly affect the efficiency of distribution systems. It is important to note that several authors did not consider DG in their studies [1,2,3,5,7,8,9,10,11,12,17]. In comparison, authors who considered DG in their study did not account for all the factors linked to DG. Ignoring DG completely or neglecting some factors associated with DG that may affect the overall efficiency of the distribution systems cannot present a definite or complete study of the efficiency of distribution systems. Considering one or two factors of DG and employing those in the study can definitely produce an efficiency comparison of the AC and DC distribution systems, but the results may not be definite. Hence, there is a need to consider all significant factors associated with DG that may affect the efficiency of AC and DC distribution systems.
3. An Approach to a Definite AC/DC Distribution System
Since we are interested in presenting a load model that can give a definite verdict of whether AC is better than DC at the distribution level, we need to consider the advancement in load models as a result of advancement in technology. Considering the load model, the major loads that consume most of the total power in a facility are based on motors, e.g., cooling, refrigeration, and cleaning [30,31,32,33]. Incorporating the current scenario, i.e., the trend toward VSD and the futuristic replacement of induction motor-based appliances with BLDC motors, the load model can be broadly classified into three groups:
- Conventional/classical,
- Shifting trend,
- Futuristic.
In the conventional load model, the loads are classified into AC and DC according to their existence in current systems. The loads that are inherently AC and those that are inherently DC fall into the AC and DC categories, respectively.
Computers, laptop/mobile phone chargers, LED lights, and electronics are all classified as DC loads. Induction motor-based compressors, i.e., cooling, refrigeration, and wet cleaning, as well as incandescent lights, are classified as AC loads. With the advancement in the field of power electronics, there is a shift toward VSD-based induction motor appliances for cooling, heating, and refrigeration [30,34,35]. As compared to the conventionally employed fixed-speed induction appliances, VSD-based appliances operate with reduced losses, thereby providing better operating efficiency [35,36,37,38,39,40,41]. The world has witnessed this shift from classical fixed-speed systems to VSD-based systems, and several countries have installed VSD-based cooling, heating, and refrigeration in both residential and commercial facilities. In the classical load model, VSD-based loads operate via the double-conversion stage. The incoming AC is converted to DC, which is then converted to variable-frequency AC in order to provide variable-speed control of the motor [41,42]. It is important to note that, in a DC system, this may be achieved via a single-conversion stage provided the incoming DC voltage level matches the DC voltage rating of the appliance.
Another shift in the load model can be observed in the case of LED-based lighting and LED-based television sets. The reason is the same as VSD, whereby the power consumption of LED lights and LED television sets is less compared to classical incandescent lights and television sets. Both require a driver (AC–DC converter) when operated in an AC distribution system.
The futuristic load model is based on the complete replacement of major loads, i.e., cooling, heating, cleaning, and refrigeration, with DC counterparts. The purpose or function performed by all major loads in the futuristic load model may be the same, but their most significant component, i.e., the induction motor, would be replaced by a BLDC permanent motor. BLDC motors are capable of providing energy savings as compared to standard induction motors, as shown in Figure 6.
Loads continuously switch on and off according to their requirement throughout the day [43,44,45,46]. Furthermore, while the loads are on, their power consumption may vary, e.g., automatic dimming of lights. The power consumption of loads with respect to time is expressed as a load profile. Most loads are used on a daily basis, e.g., lights, computers, refrigerators, and cleaning. However, some loads are utilized on a seasonal basis, e.g., heating loads during winter and air-conditioning loads during summer. Moreover, the load profile is somewhat different on weekends than on weekdays. Therefore, a complete model necessitates the consideration of the instantaneous and seasonal power consumption of all loads as a function of weekdays and weekends. Hence, it is proposed to consider the instantaneous power consumption of the loads on a bimonthly basis (i.e., on weekdays and weekends). The same strategy holds for the load models representing a shifting trend and futuristic modeling.
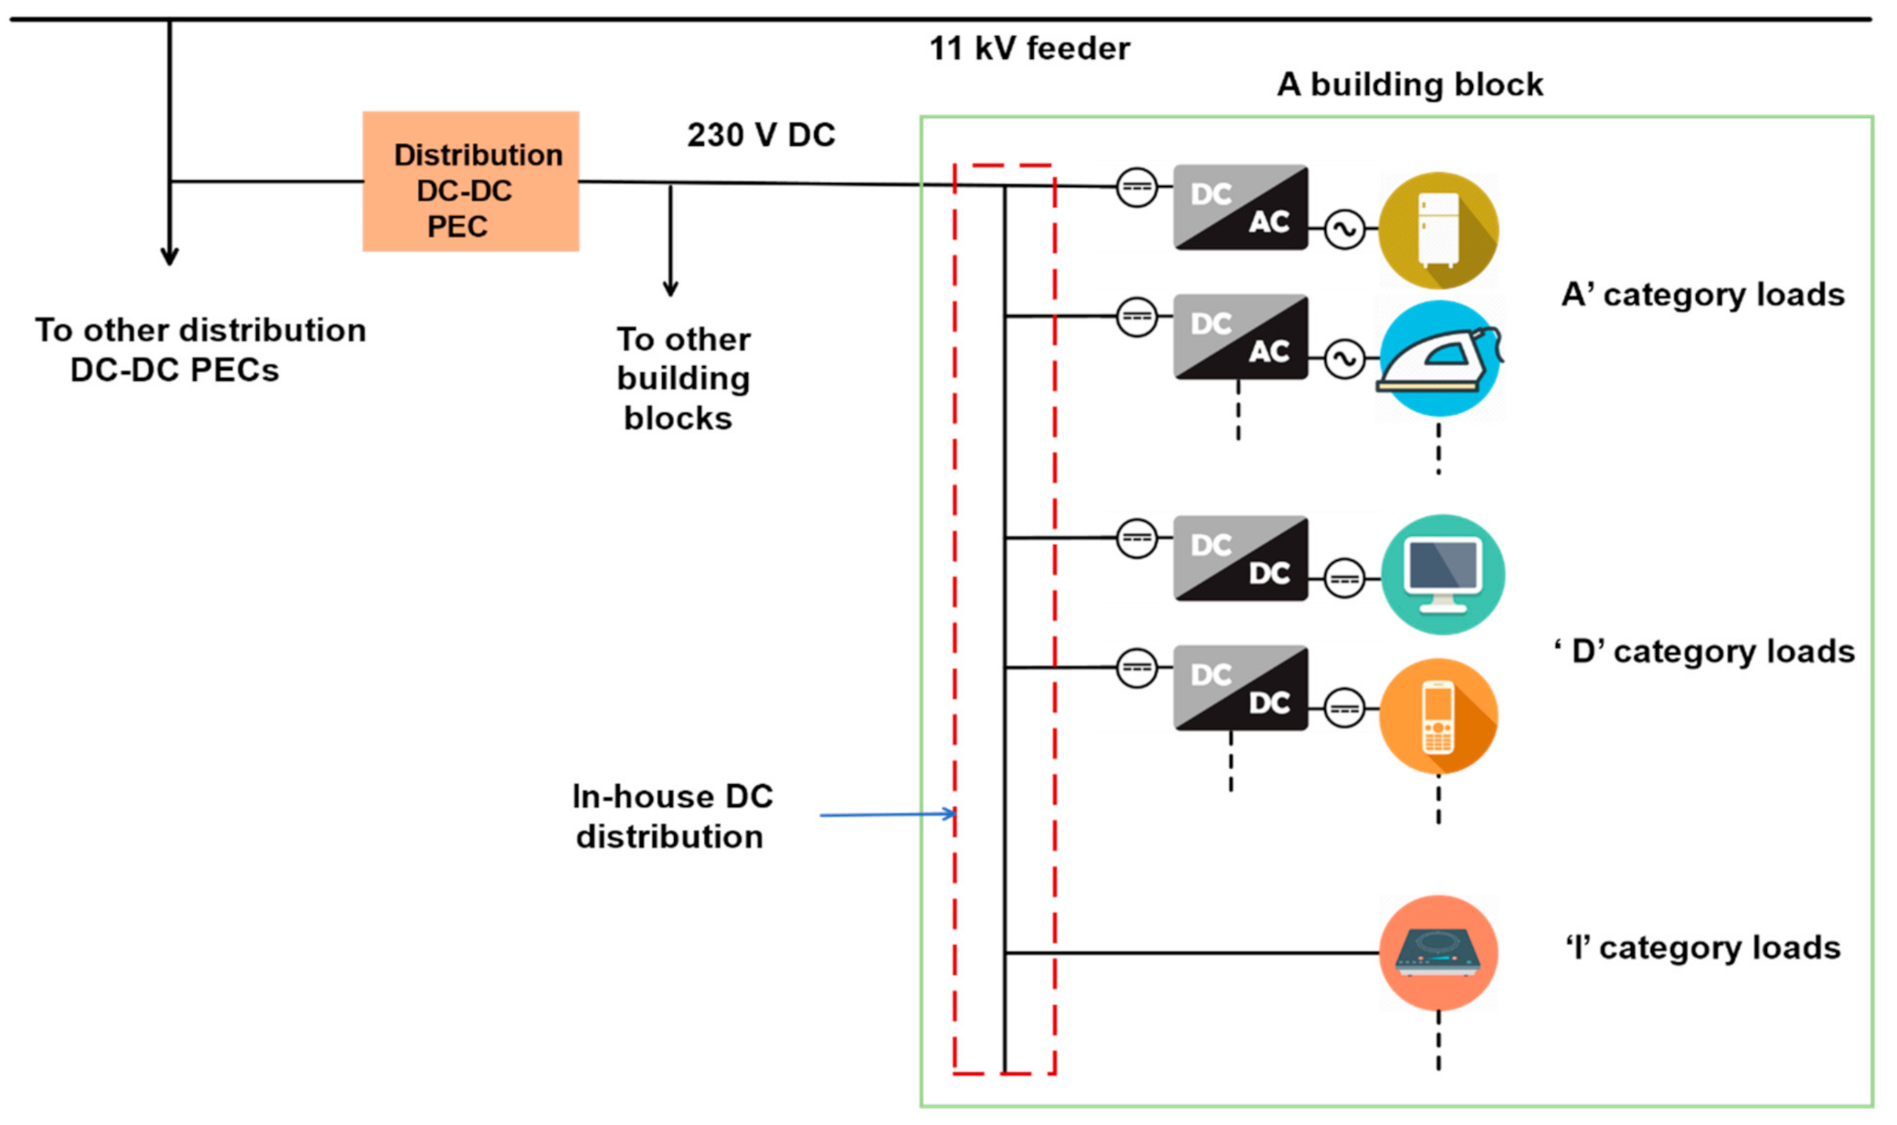
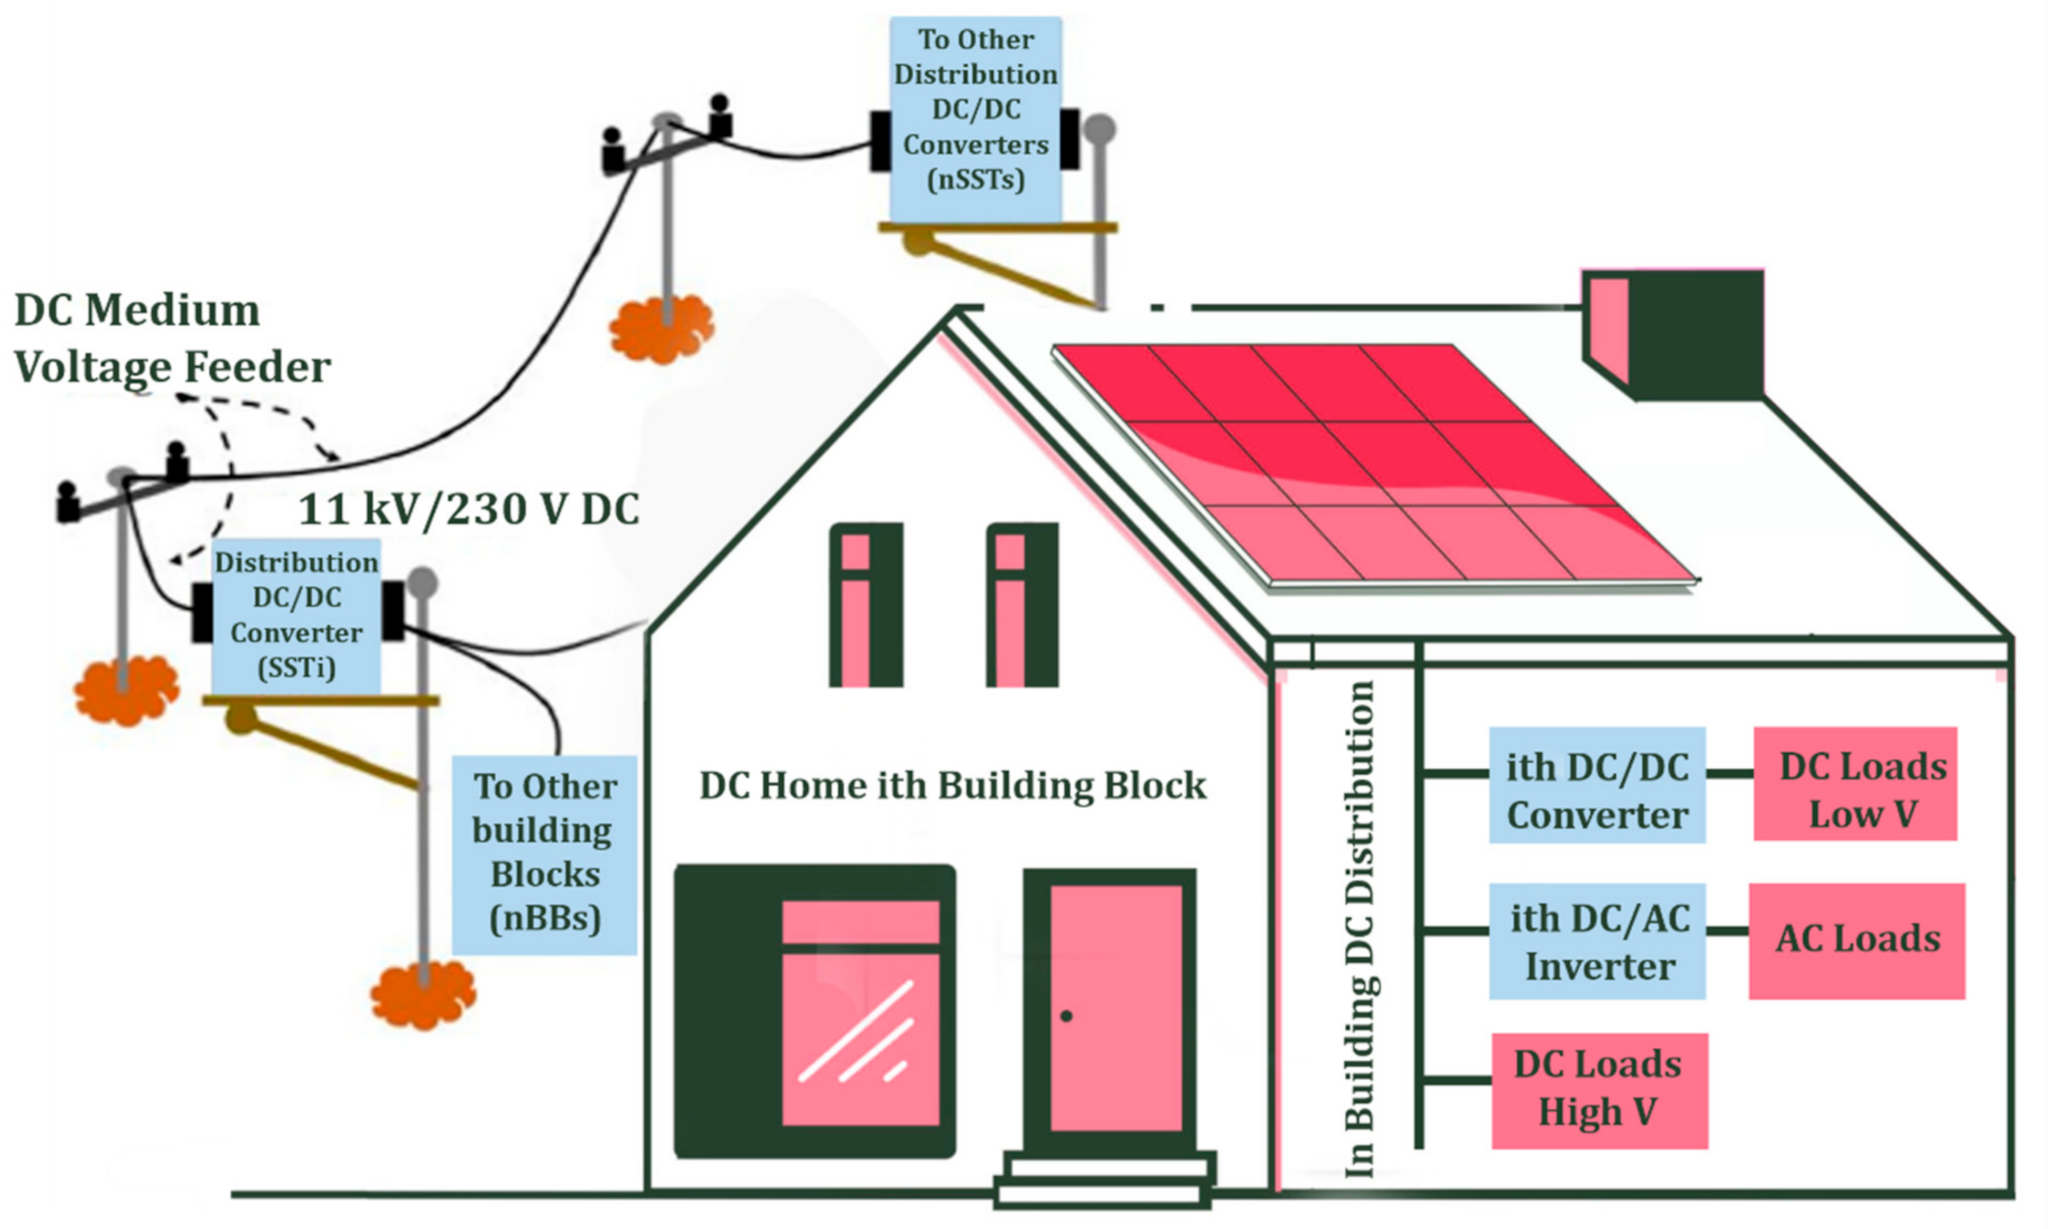
Since the basic requirement of the load model is a consideration of real-time power consumption of loads, a bottom-up approach can be employed to determine the efficiency of the system. In the case of a DC system, the loads can be divided according to voltage level and power demand (AC or DC). However, in the case of an AC system, the loads may be categorized according to their power demand, since the voltage level is constant throughout the building, i.e., 230 V.
If the loads are divided into AC and DC within the building, as shown in Figure 7, the DC loads can be further divided into high-voltage and low-voltage categories. The mathematical model of the DC system can then be expressed as
where ‘’ and ‘’ represent the power consumed by various loads with respect to time and efficiency of the converter at that consumed power, respectively. The number of high-voltage and low-voltage loads is assumed to be and respectively, with high-voltage loads directly connected to the mains voltage.
where is the number of AC loads within the house.
The total input power to the house can be derived using
For number of houses connected to a secondary distribution solid-state transformer (SD-SST), the power output at the SD-SST can be derived from
The input power of the SD-SST can be computed by dividing the output power by the operating efficiency of the transformer.
If there are x SD-SSTs in the system, the power taken from the grid can be found by summing the power of all SD-SSTs using
In the end, the efficiency of the system can be computed by dividing the overall power consumed by the loads to the power taken from the grid.
The above mathematical model can be extended or modified for any load model. The categorization in this model is done on the basis of the voltage level; however, this can be modified on the basis of loading category, as presented in [1,5,6]. Furthermore, solar power can be added to the model by employing real-time solar insolation data to the model.
3.1. Inclusion of PEC Efficiency in System Model
Since it was proposed in the previous section that the instantaneous load profile should be considered, this section dictates the consideration of the instantaneous efficiency of power converters. Furthermore, it is emphasized to consider the characteristics of commercially available converters. Although highly efficient converters have been designed and implemented in research there are constraints associated with their availability.
Regarding the modeling of converters, three approaches can be observed in the research:
- Loads with a similar rating are lumped and driven by a single converter,
The use of a separate converter for each load and the paralleling of converters demand the installation of numerous converters in the model. Although the schemes may be fruitful from a technical point of view, they are unrealistic from a structural point of view. Such installations may be found at grid stations, whereas, in residential or commercial facilities, the installations are kept as limited as possible in order to reduce wiring complexities. In contrast, the approach of lumping loads with a similar rating and driving them through a single converter seems realistic as it requires fewer installations.
Another important parameter associated with the converters is to assign a practical oversize ratio. Oversize ratio defines the operating region of the converter on its efficiency curve. From a realistic and practical point of view, a converter seldom operates at its maximum allowable power; thus, there is always room between the full load rating and the maximum load that the converter can practically drive [22,45,50,51,52]. The real-time efficiency of the converters can be added to the model by considering the practical characteristics of the converter efficiency against loading. The polynomial function governing the efficiency of the converter against loading can be of the following form:
Alternatively, it can be in the form of a piecewise function.
3.2. Inclusion of Storage Elements in System Model
One of the key factors in the revival of DC in the power system is the DC nature of storage items, i.e., batteries. Batteries are considered to be an integral part of the distribution system for ensuring continuous delivery of power to sensitive loads, as well as providing required power when utility and distributed generation are not enough to meet the demands [53,54,55,56,57,58,59].
Quite similar to the load model, the selection of batteries in the distribution network raises the consideration of the current scenario, shifting trend, and futuristic scenario. Classical systems employ batteries for fulfilling the basic requirement of uninterruptible supply, when utility power and distributed generation are exhausted. However, a shift can be observed today, which is often termed net-metering. Net-metering is the reverse flow of power from the facility to the utility when the requirements of the facility are fulfilled by a combination of distributed generation and battery units. The future is witnessing an advanced technology called zero net energy (ZNE) [60,61,62,63]. ZNE is one step ahead of net-metering, in that ZNE-based systems are optimally efficient by locally generating as much power required to drive the loads over the course of a year. The right choice of storage becomes an easy task when the ‘target’ is defined and, in the case of ZNE, a ‘zero target’ is proposed, i.e., the generation and consumption sum up to zero over a specific course of time.
In all three scenarios stated above, the charge/discharge power ratings and losses associated with the battery are necessary to be considered in AC and DC distribution system analysis. The datasheet that comes with battery contains the values of maximum rated charge and discharge powers. Furthermore, the losses exhibited by the battery are loss during charging and discharging of the battery [64,65], as well as idle loss decrease in SOC with time [66,67].
A realistic model that is capable of providing a definite verdict between AC and DC at the distribution level demands the consideration of losses stated above.
A proper selection of the capacity of the battery is another objective. A quick discharge and an extremely late discharge to a minimum are indications of low and high capacity of a battery, respectively. If the SOC of the battery never decays to a minimum, it means that the battery is larger than the requirement. Similarly, if the SOC of a battery falls quickly, it means that the battery is smaller than needed. Another important feature in the consideration of the battery is its proper utilization. For example, if a battery stays for ample time at its maximum SOC, it means that the battery is not utilized in driving the loads; alternatively, if a battery spends enough time in a fully discharged state, it means that the battery is not getting its charge properly. The variation in SOC with time is, therefore, an important variable in deciding the functionality of the battery. The study of battery losses along with the variation of battery SOC with time is highly recommended in the analysis of AC and DC distribution systems.
Battery charges when
Battery supply cuts off when
Battery charges until
The battery can be charged via solar panels, as well as the grid. However, considering economic constraints, it is better to charge the battery through solar panels because charging the battery via the grid adds to the utility bills.
For this purpose, there is a requirement of real-time tracking of solar power output, as well as load power consumption.
Battery charges via solar when
As stated earlier, the SOC should also be monitored with respect to time, because SOC rises as a result of charging and falls as a result of discharging. Solar power is not available throughout the day; as such, battery power can be employed to supply the loads. Since batteries are costly, a realistic approach demands that the battery sizing should be bounded within previously stated technical and economic constraints. For the case of a moderately sized battery, battery power can be utilized to supply evening loads. During the night, the load demand decreases, and power can be taken from the grid. For net-metering cases, SOC variation with respect to time is again demanded. Power is delivered to the grid when
On the other hand, power is taken from the grid when
In the case of ZNE, since the target is defined in the form of net-zero, battery sizing can be achieved considering the load profile and solar output curve for the defined course of time.
3.3. Selection of Voltage Level in System Model
The classical AC system has operated since the first battle of currents between Thomas Edison and Nicola Tesla. Therefore, the standard voltage levels of the AC distribution system were defined. However, there is no specific standard defined for the DC distribution system regarding the voltage level. Different voltage levels were applied in various studies without genuine reasoning. Recently, a comprehensive comparative analysis of AC and DC distribution systems was presented considering various voltage levels in [68]; however, the analysis did not consider the variation in PEC efficiency with loading, and results were furnished that supported 48 V DC. Not too long ago, with the efforts of [69], 380 V was standardized as the voltage level for DC distribution systems in commercial buildings; this has partially solved the confusion regarding the choice of voltage level.
Thus, 380 V is the voltage level available at the service mains. Accordingly, the loads rated at different voltage require an appropriate converter, e.g., a 24 V load should be operated via 380/24 DC–DC converter.
3.4. Line Loss Consideration
The basic requirement of a model that can present a definite efficiency comparison of AC and DC distribution systems should take into account every aspect responsible for affecting the efficiency of the systems. As presented earlier, various authors did not consider line losses in efficiency studies, instead assuming the line losses equivalent in AC and DC distribution systems. However, there may be cases where line losses can be the defining factor, e.g., in the study presented in [5], the authors accounted for line losses and showed a 1% difference in the efficiency of AC and DC distribution systems. Therefore, due consideration must be paid to the factor of line losses.
3.5. Inclusion of DG in System Model
The output energy from solar PV changes throughout the day, as well as with the seasonal climatic changes [70,71,72,73,74]. This demands instantaneous analysis of the output of the solar PV over a day, as well as a year. A technique similar to the load model can be employed for the case of solar PV, i.e., daily and yearly variation in the output of solar PV should be accounted for. The geographical location of the model is also an important factor with regard to the solar PV system [75,76,77]. A moderate location should be considered that can accommodate daily and seasonal variations in solar energy on a wider scale so that a comprehensive analysis can be established.
The data of loads coincident with solar PV can be quite fruitful in evaluating the independent effect of solar PV on the efficiency of AC and DC distribution systems. Moreover, it is important to state that the capacity of solar PV must be chosen by taking into account the fraction of loads coincident with solar PV. Although wind can be better optimized with DC systems, there is a negligible trend of considering wind plants as rooftop generators for the case of residences. However, it is important to point out the studies that took wind into account [78,79].
A classical realistic model does not allow for high-capacity solar PV that is coincident with all or a high fraction of the loads. However, the cases of net-metering and ZNE-based buildings may be different. Furthermore, solar PV panels are installed on rooftops. This limits the size of the panels. The size/capacity of the panels is required to be selected considering the rooftop dimensions.
Since there is a shift toward net-metering, the only boundary is the dimension of the roof as net-metering offers payments to consumers for the energy they sell to the grid. However, there are many states in developed countries that do not currently offer net-metering, whereas the case of underdeveloped countries is quite behind. Regarding the futuristic ZNE, the baseline is defined as the net of consumption and production being zero. This helps in deciding the capacity of solar PV bounded by the rooftop dimensions.
Although converters were discussed in the previous section, there is a need to revisit them with respect to solar PV electric power. In the case of AC distribution, converters are installed to convert solar DC output into building-compatible AC; in the case of DC distribution, converters are employed to convert solar DC output into building-compatible DC [80,81,82]. In both cases, i.e., AC and DC distribution systems, the two parameters associated with the solar converters are efficiency and clipping.
The converters employed with solar PV follow an efficiency pattern [83,84,85,86,87]. The efficiency of the converters is low at a lower percentage of rated power, whereas the converters operate at better efficiency at a moderate and higher percentage of rated power. Clipping is related to the proper selection of the converter. A converter with lower power rating as compared to the maximum deliverable power of solar PV may not be fruitful at times when solar PV is producing maximum power; the difference in the power produced by solar PV and converted by the converter goes wasted because the converter is only capable of converting power up to its rating. Therefore, it is important to pay due consideration to the variation in converter efficiency against output power, as well as the proper selection of the converters.
The power output from solar panels can be evaluated as the product of solar power and the connected converter.
can be derived from the solar characteristics, and corresponds to the efficiency of the solar converter at that power; both can be represented in the form of a single or piecewise polynomial, similar to the converters discussed previously.
4. The Future of AC–DC Efficiency Comparison
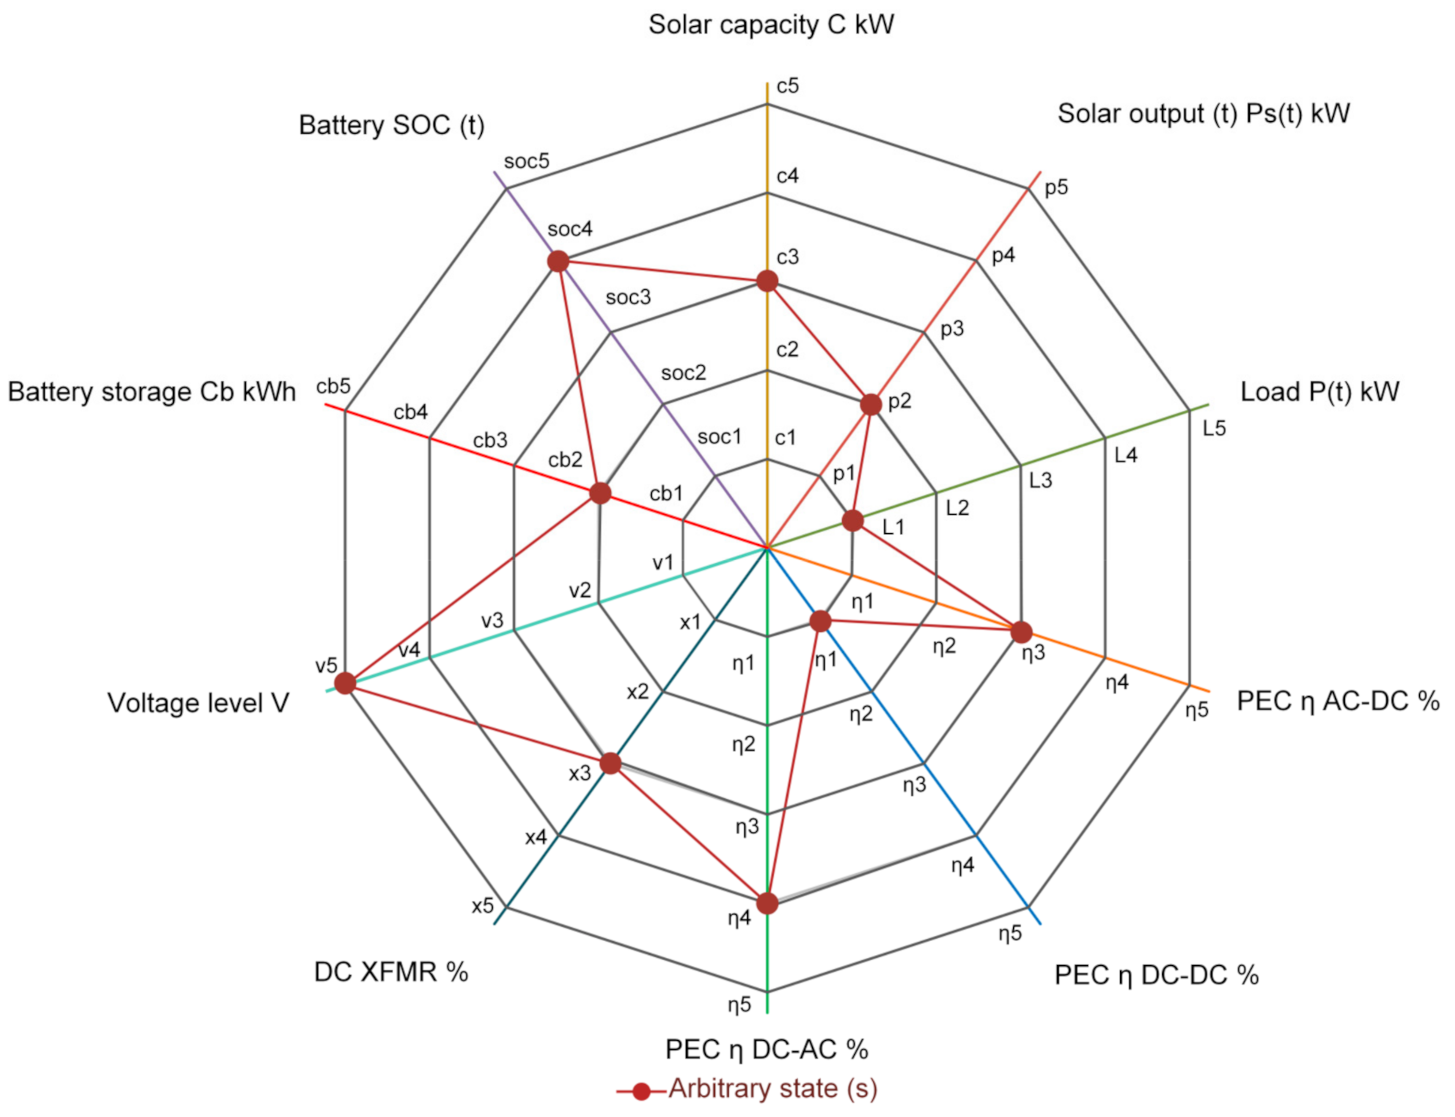
The study presented so far can be extended to include the effect of the highlighted parameters on a broader scale. The system can be classified into a number of operating states for different values of parameters. Figure 8 presents the concept of multi-parameter and multi-value efficiency analysis. The efficiency of a particular system changes its state as the values of these parameters change. An arbitrary state representing a particular scenario for specific values of parameters is also presented. The values in any specific state, at a given time t, are presented in Equation (25).
where and are the solar PV generation and system load demand at any time t, η is the efficiency of the PECs against loading, and is the solar PV capacity; In addition to other system parameter values, they form an operating state, i.e., state 1. For this state,
where is the efficiency advantage of DC over AC for state 1.
Theoretically, this analysis may be carried out for any state of the system. State modeling can provide a detailed analysis of when AC is better than DC at the distribution scale and vice versa. An actual system can have a large number of operating states due to varying parametric values; the analyses need to be repeated for different states. In this way, the efficiency advantage of DC distribution systems can be evaluated for a wide number of states. Combining the results of all the states allows forming a composite analysis which can comprehensively present the comparison of AC and DC distribution systems. A conceptual state flow diagram is presented in Figure 9. The values of all parameters in Figure 8 form one state of the system at a particular time. As the value of one or more parameters changes with time, the system moves to another state. In Figure 9, only three state variables are shown, i.e., solar power ‘Ps’, load power ‘PL’, and solar capacity ‘C’. When the values of these variables are 0.1 pu each, we can consider this state as S1. The variables ‘α’, ‘β’, and ‘γ’ represent the increment and decrement in the values of ‘Ps’, ‘PL’, and ‘C’, respectively. With an increment in ‘α’ and ‘β’ for the values of ‘Ps’ and ‘PL’, the system shifts to a new state S6 and vice versa. Similarly, while the system is in S1, an increment in Ps alone would move the system to S2. Figure 9 is an illustration of how the system shifts states as a function of the variation in the values of system parameters; accordingly, the energy savings for all states can be determined in the future for a comprehensive analysis of AC and DC systems.
5. Further Research Areas
5.1. Case of Electric Vehicle Penetration
Electric vehicles (EVs) currently represent a hot research topic, and a widespread penetration of EVs may be expected in the future. The corresponding charging stations for the EVs can have a major impact on the electric power system. With regard to the coupling of EVs with DC distribution systems and their efficiency, this can definitely be an explorable area for future research efforts [88,89,90]. The penetration level of EVs (e.g., 10%, 20%, …) may be included as an additional variable in the multi-parameter system efficiency evaluation study illustrated in Figure 8, and efficiency studies may be carried out.
5.2. Economics of Shift from AC to DC systems
If proven suitable in terms of efficiency and otherwise, then a shift from AC to DC networks is also going to require an economic study. Such a study can compare, e.g., the economic value of the reduction in system losses obtained via DC systems to the corresponding investments in the shift from AC to DC. Furthermore, such a study can be two-dimensional in the sense that, on one hand, the economics of converting the current AC system to DC can be investigated, while, on the other hand, the economics of using DC for the new system (as in distribution system expansion) can be analyzed.
6. Miscellaneous Topics of Discussion
6.1. Applications That May Inherently Require AC Machines
There may be the scenario where some machines need AC, despite being used in a DC system. One example may be wind power plants (WPPs) where an AC machine is used as the primary generator. For this case, it may be suggested that AC–DC–AC conversion (which is used in a number of WPP systems for stabilizing the electrical frequency of generated power) should be partially used, i.e., AC/DC conversion without being followed by DC/AC conversion should be used. In this way, a conversion stage may be avoided and, thus, the WPP energy conversion efficiency may also be enhanced.
6.2. Migration from AC to DC
Subsequent to research investigation that can prove the feasibility of DC systems, the migration from AC to DC will need to establish the market availability of DC-operated household appliances/loads. This will also include the development and implementation of standards. The paradigm shift from AC to DC can happen in two ways. Firstly, for new systems (system expansion), DC systems may be installed, and the residential customers (new house owners/builders) can install the DC loads made available on the market. Secondly, for existing systems, DC wiring may be introduced in parallel with AC wiring inside the home, wherein a main DC converter provides DC power for this in-home DC system (a feasibility analysis of this may also be a research area). DC appliances can be connected to this retrofitted in-home distribution system, thereby allowing these systems to slowly phase out the AC distribution system, eventually leading to the use of DC/DC converter transformers in place of the currently used AC–AC electromagnetic distribution transformers.
6.3. Hurdles in Shifting from AC to DC Systems
Various hurdles may be faced and will have to be overcome in the migration from AC to DC systems. The first step is to investigate efficiency and other figures of merit, e.g., power quality, standardizations, and safety, with respect to various scenarios. Several studies have tried to highlight the issues related to power quality and standardizations [91,92,93]. With regard to power quality, certain standards are fine for DC as they stand for AC; however, in several cases, standards need to be redefined. It is important to point out here that several standardization agencies are making advancements at a handsome pace to develop standards for DC systems, e.g., IEEE946-2020 [94], IEEE 1547 [95], and IEEE-DC were developed [96], and UL-1741 [97] to promote the adoption of DC at distribution scale. Thereafter, if deemed feasible for general-purpose residential power distribution, the migration procedure may be started, which will require the industry to convert various residential appliances to a DC-ready form. Retrofitting existing in-home systems by introducing DC wiring may face initial resistance from homeowners. In short, various hurdles may be faced in the shift to DC, and research and development may be required at different levels.
7. Conclusions
DC, given up a long time ago, is now witnessing a revival. The advancement in technology has enabled DC to strike back. Efficiency was the factor that once wiped DC out of the scene at the birth of electricity, and this may now be the factor to bring DC back to the power system. Hence, an efficiency analysis or, more precisely, a comparative efficiency analysis of AC and DC distribution systems is of prime importance. Various authors have presented efficiency analyses; however, based on their test scenarios, conflicting results exist. Efficiency depends on various factors, and an approach encompassing the true employment of all these factors in the efficiency analysis is needed in time to determine whether DC is better than AC and, if so, under what scenarios and by how many factors of efficiency. This paper presents a critical analysis of the studies presented in the past with regard to the employment of the factors of efficiency. Using constructive criticism, a model was presented that accounts for the factors of efficiency to provide a definite verdict of whether DC is better than AC or not. The future of comparative AC and DC distribution efficiency analysis was also presented as a multi-value multi-parameter efficiency analysis with the concept of state flow. The findings of this research effort may form a concrete base from a research standpoint for humankind to realize if the time has come for making a big change in power systems from AC to DC because of better system efficiency.
Author Contributions
Conceptualization, H.E.G., F.D., M.N. and S.K.; methodology, H.E.G., F.D., M.N. and S.K.; validation, F.D. and J.M.G.; formal analysis, H.E.G., M.N. and S.K.; investigation, H.E.G., F.D., M.N. and S.K.; resources, H.E.G., F.D. and M.N.; data curation, H.E.G., F.D. and S.K.; writing H.E.G., M.N. and S.K.; writing—review and editing, H.E.G., F.D., M.N., S.K. and J.M.G.; visualization, H.E.G., F.D., M.N. and S.K.; supervision, F.D. and J.M.G.; project administration, F.D. All authors have read and agreed to the published version of the manuscript.
Funding
This research received no external funding.
Institutional Review Board Statement
Not applicable.
Informed Consent Statement
Not applicable.
Data Availability Statement
Not applicable.
Conflicts of Interest
The authors declare no conflict of interest.
References
- Gelani, H.E.; Dastgeer, F. Efficiency analyses of a DC residential power distribution system for the modern home. Adv. Electl. Comp. Eng. 2015, 15, 135–143. [Google Scholar] [CrossRef]
- Hammerstrom, D.J. AC versus DC distribution systems: Did we get it right? In Proceedings of the 2007 IEEE Power Engineering Society General Meeting, Tampa, FL, USA, 24–28 June 2007; pp. 1–5. [Google Scholar] [CrossRef]
- Starke, M.; Tolbert, L.; Ozpineci, B. AC vs. DC distribution: A loss comparison. In Proceedings of the 2008 IEEE/PES Transmission and Distribution Conference and Exposition; Institute of Electrical and Elec-tronics Engineers (IEEE), Bogota, Colombia, 13–15 August 2008; pp. 1–7. [Google Scholar]
- Vossos, V.; Garbesi, K.; Shen, H. Energy savings from direct-DC in U.S. residential buildings. Energy Build. 2014, 68, 223–231. [Google Scholar] [CrossRef]
- Dastgeer, F.; Gelani, H.E. A Comparative analysis of system efficiency for AC and DC residential power distribution para-digms. Energy Build. 2017, 138, 648–654. [Google Scholar] [CrossRef]
- Dastgeer, F.; Kalam, A. Efficiency comparison of DC and AC distribution systems for distributed generation. In Proceedings of the IEEE Power Engineering Conference, Adelaide, Australia, 27–30 September 2009. [Google Scholar]
- Amin, M.; Arafat, Y.; Lundberg, S.; Mangold, S. Low voltage DC distribution system compared with 230 V AC. In Proceedings of the 2009 IEEE Electrical Power & Energy Conference (EPEC), Montreal, QC, Canada, 22–23 October 2009; pp. 340–345. [Google Scholar]
- Pratt, A.; Kumar, P.; Aldridge, T.V. Evaluation of 400V DC distribution in telco and data centers to improve energy efficiency. In Proceedings of the INTELEC 29th International Telecommunications Energy Conference, Rome, Italy, 30 September–4 October 2007; pp. 32–39. [Google Scholar]
- Engelen, K.; Shun, E.L.; Vermeyen, P.; Pardon, L.; D’hulst, R.; Driesen, J.; Belmans, R. The feasibility of small-scale residential DC distribution systems. Proceedings of IECON 2006-32nd Annual Conference on IEEE Industrial Electronics, Paris, France, 7–10 November 2006. [Google Scholar]
- Nilsson, D.; Sannino, A. Efficiency analysis of low- and medium-voltage dc distribution systems. In Proceedings of the Eighth IEEE International Symposium on Spread Spectrum Techniques and Applications, Sydney, NSW, Australia, 30 August–2 September 2004; Volume 2, pp. 2315–2321. [Google Scholar]
- Becker, D.J.; Sonnenberg, B. DC microgrids in buildings and data centers. In Proceedings of the 2011 IEEE 33rd International Telecommunications Energy Conference (INTELEC); Institute of Electrical and Electronics Engineers (IEEE), Amsterdam, The Netherlands, 9–13 October 2011; pp. 1–7. [Google Scholar]
- Liu, Z.; Li, M. Research on energy efficiency of DC distribution system. AASRI Procedia 2014, 7, 68–74. [Google Scholar] [CrossRef]
- Brenguier, J.; Vallet, M.; Vaillant, F. Efficiency gap between AC and DC electrical power distribution system. Proceedings of 2016 IEEE/IAS 52nd Industrial and Commercial Power Systems Technical Conference (I&CPS), Detroit, MI, USA, 1–5 May 2016. [Google Scholar]
- Fregosi, D.; Ravula, S.; Brhlik, D.; Saussele, J.; Frank, S.; Bonnema, E.; Scheib, J.; Wilson, E. A comparative study of DC and AC microgrids in commercial buildings across different climates and operating profiles. In Proceedings of the 2015 IEEE First International Conference on DC Microgrids (ICDCM), Atlanta, GA, USA, 7–10 June 2015; pp. 159–164. [Google Scholar]
- Atia, H.R.; Shakya, A.; Tandukar, P.; Tamrakar, U.; Hansen, T.M.; Tonkoski, R. Efficiency analysis of AC coupled and DC coupled microgrids considering load profile variations. In Proceedings of the 2016 IEEE International Conference on Electro Information Technology (EIT), Grand Forks, ND, USA, 19–21 May 2016. [Google Scholar]
- Sannino, A.; Postiglione, G.; Bollen, M. Feasibility of a DC network for commercial facilities. IEEE Trans. Ind. Appl. 2003, 39, 1499–1507. [Google Scholar] [CrossRef]
- Manandhar, U.; Ukil, A.; Jonathan, T.K.K. Efficiency comparison of DC and AC microgrid. In Proceedings of the 2015 IEEE Innovative Smart Grid Technologies-Asia (ISGT ASIA), Bangkok, Thailand, 3–6 November 2015. [Google Scholar]
- Sirsi, R.; Ambekar, Y. Efficiency of DC microgrid on DC distribution system. In Proceedings of the 2015 IEEE Innovative Smart Grid Technologies-Asia (ISGT ASIA), Bangkok, Thailand, 3–6 November 2015. [Google Scholar]
- Sirsi, R.; Prasad, S.; Sonawane, A.; Lokhande, A. Efficiency comparison of AC distribution system and DC distribution system in microgrid. In Proceedings of the 2016 International Conference on Energy Efficient Technologies for Sustainability (ICEETS); Institute of Electrical and Electronics Engineers (IEEE), Nagercoil, India, 7–8 April 2016; pp. 325–329. [Google Scholar]
- Boeke, U.; Wendt, M. DC power grids for buildings. In Proceedings of the 2015 IEEE First International Conference on DC Microgrids (ICDCM), Atlanta, GA, USA, 9–10 June 2015; pp. 210–214. [Google Scholar]
- Weiss, R.; Ott, L.; Boeke, U. Energy efficient low-voltage DC-grids for commercial buildings. In Proceedings of the 2015 IEEE First International Conference on DC Microgrids (ICDCM), Atlanta, GA, USA, 9–19 June 2015. [Google Scholar]
- Gerber, D.L.; Vossos, V.; Feng, W.; Marnay, C.; Nordman, B.; Brown, R. A simulation-based efficiency comparison of AC and DC power distribution networks in commercial buildings. Appl. Energy 2018, 210, 1167–1187. [Google Scholar] [CrossRef] [Green Version]
- Glasgo, B.; Azevedo, I.L.; Hendrickson, C. How much electricity can we save by using direct current circuits in homes? Under-standing the potential for electricity savings and assessing feasibility of a transition towards DC powered buildings. Appl. Energy 2016, 180, 66–75. [Google Scholar] [CrossRef] [Green Version]
- Chauhan, R.; Rajpurohit, B. DC distribution system for energy efficient buildings. In Proceedings of the 2014 Eighteenth National Power Systems Conference (NPSC), Guwahati, India, 18–20 December 2014. [Google Scholar]
- Goikoetxea, A.; Canales, J.M.; Sanchez, R.; Zumeta, P.; Sanchez, R. DC versus AC in residential buildings: Efficiency comparison. In Proceedings of the Eurocon 2013, Zagreb, Croatia, 1–4 July 2013; pp. 1–5. [Google Scholar]
- Nasir, M.; Zaffar, N.A.; Khan, H.A. Analysis on central and distributed architectures of solar powered DC microgrids. In Proceedings of the 2016 Clemson University Power Systems Conference (PSC), Clemson, SC, USA, 8–11 March 2016; pp. 1–6. [Google Scholar]
- Nasir, M.; Khan, H. Solar photovoltaic integrated building scale hybrid AC/DC microgrid. In Proceedings of the 5th IET International Conference on Renewable Power Generation (RPG) 2016, London, UK, 21–23 September 2016; p. 7. [Google Scholar]
- Nasir, M.; Khan, H.A.; Hussain, A.; Mateen, L.; Zaffar, N.A. Solar PV-based scalable DC microgrid for rural electrification in developing regions. IEEE Trans. Sustain. Energy 2018, 9, 390–399. [Google Scholar] [CrossRef]
- Nasir, M.; Iqbal, S.; Khan, H.A. Optimal planning and design of low-voltage low-power solar DC microgrids. IEEE Trans. Power Syst. 2018, 33, 2919–2928. [Google Scholar] [CrossRef]
- Farrag, M.E.; Haggag, A.; Farooq, H.; Ali, W. Analysis and mitigation of harmonics caused by air conditioners in a distribution system. In Proceedings of the 2017 Nineteenth International Middle East Power Systems Conference (MEPCON), Cairo, Egypt, 19–21 December 2017; pp. 702–707. [Google Scholar]
- Liu, M.; Yong, J.; Wang, X.; Lu, J. A new event detection technique for residential load monitoring. In Proceedings of the 2018 18th International Conference on Harmonics and Quality of Power (ICHQP), Ljubljana, Slovenia, 13–16 May 2018; pp. 1–6. [Google Scholar]
- Estes, H.; Santoso, S. Profiles, harmonics, and transient analysis of 240 V air conditioning load during peak demand. In Proceedings of the 2016 IEEE Power and Energy Society General Meeting (PESGM), Boston, MA, USA, 17–21 July 2016; pp. 1–5. [Google Scholar]
- Fazli, T.; Yeap, R.Y.; Stephens, B. Modeling the energy and cost impacts of excess static pressure in central forced-air heating and air-conditioning systems in single-family residences in the U.S. Energy Build. 2015, 107, 243–253. [Google Scholar] [CrossRef]
- Rathikrindi, K.S.; Paramasivam, S.; Sandeep, L. Energy saving opportunities through Variable Frequency Drive for Commercial Air Conditioners. In Proceedings of the 2018 4th International Conference on Electrical Energy Systems (ICEES), Chennai, India, 7–9 February 2018; pp. 338–340. [Google Scholar]
- Wang, G.; Song, L. Performance assessment of variable frequency drives in heating, ventilation, and air-conditioning systems. Sci. Technol. Built Environ. 2018, 24, 1075–1083. [Google Scholar] [CrossRef]
- Lim, J.; Yoon, M.S.; Al-Qahtani, T.; Nam, Y. Feasibility study on variable-speed air conditioner under hot climate based on real-scale experiment and energy simulation. Energies 2019, 12, 1489. [Google Scholar] [CrossRef] [Green Version]
- Khatri, R.; Joshi, A. Energy Performance comparison of inverter based variable refrigerant flow unitary AC with constant volume unitary AC. Energy Procedia 2017, 109, 18–26. [Google Scholar] [CrossRef]
- Dongellini, M.; Abbenante, M.; Morini, G. A strategy for the optimal control logic of heat pump systems: Impact on the energy consumptions of a residential building. In Proceedings of the 12th IEA Heat Pump Conference 2017, Rotterdam, The Netherlands, 15–18 May 2017. [Google Scholar]
- Kazakbaev, V.; Prakht, V.; Dmitrievskii, V.; Ibrahim, M.N.; Oshurbekov, S.; Sarapulov, S. Efficiency analysis of low electric power drives employing induction and synchronous reluctance motors in pump applications. Energies 2019, 12, 1144. [Google Scholar] [CrossRef] [Green Version]
- Blaabjerg, F.; Wang, H.; Davari, P.; Qu, X.; Zare, F. Energy Saving and Efficient Energy Use by Power Electronic Systems. In The Interrelationship between Financial and Energy Markets; Springer Science and Business Media: Berlin/Heidelberg, Germany, 2017; Volume 37, pp. 1–14. [Google Scholar]
- Bhatt, D.; Hariharasudan, A.; Lis, M.; Grabowska, M. Forecasting of energy demands for smart home applications. Energies 2021, 14, 1045. [Google Scholar] [CrossRef]
- Gnaciński, P.; Hallmann, D.; Klimczak, P.; Muc, A.; Pepliński, M. Effects of voltage interharmonics on cage induction motors. Energies 2021, 14, 1218. [Google Scholar] [CrossRef]
- Lusis, P.; Khalilpour, R.; Andrew, L.; Liebman, A. Short-term residential load forecasting: Impact of calendar effects and forecast granularity. Appl. Energy 2017, 205, 654–669. [Google Scholar] [CrossRef]
- Das, S.; Das, D.; Patra, A. Distribution network reconfiguration using distributed generation unit considering var-iations of load. In Proceedings of the 2016 IEEE 1st International Conference on Power Electronics, Intelligent Control and Energy Systems (ICPEICES), Delhi, India, 4–6 July 2016. [Google Scholar]
- Gelani, H.E.; Dastgeer, F.; Siraj, K.; Nasir, M.; Niazi, K.A.K.; Yang, Y. Efficiency comparison of AC and DC distribution networks for modern residential localities. Appl. Sci. 2019, 9, 582. [Google Scholar] [CrossRef] [Green Version]
- Fischer, D.; Surmann, A.; Lindberg, K.B. Impact of emerging technologies on the electricity load profile of residential areas. Energy Build. 2020, 208, 109614. [Google Scholar] [CrossRef]
- Villa, G.; Gomez-Aleixandre, C.; Garcia, P.; Garcia, J. Distributed Control alternatives of modular power converters for hybrid DC/AC microgrids. In Proceedings of the 2018 IEEE Energy Conversion Congress and Exposition (ECCE), Portland, OR, USA, 23–27 September 2018; pp. 6379–6386. [Google Scholar]
- Shekhar, A.; Kontos, E.; Ramirez-Elizondo, L.; Rodrigo-Mor, A.; Bauer, P. Grid capacity and efficiency enhancement by op-erating medium voltage AC cables as DC links with modular multilevel converters. Int. J. Electr. Power Energy Syst. 2017, 93, 479–493. [Google Scholar] [CrossRef]
- Acharya, A.B.; Sera, D.; Teodorescu, R.; Norum, L.E. Modular multilevel converter for photovoltaic application with high energy yield under uneven irradiance. Energies 2020, 13, 2619. [Google Scholar] [CrossRef]
- Arunkumari, T.; Indragandhi, V. An overview of high voltage conversion ratio DC-DC converter configurations used in DC micro-grid architectures. Renew. Sustain. Energy Rev. 2017, 77, 670–687. [Google Scholar] [CrossRef]
- Mbinkar, E.N.; Asoh, D.A.; Tchuidjan, R.; Baldeh, A. Design of a photovoltaic mini-grid system for rural electrification in Sub-Saharan Africa. Energy Power Eng. 2021, 13, 91–110. [Google Scholar] [CrossRef]
- Malamaki, K.-N.D.; Demoulias, C.S.; Oureilidis, K.O. Analytical calculation of the PV converter efficiency curve at non-unity power factors. In Proceedings of the 2017 52nd International Universities Power Engineering Conference (UPEC), Heraklion, Crete, Greece, 28–31 August 2017; pp. 1–6. [Google Scholar]
- Zubieta, L.E. Are microgrids the future of energy?: DC microgrids from concept to demonstration to deployment. IEEE Electrif. Mag. 2016, 4, 37–44. [Google Scholar] [CrossRef]
- Kumar, D.; Zare, F.; Ghosh, A. DC microgrid technology: System architectures, AC grid interfaces, grounding schemes, power quality, communication networks, applications, and standardizations aspects. IEEE Access 2017, 5, 12230–12256. [Google Scholar] [CrossRef]
- Zadeh, M.; Gavagsaz-Ghoachani, R.; Pierfederici, S.; Nahid-Mobarakeh, B.; Molinas, M. Stability Analysis and dynamic performance evaluation of a power electronics-based DC distribution system with active stabilizer. IEEE J. Emerg. Sel. Top. Power Electron. 2016, 4, 93–102. [Google Scholar] [CrossRef]
- Nasir, M.; Khan, H.A.; Khan, I.; Hassan, N.U.; Zaffar, N.A.; Mehmood, A.; Sauter, T.; Muyeen, S.M. Grid load reduction through optimized PV power utilization in intermittent grids using a low-cost hardware platform. Energies 2019, 12, 1764. [Google Scholar] [CrossRef] [Green Version]
- Nasir, M.; Jin, Z.; Khan, H.A.; Zaffar, N.A.; Vasquez, J.C.; Guerrero, J.M. A decentralized control architecture applied to DC nanogrid clusters for rural electrification in developing regions. IEEE Trans. Power Electron. 2019, 34, 1773–1785. [Google Scholar] [CrossRef] [Green Version]
- Nasir, M.; Khan, H.A.; Niazi, K.A.K.; Jin, Z.; Guerrero, J. Dual-loop control strategy applied to PV/battery-based islanded DC microgrids for swarm electrification of developing regions. J. Eng. 2019, 2019, 5298–5302. [Google Scholar] [CrossRef]
- Nasir, M.; Khan, H.A.; Zaffar, N.A.; Vasquez, J.C.; Guerrero, J.M. Scalable solar DC Microgrids: On the path to revolutionizing the electrification architecture of developing communities. IEEE Electrif. Mag. 2018, 6, 63–72. [Google Scholar] [CrossRef]
- Zhang, S.; Huang, P.; Sun, Y. A multi-criterion renewable energy system design optimization for net zero energy buildings under uncertainties. Energy 2016, 94, 654–665. [Google Scholar] [CrossRef]
- Athienitis, A.; O’Brien, W. Modeling, Design, and Optimization of Net-Zero Energy Buildings; Ernst &Sohn: Berlin, Germany, 2015. [Google Scholar]
- Vieira, F.M.; Moura, P.S.; Almeida, A. Energy storage system for self-consumption of photovoltaic energy in residential zero energy buildings. Renew. Energy 2017, 103, 308–320. [Google Scholar] [CrossRef]
- Chastas, P.; Theodosiou, T.; Bikas, D. Embodied energy in residential buildings-towards the nearly zero energy building: A literature review. Build. Environ. 2016, 105, 267–282. [Google Scholar] [CrossRef]
- Dash, V.; Bajpai, P. Power management control strategy for a stand-alone solar photovoltaic-fuel cell–battery hybrid system. Sustain. Energy Technol. Assess. 2015, 9, 68–80. [Google Scholar] [CrossRef]
- Mehmood, K.K.; Khan, S.U.; Lee, S.; Haider, Z.M.; Rafique, M.K.; Kim, C. Optimal sizing and allocation of battery energy storage systems with wind and solar power DGs in a distribution network for voltage regulation considering the lifespan of batteries. IET Renew. Power Gener. 2017, 11, 1305–1315. [Google Scholar] [CrossRef]
- Tong, S.; Lacap, J.H.; Park, J.W. Battery state of charge estimation using a load-classifying neural network. J. Energy Storage 2016, 7, 236–243. [Google Scholar] [CrossRef]
- Zhang, Z.; Cai, Y.-Y.; Zhang, Y.; Gu, D.-J.; Liu, Y.-F. A distributed architecture based on microbank modules with self-reconfiguration control to improve the energy efficiency in the battery energy storage system. IEEE Trans. Power Electron. 2015, 31, 304–317. [Google Scholar] [CrossRef]
- Siraj, K.; Khan, H.A. DC distribution for residential power networks—A framework to analyze the impact of voltage levels on energy efficiency. Energy Rep. 2020, 6, 944–951. [Google Scholar] [CrossRef]
- Emerge Alliance. Available online: https://www.emergealliance.org/ (accessed on 12 April 2021).
- He, G.; Kammen, D.M. Where, when and how much solar is available? A provincial-scale solar resource assessment for China. Renew. Energy 2016, 85, 74–82. [Google Scholar] [CrossRef] [Green Version]
- Raza, M.Q.; Mithulananthan, N.; Summerfield, A. Solar output power forecast using an ensemble framework with neural predictors and Bayesian adaptive combination. Sol. Energy 2018, 166, 226–241. [Google Scholar] [CrossRef]
- Megahed, T.F.; Radwan, A. Performance investigation of zero-building-integrated photovoltaic roof system: A case study in Egypt. Alex. Eng. J. 2020, 59, 5053–5067. [Google Scholar] [CrossRef]
- Nair, A.K.; Kirubakaran, V. Increasing solar PV output by controlling environmental parameters. In Proceedings of the 2016 3rd International Conference on Electrical Energy Systems (ICEES), Chennai, India, 17–19 March 2016; pp. 251–256. [Google Scholar]
- Ellahi, M.; Abbas, G.; Khan, I.; Koola, P.M.; Nasir, M.; Raza, A.; Farooq, U. Recent approaches of forecasting and optimal economic dispatch to overcome intermittency of wind and photovoltaic (PV) systems: A review. Energies 2019, 12, 4392. [Google Scholar] [CrossRef] [Green Version]
- Huld, T.; Amillo, A.M.G. Estimating PV module performance over large geographical regions: The role of irradiance, air temperature, wind speed and solar spectrum. Energies 2015, 8, 5159. [Google Scholar] [CrossRef] [Green Version]
- Yang, D.; Quan, H.; Disfani, V.R.; Liu, L. Reconciling solar forecasts: Geographical hierarchy. Sol. Energy 2017, 146, 276–286. [Google Scholar] [CrossRef]
- Al-Sakkaf, S.; Kassas, M.; Khalid, M.; Abido, M.A. An energy management system for residential autonomous DC microgrid using optimized fuzzy logic controller considering economic dispatch. Energies 2019, 12, 1457. [Google Scholar] [CrossRef] [Green Version]
- Ahmad, F.; Dastgeer, F.; Gelani, H.E.; Khan, S.; Nasir, M. Comparative analyses of residential building efficiency for AC and DC distribution networks. Bull. Pol. Acad. Sci. Tech. Sci. 2021, 69, e136732. [Google Scholar]
- Montoya, O.D.; Serra, F.M.; De De Angelo, C.H. On the efficiency in electrical networks with AC and DC operation technologies: A comparative study at the distribution stage. Electronics 2020, 9, 1352. [Google Scholar] [CrossRef]
- Chen, X.; Khan, I. A Tutorial on Current Controlled DC-DC Converter used in Microgrid System. In Proceedings of the 2019 IEEE 16th International Conference on Smart Cities: Improving Quality of Life Using ICT & IoT and AI (HONET-ICT), Charlotte, NC, USA, 6−9 October 2019; pp. 232–234. [Google Scholar]
- Jadeja, R.; Ved, A.; Trivedi, T.; Khanduja, G. Control of power electronic converters in AC microgrid. Numer. Methods Energy Appl. 2019, 27, 329–355. [Google Scholar] [CrossRef]
- Singh, S. Selection of non-isolated DC-DC converters for solar photovoltaic system. Renew. Sustain. Energy Rev. 2017, 76, 1230–1247. [Google Scholar] [CrossRef]
- Yau, Y.-T.; Wang, C.-W.; Hwu, K.-I. Light-load efficiency improvement for ultrahigh step-down converter based on skip mode. Electronics 2021, 10, 355. [Google Scholar] [CrossRef]
- Nasir, M.; Anees, M.; Khan, H.A.; Khan, I.; Xu, Y.; Guerrero, J.M. Integration and decentralized control of standalone solar home systems for off-grid community applications. IEEE Trans. Ind. Appl. 2019, 55, 7240–7250. [Google Scholar] [CrossRef]
- Nasir, M.; Iqbal, S.; Khan, H.; Vasquez, J.; Guerrero, J. Sustainable rural electrification through solar PV DC microgrids—An architecture-based assessment. Processes 2020, 8, 1417. [Google Scholar] [CrossRef]
- Iqbal, S.; Nasir, M.; Zia, M.F.; Riaz, K.; Sajjad, H.; Khan, H.A. A novel approach for system loss minimization in a peer-to-peer energy sharing community DC microgrid. Int. J. Electr. Power Energy Syst. 2021, 129, 106775. [Google Scholar] [CrossRef]
- Dastgeer, F.; Anees, H.M.; Gelani, H.E.; Amjad, K.; Javeed, M.R. A basic mathematical testbed for energy efficiency analyses of DC power distribution systems/microgrids. Bull. Electr. Eng. Inform. 2021, 10, 1484–1494. [Google Scholar] [CrossRef]
- Zou, Y.; Zhao, J.; Gao, X.; Chen, Y.; Tohidi, A. Experimental results of electric vehicles effects on low voltage grids. J. Clean. Prod. 2020, 255, 120270. [Google Scholar] [CrossRef]
- Boglou, V.; Karavas, C.-S.; Arvanitis, K.; Karlis, A. A fuzzy energy management strategy for the coordination of electric vehicle charging in low voltage distribution grids. Energies 2020, 13, 3709. [Google Scholar] [CrossRef]
- Spitzer, M.; Schlund, J.; Apostolaki-Iosifidou, E.; Pruckner, M. Optimized integration of electric vehicles in low voltage distribution grids. Energies 2019, 12, 4059. [Google Scholar] [CrossRef] [Green Version]
- Barros, J.; de Apráiz, M.; Diego, R.I. Power Quality in DC Distribution Networks. Energies 2019, 12, 848. [Google Scholar] [CrossRef] [Green Version]
- Staples, J.; Martin, J.; Rajan, S. Standards for the Introduction of Accessible DC Power in Buildings. In Proceedings of the 2019 IEEE Symposium on Product Compliance Engineering (SPCE Austin), Austin, TX, USA, 11–12 November 2019. [Google Scholar]
- Van den Broeck, G.; Stuyts, J.; Driesen, J. A critical review of power quality standards and definitions applied to DC microgrids. Appl. Energy 2018, 229, 281–288. [Google Scholar] [CrossRef]
- IEEE 946-2020. Available online: https://standards.ieee.org/standard/946-2020.html (accessed on 23 June 2021).
- IEEE 1547. Available online: https://standards.ieee.org/standard/1547-2018.html (accessed on 23 June 2021).
- IEEE DC in a Home. Available online: https://standards.ieee.org/content/dam/ieee-standards/standards/web/governance/iccom/IC13-005-02_DC_in_the_Home.pdf (accessed on 23 June 2021).
- UL Standards. Available online: https://standardscatalog.ul.com/ProductDetail.aspx?productId=UL1741 (accessed on 23 June 2021).
Figure 1.
Load model of a typical community distribution system [5].
Figure 1.
Load model of a typical community distribution system [5].

Figure 2.
Load model for LED loads [14].
Figure 2.
Load model for LED loads [14].

Figure 3.
Load modeling presented in various studies [1,2,3,4,5,6,7,8,9,10,11,12,13,14,15,16,17,18,19,20,21,22,23,24,25].

Figure 4.
PEC efficiency presented in various studies [1,2,3,4,5,7,9,11,12,13,15,16,17,18,19,20,21,22,23,24].

Figure 5.
Consideration of voltage levels by various authors [1,2,4,5,6,7,8,9,10,11,12,13,14,15,16,17,18,19,20,21,22,23,24,25].

Figure 6.
Replacement of conventional induction motor with DC motor.

Figure 7.
Overall system model for mathematical analysis.

Figure 8.
Concept for a multi-parameter multi-value efficiency/energy savings analysis.

Figure 9.
Conceptual state flow diagram (only three states shown).

Publisher’s Note: MDPI stays neutral with regard to jurisdictional claims in published maps and institutional affiliations. |
© 2021 by the authors. Licensee MDPI, Basel, Switzerland. This article is an open access article distributed under the terms and conditions of the Creative Commons Attribution (CC BY) license (https://creativecommons.org/licenses/by/4.0/).
Share and Cite
MDPI and ACS Style
Gelani, H.E.; Dastgeer, F.; Nasir, M.; Khan, S.; Guerrero, J.M. AC vs. DC Distribution Efficiency: Are We on the Right Path? Energies 2021, 14, 4039. https://doi.org/10.3390/en14134039
AMA Style
Gelani HE, Dastgeer F, Nasir M, Khan S, Guerrero JM. AC vs. DC Distribution Efficiency: Are We on the Right Path? Energies. 2021; 14(13):4039. https://doi.org/10.3390/en14134039
Chicago/Turabian StyleGelani, Hasan Erteza, Faizan Dastgeer, Mashood Nasir, Sidra Khan, and Josep M. Guerrero. 2021. "AC vs. DC Distribution Efficiency: Are We on the Right Path?" Energies 14, no. 13: 4039. https://doi.org/10.3390/en14134039
Note that from the first issue of 2016, this journal uses article numbers instead of page numbers. See further details here.