
Economic Evaluation of Wind Power Projects in a Mix of Free and Regulated Market Environments in Brazil


Abstract
:1. Introduction
2. The Brazilian Electricity System
2.1. Electricity Market Organization
2.2. Wind Power in Brazil
3. Materials and Methods
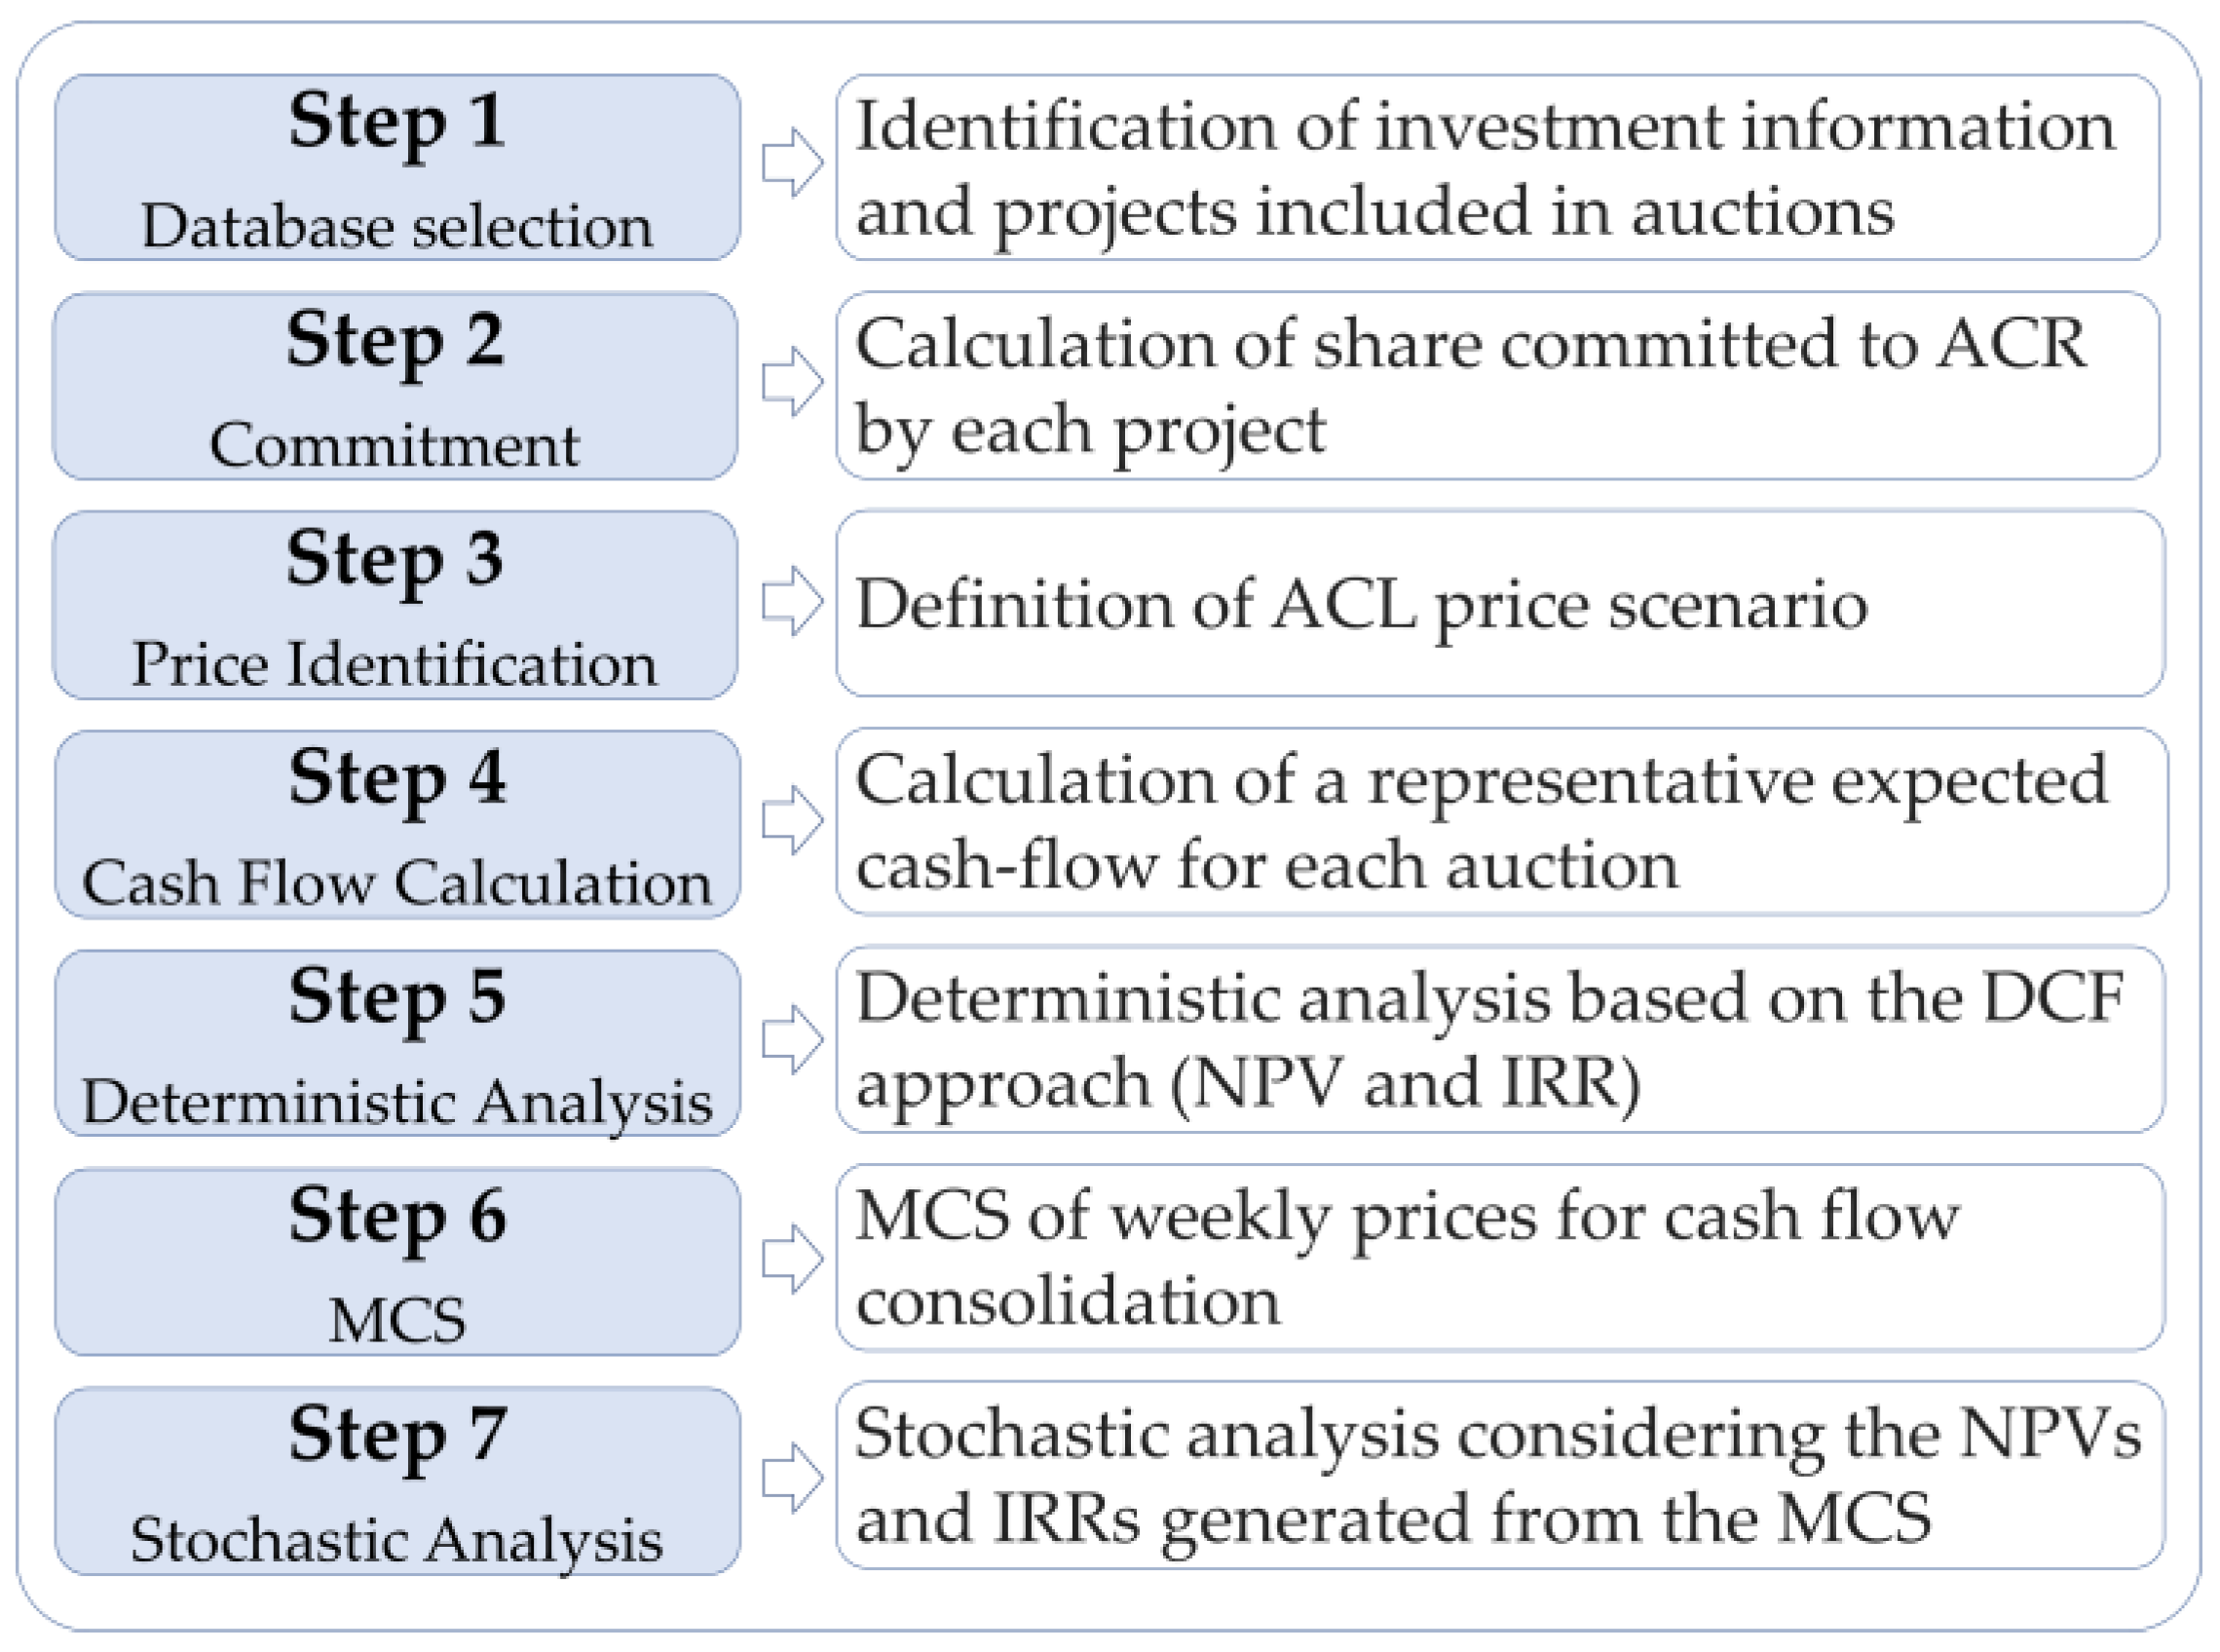
3.1. Methdological Procedure
3.2. Data and Cash-Flow Model
4. Results
4.1. Deterministic Analysis
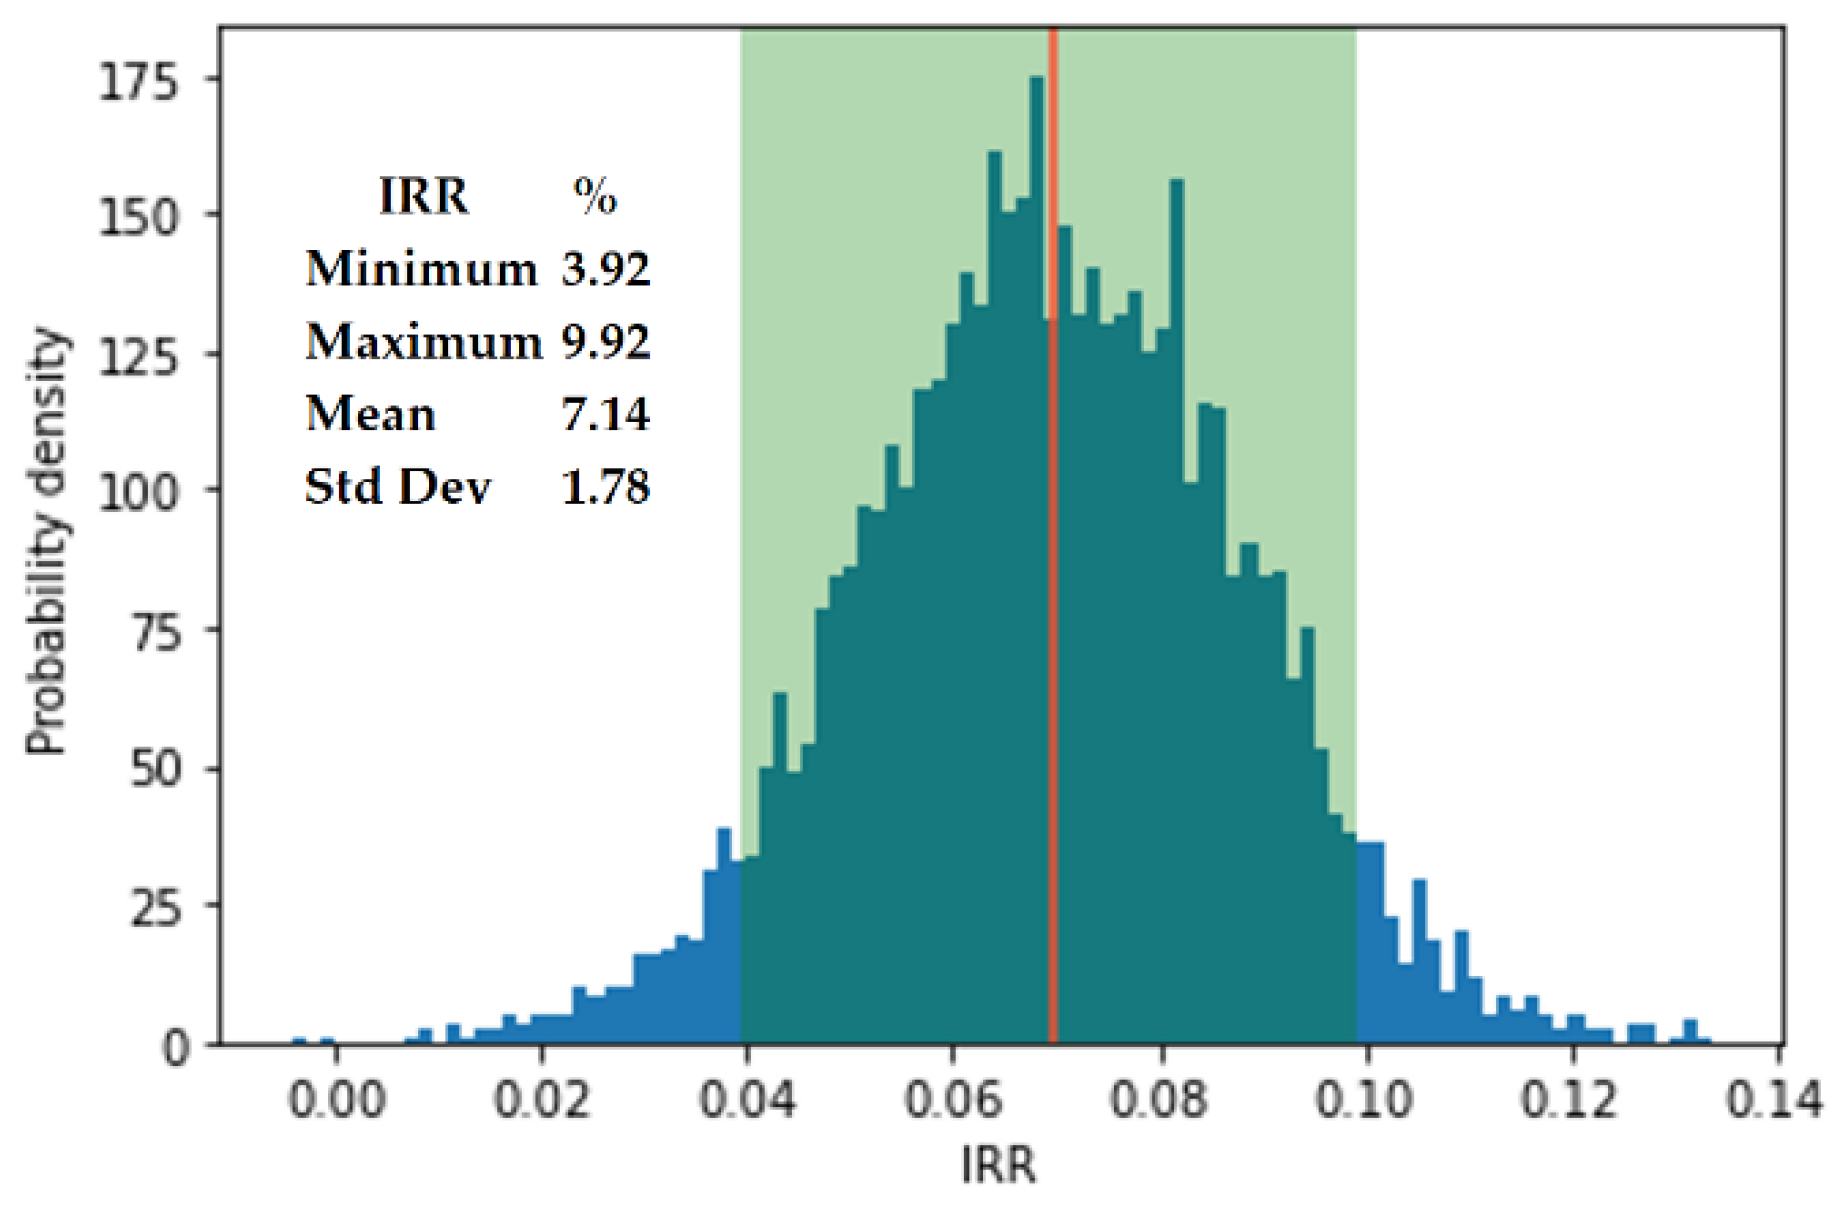
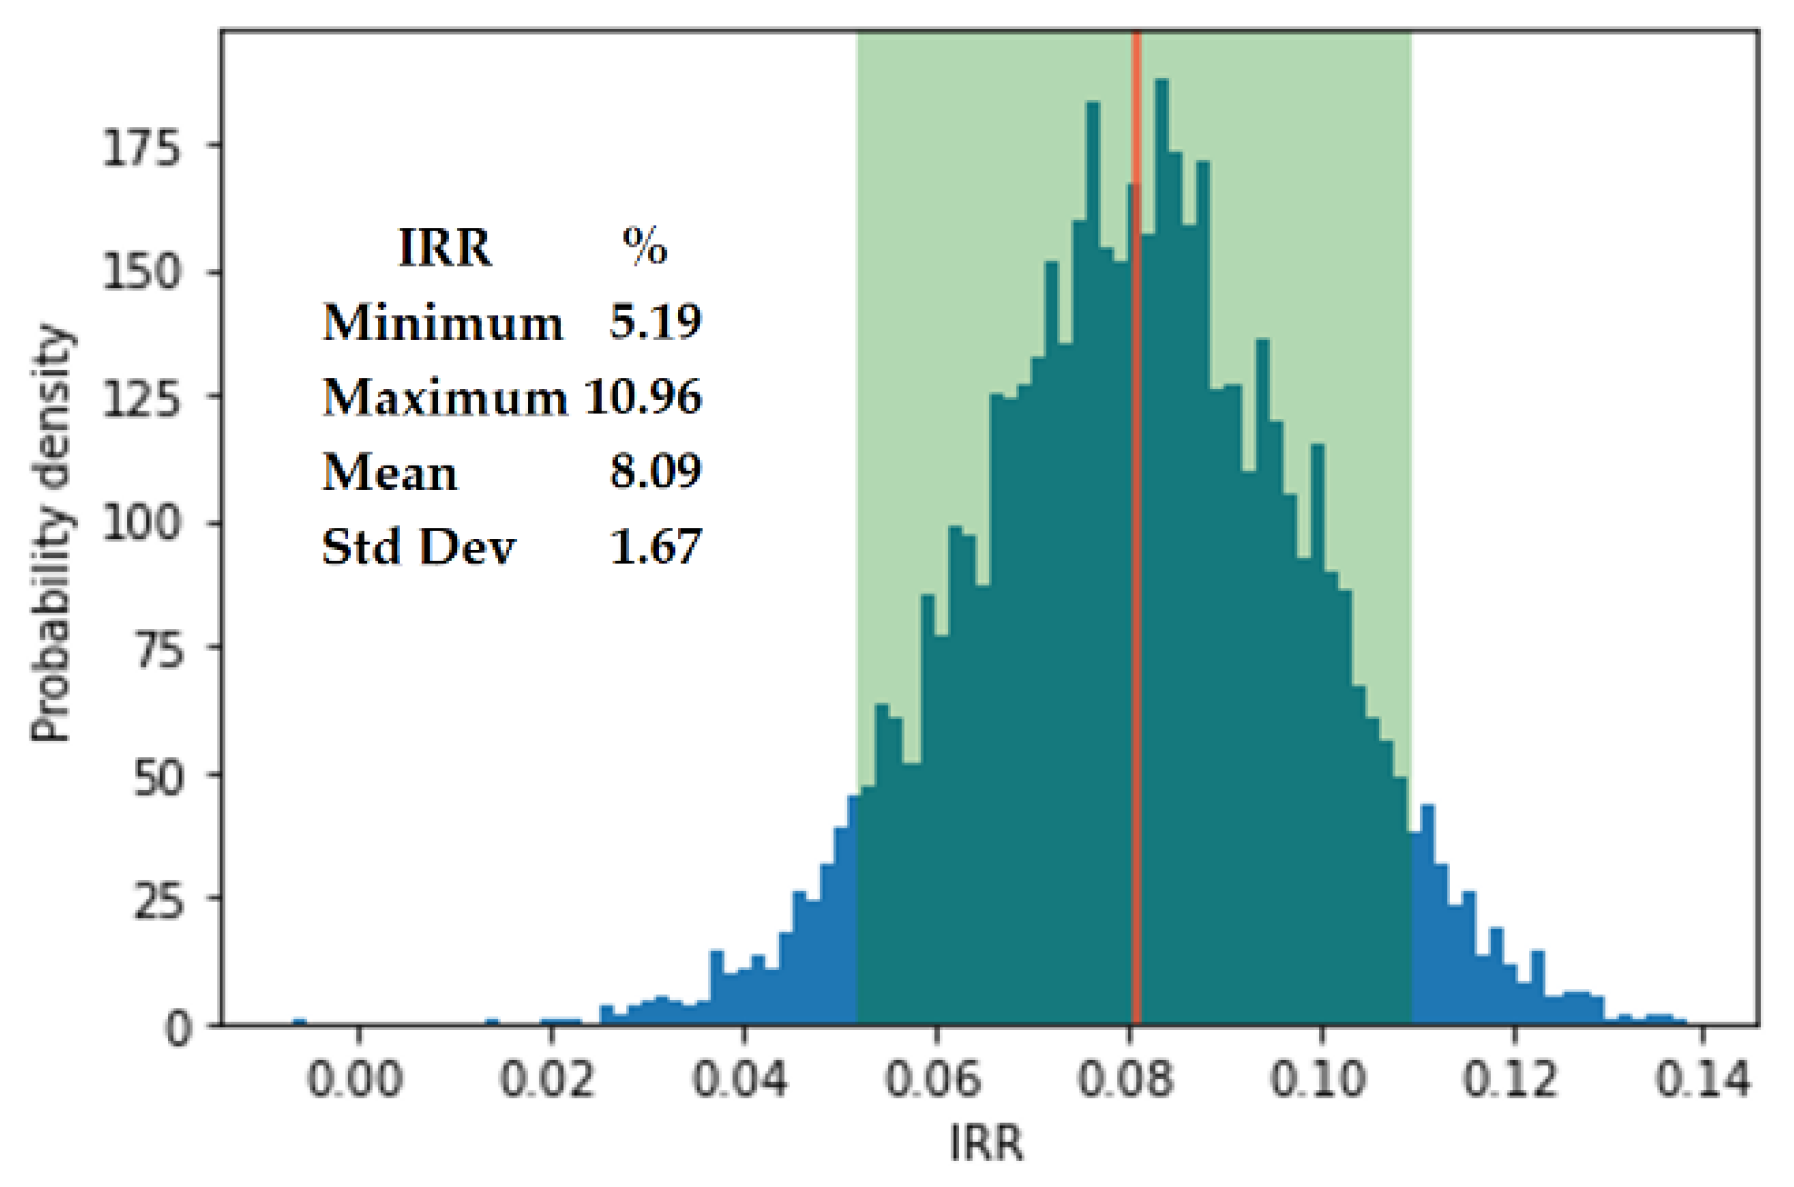
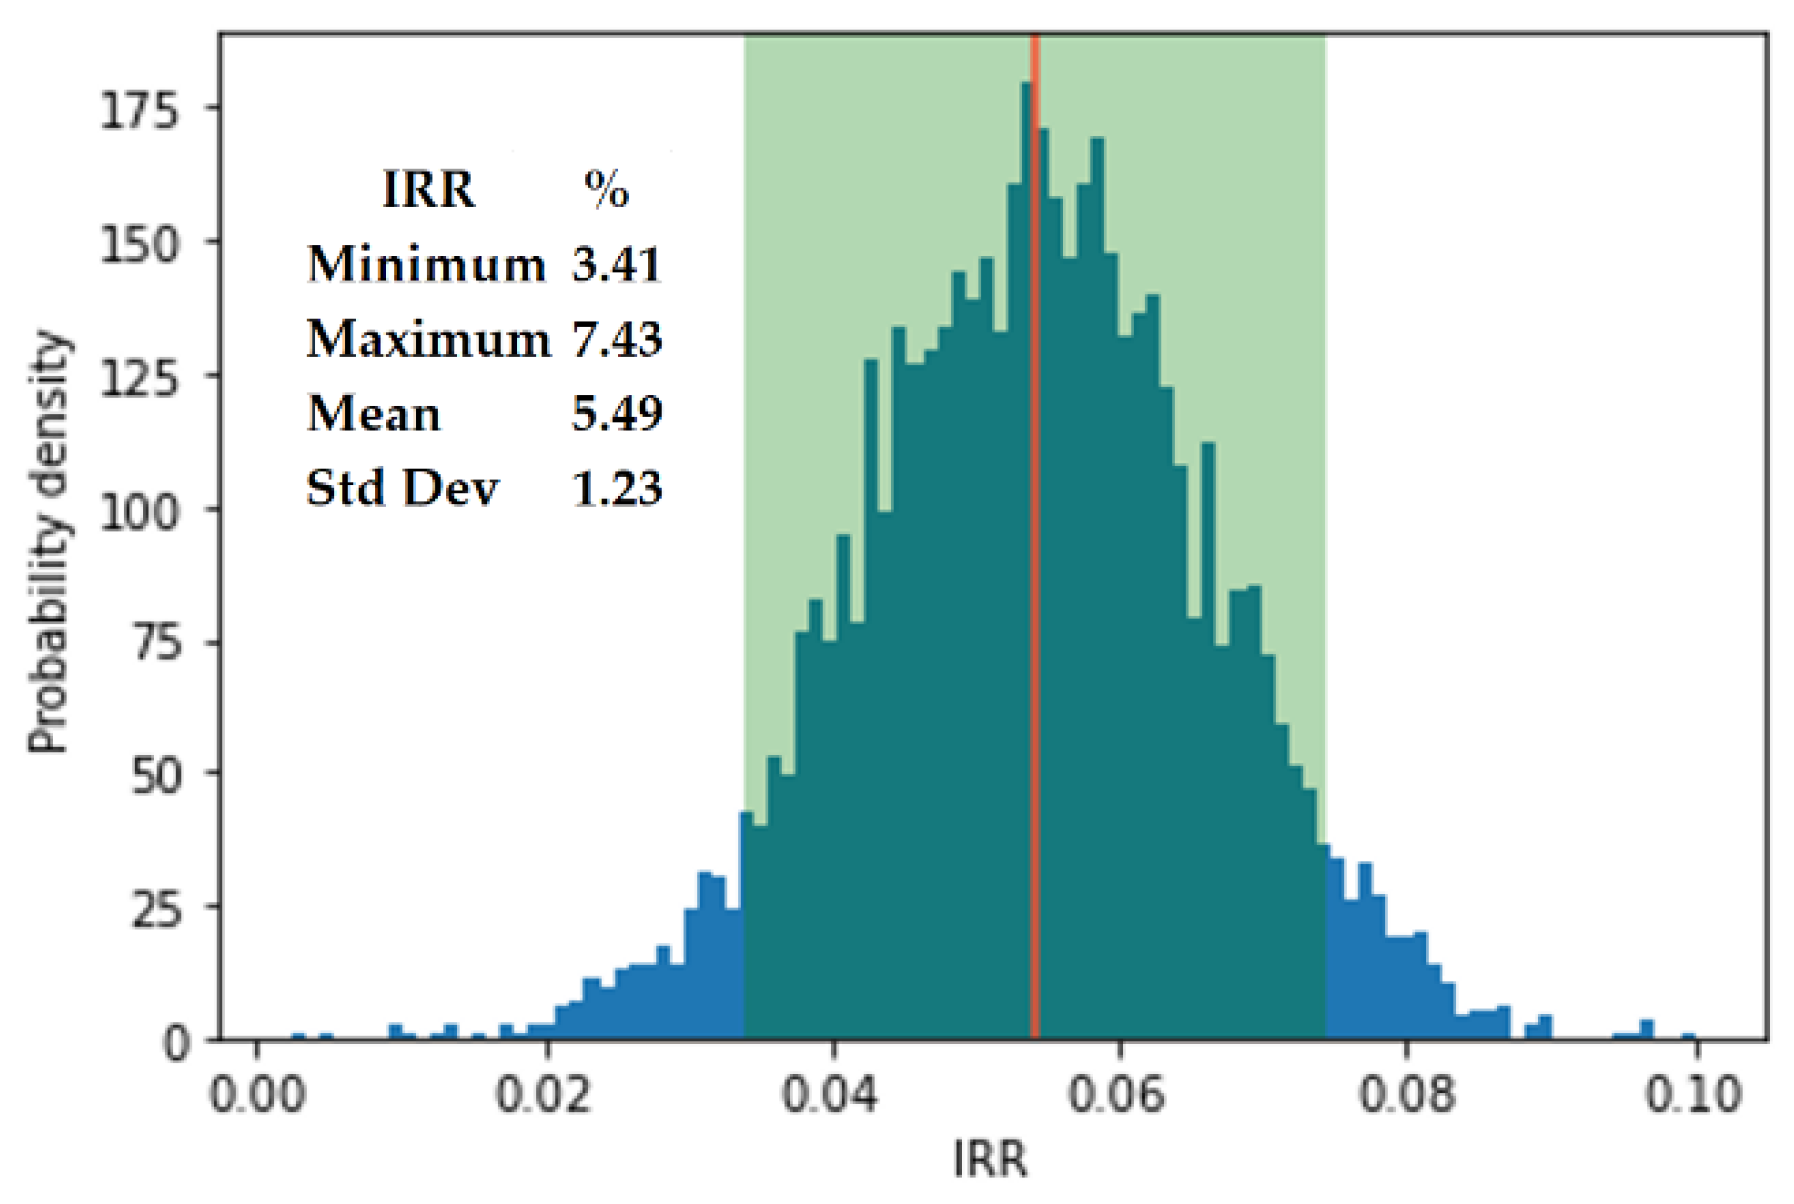
4.2. Stochastic Analysis
4.2.1. Ex-Ante Average Prices (Scenario C)
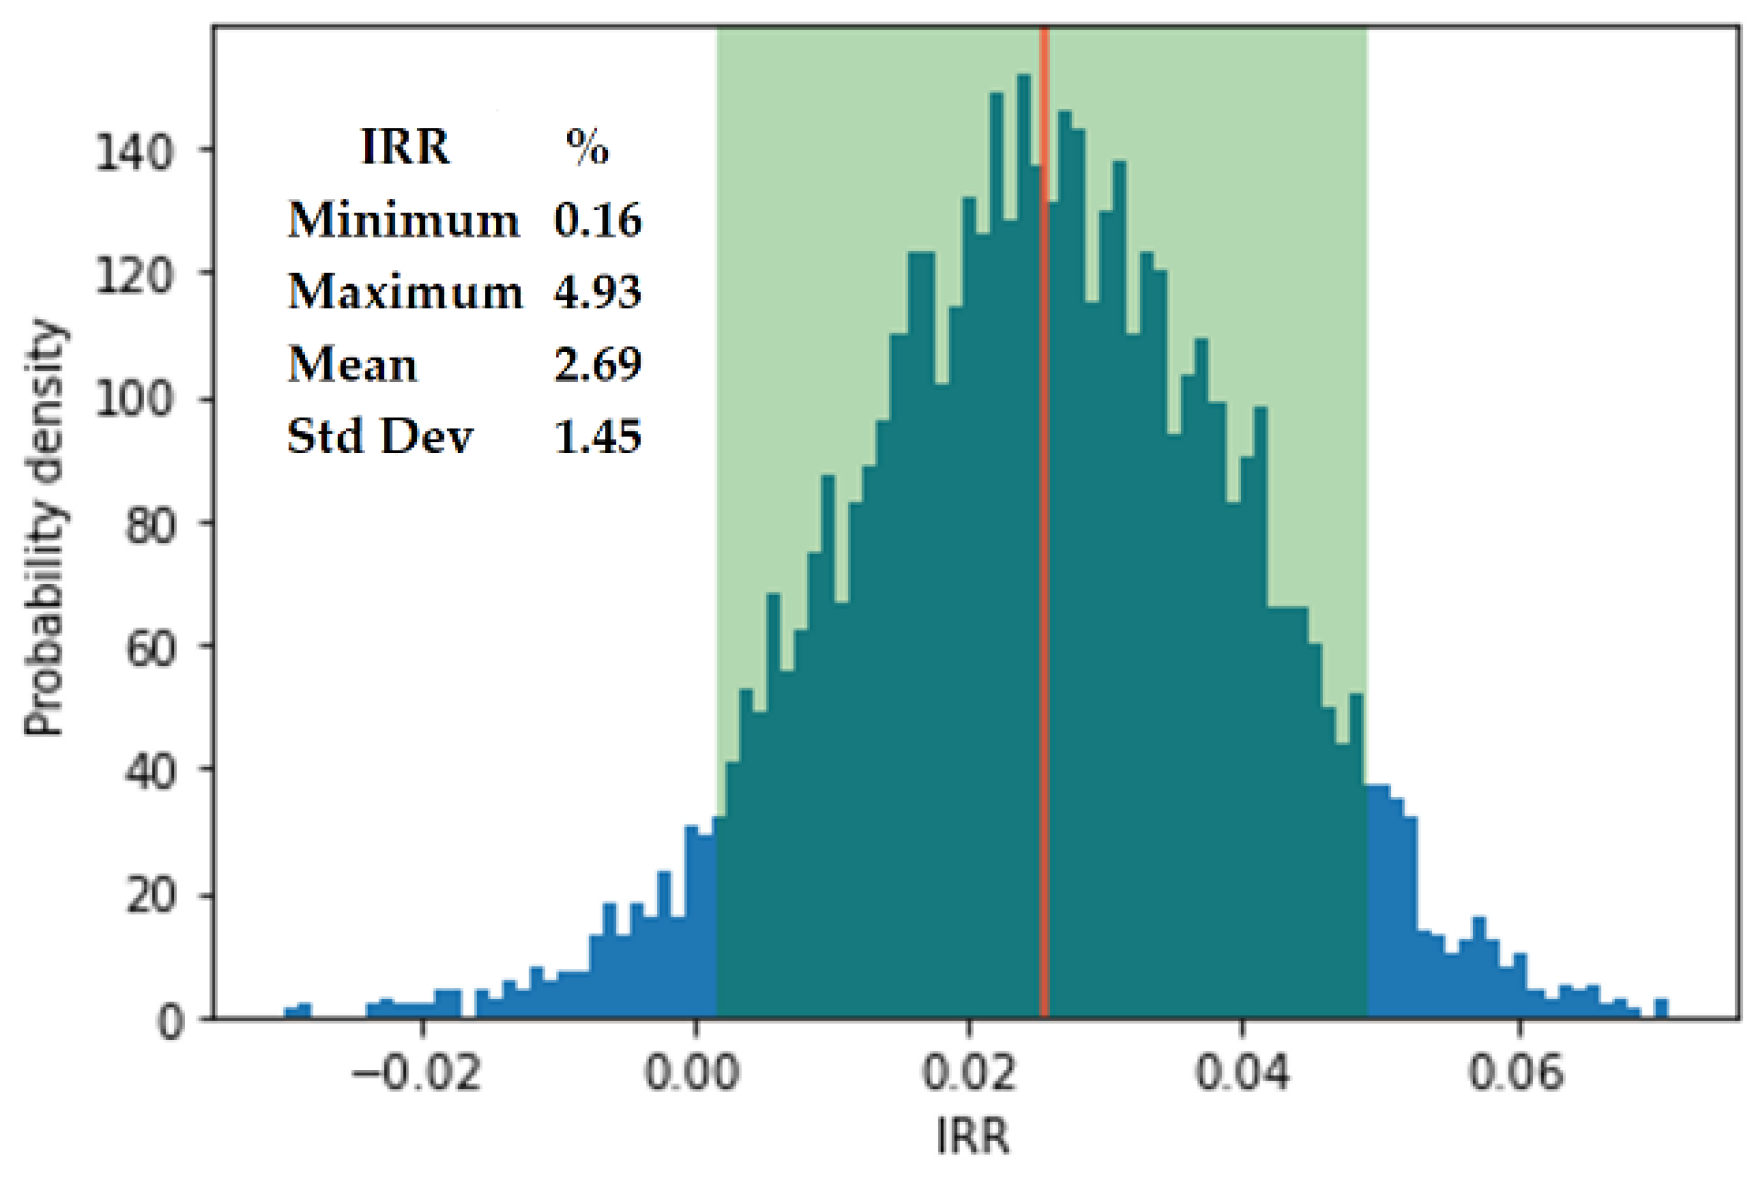
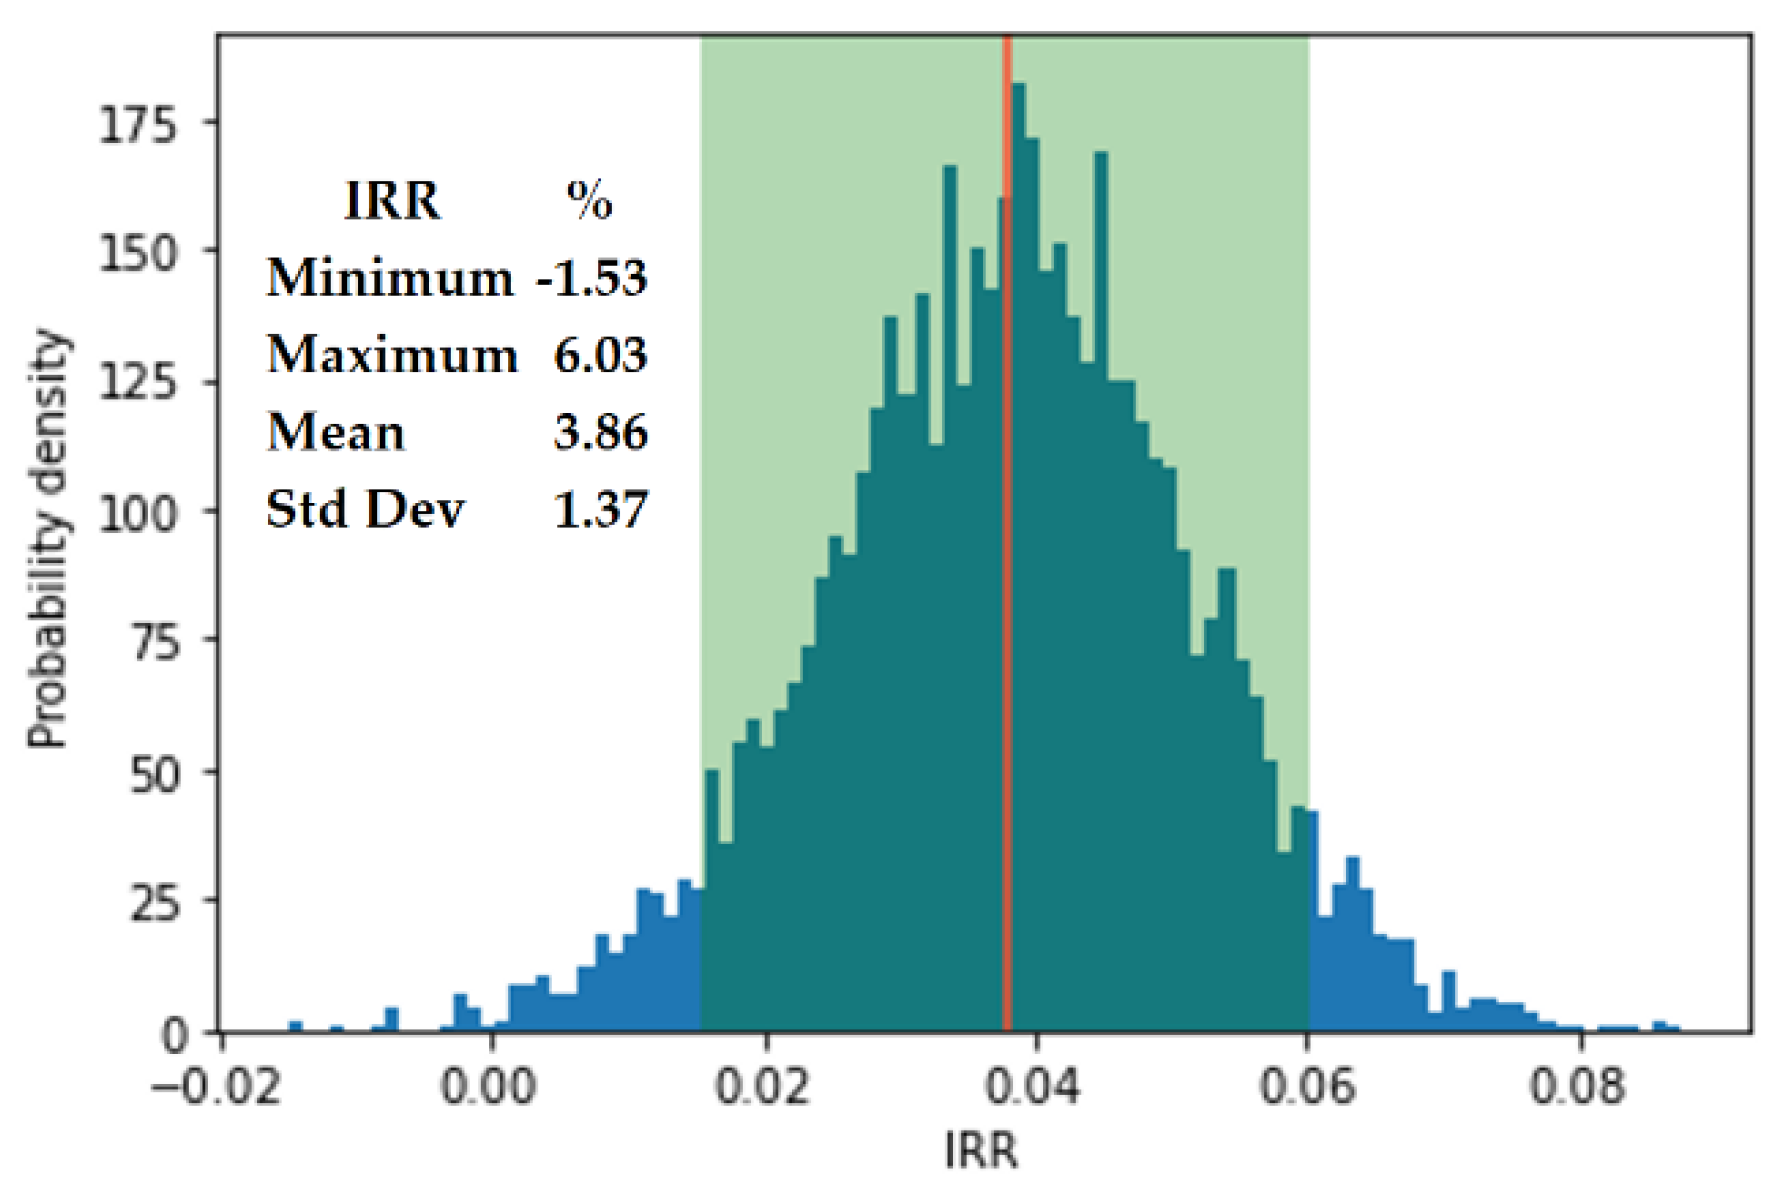
4.2.2. Ex-Post Average Prices (Scenario D)
5. Discussion
6. Conclusions
Author Contributions
Funding
Institutional Review Board Statement
Informed Consent Statement
Data Availability Statement
Conflicts of Interest
References
- IEA. Global CO2 emissions in 2019, Paris. 2020. Available online: https://www.iea.org/articles/global-co2-emissions-in-2019 (accessed on 28 September 2020).
- BP. Statistical Review of World Energy. 2019. Available online: https://www.bp.com/content/dam/bp/business-sites/en/global/corporate/pdfs/energy-economics/statistical-review/bp-stats-review-2019-full-report.pdf (accessed on 28 November 2020).
- United Nations. Sustainable Development Goals. 2020. Available online: https://www.undp.org/content/undp/en/home/sustainable-development-goals.html (accessed on 28 November 2020).
- De Queiroz, A.R. Stochastic hydro-thermal scheduling optimization: An overview. Renew. Sustain. Energy Rev. 2016, 62, 382–395. [Google Scholar] [CrossRef]
- ANEEL. Sistema de Informações de Geração da ANEEL—SIGA. 2020. Available online: https://www.aneel.gov.br/siga (accessed on 20 January 2021).
- ABEEOLICA. INFOWIND. 2020. Available online: http://abeeolica.org.br/wp-content/uploads/2020/06/InfoventoEN_16.pdf (accessed on 28 January 2021).
- De Jong, P.; Dargaville, R.; Silver, J.; Utembe, S.; Kiperstok, A.; Torres, E.A. Forecasting high proportions of wind energy supplying the Brazilian Northeast electricity grid. Appl. Energy 2017, 195, 538–555. [Google Scholar] [CrossRef]
- EPE. Participação de Empreendimentos Eólicos nos Leilões de Energia no Brasil, Rio de Janeiro—RJ. 2018. Available online: https://www.epe.gov.br/sites-pt/publicacoes-dados-abertos/publicacoes/PublicacoesArquivos/publicacao-251/topico-394/NT_EPE-DEE-NT-041_2018-r0.pdf (accessed on 30 January 2021).
- Da Silva, N.F.; Rosa, L.P.; Freitas, M.A.V.; Pereira, M.G. Wind energy in Brazil: From the power sector’s expansion crisis model to the favorable environment. Renew. Sustain. Energy Rev. 2013, 22, 686–697. [Google Scholar] [CrossRef]
- Pereira, M.G.; Camacho, C.F.; Freitas, M.A.V.; da Silva, N.F. The renewable energy market in Brazil: Current status and potential. Renew. Sustain. Energy Rev. 2012, 16, 3786–3802. [Google Scholar] [CrossRef]
- CCEE. Setor Elétrico. 2019. Available online: https://www.ccee.org.br/portal/faces/pages_publico/onde-atuamos/setor_eletrico?_adf.ctrl-state=68ttd253h_103&_afrLoop=5168273257385 (accessed on 20 February 2021).
- Dalbem, M.C.; Brandão, L.E.T.; Gomes, L.L. Can the regulated market help foster a free market for wind energy in Brazil? Energy Policy 2014, 66, 303–311. [Google Scholar] [CrossRef]
- Aquila, G.; Rocha, L.C.S.; Junior, P.R.; Pamplona, E.d.; de Queiroz, A.R.; de Paiva, A.P. Wind power generation: An impact analysis of incentive strategies for cleaner energy provision in Brazil. J. Clean. Prod. 2016, 137, 1100–1108. [Google Scholar] [CrossRef]
- Aquila, G.; Junior, P.R.; Pamplona, E.d.; de Queiroz, A.R. Wind power feasibility analysis under uncertainty in the Brazilian electricity market. Energy Econ. 2017, 65, 127–136. [Google Scholar] [CrossRef]
- Bradshaw, A. Regulatory change and innovation in Latin America: The case of renewable energy in Brazil. Util. Policy 2017, 49, 156–164. [Google Scholar] [CrossRef]
- de Souza, F.C.; Legey, L.F.L. Brazilian electricity market structure and risk management tools. In Proceedings of the 2008 IEEE Power and Energy Society General Meeting-Conversion and Delivery of Electrical Energy in the 21st Century, Pittsburgh, PA, USA, 20–24 July 2008; pp. 1–8. [Google Scholar]
- Juárez, A.A.; Araújo, A.M.; Rohatgi, J.S.; de Oliveira Filho, O.D.Q. Development of the wind power in Brazil: Political, social and technical issues. Renew. Sustain. Energy Rev. 2014, 39, 828–834. [Google Scholar] [CrossRef]
- Federative Units of Brazil. LAW N. 10,848, 15 March 2004. Regulates the Sale of Electric Energy. 2004. Available online: http://www.planalto.gov.br/ccivil_03/_ato2004-2006/2004/lei/l10.848.htm (accessed on 20 February 2021).
- CCEE. PLD Preços Médios. 2020. Available online: https://www.ccee.org.br/portal/faces/pages_publico/o-que-fazemos/como_ccee_atua/precos/precos_medios?_afrLoop=517725417725855&_adf.ctrl-state=w2rc8dbwt_1#!%40%40%3F_afrLoop%3D517725417725855%26_adf.ctrl-state%3Dw2rc8dbwt_5 (accessed on 20 February 2021).
- Pao, H.-T.; Fu, H.-C. Renewable energy, non-renewable energy and economic growth in Brazil. Renew. Sustain. Energy Rev. 2013, 25, 381–392. [Google Scholar] [CrossRef]
- EPE. Balanço Energético Nacional 2020: Ano Base 2019. Rio de Janeiro—RJ. 2020. Available online: https://www.epe.gov.br/sites-pt/publicacoes-dados-abertos/publicacoes/PublicacoesArquivos/publicacao-479/topico-521/RelatórioSínteseBEN2020-ab2019_Final.pdf (accessed on 20 March 2021).
- Simas, M.; Pacca, S. Assessing employment in renewable energy technologies: A case study for wind power in Brazil. Renew. Sustain. Energy Rev. 2014, 31, 83–90. [Google Scholar] [CrossRef]
- EPE. Plano Decenal de Expansão de Energia 2029. Brasília-DF. 2019. Available online: http://www.mme.gov.br/c/document_library/get_file?uuid=a18d104e-4a3f-31a8-f2cf-382e654dbd20&groupId=36189 (accessed on 20 March 2021).
- IRENA. Renewable Energy Capacity Statistics 2020. 2020. Available online: File:///C:/Users/vande/Downloads/IRENA_RE_Capacity_Statistics_2020.pdf (accessed on 20 March 2021).
- Abraceel. Nordeste é Responsável por 86% da Produção de Energia Eólica no País. 2019. Available online: https://abraceel.com.br/clipping/2019/05/nordeste-e-responsavel-por-86-da-producao-de-energia-eolica-no-pais (accessed on 20 September 2020).
- MME. Portaria N. 101. 2016. Available online: http://www2.aneel.gov.br/cedoc/prt2016101mme.pdf (accessed on 20 September 2020).
- Lai, C.S.; Locatelli, G. Economic and financial appraisal of novel large-scale energy storage technologies. Energy 2021, 214, 118954. [Google Scholar] [CrossRef]
- Pindyck, R.S. The dynamics of commodity spot and futures markets: A primer. Energy J. 2001, 22. [Google Scholar] [CrossRef] [Green Version]
- de Abreu Pereira Uhr, D.; Chagas, A.L.S.; Uhr, J.G.Z. Estimation of elasticities for electricity demand in Brazilian households and policy implications. Energy Policy 2019, 129, 69–79. [Google Scholar] [CrossRef]
- Custódio, R.S. Energia Eólica Para Produção de Energia Elétrica; Synergia: Rio de Janeiro, Spain, 2013. [Google Scholar]
- de Energia, C.C.P. Manual de Avaliação Técnico-Econômica de Empreendimentos Eólicos-Elétricos Curitiba-PR. 2007. Available online: File:///C:/Users/vande/Downloads/ManualdeAvaliacaoTecnicoEconomicadeEmpreendimentosEolioEletricos.pdf (accessed on 20 January 2021).
- Aquila, G.; de Queiroz, A.R.; Balestrassi, P.P.; Junior, P.R.; Rocha LC, S.; Pamplona, E.O.; Nakamura, W.T. Wind energy investments facing uncertainties in the Brazilian electricity spot market: A real options approach. Sustain. Energy Technol. Assess. 2020, 42, 100876. [Google Scholar] [CrossRef]
- ANEEL. Nota Técnica n° 146/2018-SGT/ANEEL. Estabelecimento das Tarifas de Uso do Sistema de Transmissão—T U S T para o Ciclo 2018–2019. 2018. Available online: https://www.aneel.gov.br/consultas-publicas-antigas?p_p_id=participacaopublica_WAR_participacaopublicaportlet&p_p_lifecycle=2&p_p_state=normal&p_p_mode=view&p_p_cacheability=cacheLevelPage&p_p_col_id=column-2&p_p_col_pos=1&p_p_col_count=2&_participacaopub (accessed on 20 January 2021).
- ANEEL. Resolução Normativa n. 77. 2004. Available online: http://www2.aneel.gov.br/cedoc/bren2004077.pdf (accessed on 20 September 2020).
- ANEEL. Diretoria da ANEEL Aprova Nova Metodologia Para WACC. 2020. Available online: http://bit.ly/2Q3iTDf (accessed on 20 March 2021).
- Federative Units of Brazil. LAW N. 12,783, From January 2013. 2013. Available online: http://www.planalto.gov.br/ccivil_03/_ato2011-2014/2013/lei/l12783.htm (accessed on 20 March 2021).
- ANEEL. Limites do PLD Para 2018 São Homologados. 2018. Available online: https://www.aneel.gov.br/sala-de-imprensa-exibicao-2/-/asset_publisher/zXQREz8EVlZ6/content/limites-do-pld-para-2018-sao-homologados/656877/pop_up?_101_INSTANCE_zXQREz8EVlZ6_viewMode=print&_101_INSTANCE_zXQREz8EVlZ6_languageId=pt_BR (accessed on 20 September 2020).
- ANEEL. Audiência Pública Sobre Limites de PLD. 2019. Available online: https://www.aneel.gov.br/sala-de-imprensa-exibicao-2/-/asset_publisher/zXQREz8EVlZ6/content/audiencia-publica-sobre-limites-de-pld-recebe-contribuicoes-ate-2-8-2019/656877/pop_up?_101_INSTANCE_zXQREz8EVlZ6_viewMode=print&_101_INSTANCE_zXQREz8EVlZ6_languag (accessed on 20 September 2020).
- CCEE. Weekly PLD Average Prices. 2021. Available online: https://www.ccee.org.br/portal/faces/preco_horario_veja_tambem/preco_media_semanal?_adf.ctrl-state=19e1rie1ii_1&_afrLoop=218510562303619 (accessed on 20 March 2021).


| Characteristics | ACL Market | ACR Market |
|---|---|---|
| Participants | Generators, traders, free and special consumers | Generators, distributors, and traders |
| Contracts | Free negotiation between buyers and sellers | Energy auctions promoted by CCEE, delegated by the regulatory agency (ANEEL) |
| Kind of Contract | Freely established agreement between the agents | Regulated by ANEEL. Called Electric Energy Trading Contract in the Regulated Environment. (CCEAR) |
| Price | Freely agreed between the agents | Given in the auction |
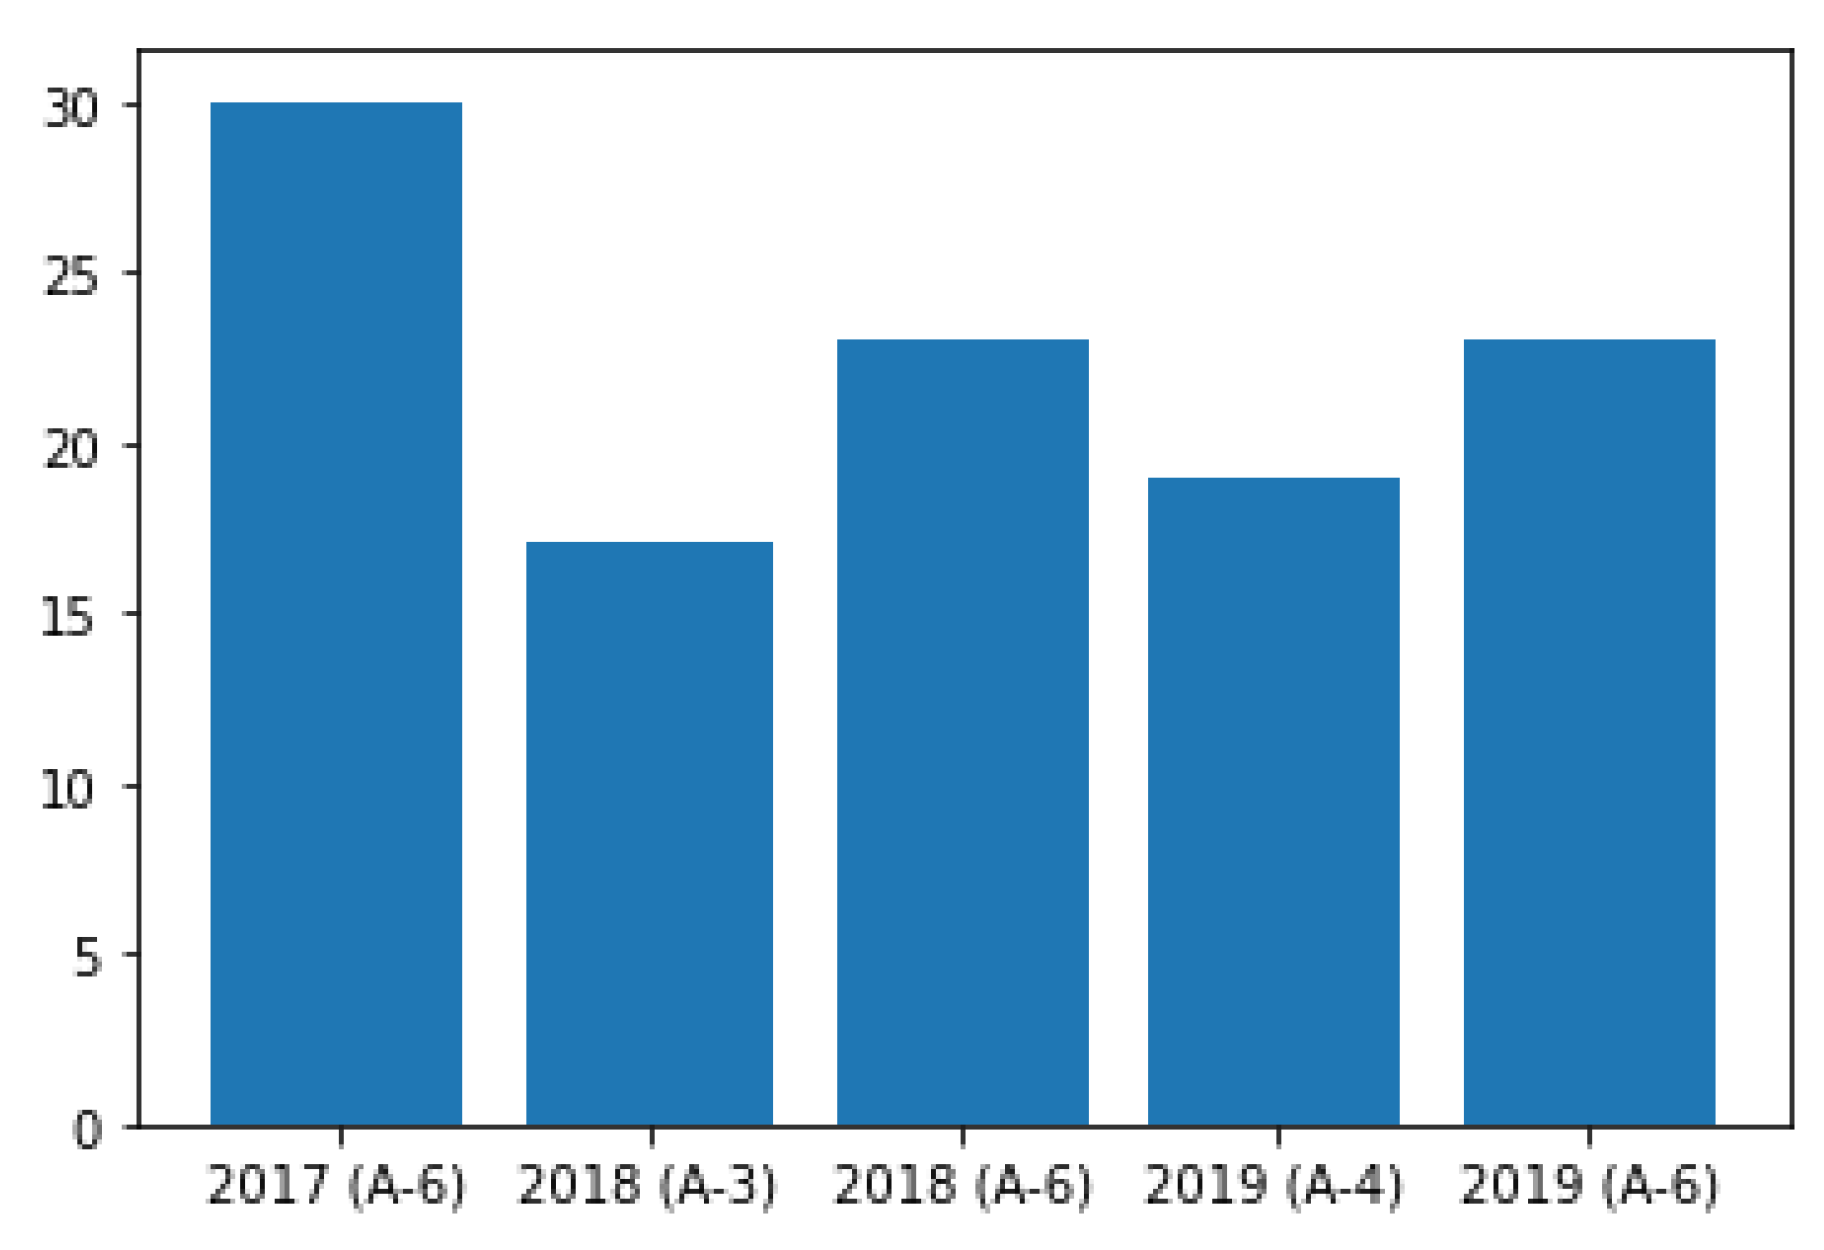
| Year | Number of Companies | Auction | % | Standard Deviation (%) |
|---|---|---|---|---|
| 2018 | 48 | 28 | 54.69 | 27.03 |
| 2019 | 3 | 29 | 30.24 | 0.17 |
| 2019 | 44 | 30 | 36.27 | 17.13 |
| Total | 95 | Average | 40.04% |
| Price\Year | 2018 | 2019 |
|---|---|---|
| Min. (A) | 10.37 | 10.23 |
| Max. (B) | 130.53 | 124.12 |
| Average (C) | 70.45 | 67.17 |
| Average (D) | 70.78 | 40.39 |
| Auction | Projects’ Investments Costs (USD) | Installed Power (MW) | ||||||
|---|---|---|---|---|---|---|---|---|
| Min | Max | Average | Std. Dev. | Min | Max | Average | Std. Dev. | |
| 28 | 9,767,441 | 89,534,883 | 31,410,153 | 16,851,000 | 8.4 | 69.3 | 26.05 | 15.09 |
| 29 | 20,803,442 | 53,875,657 | 42,851,585 | 15,590,391 | 21 | 37.1 | 31.73 | 7.59 |
| 30 | 8,115,942 | 73,043,478 | 24,642,585 | 14,161,714 | 8.4 | 75.6 | 23.64 | 13.83 |
| Cash Flow Assumptions | ACRCF | ACLCF |
|---|---|---|
| Initial Investment | Auction 28: 31,410,153 Auction 29: 42,851,585 Auction 30: 24,642,585 | |
| Duration (Years) | 20 | |
| Estimated Production (MWh/year) | Auction 28: 76,668 Auction 29: 44,384 Auction 30: 36,055 | Auction 28: 43,556 Auction 29: 102,270 Auction 30: 59,549 |
| Price (USD/MWh) | Auction 28: 23.31 Auction 29: 19.32 Auction 30: 23.85 | Table 3 |
| Weekly Volatility (%) | - | 34.75 |
| Revenue (USD) | Price × Estimated Production | Price × Estimated Production |
| (−) PIS/PASEP (% of Revenue) | 1.65 | 1.65 |
| (−) COFINS (% of Revenue) | 7.6 | 7.6 |
| (−) Operational Costs (% of Revenue) | 12.5 | 12.5 |
| (−) ONS/CCEE tariff (% of Revenue) | 1 | 1 |
| (−) Leasing (% of Revenue) | 1 | 1 |
| (−) Transmission cost (USD/kWh) | Auction 28: 30.12 Auction 29: 43.71 Auction 30: 28.49 | - |
| (=) Cash Flow | (USD) | (USD) |
| (−) Depreciation (% of Revenue) | 5 | 5 |
| (=) Taxable Cash Flow | (USD) | (USD) |
| (−) Social Contribution | (% Taxable Cash Flow) | (% Taxable Cash Flow) |
| (−) Income Tax | (% Taxable Cash Flow) | (% Taxable Cash Flow) |
| (+) Depreciation | (USD) | (USD) |
| (=) Free Cash Flow | (USD) | (USD) |
| Scenarios | Auction | NPV (USD) | IRR (%) | IRR–WACC (%) |
|---|---|---|---|---|
| A | 28th | −18,993,520 | −1.53 | −9.19 |
| 29th | −31,649,641 | −5.11 | −12.50 | |
| 30th | −16,331,533 | −3.04 | −10.43 | |
| B | 28th | 7,761,046 | 10.33 | 2.67 |
| 29th | 29,364,263 | 14.07 | 6.68 | |
| 30th | 19,310,951 | 14.90 | 7.51 | |
| C | 28th | −5,619,755 | 5.46 | −2.20 |
| 29th | −1,129,753 | 7.09 | −0.30 | |
| 30th | 1,538,147 | 8.09 | 0.7 | |
| D | 28th | −5,543,244 | 5.49 | −2.17 |
| 29th | −15,557,752 | 2.64 | −4.75 | |
| 30th | −6,880,476 | 3.86 | −3.53 |
Publisher’s Note: MDPI stays neutral with regard to jurisdictional claims in published maps and institutional affiliations. |
© 2021 by the authors. Licensee MDPI, Basel, Switzerland. This article is an open access article distributed under the terms and conditions of the Creative Commons Attribution (CC BY) license (https://creativecommons.org/licenses/by/4.0/).
Share and Cite
Delapedra-Silva, V.A.; Ferreira, P.; Cunha, J.; Kimura, H. Economic Evaluation of Wind Power Projects in a Mix of Free and Regulated Market Environments in Brazil. Energies 2021, 14, 3325. https://doi.org/10.3390/en14113325
Delapedra-Silva VA, Ferreira P, Cunha J, Kimura H. Economic Evaluation of Wind Power Projects in a Mix of Free and Regulated Market Environments in Brazil. Energies. 2021; 14(11):3325. https://doi.org/10.3390/en14113325
Chicago/Turabian StyleDelapedra-Silva, Vanderson Aparecido, Paula Ferreira, Jorge Cunha, and Herbert Kimura. 2021. "Economic Evaluation of Wind Power Projects in a Mix of Free and Regulated Market Environments in Brazil" Energies 14, no. 11: 3325. https://doi.org/10.3390/en14113325