Article

Can Green Hydrogen Production Be Economically Viable under Current Market Conditions

Department of Systems and Control, Jožef Stefan Institute, Jamova cesta 39, 1000 Ljubljana, Slovenia
*
Author to whom correspondence should be addressed.
Energies 2020, 13(24), 6599; https://doi.org/10.3390/en13246599
Submission received: 10 November 2020 / Revised: 4 December 2020 / Accepted: 9 December 2020 / Published: 14 December 2020
(This article belongs to the Special Issue Renewables-Based Microgrids)

Abstract

:
This paper discusses the potential of green hydrogen production in a case study of a Slovenian hydro power plant. To assess the feasibility and eligibility of hydrogen production at the power plant, we present an overview of current hydrogen prices and the costs of the power-to-gas system for green hydrogen production. After defining the production cost for hydrogen at the case study hydro power plant, we elaborate on the profitability of hydrogen production over electricity. As hydrogen can be used as a sustainable energy vector in industry, heating, mobility, and the electro energetic sectors, we discuss the current competitiveness of hydrogen in the heating and transport sectors. Considering the current prices of different fuels, it is shown that hydrogen can be competitive in the transport sector if it is unencumbered by various environmental taxes. The second part of the paper deals with hydrogen production in the context of secondary control ancillary service provided by a case study power plant. Namely, hydrogen can be produced during the time period when there is no demand for extra electric power within a secondary control ancillary service, and thus the economics of power plant operation can be improved.

1. Introduction

Global energy consumption, greenhouse gas emissions, and air pollution continue to increase; therefore, it is necessary to develop and introduce new alternatives to fossil fuels. Further, growth in greenhouse gas emissions and dependence on fossil energy sources are strong reasons for transitioning to new alternatives and for encouraging industrial actors to invest in different technologies. Green hydrogen [1] is a promising solution towards a decarbonized energy system, as it can be used for long term energy storage from renewable energy sources, for substitution of fossil fuels in mobility and heating sectors, and as a clean feedstock for industry. However, its current production methods are not in accordance with long-term climate and energy goals. Today, the global supply of hydrogen to industrial users is an important economic activity worldwide and in 2018, exceeded 74 million tonnes. Demand for hydrogen, which has grown more than threefold since 1975, is still rising and is mostly produced from fossil fuels (grey and brown hydrogen), where 6% of natural gas and 2% of coal goes to hydrogen production [2]. Today’s production and consumption of hydrogen is mostly related (over 90%) to industrial use.
The EU consumes around one tenth of the world’s hydrogen production, with an industry sector market share of 90%. The main EU industrial consumers are the chemical industry (63%), refineries (30%), metalworking (6%), and others (1%). It is estimated that by the year 2025 there will be a more or less constant global growth at the current rate of 3.5% [3].
Within the chemical sector, hydrogen is used mainly for: ammonia (84%), methanol (12%), polyurethane (2%), nylon (2%). The total annual amount of hydrogen used in the EU chemical sector is around 4.5 million tonnes. Refineries are the second largest consumers at 2.1 million tonnes of H2/year. Here, hydrogen is used for the hydrogenation process and for the extraction of lighter derivatives. The production and processing of metals involves the use of hydrogen as a reducing agent (i.e., reductant) in the processing of iron ore (and other metal ores) and for providing an appropriate atmosphere in the processing of metals. The annual consumption is about 0.42 million tonnes. Other EU industrial consumers are the electronics industry, food production, the glass industry, the cooling of major power generators, etc., which together consume less than 1% of the EU’s annual H2 consumption [3].
The following states the current and future potentials for hydrogen use in the EU and worldwide [3]:
  • Today, industry prevails in total hydrogen consumption. The main consumers are plants for the production of ammonia, methanol, and steel. Almost all hydrogen is produced using fossil fuels, so there is great potential for reducing emissions using clean and ecologically acceptable (green) hydrogen.
  • The competitiveness of electric vehicles with hydrogen fuel cells in traffic is conditioned by the costs of fuel cells and hydrogen fueling stations, while the priority for trucks and buses is to reduce the price of supplied hydrogen. Shipping and aviation have limited opportunities to use low-carbon fuels, so new hydrogen-based fuels (synthesized hydrocarbon fuels) are an opportunity to use green hydrogen also in aviation.
  • In urban areas, hydrogen can be injected directly into existing natural gas pipelines, with the greatest potential in family households and commercial buildings, especially in dense urban areas, while long-term options could include the use of pure hydrogen in hydrogen gas burners or fuel cells.
  • In electric energy production, hydrogen is one of the leading options for storing of temporal excesses of electric energy. Hydrogen can be used in gas turbines to increase the flexibility and robustness of the power systems, and hydrogen produced ammonia could be used in coal-fired power plants to reduce emissions.
There are many ways to produce hydrogen, each of which varies substantially according to the cost scheme. Today, steam methane reforming (SMR) is the most common and cost-effective method for hydrogen production [4]. As this technology is mature, fluctuations in the cost of hydrogen production today largely depend on the price of natural gas [3]. The steam reforming process generates CO2 emissions, so the result is not green hydrogen. As a result, global hydrogen production from fossil fuels is currently responsible for around 830 million tonnes of carbon dioxide per year.
Thus, it is even more important that in the future we use green hydrogen produced by water electrolysis and electric energy from renewable energy sources. The systems that convert electricity into gas/hydrogen by electrolysis are known as power-to-gas systems (P2G) [5].
It should be noted that today green hydrogen technologies (P2G systems, fuel cells) are hardly economically viable. The reason is the current price of technological equipment for green hydrogen production, storage, and distribution, which is not yet a subject of mass production and is therefore, still highly priced. This leads to high capital expenditures of systems based on green hydrogen technologies, which results in a high price of generated green hydrogen. This reduces hydrogen’s economic competitiveness in comparison to other fuels, particularly natural gas, and prevents green hydrogen technologies from being widely adopted. To accelerate the adoption of green hydrogen technologies under current conditions, particular applications must be identified where green hydrogen could be competitive due to its low environmental impact, leading to lower environmental taxes.
The abovementioned open issues led us to perform the feasibility study [6] where we tried to estimate the economic issues of green hydrogen production in a typical Slovenian hydro power plant (HPP). This paper is organized as follows. In Section 2, we first discuss the current and future prices of hydrogen in the commercial market. Section 3 briefly describes the technical characteristics of the case-study HPP and defines the capital expenditures (CapEx) and operating expenses (OpEx) for the implementation of a P2G system for green hydrogen production. Section 4 discusses the economic viability of green hydrogen production in the case-study HPP. Section 5 gives an assessment of the competitiveness of hydrogen within the heating and transport sectors. Then, Section 6 describes how electric network ancillary services can be used to increase system profitability. Conclusions and usability of P2G system implementation in an HPP are described in Section 7.

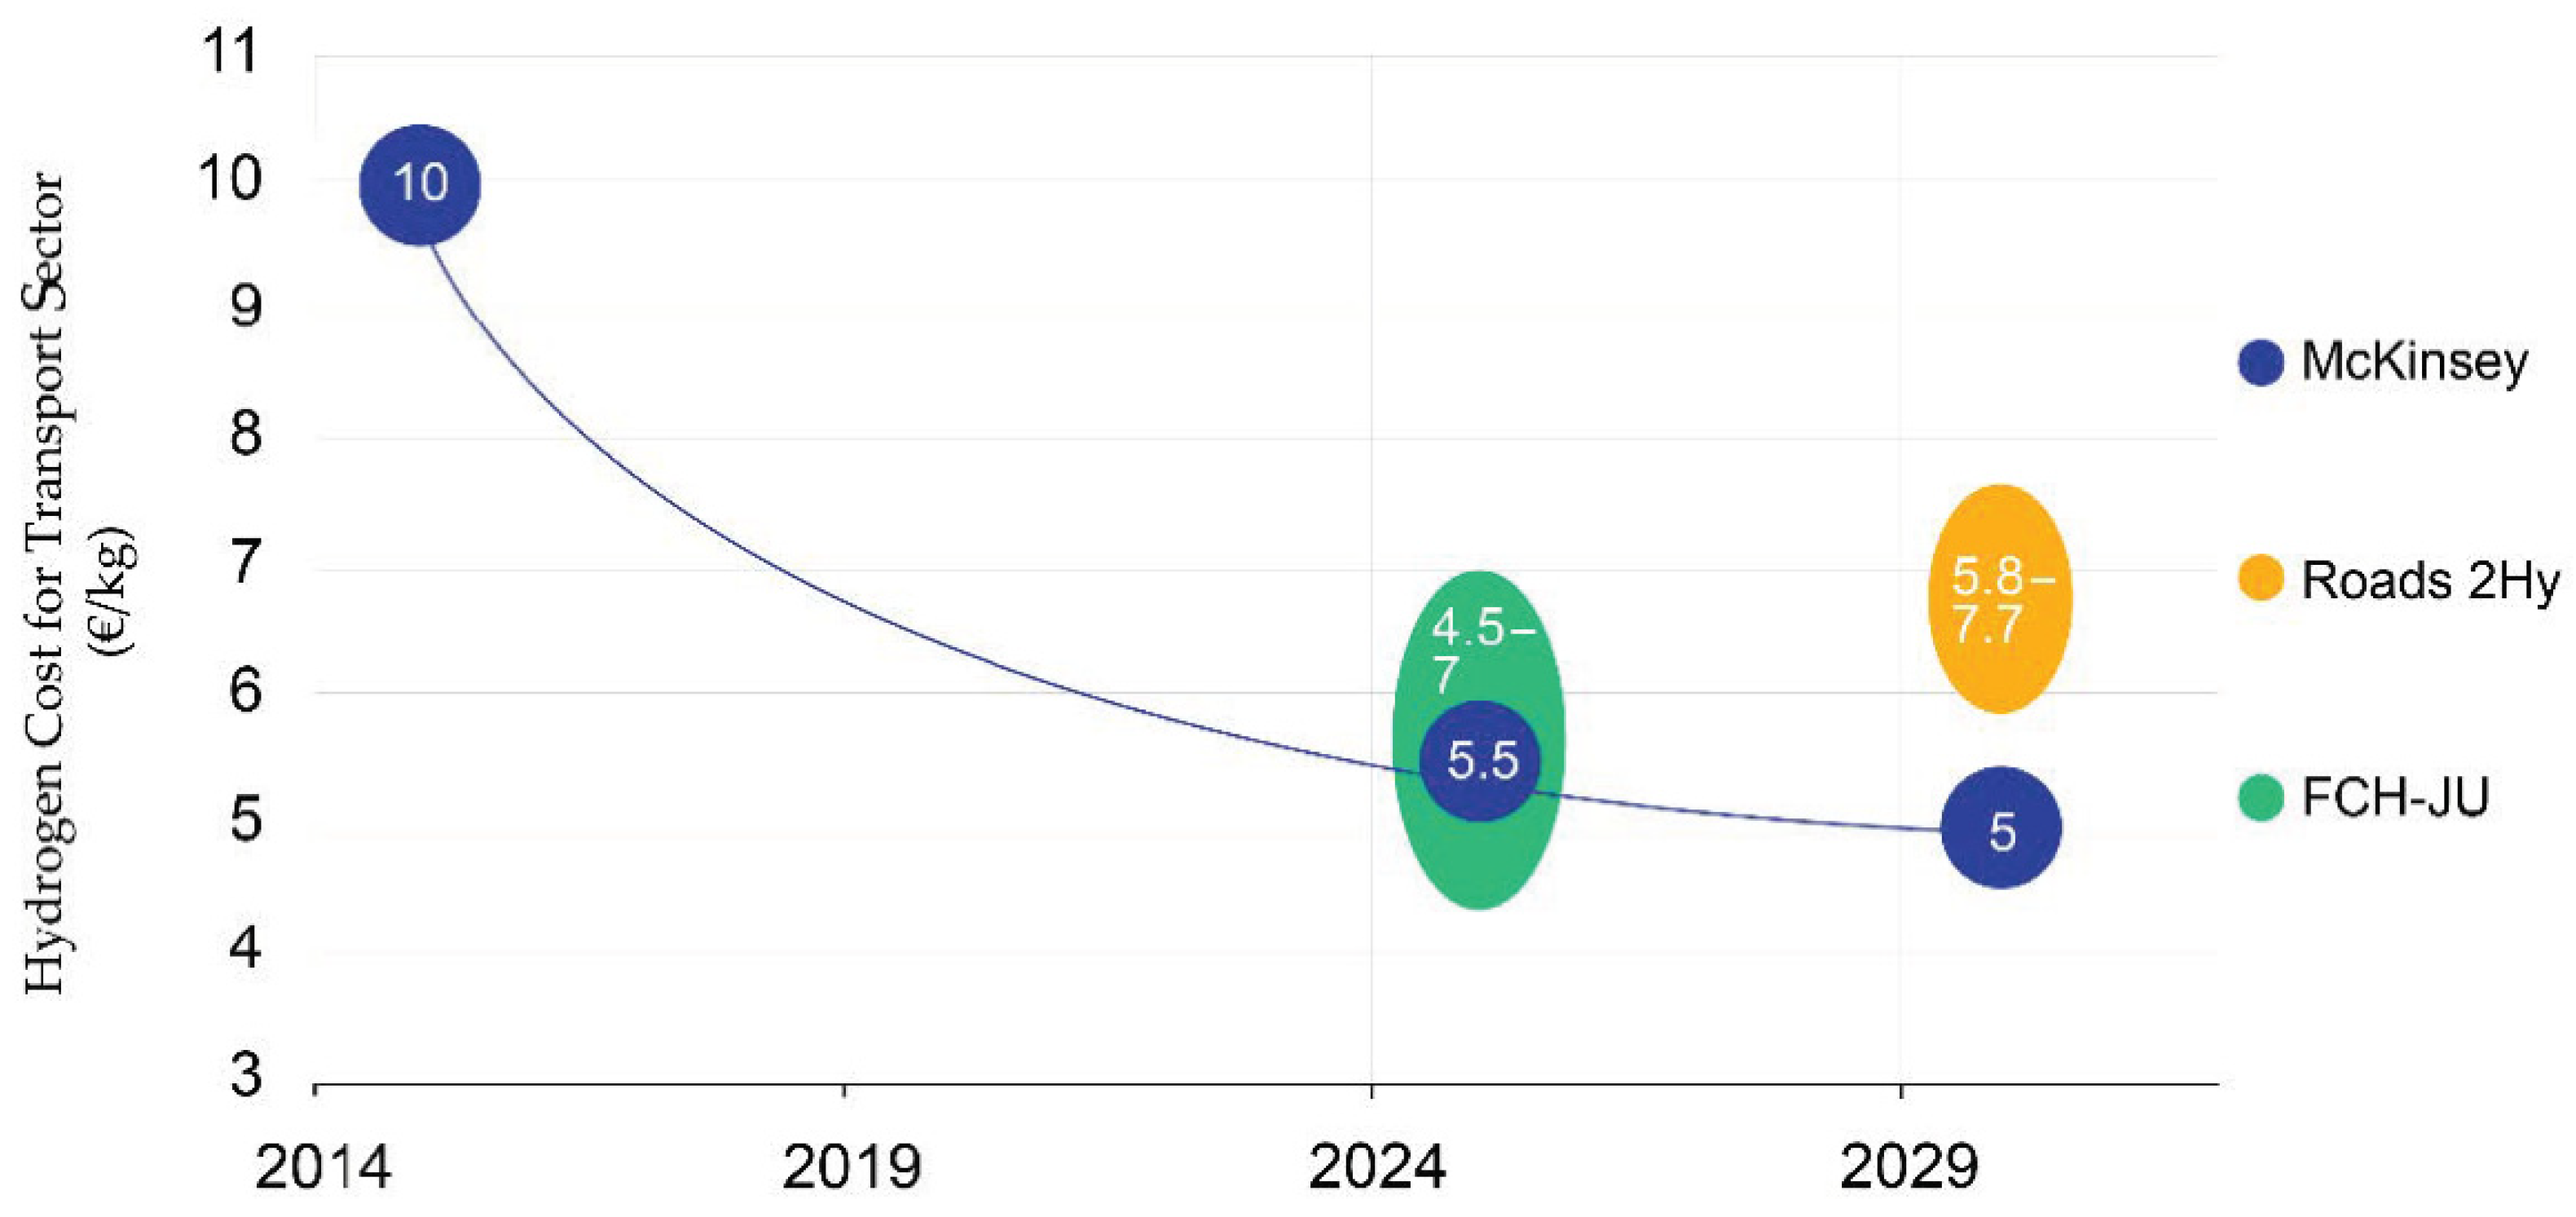
2. Overview of Hydrogen Prices

In the EU, the current production of hydrogen is led by some large industrial producers who play a key role in determining the internal market price. The market price generally depends on the required parameters (e.g., purity). In addition, the price of hydrogen depends on the customer’s location, which determines how the hydrogen (liquefied or gaseous) is delivered. The transport, distribution, and storage of hydrogen are particularly important when hydrogen is produced on a large scale in dedicated centralized production plants and delivered to remote users. Currently, in the EU industry, the most widely used hydrogen production method is on-site steam methane reforming. Since this technology is mature and the current price of natural gas is low, the price ranges from 2 to 3 €/kg [7], depending on the size of the steam reformer. As previously mentioned, SMR generates CO2 emissions, thus the produced hydrogen is not green. On the other hand, it is known that nowadays hydrogen selling prices can vary from 10 to 60 €/kg [3], where 60 €/kg is a price of hydrogen with a particularly high purity level used for semiconductor and specialty applications. With this in mind, a more reliable approach for forecasting hydrogen price is through the analysis of its production costs.
Furthermore, in the field of hydrogen vehicles, the price of hydrogen will directly depend on the costs of production and distribution. In the first few years of introduction, the price of hydrogen at fuel stations is expected to be high due to a low volume of sales and high production and distribution costs. In Germany, the price at fuel stations is currently at around 10 €/kg. It is expected that after the year 2020, the retail network will expand, and consequently, the price is expected to fall.
Various studies analyze the future course of retail hydrogen prices. According to estimates [3], in the area of mobility, hydrogen consumption in the EU market may increase to around 750,000 tonnes/year in 2030. Figure 1 shows a comparison of the results of the different studies considering the different levels of market penetration of FCVs (fuel cell vehicles) and the selected hydrogen production technology.
FCH JU (Fuel Cells and Hydrogen Joint Undertaking), a public-private partnership between industry and the European Commission for Fuel Cells and Hydrogen, has set the goal to reach a retail price of between 4.5 and 7 €/kg H2 by 2025. Various studies [8,9] agree with the conclusion that the retail price will gradually decrease and will drop down to around 5–7 €/kg H2 by the year 2030.
According to the HyWays project [7], fuel cell electric vehicles (FCEV), with a driving range and performance comparable to internal combustion engine powered vehicles (ICEV), are the way to decarbonization in the segment of medium/larger cars and longer trips. These car segments account for 50% of all cars and 75% of CO2 emissions, hence replacing one ICEV with one FCEV achieves a relatively high CO2 reduction. Sales of hydrogen for vehicles are likely to remain in the domain of existing/current fuel suppliers; most hydrogen fueling stations will therefore be located at conventional charging stations. According to the HyWays project projection, by the year 2030, we can expect from 9 to 13% hydrogen fuel cell vehicles in the EU’s entire fleet, which is between 12 and 25 million vehicles. According to a McKinsey study [8], the EU would have around 5000 hydrogen fueling stations with a total capacity of around 2,615,000 tonnes of H2 to supply hydrogen fuel cell vehicles in the year 2030.
There is also potential in adding hydrogen into existing gas pipelines, where it is estimated that at least 2% by volume of hydrogen can be added without specific technical modifications [3], which means around 250,000 tonnes of H2 for Europe [9]. This raises the question of hydrogen’s competitiveness compared to other energy sources, as at hydrogen’s production price, e.g., 6 €/kg H2, the price of energy (120 €/MWh) is significantly higher than the price of energy obtained from natural gas (34 €/MWh) [6].

3. Hydrogen Production in Hydro Power Plant

3.1. Case-Study Hydro Power Plant

In Slovenia today, around 23% of electric energy is produced from renewable energy sources, where a vast majority comes from hydro power plants. The case-study HPP is a hydroelectric power plant of the run-of-the-river and reservoir type, with three vertical generating units (around 16 MW of power each) with a combined rated discharge of 500 m3/s on five spillways. The installed plant capacity is around 45 MW (theoretical annual production is thus around 400 GWh), while the actual average annual production output is around 160 GWh. Due to its flat position and inclusion in the chain with other hydropower plants, it has limited possibilities for water accumulation. This particular HPP accounts for approximately one percent of Slovenia’s present annual electricity production and provides the possibility of implementing ancillary services. In the EU’s wholesale market, electricity prices in the last decade vary around an average of 50 €/MWh [10], where the production price is around 30% lower. The market situation in Slovenia is similar. To increase operating profitability, the HPP’s management is considering the possibility of producing hydrogen, which could be used to a lesser extent to store eventual surpluses of hydropower, and especially for regular sales to various consumers.
An additional advantage of the case-study HPP is its location; namely, it is located near two towns with a total population of 15,000 people, near a highway and is also close to a natural gas distribution network. So, hydrogen could potentially be delivered to hydrogen fueling stations located in both cities and along the highway or injected into the natural gas grid.

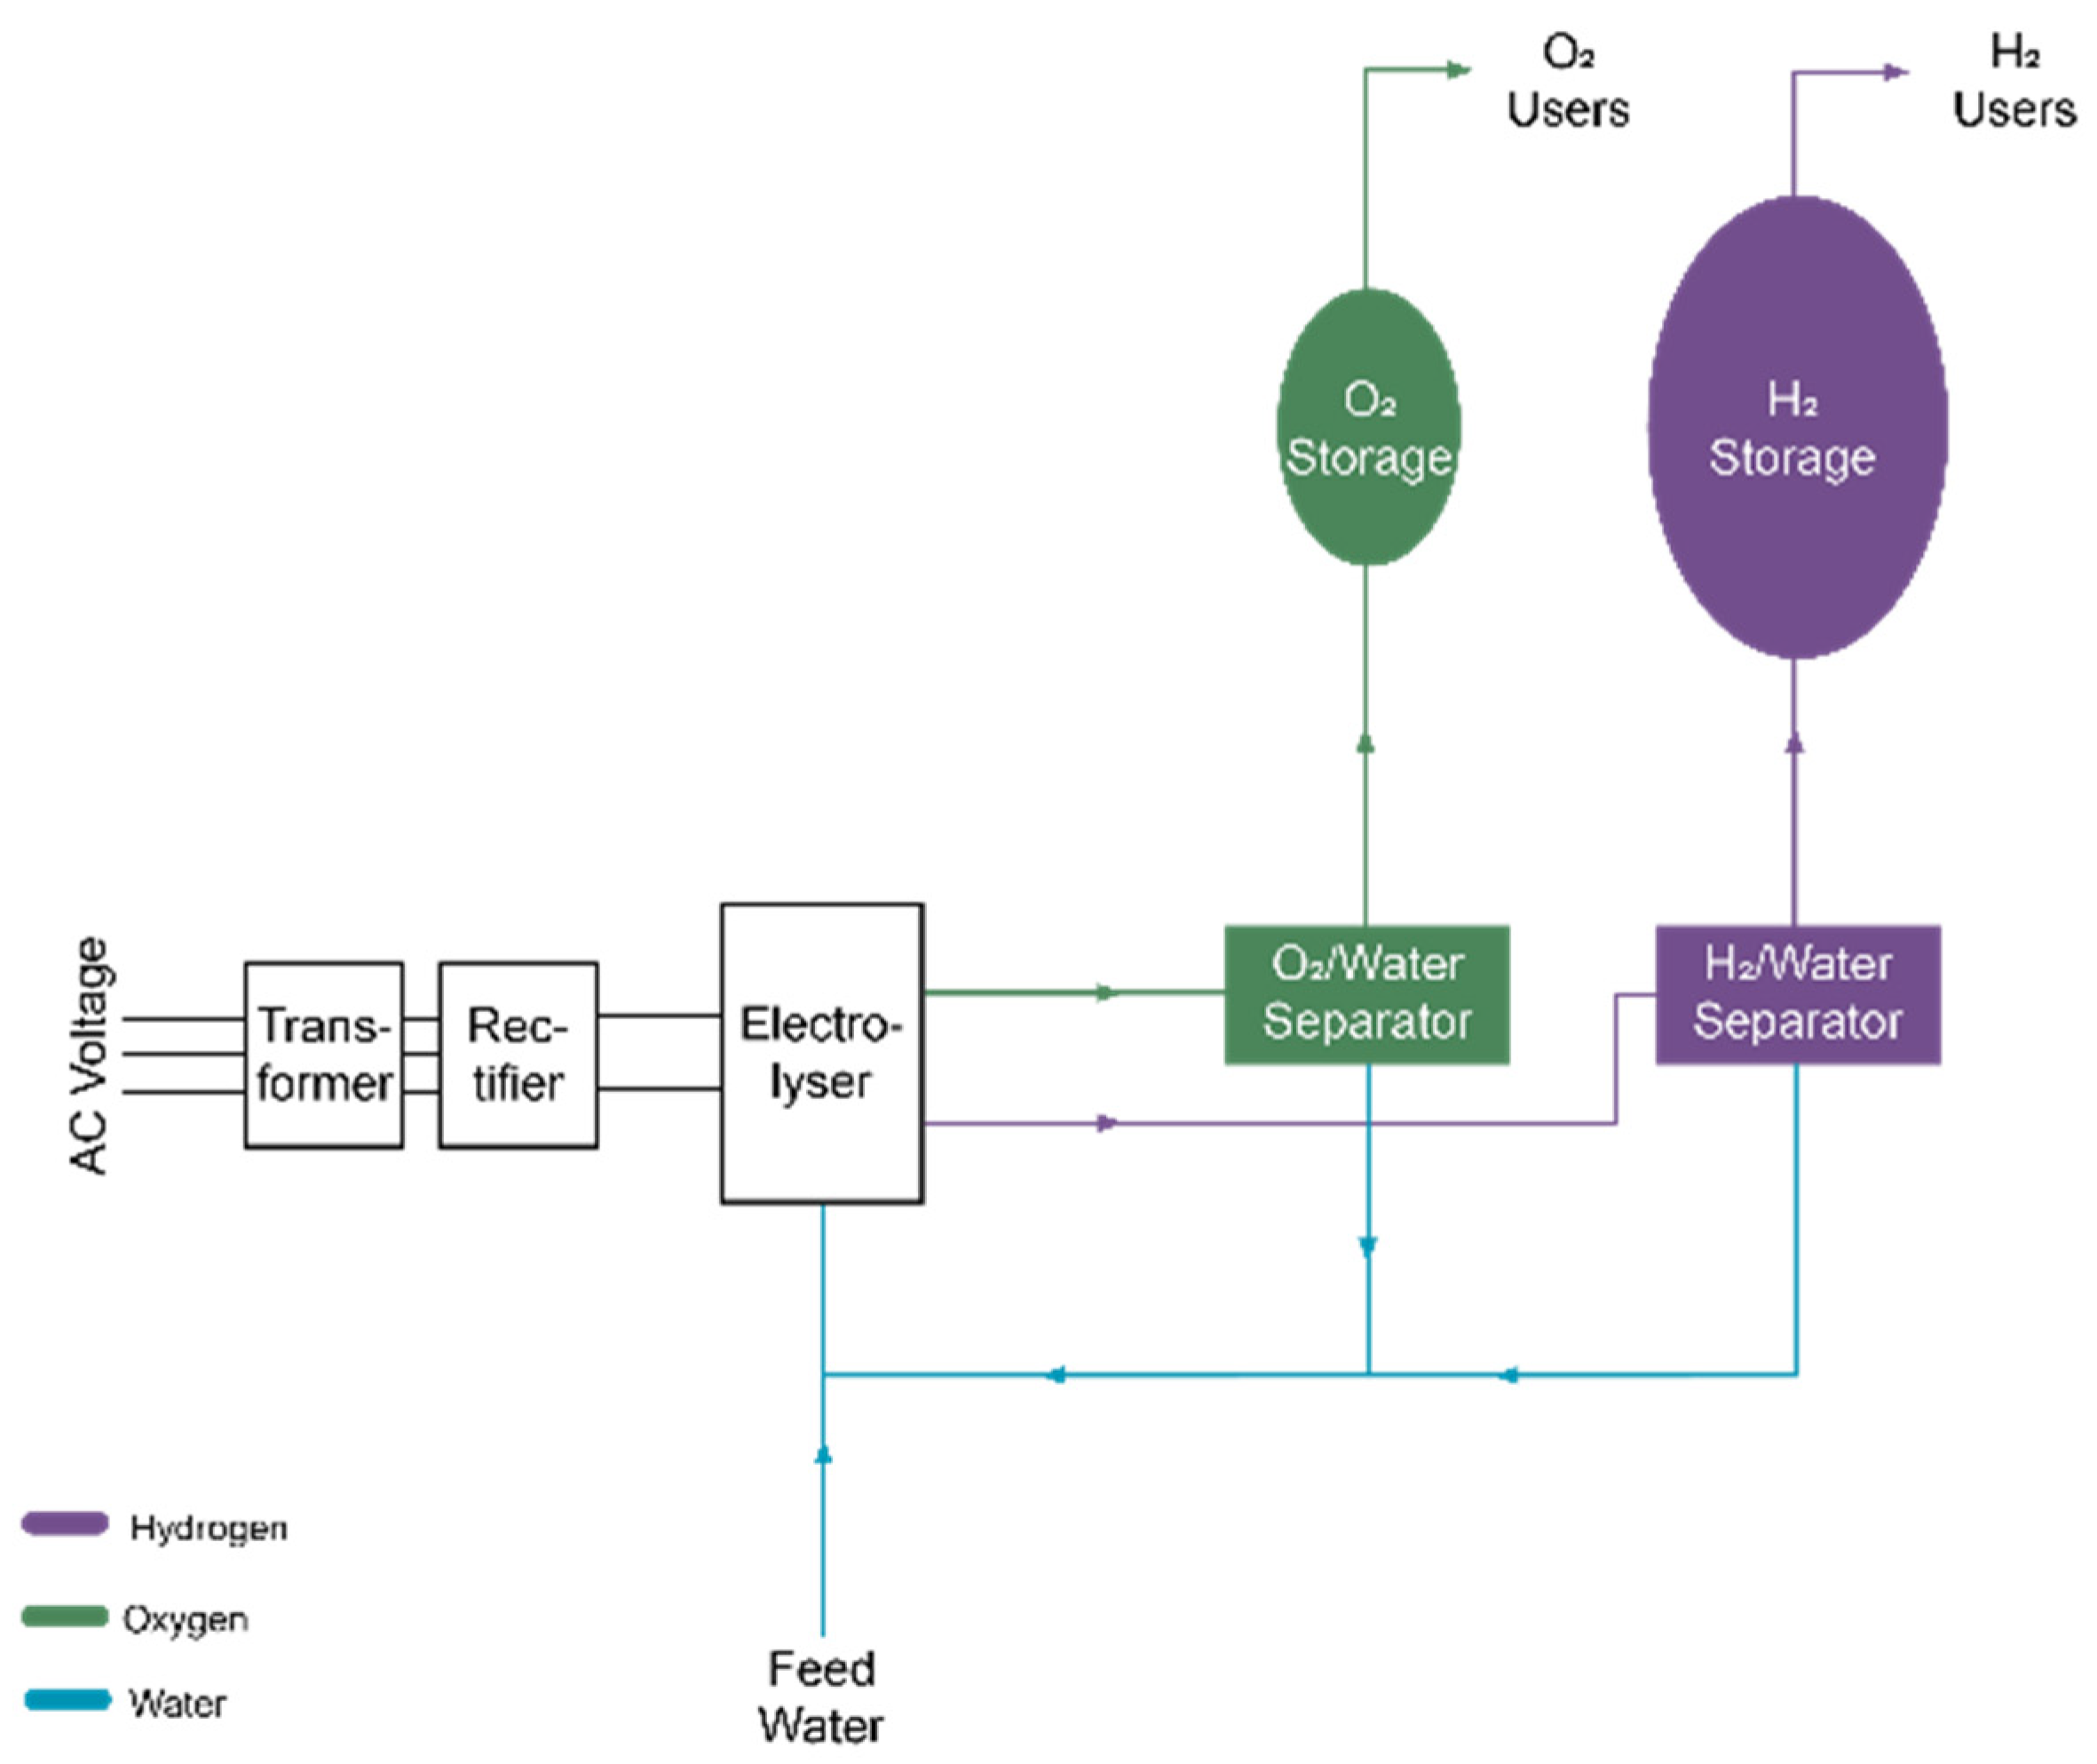
3.2. Equipment for Hydrogen Production

The primary step for the conversion of excess electric energy into hydrogen is an upgrade of existing HPP technological equipment with an appropriate power-to-gas (P2G) system (Figure 2).
As it is shown, the three main blocks composing a P2G plant are: electrolyzer, hydrogen/oxygen buffer tank system, together with water fraction separation components and final storage before distribution of hydrogen to final consumers or further processes.
P2G technology has made significant advances in recent years. A review of recent articles in the field of development and use of P2G systems [11,12,13,14,15,16,17] shows that a P2G system provides the possibility of storing renewable energy, supports transition to sustainable energy systems, can be an important source for renewable gases (such as hydrogen, oxygen, synthetic natural gas), and can also play an important role in the market pricing of electricity. In anticipation of the electricity market with high shares of renewable energy, P2G technology is moving from innovation to commercialization [18] and there is already a number of P2G systems providers.
For calculations of green hydrogen production costs in the case-study HPP facility, technical specifications of one of the commercially available P2G systems [19] are used (Table 1):
For various calculations, the following data about hydrogen are used:
  • Specific density: 0.08988 kg/Nm3;
  • Lower heating value (LHV): 119.96 MJ/kg (i.e., 33.32 kWh/kg or 3.00 kWh/Nm3).
Using these data and the assumed P2G system specifications, maximum daily production of hydrogen can be calculated (27 kg/h or 647 kg/day) and electric power consumption at maximum production can be determined (48.95 kWh/kg).
From the data (Table 1), we can determine the P2G system efficiency, i.e., the ratio between the internal energy of the produced hydrogen and the energy invested in the production of hydrogen:
η(P2G) = Hydrogen energy (kWh/kg)/Hydrogen production energy (kWh/kg).
Considering the LHV of the generated hydrogen and the highest consumption of the electrolyzer (48.95 kWh/kg), the efficiency of the P2G system is:
η(P2G, LHV) = 33.32 kWh/kg/48.95 kWh/kg = 0.681 = 68.1%.
Maximum electric power consumption of a P2G system needed for full hydrogen production capacity (300 Nm3/h) is:
P(EL_MAX) = 300 Nm3/h × 4.4 kWh/Nm3 = 1320 kW = 1.32 MW.
The cost of setting up a P2G system is still relatively high today. On the basis of some P2G system commercial providers’ offers and literature data [15,16,20], the main estimated costs for an implementation a P2G system of around 1 MW are listed in Table 2.
In this way, CapEx and OpEx costs for the P2G system installation and operation (Table 2) can be estimated. Their respective values are a CapEx value of 2,200,000 € and an OpEx value of 110,000 €/year, where OpEx is calculated as 5% of CapEx.

4. Economic Viability of Hydrogen Production in HPP

4.1. Hydrogen Production Cost in Case-Study HPP

We are interested in the cost of hydrogen production in the HPP obtained from green electric energy and using a P2G system. The production cost of hydrogen consists of two parts:
  • PC1—cost related to CapEx and OpEx of P2G system equipment and maintenance.
  • PC2—cost of electric energy for operation of P2G system and hydrogen generation.
Considering the technical characteristics of the P2G system (Table 1), PC1 is calculated as:
PC1 = (CapEx + OpEx)/m(total) =
= (2,200,000 € + 15 × 110,000 €)/2,833,860 kg =
= 1.36 €/kg,
where total hydrogen production in 15 years is calculated under the assumption that the system operates 80% of the time:
m(total) = 647 kg/day × 365 days/year × 15 years × 0.8 =
= 2,833,860 kg,
and PC2 is calculated as:
PC2 (€/kg) = electric energy price (€/kWh) × hydrogen production power consumption (kWh/kg).
Results of calculations are collected in Table 3, which shows the structure of the hydrogen production price at different electricity costs and at the assumed consumption of the electrolyzer (instead of declared 48.95 kWh/kg, we used rounded value of 50 kWh/kg).
The production costs described in Table 3 exclude Value-Added Tax (VAT) and other charges otherwise levied on transport fuels. The average power consumption of the P2G system in the case above is:
647 kg × 0.8 × 50 kWh/kg H2/24 h = 1.0783 MW.
The total annual consumption of electric energy of the P2G system is then 9446.2 MWh.

4.2. Production of Hydrogen Instead of Electricity

This subsection analyzes at which price production and selling of hydrogen becomes more profitable than selling the electric energy. In the case that the selling price of hydrogen equals production price (3.86 €/kg), the P2G system costs (CapEx and OpEx) and the costs of electric energy are covered, but there is no extra profit. The economic effect for the perspective of HPP is the same as if the HPP sells its electric energy on a commercial market at price 50 €/MWh.
In the case that the hydrogen selling price higher than 3.86 €/kg is achieved, the production and selling of hydrogen becomes more profitable than selling the electric energy. Table 4 shows the profit from the sale of hydrogen at different selling prices.
As an example, we can assume a selling price of hydrogen of 6.00 €/kg. HPP can sell 1 MWh of electric energy for 50 €. On the other hand, from 1 MWh of electric energy, the HPP can produce 20 kg of hydrogen that can be sold at 6 €/kg and earn 120.00 €. As 27.20 € covers the costs of CapEx and OpEx equipment and 50.00 € is to cover the cost of electricity (this is what HPP would earn when selling 1 MWh of electricity), the remaining profit is 42.80 €. The additional profit can be even higher if hydrogen is produced from an available surplus of electric energy, which cannot be sold on the market and its price is therefore 0 €/MWh.

5. Competitiveness of Green Hydrogen within Different Sectors

In this section, the economic competitiveness of green hydrogen in different sectors is analyzed. Focus is put on the sectors, where hydrogen is used as an energy vector. The basis for analysis is the price of energy (€/MWh) in these two sectors. Hydrogen can definitely be used as a sustainable energy vector in industry, heating, mobility, and the electric energy sector. However, current prices of the necessary hydrogen production, storage, and distribution equipment are still high and thus restricting the wider penetration of green hydrogen. For this reason, one of the aims of the feasibility study [6] was to define the areas where green hydrogen could be an economically viable option already today, at present prices of hydrogen production, storage, and distribution equipment.

5.1. Use of Green Hydrogen in Industry as a Feedstock

For industry, produced hydrogen today is based on steam methane reforming of natural gas. Since this technology is mature and large scale, its production cost ranges from 2 to 3 €/kg. This is less than the production price (3.86 €/kg) of green hydrogen generated by the P2G system, powered by electricity from the HPP. Even if we neglect the cost of hydrogen transport to its industrial users, it is difficult to predict that green hydrogen would soon replace current on-site SMR hydrogen production, if production cost is the only criteria. The situation may change if the cost of the CO2 emission tax increases. Namely, emission coupons are paid by large industrial consumers of natural gas and other hydrocarbon fuels (gas, oil, coal), which emit CO2 into the atmosphere as a result of hydrocarbon fuel combustion or processing. Typically, CO2 is produced during combustion, but can also be produced in other processes, e.g., in steam reforming of natural gas, which currently prevails for hydrogen production in the industrial sector.

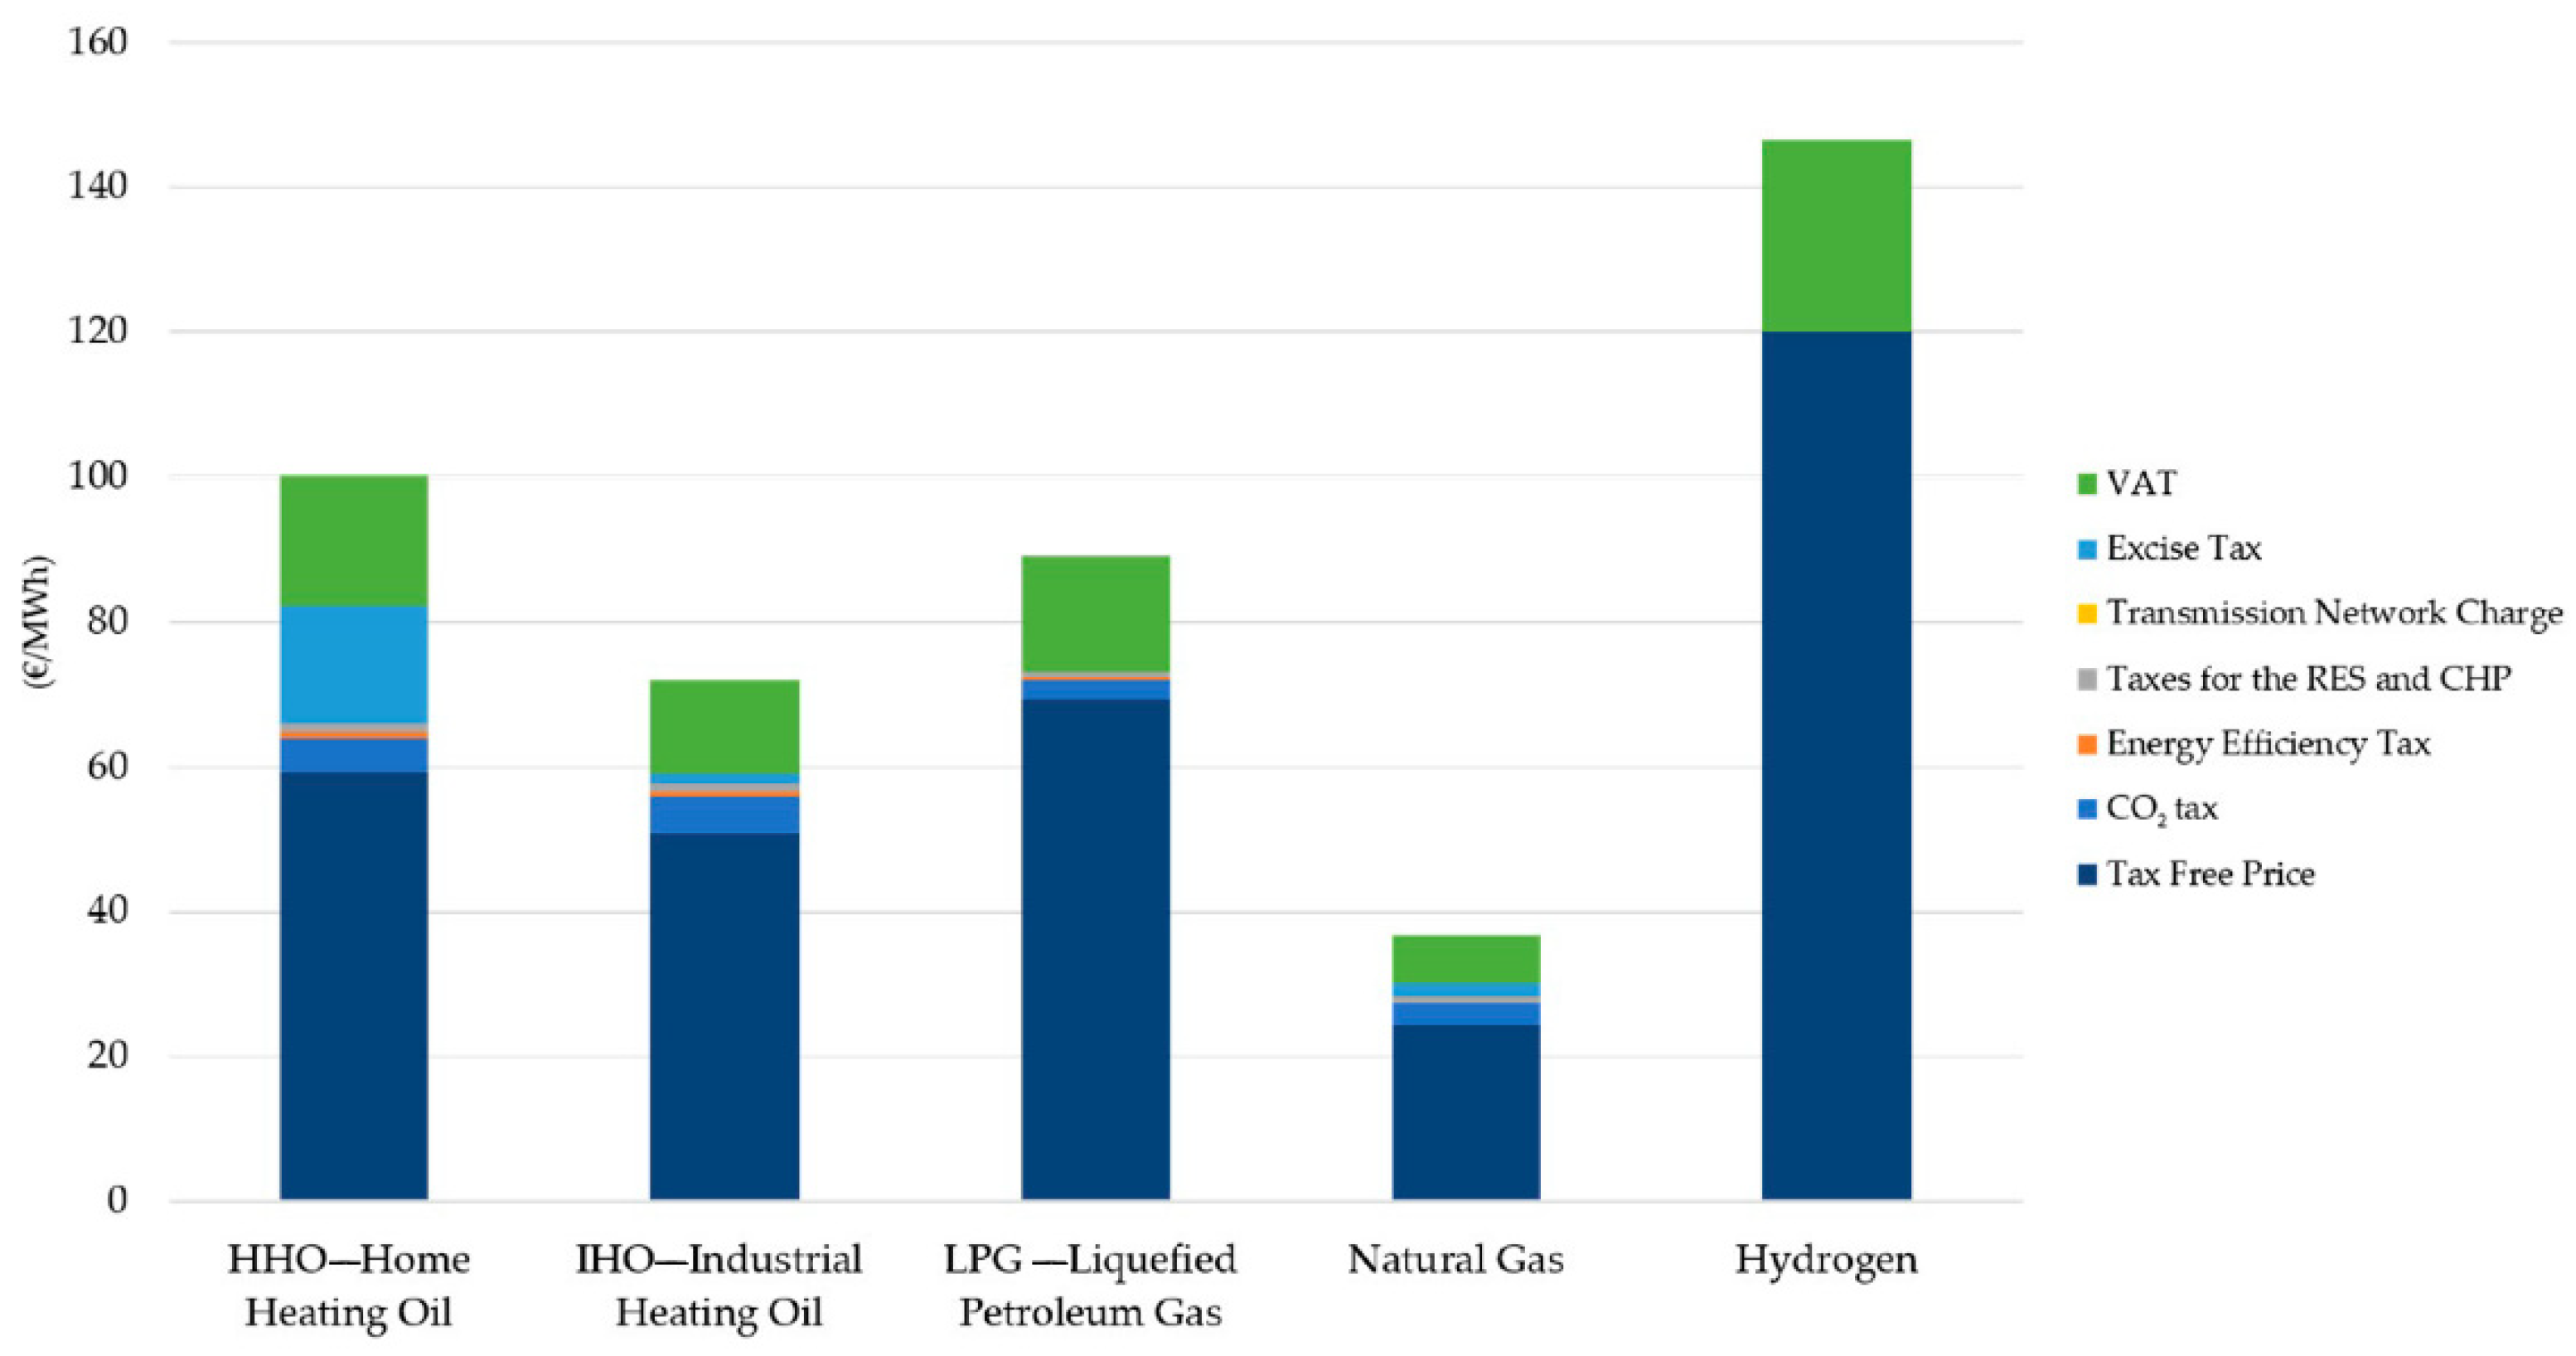
5.2. Use of Green Hydrogen for Heat Generation

Green hydrogen produced by the HPP can be used for heat production and can replace classic fossil fuels (natural gas, liquefied petroleum gas, heating oil, etc.). In the case of heating systems using natural or liquefied petroleum gas, green hydrogen can be mixed with gas or it can substitute gas completely. Although the addition of hydrogen in a moderate amount (up to a few percent) is possible without major technical interventions [21,22], it can be shown that when adding e.g., 25 vol.% of hydrogen in the existing natural gas network, CO2 emissions would be reduced by only about 4% (due to the low volume energy density of hydrogen) [23]. However, the main reason inhibiting the use of hydrogen for heating is the low price of thermal energy (€/MWh) generated from fossil fuels, in particular, natural gas. From Figure 3, which provides the data for Slovenia, it is evident that natural gas heating energy is much cheaper than heating energy from green hydrogen, which is produced by the P2G system in the HPP, sold for 4 €/kg and unencumbered by various environmental taxes. Even if the hydrogen would be sold without profit (only at its production cost of 3.86 €/kg + VAT), the energy price would reach 94 €/MWh + VAT, which is almost three times higher compared to the current natural gas price [24]. Green hydrogen has slightly better possibilities when compared to the heating oil and liquefied petroleum gas. Anyhow, green hydrogen is at the moment not an economically competitive solution for heat production when compared to classic fossil fuels.

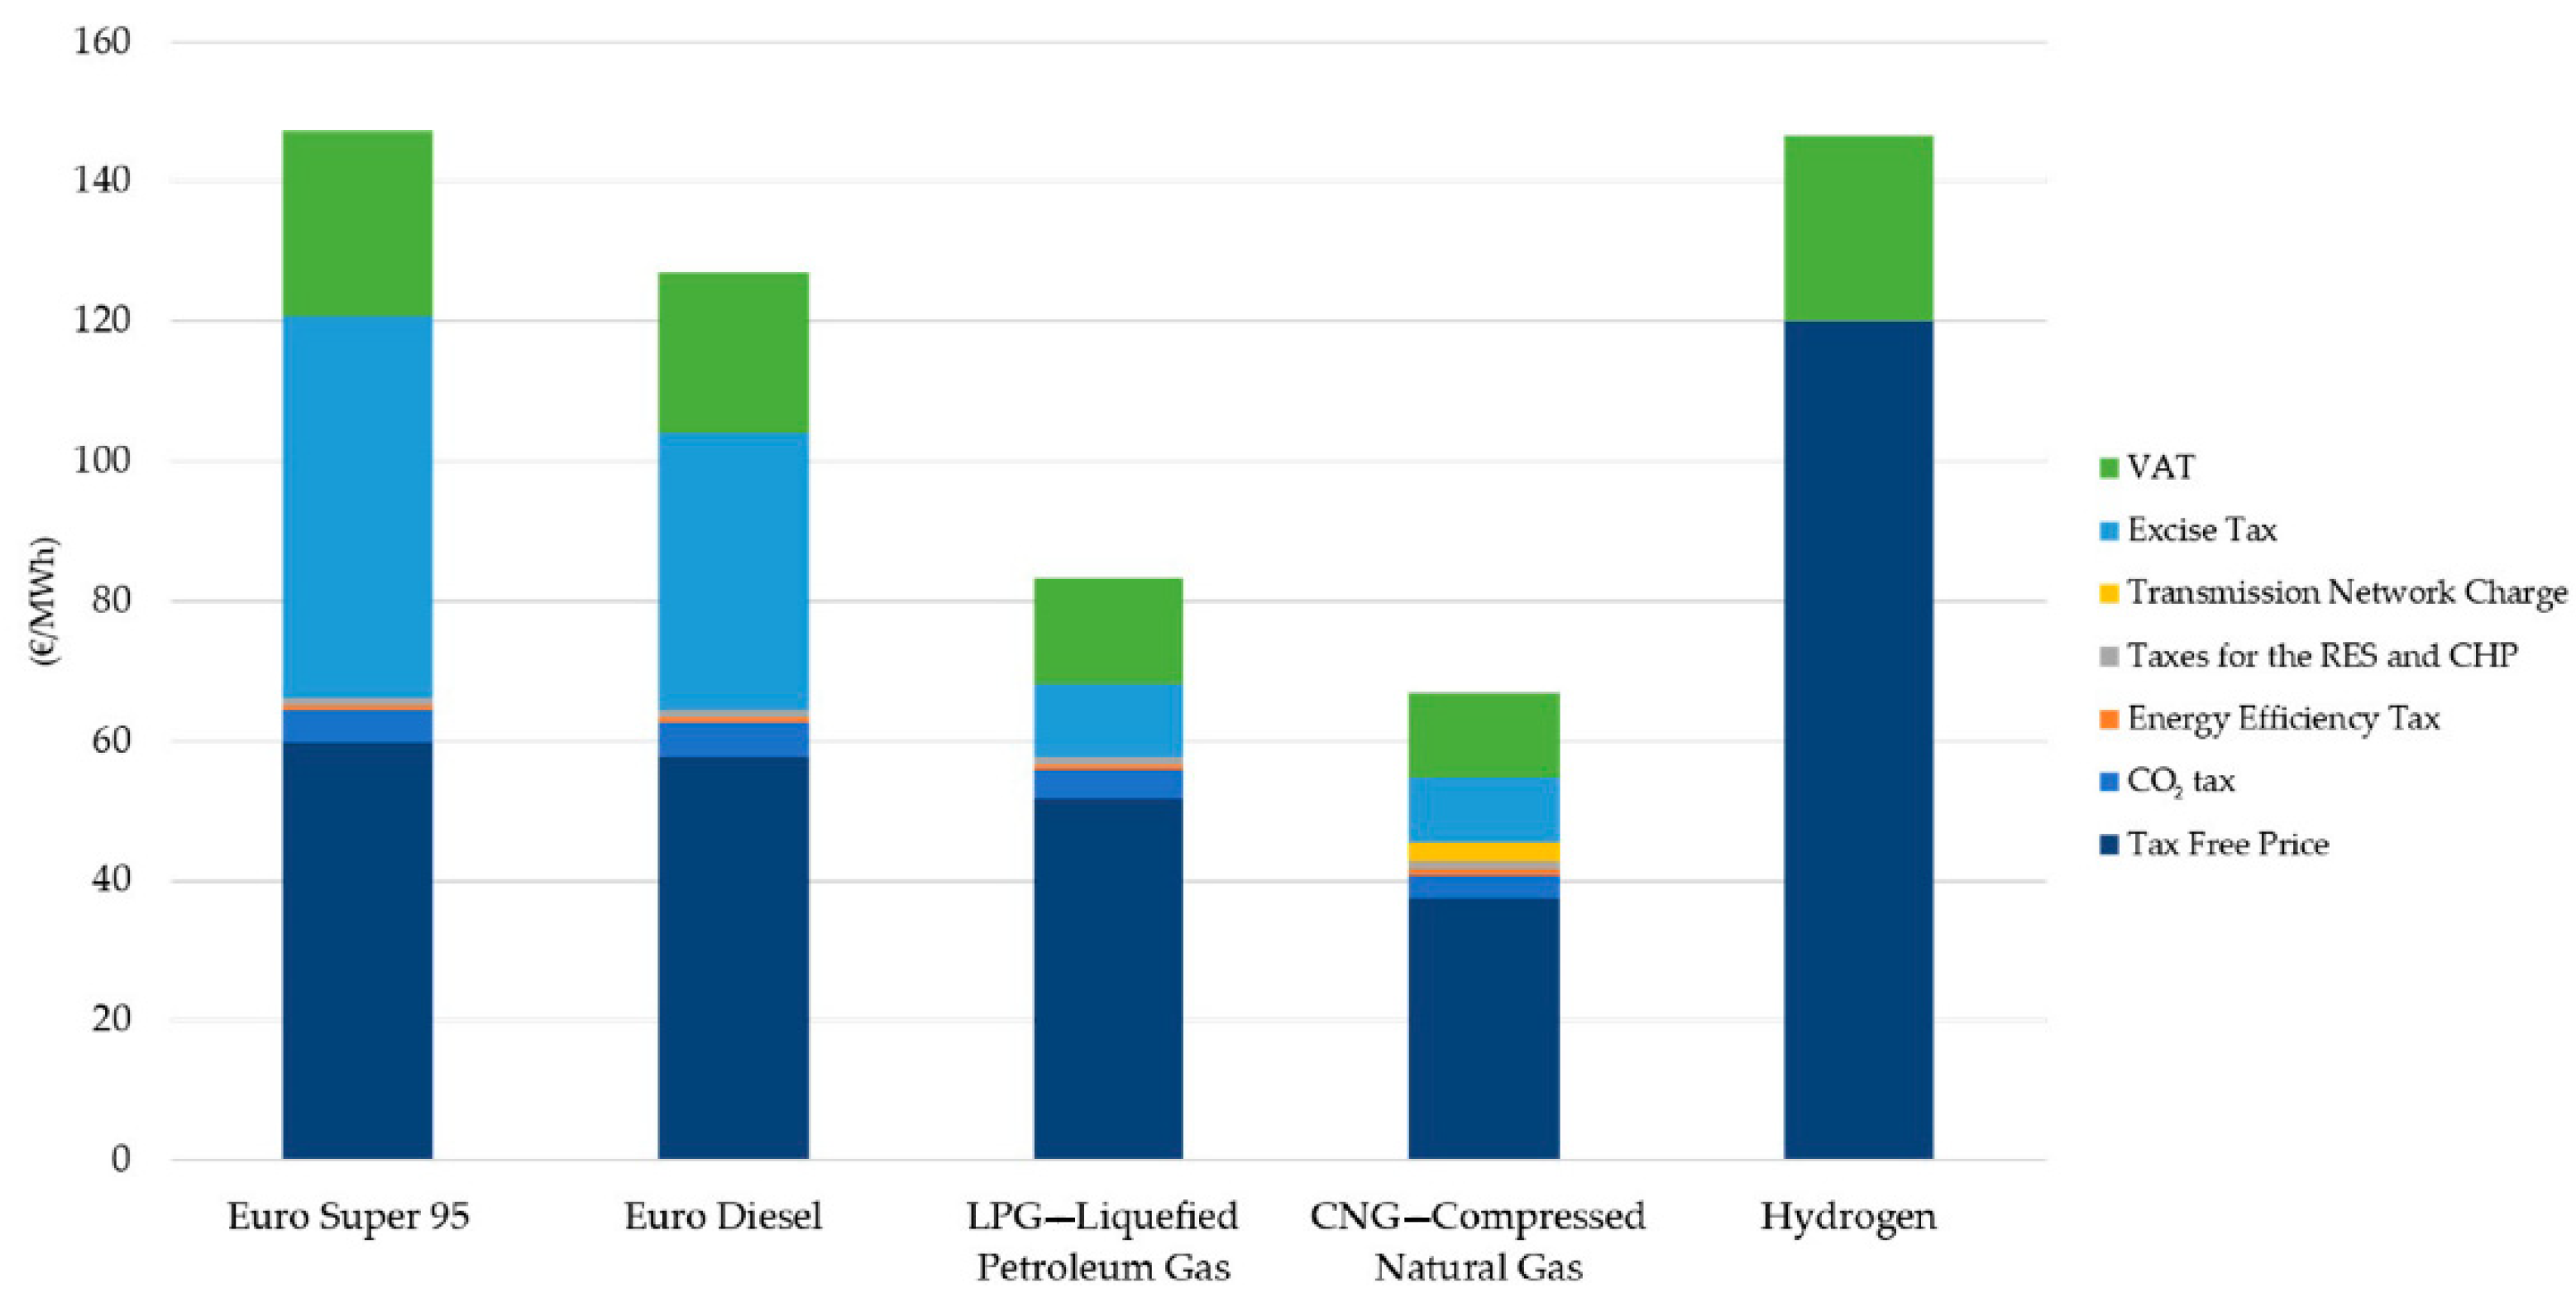
5.3. Use of Green Hydrogen for Transport and Mobility

Much more promising utilization of green hydrogen is in transport and mobility, where green hydrogen could completely supplement traditional fossil fuels (diesel, gasoline, liquefied petroleum gas, natural gas) in fuel cell vehicles (FCV). In some special areas of use, hydrogen fuel cell propulsion systems can gradually supplement petrol and diesel propulsion systems. The use of green hydrogen in transport brings important environmental benefits, such as:
  • Elimination of air pollution (CO, NOx, PM10 particles, etc.) in urban areas;
  • Reduction of overall CO2 emissions to the atmosphere (if green hydrogen is produced from excess of green electricity).
It is well known that transport contributes almost a third of greenhouse gas emissions and is an important cause of urban air pollution. A lasting solution to this challenge is the transition to sustainable mobility with low or zero CO2 emissions and other air pollutants. Green hydrogen is one of possible solutions, but its high production and distribution price, together with high price of the fuel cell propulsion system, are the key obstacles for using green hydrogen in transport. In this subsection, the prices of existing fossil transport fuels and hydrogen are compared. Fuels are compared through the price of their energy content (€/MWh). The analysis is performed on the basis of the Slovenian transport fuel market, but the situation is similar in the rest of Europe. In general, the price of hydrocarbon transport fuels is composed of the following components:
  • Fuel price (raw fuel price without taxes),
  • Environmental taxes;
  • VAT.
Taxes represent up to 60% of final fuel price and they are the highest in the case of gasoline and diesel fuel. Figure 4 shows the price structure of particular hydrocarbon fuels and green hydrogen. It is assumed that green hydrogen is not a subject of environmental taxes, but only a subject of VAT. Due to low environmental impact of green hydrogen, this is a reasonable expectation. In this analysis, the final selling price of hydrogen is assumed to be 4 €/kg. At this price per kg, the price of energy content of green hydrogen is comparable with gasoline. At the same time, 4 €/kg covers production costs of green hydrogen and provides some profit). A look at the Figure 4 shows the following:
  • If raw fuel prices (without taxes) are compared in €/MWh, the price of green hydrogen is the highest and cannot compete with hydrocarbon fuels;
  • If end fuel processes (with all taxes added) are compared in €/MWh, then green hydrogen price is comparable to gasoline and somewhat higher than diesel;
  • Current high taxes of hydrocarbon fuels make green hydrogen a competitive option for transport at current conditions.
Under the assumption that green hydrogen will not be a subject of environmental taxes (at least not during the initial period of entering into the transport sector), it is already competitive, especially when compared to gasoline (Euro Super 95). Absence of environmental taxes is currently the main reason for competitiveness of green hydrogen in the transport sector.
It has to be noted that green hydrogen is not equally convenient for all transport and mobility applications. Applications with the following properties could benefit the most from green hydrogen technologies:
  • Applications with limited number of vehicles are engaged;
  • Applications with large vehicles, so that the cost of the fuel cell propulsion system represents a lower part of total vehicle costs than in the case of e.g., passenger cars;
  • Daily travel distance of each vehicle should be substantial and should significantly exceed the capacity of the electric battery, so battery propulsion is not the optimum option;
  • Vehicles operate over a limited geographical region, so all vehicles can be refueled at just one or few (e.g., 2–3) refueling stations;
  • Longer stop time (as usually required for battery recharge) is not acceptable, vehicles must operate almost continuously, so quick refueling is mandatory.
The above requirements and conditions bring us to the applications, such as fleets of vehicles (trucks, or even more appropriate, buses). City buses in particular, are very close to the ideal green hydrogen application. Usually (at least in minor cities), they are all refueled at just one or few dedicated refueling stations, which greatly reduces the costs of hydrogen refueling infrastructure. Due to economic reasons, city buses have to be in permanent operation, without longer stops, so the possibility of quick refueling is very important. The daily travel distance of city buses significantly exceeds the distance, allowed by the capacity of batteries, so battery propulsion is not ideal for city buses. Most importantly, vehicles, fueled by green hydrogen and powered by fuel cells, have no emissions and generate much less noise than internal combustion engines, fueled by hydrocarbon fuels.
City bus applications could be economically viable today and can be used to push the green hydrogen technologies to the transport sector market. An example, elaborated in [6], shows that an investment in a 100 kW P2G system at the case study HPP used to supply a fleet of 4 smaller buses for local community public transportation would have a return on investment (ROI) of slightly over 5 years if each bus travels up to 400 km a day. The purchase prices of buses and charging stations are not included in this calculation, various subsidies can be used to cover the corresponding costs.
In addition, some other economic studies examining alternative uses of P2G systems [15,25] see the possibility of using hydrogen more profitably in the transport sector, mainly due to the significantly higher energy price in the transport market compared to the heat production market.

6. Ancillary Services

The economics of the P2G operation can be significantly improved if it is included in the system of ancillary services of the electric grid. Ancillary services are a part of the electric energy system and are used to balance the temporal deviations between electric energy production and consumption, and thus ensure the safe and uninterrupted operation of the electric energy system [26]. It has to be considered that the operation of sustainable power sources (hydro, photovoltaic, and wind) strongly depends upon weather and therefore cannot follow actual energy demands. This problem becomes more serious with the installation of many new sustainable power sources. It is estimated that by every 100 MW of newly installed sustainable power sources, 4–10 MW of ancillary services is needed to keep the grid well balanced. In general, systems included in ancillary services provide additional electric power when there is lack of electric power and they provide additional consumption or energy storage when there is excess electric power in the system.
Ancillary services are organized as a three-level hierarchical structure, consisting of primary, secondary, and tertiary voltage and frequency control [26]. Based of the properties of each control level and due to the desire for as high as possible hydrogen generation, it is considered that the P2G system in the range of 1 MW could be integrated into the secondary control (SC). The properties of the SC are described in the case of Slovenia, but the mechanism is similar in the rest of Europe:
  • The service is activated automatically by the remote command given by the electric grid operator;
  • The service has to start within 30 s after the command and it has to reach the demanded power within 15 min after the command has been given;
  • Service providers are payed by the grid operator. They are paid for their readiness by a flat rate of 183,000.00 €/MW/year;
  • Additionally, service providers are paid for actually supplied electric energy during the activated SC, at the price, which equals current stock exchange price, increased by certain factor.
Let us now analyze how the involvement into ancillary services of SC affects the economics of the HPP and P2G. The situation is explained in Figure 5. For simplicity, it is assumed that HPP always operates with its nominal power of 20 MW and that all produced electric energy could be sold to the market at price of 50 €/MWh. In case (a) shown in Figure 5a, the HPP and P2G are not involved in SC. This means that HPP supplies 19 MW of electric power to the grid and 1 MW to the P2G, which produces 20 kg of hydrogen per hour. Hydrogen is assumed to be sold at a price of 6 €/kg. In cases (b) and (c) in Figure 5b,c, HPP and P2G are involved in the SC. In case (b), when SC is not activated, HPP delivers 19 MW to the grid, while 1 MW is used for hydrogen generation, as shown in Figure 5b. In case (c), when electric grid operator activates the SC, additional power of 1 MW has to be supplied to the electric grid by the HPP and this is achieved by the deactivation of P2G and stopping the hydrogen production, as shown on the Figure 5c.
During analysis of the financial flows, the following three cases occur:
(a)
In the case of no involvement in SC (Figure 5a), the HPP earns 950 €/h from the electric energy system and 50 €/h from the P2G, which consumes 1 MW of electricity that could otherwise be sold on the market for 50 €/h. Instead, P2G generates an income of 120 €/h due to produced and sold hydrogen. P2G also generates fixed costs of 29.30 €/h of CapEx and OpEx. All of these result in an additional profit of 40.70 €/h compared to the standalone HPP operation without P2G.
(b)
In the case of involvement in SC and inactive SC (Figure 5b), the situation is similar to case a), which means that 1 MW of electric power is used for hydrogen generation and no extra power is supplied to the grid. Nevertheless, there is an additional income of 20.89 €/h due to the SC readiness flat rate (183,000.00 €/MW/year). This results in an extra profit of 61.59 €/h compared to standalone HPP.
(c)
In the case of involvement in SC and active SC (Figure 5c), HPP supplies 19 MW + 1 MW of electric power to the grid. The price of regular power is 50 €/MWh, while the price of extra power is higher, for this illustrative example, it is assumed to be 90 €/MWh. Consequently, the HPP earns 1040 €/h from the electric energy system. There is no income from hydrogen, since hydrogen production is stopped. The income of 20.89 €/h due to SC readiness and the fixed P2G costs of 29.30 €/h also remain. This leads to a P2G loss of 8.41 €/h and HPP extra profit of 40 €/h, which results in an extra profit of the system of 31.59 €/h.
In Figure 5 and Table 3, a selling price of 6 €/kg for hydrogen and a selling price of 90 €/MWh for extra electric energy supplied during active SC are assumed. However, these two prices are subject to variation and they affect the financial flows and final financial effects. An important quantity is the difference between the cash flow generated by hydrogen and the cash flow generated by extra electric energy production, see Equation (8) and Table 5. The cash flow difference is expressed as:
CashFlowDiff = PowerH2 × PriceH2 × ConsH2 − PowerEE × PriceEE.
If the difference is positive, then hydrogen generation is more desirable than supplying the extra electric energy. In the case of a negative difference, supply of extra electric energy becomes more attractive than hydrogen generation. Finally, at zero difference, the financial effect is the same during hydrogen generation and during the supply of extra electric energy.
It follows that involvement in SC can bring significant additional profit if SC is actually active only a minor part of the time (e.g., 10–20% of the time). This condition applies if an income from generated hydrogen (hydrogen flow (kg/h) × hydrogen selling price (€/kg), in our case 20 kg/h × 6 €/kg = 120 €/h), is higher than an income from extra electric energy supplied during active SC (in our case 90 €/MWh × 1 MW = 90 €/h). In the opposite case, when the income from extra electricity is higher than the income from hydrogen, active SC brings more profit than hydrogen generation. Note that actual future duration of the SC cannot be precisely predicted, but it can be estimated on the basis of historical data. Based on this, and based on selling prices of hydrogen and extra electric energy delivered during active SC, the decision about participation in SC can be made.
Considering that a lifetime of an installed P2G system is 15 years, we can extend the calculation of financial effects over this period.
The comparison of column 1 with columns 2, 3, and 4 of Table 6 confirms that involvement in SC can significantly increase the profitability of the whole system. At the assumed prices of hydrogen and extra electric energy supplied during active SC, extra profit is generated if, most of the time, SC is deactivated and hydrogen is produced.
Similar results can be obtained in the case when negative SC is activated [6]. When the need for power reduction for 1 MW emerges on the demand of the electric grid operator, an additional 1 MW is released for the HPP’s P2G system operation and hydrogen production.
The above calculations are simple to understand. However, they do not take into account the time value of money. Due to the time value of money, future costs (OpEx and electricity costs) are discounted, as they appear later, in the future. Financial incomes from sold hydrogen also come in the future and, for this reason, the mass of generated hydrogen is also discounted. For the calculation of the levelized production costs of hydrogen, we use the standard expression, described e.g., in [27]:
P C L e v e l i z e d = t = 1 n C C a p e x , t + C O p e x , t + C E l e c , t ( 1 + d ) t t = 1 n m t ( 1 + d ) t .
The symbols in Equation (9) have the following meanings (see Table 7).
According to the Equation (9), we can calculate levelized costs of produced hydrogen at different electricity prices.
Upon comparing Table 3 and Table 8, it can be noticed that the obtained production prices of hydrogen are slightly higher than the prices obtained by simple calculation.

7. Conclusions

The expected growth of greenhouse gas emissions and the strong dependence on fossil energy sources are strong reasons for the transition to new alternatives and a stimulation for industrial actors to invest in various new green energy technologies. Hydrogen is a promising energy vector/carrier, but the methods of today’s production and exploitation are not in line with long-term environmental and energy goals. EU is aware of the need for an energy transition, and policy makers are already implementing the necessary measures. As an example, in June 2020, Germany, as the most ambitious European country in the field of hydrogen technology, adopted the national strategy, “German Hydrogen Strategy for Global Leadership in the Energy Transition” [28]. The document notes that hydrogen as a multipurpose energy carrier can be used in the field of transport, can serve as a basis for the production of synthetic fuels and also as a medium for storing energy obtained from renewable sources. The document further notes that hydrogen is a key element for cross-sectoral integration and that in areas where electricity from renewable sources cannot be used directly, green hydrogen and its by-products open up new approaches for decarbonization. The document adds that hydrogen can also be used as a feedstock for various industrial production processes where there are currently no alternatives to significantly reduce emissions, e.g., the steel and cement industries. According to the strategy, “only hydrogen produced on the basis of renewable energy sources (green hydrogen) is sustainable”. Therefore, the goal of the German government is to use green hydrogen, support the rapid growth of the hydrogen market and establish appropriate value chains.
The purpose of this paper was to assess the possibility of introducing a P2G system in an HPP for the production of green hydrogen with the aim of increasing the efficiency of its operation and the consequent achievement of financial effects.
We have shown that the production price of green hydrogen generated from renewable electricity using the P2G system is lower than the price of hydrogen predicted by various studies for the next decade.
Based on a comparison of heating and transport fuel prices, we found that green hydrogen is already competitive in the field of transport, as long as its sales price is not burdened with additional environmental taxes, as is the case with other fuels.
The article also discussed the case of green hydrogen production in a power plant that is included in the SC ancillary service. We found that combination of hydrogen production and secondary control can result in increased profit, if SC is not activated too often and hydrogen is produced for the most of the time.
Considering all opportunities of green hydrogen production from an excess of available electric energy in a hydro power plant with an already commercially available P2G, we estimate that this technology is worth investing in.

Author Contributions

Conceptualization, D.J.J. and G.D.; methodology, D.J.J. and G.D.; software, D.J.J.; validation, G.D.; formal analysis, D.J.J. and G.D.; investigation, D.J.J.; resources, D.J.J.; data curation, D.J.J.; writing—original draft preparation, D.J.J.; writing—review and editing, D.J.J.; visualization, D.J.J.; supervision, G.D.; project administration, G.D.; funding acquisition, G.D. All authors have read and agreed to the published version of the manuscript.

Funding

This work was supported by the research program P2-0001 and the project L2-1832, both financed by the Ministry of Education, Science and Sport of the Republic of Slovenia, and the industry partner Hidroelektrarne na Spodnji Savi, d.o.o. Their support is gratefully acknowledged.

Conflicts of Interest

The authors declare no conflict of interests.

References

  1. Dincer, I. Green methods for hydrogen production. Int. J. Hydrogen Energy 2012, 37, 1954–1971. [Google Scholar] [CrossRef]
  2. International Energy Agency. The Future of Hydrogen, Seizing Today’s Opportunities; International Energy Agency: Paris, France, 2019. [Google Scholar]
  3. Fraile, D.; Lanoix, J.C.; Maio, P.; Rangel, A.; Torres, A. Overview of the Market Segmentation for Hydrogen Across Potential Customer Groups, Based on Key Application Areas. European Commission, 2015. Available online: http://www.certifhy.eu/images/D1_2_Overview_of_the_market_segmentation_Final_22_June_low-res.pdf (accessed on 9 November 2020).
  4. Basile, A.; Linguori, S.; Iulianelli, A. Membrane reactors for energy applications and basic chemical production. In Membrane Reactors for Energy Applications and Basic Chemical Production; Di Paola, L., Piemonte, V., Basile, A., Hai, F., Eds.; Elsevier: Amsterdam, The Netherlands, 2015; pp. 31–59. ISBN 978-1-78242-223-5. [Google Scholar]
  5. Mazza, A.; Bompard, E.; Chicco, G. Applications of power to gas technologies in emerging electrical systems. Renew. Sustain. Energy Rev. 2018, 92, 794–806. [Google Scholar] [CrossRef]
  6. Jovan, D.J.; Jovan, V.; Dolanc, G. Technoeconomic Assessment of Introducing P2g System into One of Slovenia’s HPP; Jozef Stefan Institute: Ljubljana, Slovenia, 2020. (In Slovene) [Google Scholar]
  7. Hyways. Available online: http://www.hyways.de/ (accessed on 29 June 2020).
  8. McKinsey & Company. A Portfolio of Power-Trains for Europe: A Fact Based Analysis; EESI: Washington, DC, USA; Available online: https://www.eesi.org/files/europe_vehicles.pdf (accessed on 29 June 2020).
  9. Hinicio. Hydrogen Europe. Available online: https://hydrogeneurope.eu/member/hinicio (accessed on 29 June 2020).
  10. European Commision. Energy Prices and Costs in Europe; SWD (2019) 1 Final; the Commission to the European Parliament, the Council, the European Economic and Social Committee and the Committee of the Regions: Brussels, Belgium, 9 January 2019; Available online: https://eur-lex.europa.eu/legal-content/EN/TXT/PDF/?uri=COM:2019:1:FIN&from=EN (accessed on 9 November 2020).
  11. McKinsey & Company. Urban Buses: Alternative Powertrains in Europe. Available online: https://www.fch.europa.eu/sites/default/files/20121029%20Urban%20buses%2C%20alternative%20powertrains%20for%20Europe%20-%20Final%20report_0_0.pdf (accessed on 29 June 2020).
  12. Ansaldo Energia. Available online: https://www.ansaldoenergia.com/PublishingImages/Idrogeno/Ansaldo-Energia-H2.pdf (accessed on 16 July 2020).
  13. European Commission. Energy Roadmap 2050; Publications Office of the European Union: Luxembourg, 2012. [Google Scholar]
  14. Lewandowska-Bernat, A.; Desideri, U. Opportunities of power-to-gas technology in different energy systems architectures. Appl. Energy 2018, 228, 57–67. [Google Scholar] [CrossRef]
  15. Schiebahn, S.; Grube, T.; Robinius, M.; Tietze, V.; Kumar, B.; Stolten, D. Power to gas: Technological overview, systems analysis and economic assessment for a case study in Germany. Int. J. Hydrogen Energy 2015, 40, 4285–4294. [Google Scholar] [CrossRef]
  16. Van Leeuwen, C.; Mulder, M. Power-to-gas in electricity markets dominated by renewables. Appl. Energy 2018, 232, 258–272. [Google Scholar] [CrossRef]
  17. Fischer, D.; Kaufmann, F.; Selinger-Lutz, O.; Voglstätter, C. Power-to-gas in a smart city context—Influence of network restrictions and possible solutions using on-site storage and model predictive controls. Int. J. Hydrogen Energy 2018, 43, 9483–9494. [Google Scholar] [CrossRef]
  18. Chen, Z.; Zhang, Y.; Ji, T.; Cai, Z.; Li, L.; Xu, Z. Coordinated optimal dispatch and market equilibrium of integrated electric power and natural gas networks with P2G embedded. J. Mod. Power Syst. Clean Energy 2018, 6, 495–508. [Google Scholar] [CrossRef] [Green Version]
  19. NEL Hydrogen. Containerized Atmospheric Alkaline Electrolyser. Available online: https://nelhydrogen.com/product/atmospheric-alkaline-electrolyser-a-series/ (accessed on 14 October 2020).
  20. Thema, M.; Bauer, F.; Sterner, M. Power-to-gas: Electrolysis and methanation status review. Renew. Sustain. Energy Rev. 2019, 112, 775–787. [Google Scholar] [CrossRef]
  21. Gondal, I.A. Hydrogen integration in power-to-gas networks. Int. J. Hydrogen Energy 2019, 44, 1803–1815. [Google Scholar] [CrossRef]
  22. Schiro, F.; Stoppato, A.; Benato, A. Modelling and analyzing the impact of hydrogen enriched natural gas on domestic gas boilers in a decarbonization perspective. Carbon Resour. Convers. 2020, 3, 122–129. [Google Scholar] [CrossRef]
  23. Quarton, C.J.; Samsatli, S. Power-to-gas for injection into the gas grid: What can we learn from real-life projects, economic assessments and systems modelling? Renew. Sustain. Energy Rev. 2018, 98, 302–316. [Google Scholar] [CrossRef]
  24. Trinomics, B.V. Study on Energy Prices, Costs and Subsidies and Their Impact on Industry and Households—Final Report; European Commission—DG Energy: Rotterdam, The Netherlands, 2018. [Google Scholar]
  25. Thomas, D.; Mertens, D.; Meeus, M.; Van der Laak, W.; Francois, I. Power-to-Gas Roadmap for Flanders—Final Report; WaterstofNet vzw: Groningen, The Netherlands, 2016. [Google Scholar]
  26. Kaushal, A.; Van Hertem, D.; Hertem, D. An overview of ancillary services and HVDC systems in European context. Energies 2019, 12, 3481. [Google Scholar] [CrossRef] [Green Version]
  27. Schmidt, O.; Melchior, S.; Hawkes, A.; Staffell, I. Projecting the future levelized cost of electricity storage technologies. Joule 2019, 3, 81–100. [Google Scholar] [CrossRef] [Green Version]
  28. Bundesministerium für Wirtschaft und Energie. Die Nationale Wasserstoffstrategie; Bundesministerium für Wirtschaft und Energie: Berlin, Germany, 2020. (In German) [Google Scholar]
Figure 1. Hydrogen cost development from 2015 to 2030.
Energies 13 06599 g001
Figure 2. Basic building blocks of a P2G system.
Energies 13 06599 g002
Figure 3. Comparison of current heating fuel prices in Slovenia (in €/MWh).
Energies 13 06599 g003
Figure 4. Comparison of current transport fuel prices in Slovenia (in €/MWh).
Energies 13 06599 g004
Figure 5. Financial flows for the combination of hydrogen production and SC: (a) HPP not involved in SC; (b) HPP involved in SC, SC inactive; (c) HPP involved in SC, SC active.
Energies 13 06599 g005aEnergies 13 06599 g005b
Table 1. Technical specifications of the P2G system.
Technical ParametersValues
Nominal power1 MW
Net production rateup to 300 Nm3 H2/h
Production capacity dynamic range15–100% of flow range
Power consumption at stack3.8–4.4 kWh/Nm3 of H2
Delivery pressurefrom 30 bar to 200 bar
Table 2. The cost of the components of P2G systems.
Main P2G System Implementation CostsEstimated Cost
Project documentation100,000 €
Electrolyzer1,600,000 €
High pressure storage200,000 €
BoP 1 components120,000 €
Electric connection to HPP100,000 €
Construction and assembly works80,000 €
Total costs2,200,000 €
1 Balance of Plant.
Table 3. Hydrogen production price depending on the price of electric energy. PC1 refers to P2G system equipment and maintenance costs, PC2 to the cost of electric energy for operation of the P2G system, and PC (total) to the total production cost.
Electricity CostsPC1PC2PC (Total)
35 €/MWh1.36 €/kg1.75 €/kg3.11 €/kg
50 €/MWh1.36 €/kg2.50 €/kg3.86 €/kg
120 €/MWh1.36 €/kg6.00 €/kg7.36 €/kg
Table 4. Profit at different selling prices of hydrogen.
Selling Price of Hydrogen (€/kg)Income (€/MWh)P2G Equipment Costs (€/MWh)Electricity Costs (€/MWh)Extra Profit (€/MWh)
3.8677.2027.2050.000.00
4.0080.0027.2050.002.80
5.00100.0027.2050.0022.80
6.00120.0027.2050.0042.80
7.00140.0027.2050.0062.80
8.00160.0027.2050.0082.80
Table 5. Descriptions of the variables and their assumed values.
VariableVariable DescriptionAssumed Value
PowerH2Electric power used for hydrogen generation1 MW
PriceH2Selling price of hydrogen6 €/kg
ConsH2P2G consumption of electricity per unit of mass of generated hydrogen50 kWh/kg (0.05 MWh/kg)
PowerEEElectric power of extra electric energy supplied during active SC1 MW
PriceEESelling price of extra electric energy supplied during active SC90 €/MWh
Table 6. Financial effects of HPP with integrated P2G system and active SC 1.
ParametersNot involved in SC 100% H2 Prod.SC Active 10% of the time
  • 90% H2
  • Prod.10% El. Prod.
SC active 50% of the time
  • 50% H2 Prod.
  • 50% El. Prod.
SC Active 90% of the time
  • 10% H2 Prod.
  • 90% El. Prod.
P2G CapEx (investing in equipment)2,200,000.00
P2G OpEx (% CapEx per year)5.00
P2G OpEx (per year)110,000.00
P2G electricity consumption (MWh/kg H2)0.05
Electricity selling price (€/MWh)50.00
Electricity selling price during SC (€/MWh)--90.00
Hydrogen, selling price (€/kg)6.00
Average hydrogen production power (MW)1.000.900.500.10
Average SC power (MW)0.000.100.500.90
Power reserved for SC (MW)1.001.001.001.00
SC readiness flat rate (€/MW/year)0.00183,000.00
Observation period (years)15.00
Interim results
Amount of hydrogen produced (kg)2,628,000.002,365,200.001,314,000.00262,800.00
Hydrogen production energy (MWh)131,400.00118,260.0065,700.0013,140.00
SC energy (MWh)0.0013,140.0065,700.00118,260.00
Costs (€)
P2G CapEx2,200,000.002,200,000.002,200,000.002,200,000.00
P2G OpEx1,650,000.001,650,000.001,650,000.001,650,000.00
Electricity to produce hydrogen6,570,000.005,913,000.003,285,000.00657,000.00
Costs (total)10,420,000.009,763,000.007,135,000.004,507,000.00
Revenue (€)
Sales of hydrogen15,768,000.0014,191,200.007,884,000.001,576,800.00
SC electricity0.00525,600.002,628,000.004,730,400.00
SC readiness0.002,745,000.002,745,000.002,745,000.00
Revenue (total)15,768,000.0017,461,800.0013,257,000.009,052,200.00
Profit = Costs—Revenue5,348,000.007,698,800.006,122,000.004,545,200.00
1 SC = Secondary control.
Table 7. Descriptions of the variables and their assumed values.
VariableVariable DescriptionAssumed Value
nObservation period (years)15
tYear index 1, 2, 3, …, 15
CCapEx,tCosts of capital expenditures in year t2,200,000 € in year 1, 0 € in following years
COpEx,tCosts of operation expenditures in year t110,000 €/year
CElec,tCosts of electricity in year t472,310 €/year
mtMass of produced hydrogen in year t188,924 kg/year
dAssumed discounting factor5%
Table 8. Levelized hydrogen production price at different electric energy costs.
Electricity CostsPCLevelized
35 €/MWh3.40 €/kg
50 €/MWh4.15 €/kg
120 €/MWh7.65 €/kg
Publisher’s Note: MDPI stays neutral with regard to jurisdictional claims in published maps and institutional affiliations.

