Small Nuclear Reactor—Nordic District Heating Case Study


1
Fortum Power and Heat Oy, 02150 Espoo, Finland
2
Department of Mechanical Engineering, School of Engineering, Aalto University, FI-00076 Aalto, Finland
*
Author to whom correspondence should be addressed.
Energies 2020, 13(15), 3782; https://doi.org/10.3390/en13153782
Submission received: 1 June 2020
/
Revised: 14 July 2020
/
Accepted: 19 July 2020
/
Published: 23 July 2020
(This article belongs to the Special Issue Next-Generation Small Reactors—Designs, Deployment, Regulation and Impacts)
Abstract
:Small Modular Reactors (SMRs) have been recognized to have potential in decarbonizing district heating, which is currently an urgent sustainability challenge in many European countries. In this paper, the financial impacts of replacing peat and biomass-powered Combined Heat and Power (CHP) plants with heat-only reactors of 24–200 MW power range and maximum output temperatures of 120 °C are studied. A district heating system of a medium-sized Nordic city in Eastern Finland is modeled with EnergyPRO computer software (EMD International A/S, Aalborg, Denmark), which is used to optimize plant units’ production for cost effectiveness. A future scenario is used to predict electricity prices, expenditures from CO2 emission allowances, and fuel prices for the studied case. Results show that the low operating expenditures of CO2 free heat-only reactors would compensate for the revenue losses from electricity sales and that a small number of micro reactors, with power output in the tens of megawatts range each, would be optimal for the studied case. Since investment cost estimates for SMRs still bear significant uncertainties, the subject should be followed in further studies, as heat-only SMRs could provide a profitable alternative for current CHP production in the future.
1. Introduction
Finland has the second-highest share of renewable energy in the EU after Sweden. Concerning electricity, hydropower and wood-based fuels each produce 19% of all electricity generation in Finland, while wind power has a 9% share. The large shares of renewable electricity and nuclear power (35% of all domestic generation) result in very low specific CO2 emission of electricity generation—88 gCO2/kWh in 2019 [1]. However, almost half of the heat consumed in district heating networks of Finland is produced by fossil fuels and domestic high-emission fuel peat [2]. Measures have been taken to reduce and eventually abandon the use of these combustible fuels in energy production. The Finnish Government has recently implemented a very ambitious law of abandoning coal use for energy purposes by the year 2029, as part of the National Energy and Climate Strategy for 2050 [3,4]. The government also plans to halve the use of peat in energy production via taxation by the year 2030 [5]. The substituting fuels consist mainly of various wood fuels, partly competed over by the pulp industry. The concern over the sufficiency of wood fuels has made municipal district heating companies consider other means of producing heat to its customers besides combustible fuels.
District heat (DH) is an essential part of the Finnish energy system due to the high demand for heating caused by the Northern location. DH systems cover practically all Finnish cities and larger community centers, with a 46% share of total demand. Larger cities have one or more Combined Heat and Power (CHP) plants. In addition, heat-only boilers (HOBs) are used especially during demand peaks. In recent years, heat pumps and waste heat sources have started to appear. Electricity and DH production are strongly connected in Finland via CHP production (totals of 3471 MW electrical capacity and 5694 MW heat capacity). Large city CHP systems are highly dependent on fossil fuels or peat in Finland, whereas in smaller cities, local biofuels can often be used. The share of fossil fuels was 34% in 2019 and the share of domestic high-emission fuel peat was 14% in DH fuels in Finland, as seen from Table 1. Thus, it is obvious that alternatives to these fuels need to be found to meet the stringent objective of carbon neutrality in Finland by 2035.
Combined Heat and Power production is an effective way to produce heat from combustible fuels. The plants themselves are often owned by municipal power companies and are located in the vicinity of population centers. Modern technologies enable the use of a large variety of fuels that are usually harvested in nearby regions. Some peat bogs are even owned by the power companies to provide a constant and stable supply of fuel. Combustible fuels are relatively expensive and operational expenditures dominate CHP production costs. Although energy security is the prime concern for the municipal power companies, affordable consumer prices are also important, making cost effectiveness a priority. Until lately, selling electricity to the European power market has been profitable to the municipal district heating companies. In recent years, the low but volatile electricity market prices, and increasing cost of used fuels raise the question whether it will remain as profitable in the future [8]. The effect of abandoning coal over Finnish electricity and district heating networks was studied in [9], finding that increasing the share of wind power in the electricity market will reduce annual average electricity prices. Ketterer [10] and Brancucci Martinez-Anido et al. [11] found in their studies of German and American electricity markets that increasing wind power capacity not only decreases electricity prices, but also increases volatility. These effects are also seen in the Nordic energy market, Nord Pool, as even negative regulating power prices have been seen in Finland in 2020 [12]. On the other hand, the stringent objective of the Finnish government to reach carbon neutrality by 2035 requires abandoning the domestic high-emission fuel, peat, in energy production. This will undoubtedly increase the use of forestry-based wood fuels in district heating and raises concern on the adequacy of domestic biofuels for energy production. The price of wood chips has increased from 8 EUR/MWh to 21 EUR/MWh during the last 20 years [13] and recent studies suggest that a rising trend will continue in the upcoming decades [9,14]. Subsequently, this trend will challenge the profitability of combined heat and power production with biomass-fired boilers in the future.
Small Modular Reactors (SMRs) are, by definition, smaller than the gigawatt-scale nuclear reactors used for power production today. Modularity refers not only to the possibility to install multiple reactor modules on the same facility to meet larger demands over time, but also to improved manufacturing processes by which the structures, systems, and components are shop-fabricated, then, shipped and assembled onsite [15,16]. Hidayatullah et al. [16] point out that compared to large nuclear power plants, the economy of SMRs benefits from lower capital costs and from the economy of component mass production. Sainati et al. [17] maintain that these characteristics reduce the number of activities in the construction site, thus, resulting in reduced construction time and risk. Numerous studies also suggest that a phased deployment of multiple reactor modules on site would minimize construction cost outlays and maximize the benefits gained through learning [18,19]. Several designs for small light water power reactors and heat-only reactors, with thermal outputs ranging from ten to few hundreds of megawatts, are under different stages of development around the world. For district heating applications, the heat-only-type has been found economically viable by recent studies [20,21]. According to Leppänen [22], reactors designed exclusively for heating applications benefit from lower manufacturing costs and simplified safety design. These features could allow locating of them near population centers, provided that the required precautionary action zones are taken into account. In Finland, public acceptance for nuclear power has been good, and recently, work on reviewing nuclear legislation with regard to SMRs has been initiated [23].
The use of small heat-only reactors in district heating is not a novel concept in Nordic countries. Reactor types specifically for low-temperature heating applications in the 200–400 MW range were studied by a Swedish–Finnish collaboration in the 1970s [22]. Although the project to develop the light water reactor SECURE with a core outlet temperature of 115 °C for the 200 MW variant was discontinued, the concept has been revisited infrequently [22,24]. More recently, the use of SMRs in district heating was studied in the greater Helsinki region by Värri et al. [20] and Lindroos et al. [21]. Their research indicates that heat-only SMRs could be profitable in Finland’s capital area. However, there is potential for carbon emission reduction also in smaller cities, as over half of Finland’s emissions caused by district heating are produced outside the greater Helsinki region [2]. The use of small heat-only reactors in small and medium-sized Nordic towns has not yet been studied in the scientific literature.
According to Partanen [24], there are several 200–400 MWt heat-only reactors that will become available in the 2020s. The first heat-only reactor technology expected to be commercialized is the Chinese DHR400 (China National Nuclear Corporation, Beijing, P.R. China), a 400 MWt pool-type reactor, producing hot water at atmospheric pressure and temperature of around 90 °C [24]. While the economics of this reactor type show promise [21], its capacity is oversized for most Finnish heating networks. In addition, the low-temperature output limits its use during the coldest heating periods. Therefore, in this study, we do not concentrate on a single SMR technology, but simulate the use of generic heat-only SMRs, which have the same performance capability as the units already connected to the studied case’s district heating network, i.e., heat-only units capable of supplying heat to the network at a 120 °C temperature level corresponding to the current Finnish DH norm. Reactors with two different output levels are investigated to discover the optimal unit size. The rest of the parameters for the two studied reactors are identical, including the financial variables. Värri et al. modeled in [20] a scaled up version of the NuScale reactor (NuScale Power, Tigard, Oregon, United States) that is capable of performing up to Finnish DH requirements for temperature output. The SMR marginal costs for capital and operational expenses used in this study are taken from their model of the heat-only NuScale SMR.
In this paper, SMRs in heat production are studied as an alternative to CHP production in an existing heating network. The studied case includes a CHP boiler built in the early 1980s that will need extensive modernization or even replacing in the coming decade 2030–2040. Heat pumps are not considered as an option in the studied case, since there are no large enough heat sources available in the region to replace the possibly outgoing CHP plant production. Economic study of replacing some of the CHP capacity with heat-only reactors requires considering the gained revenue from electricity sales. Profitability is, therefore, studied not by calculating the levelized cost of heat for individual units separately, but by calculating the average break-even price for the whole studied system. Computer simulations are used to determine the production profiles for different plant configurations consisting of CHP, SMR, and peak plants. Simulated production profiles and financial parameters are used to investigate whether SMRs present a viable option for replacing CHP production, and what would be the optimum configuration and SMR unit size.
2. Materials and Methods
For studying SMRs in district heat production, a mid-sized city in Eastern Finland with a population of 120,000 was chosen as a reference case. The local district heating network delivers heat to ca. 6000 customers (mainly apartment buildings) in the main population center. The peak demand of the network is around 350 MW, mostly produced by two CHP power production units located in the main powerplant area. For peak demand and as reserve, there are light fuel oil-fired heat-only boilers with the combined capacity of 360 MW connected along the network. The annual fuel consumption of oil is, however, small, around 1% of the overall fuel energy. In addition, there are two biogas-fired units with a combined output of a few megawatts, producing heat to the network using waste gas from a landfill and a wastewater treatment plant. While the produced heat is consumed locally in the municipality, the produced electricity is sold to the Nord Pool European power market. The amount of electricity sold to the market is around 320 GWh annually [25].
The studied heating network was modeled using EnergyPRO computer software (EMD International A/S, Aalborg, Denmark, version 4.6.797) [26]. The software optimizes operation of cogeneration systems against spot market prices by hourly based simulations. Simulated results were used in profitability calculations. The modeled demand, including delivery and network losses, is around 1000 GWh annually. In total, 98% of this demand is covered by the two cogeneration units, CHP2 and CHP3, located in the main powerplant area. CHP2 is a fluidized bed boiler, first connected to the grid in 1982, with net heat capacity of 210 MW thermal and 60 MW electric power. CHP3 is a circulating fluidized bed boiler, commissioned in 2011, with 100 MW thermal and 50 MW electric power capacity. Both boilers can handle a large variety of biofuels and peat. In the reference case, 40% of the consumed fuel is peat and the remaining 60% is energy wood in different forms. The model was slightly simplified by assuming that all of the peat was consumed in CHP2 during the coldest winter months, from November to March. The 15 oil fired boilers used for peak demand are combined into one 360 MW heat production unit named Peak. There is also a small engine generator, CHP1, producing heat and power from biogas connected to the heating network outside the power plant area [27].
A model for the studied case was built based on data from public sources [25], portraying the network and power plant configuration from the reference year 2019. The referred year had a moderately mild winter, with an average temperature during January, February, and December of −5.5 °C, while the average during the past decade for these coldest three months in the region was −6.8 °C [28]. The heat demand 997 GWh was shaped into a heat demand profile according to year 2019 S17 heating degree days (HDDs), assuming that 30% of the annual heating demand remains constant throughout the year. The HDDs were calculated by the software from hourly outside temperatures gathered from the Finnish Meteorological Institute’s database [29]. The reference model (Reference) was then validated against production data by running a baseline simulation (Baseline). Fuel consumption, heat, and power production values were verified from the annual report [25]. Insight on plants’ running order and minimum loads were gained through interviewing the production manager of the referred powerplant [29].
Some assumptions and initial values are needed for simulating future district heating production. The market price of electricity, European Emission Allowances (EUA), fuels, and taxes play a large role in determining the profitability of the studied case. These values were available for the reference case of year 2019 at Statistics Finland and Nord Pool [13,30,31,32]. However, for future simulation, scenario modeling is needed. In the study of Nordic energy markets in the 2030s, Khosravi et al. introduce 17 different scenarios that represent different paths to decarbonization of energy production in Finland by 2035 [9]. Their Scenario 9, introduces 3700 MW of new wind power into the Finnish energy generation, responding to the government’s target to increase the share of wind power with a feed-in tariff system. Furthermore, in Scenario 9, all coal fired plants are shut down and nuclear power is increased by 1600 MW as a result of the Olkiluoto 3 (Eurajoki, Finland) powerplant starting electricity production. All costs and revenues used in this study are real 2019 prices. Prices from sources using different base years are adjusted to 2019 prices, according to the realized inflation rate of Finland. From 2020 onwards, a 2% inflation is assumed. Marginal costs used in calculations are representative costs, not exact prices paid by the studied power company.
Since the area price for electricity is determined as function of supply and demand, introduction of more power to the market lowers the area price, as is the case in Scenario 9 by [9]. The simulated timeseries for Finland’s 2030 area price, which is used as input in the current study’s future models, shows a 32% decrease in the annual average electricity price compared to 2019. It is evident that abandoning coal in power production increases demand for wood fuels, raising their cost. Cost of biomass fuel for this study was calculated from [9] as the average price for stem and logging residue wood chips. The 2030 delivery price of peat is slightly reduced from 2019 value, but an assumption is made here that tax on peat will increase by 3.0 EUR/MWh, resulting from the Finnish government’s plan to reduce peat use through taxation. Currently, the fuel CO2 tax favors the use of peat significantly: as can be seen from Table 2, the tax on peat is a small fraction of tax on light fuel oil, for example. The tax on light fuel oil was assumed to rise by 3.0 EUR/MWh by extrapolating the recent trends from [33]. These assumptions, which are considered conservative, result in around 20% increase in the marginal costs of combustible fuels. Emission allowances are raised by 20% in the used scenario. The value for SMR fuel uranium oxide (UO2) from [20] includes the cost for fuel disposal and is assumed to remain constant during the examined period. Input values used in the simulations are shown in Table 1.
In addition to fuel prices, the economy of heat production is affected by investment costs of the energy producing units and the fixed and variable operation and maintenance (O&M) costs. The annual investment costs are determined by the marginal investment price, plant units’ size, the economic life of the units, and the interest rate for which the weighted average cost of capital (WACC) value of 6%, including the effect of inflation, was used.
Investment and O&M costs of SMRs are discussed in Lindroos et al. [21] and Vegel et al. [34]. In these studies, the marginal investment costs vary between 1044 and 1566 kEUR/MWdh (NuScale CHP), variable O&M between 3.15 EUR/MWhdh and 4.8 EUR/MWhdh, and fixed O&M between 27 kEUR/MWdh and 40 kEUR/MWdh. Table 3 shows the investment and O&M costs for generic CHP and SMR units, converted from Värri et al. [20]. Technology data for generation of electricity and district heating are available in e.g., [35], but [20] are used as reference also for CHP-related costs, as they include the view from the Finnish energy industry and are more representative of actualized investment costs in Finland [36]. Values for the CHP operational and capital costs are converted from units EUR/MWe used in [20] to EUR/MWdh, assuming a 30% efficiency for electricity and 60% efficiency for heat production. These values correspond to plant sizes in the range of 0–300 MWdh. For studies of the target period 2030–2060, the size of the district heating network and annual average temperature were assumed to remain roughly the same. Therefore, the annual heat demand was set to 1000 GWh. Reference year 2019 temperature data were used as input for simulations. For SMR investments, a 30 year economical life was assumed, starting from the beginning of 2030. The construction time for the heat-only SMR was assumed four years from the beginning of 2026 to the end of 2029, regardless of size or the number of units built. Investment costs were divided equally along the four years of construction.
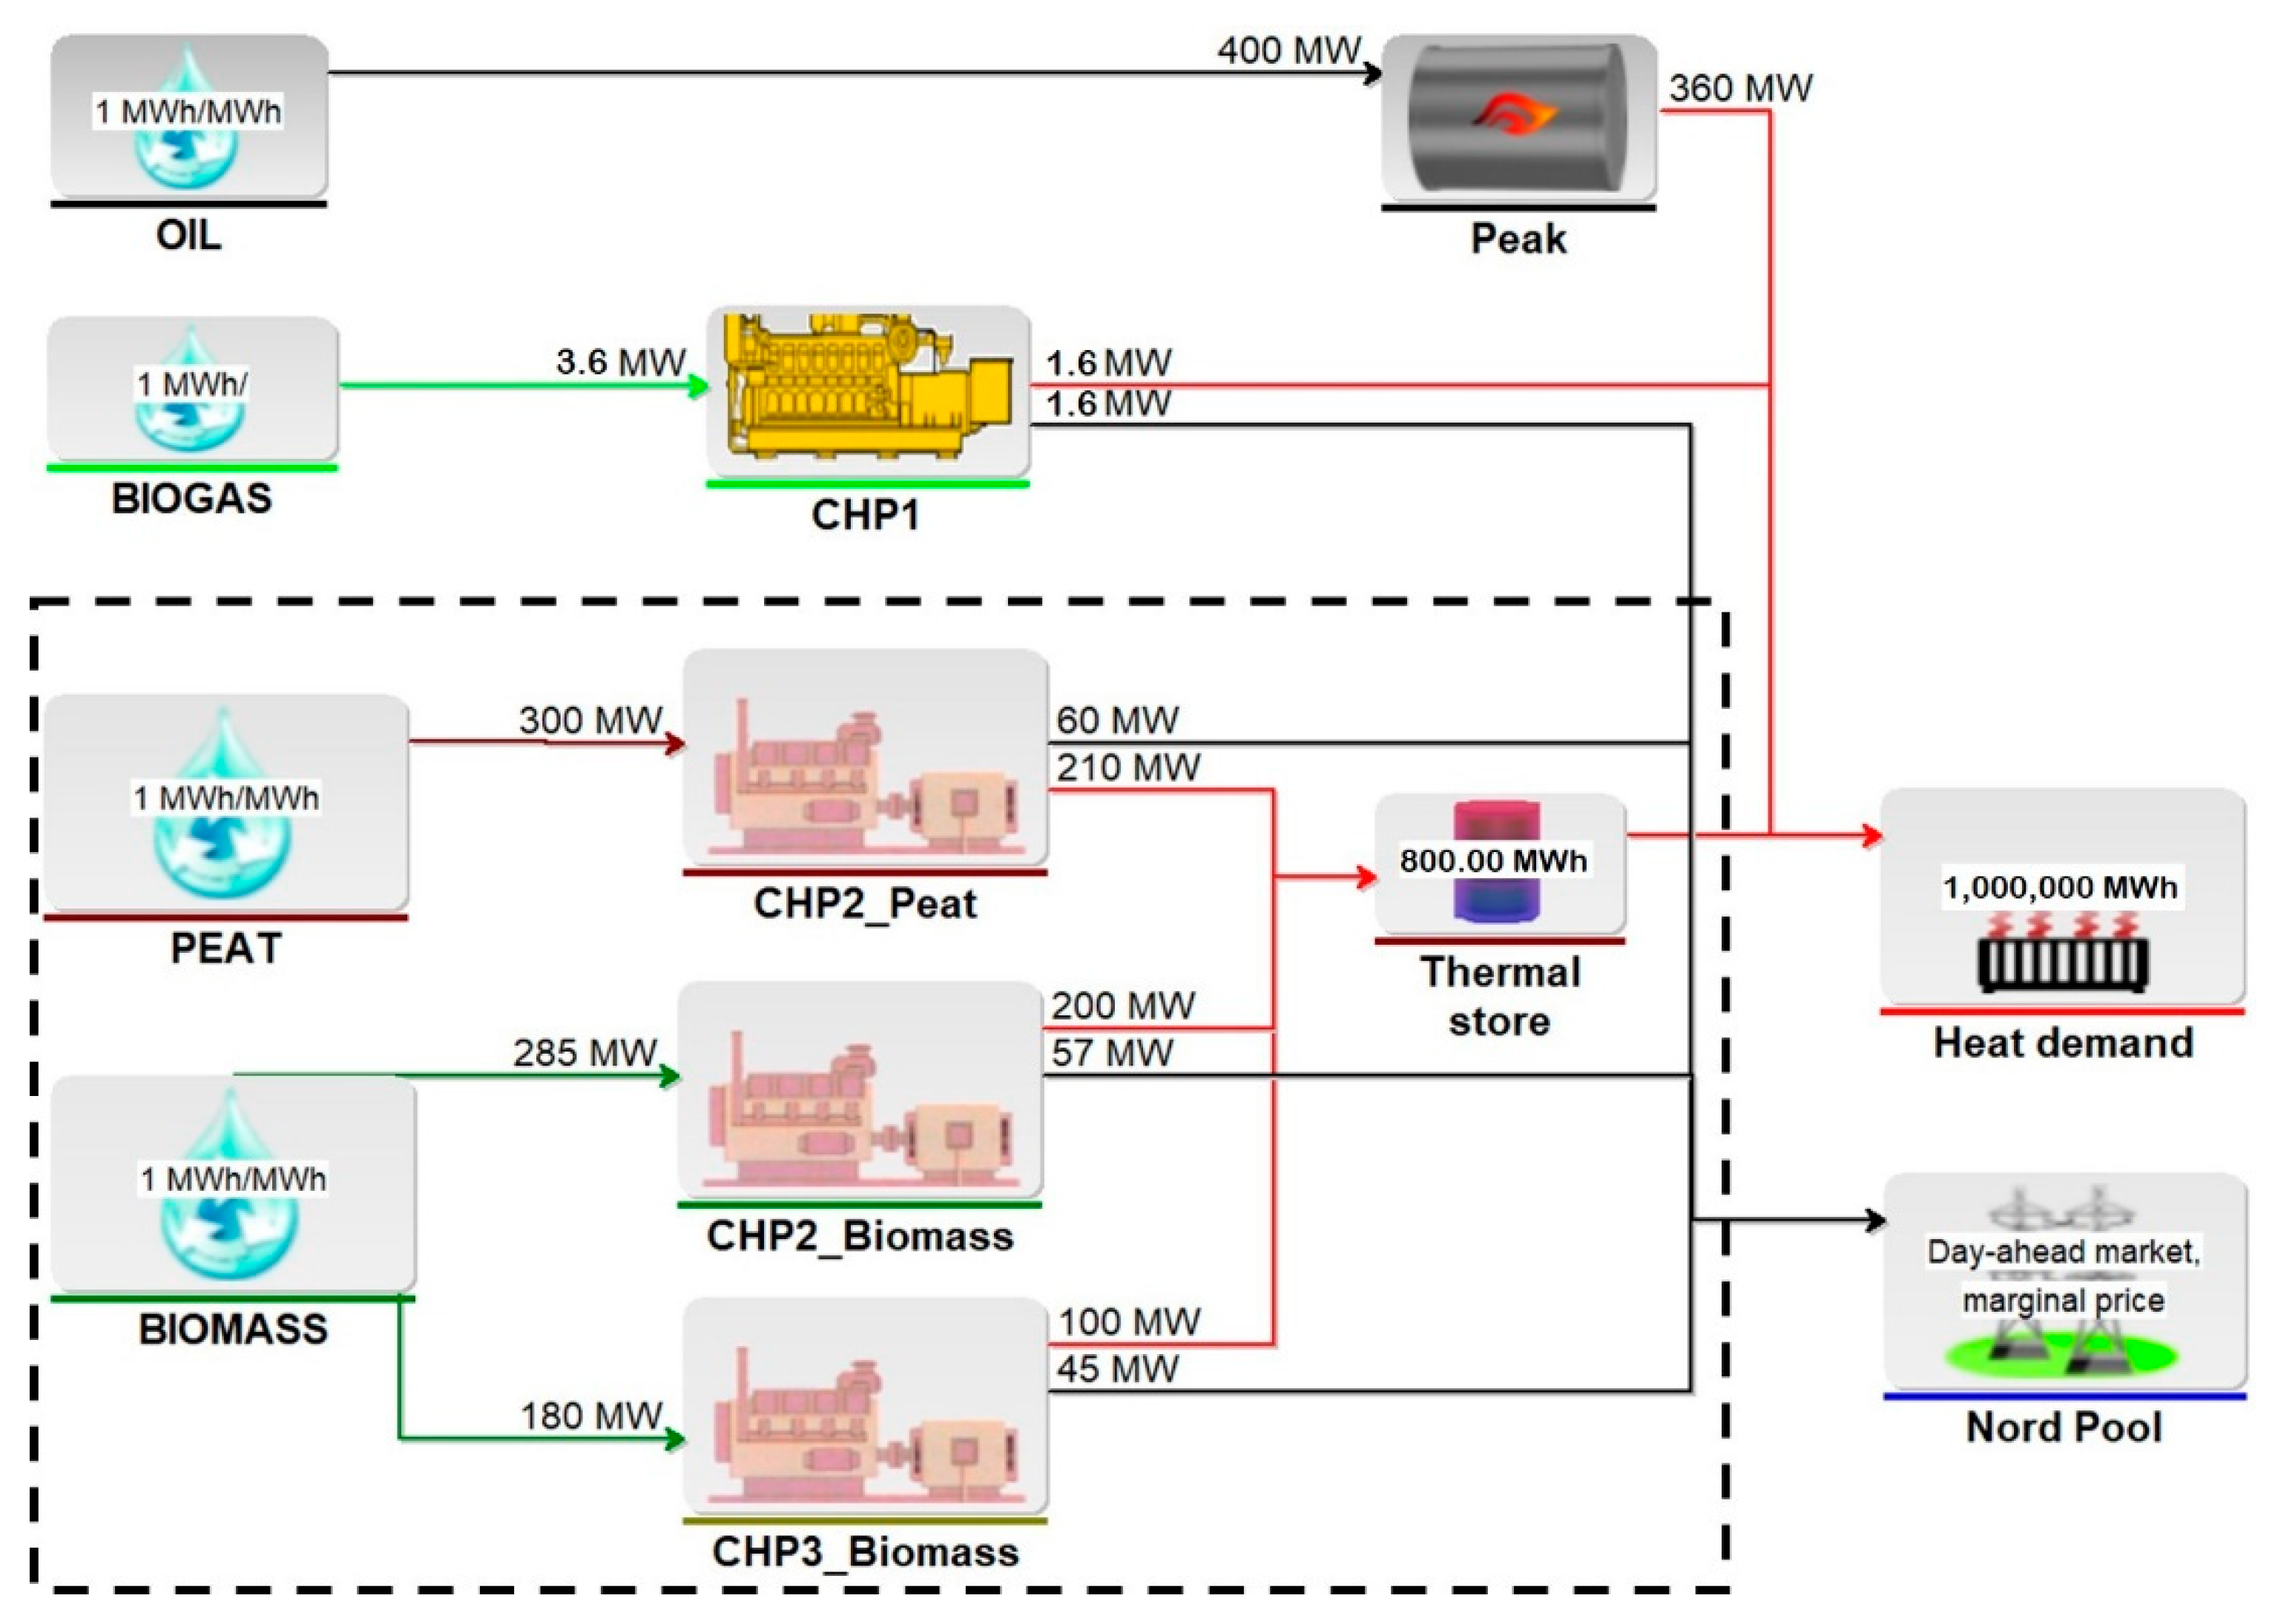
Four new models were constructed based on the validated reference model of 2019. Model 1 is essentially the model Reference with two distinct differences. An 800 MWh thermal storage was introduced in the power plant area, which corresponds to the 15,000 m3 hot water accumulator that was commissioned early in 2020. In addition, the ratio between the combustible fuels peat and biomass was changed from 40/60 to 20/80, as this is set as a goal by 2024 in the district heating company’s strategy [28]. No other changes were made on the plant configuration. Model 1 configuration is depicted in Figure 1. The two plants, CHP2_Peat and CHP2_Biomass, are physically the same plant, but during simulations, they alternate production according to the fuel used. Notice that power outputs differ slightly between the two, caused by different fuel heat values.
The rest of the models are built on Model 1 by replacing CHP units with heat-only SMRs. In Model 2, CHP2 is replaced with a single 200 MW heat-only reactor. Model 3 has five smaller reactors, replacing CHP2 with 24 MW thermal output each. Model 4 is modified from Model 1 by replacing both CHP2 and CHP3 with 8 smaller 24 MWt reactors. The larger, 200 MW generic heating reactor is here on simply called SMR and the smaller, 24 MW generic heating reactor is denoted as microreactor or (MNR), according to the definition used by the UK Department for Business, Energy & Industrial Strategy for SMRs, having a capacity up to 100 MWt/30 MWe [37]. Each model was used to simulate heat and power production during an average heating year, chosen as 2019. Including the baseline, altogether, five simulations were performed, as listed below in Table 4.
Variable costs (costs for fuel and taxes, carbon costs, and variable O&M), weather data, and the price of electricity as timeseries were used as input for the EnergyPRO optimization simulations. Reports received as output included unit-specific data on annual variable costs and revenues from electricity sales, which were then transferred into an Excel spreadsheet, where fixed operating costs and the investment costs were added. Price of heat was not included in the simulations, but determined later through break-even analysis.
Break-even analysis was performed by determining the net present value (NPV) for all five studied cases. According to Brealey et al. [38], NPV > 0 implies profitability, whereas NPV < 0 implies non-profitability. The break-even price for heat is, therefore, obtained at NPV = 0. The used Equations (1)–(3) are modified from [38,39]. Earnings before interest and taxes (EBIT) are calculated as:
where R is the (annual) revenue from electricity and heat sales (EUR), CV (EUR/MWh) and CF (EUR/MW) are variable and fixed operating costs, and D is the depreciation value (EUR) determined by dividing investment costs equally along the 30 year lifetime of the unit. Free cash flow (FCF) is calculated from EBIT by:
where TC is corporate tax rate, which in Finland is currently 20% [40] and I is annual investment costs (in the studied case, I = 0 is assumed). NPV is calculated as:
where FCF0 is the cost of the initial investment, r is the used discount rate, and n is the lifetime of the plant in years. Revenue used in (1) is summed up from the unit wise production data received from EnergyPRO:
where:
| PE | is the Price of electricity (EUR/MWh); |
| E | is the Produced amount of electricity (MWh); |
| PH | is the Price of heat (EUR/MWh); |
| H | is the Produced amount of heat (MWh); |
| n | is the operation time of plant (a); |
| T | is the total hours per year (h); |
| m | is the number of production units. |
Production unit-specific annual variable costs were obtained through similar calculations. NPV was calculated from FCF according to Equation (3) using an initial guess for the price of heat and the break-even price for heat was determined by using the goal seek function of Excel by setting the NPV to zero and iterating the price for heat accordingly. The existing CHP was considered as sunk cost and the possible remaining investment costs of CHP3 were omitted when evaluating the profitability of SMRs.
3. Results
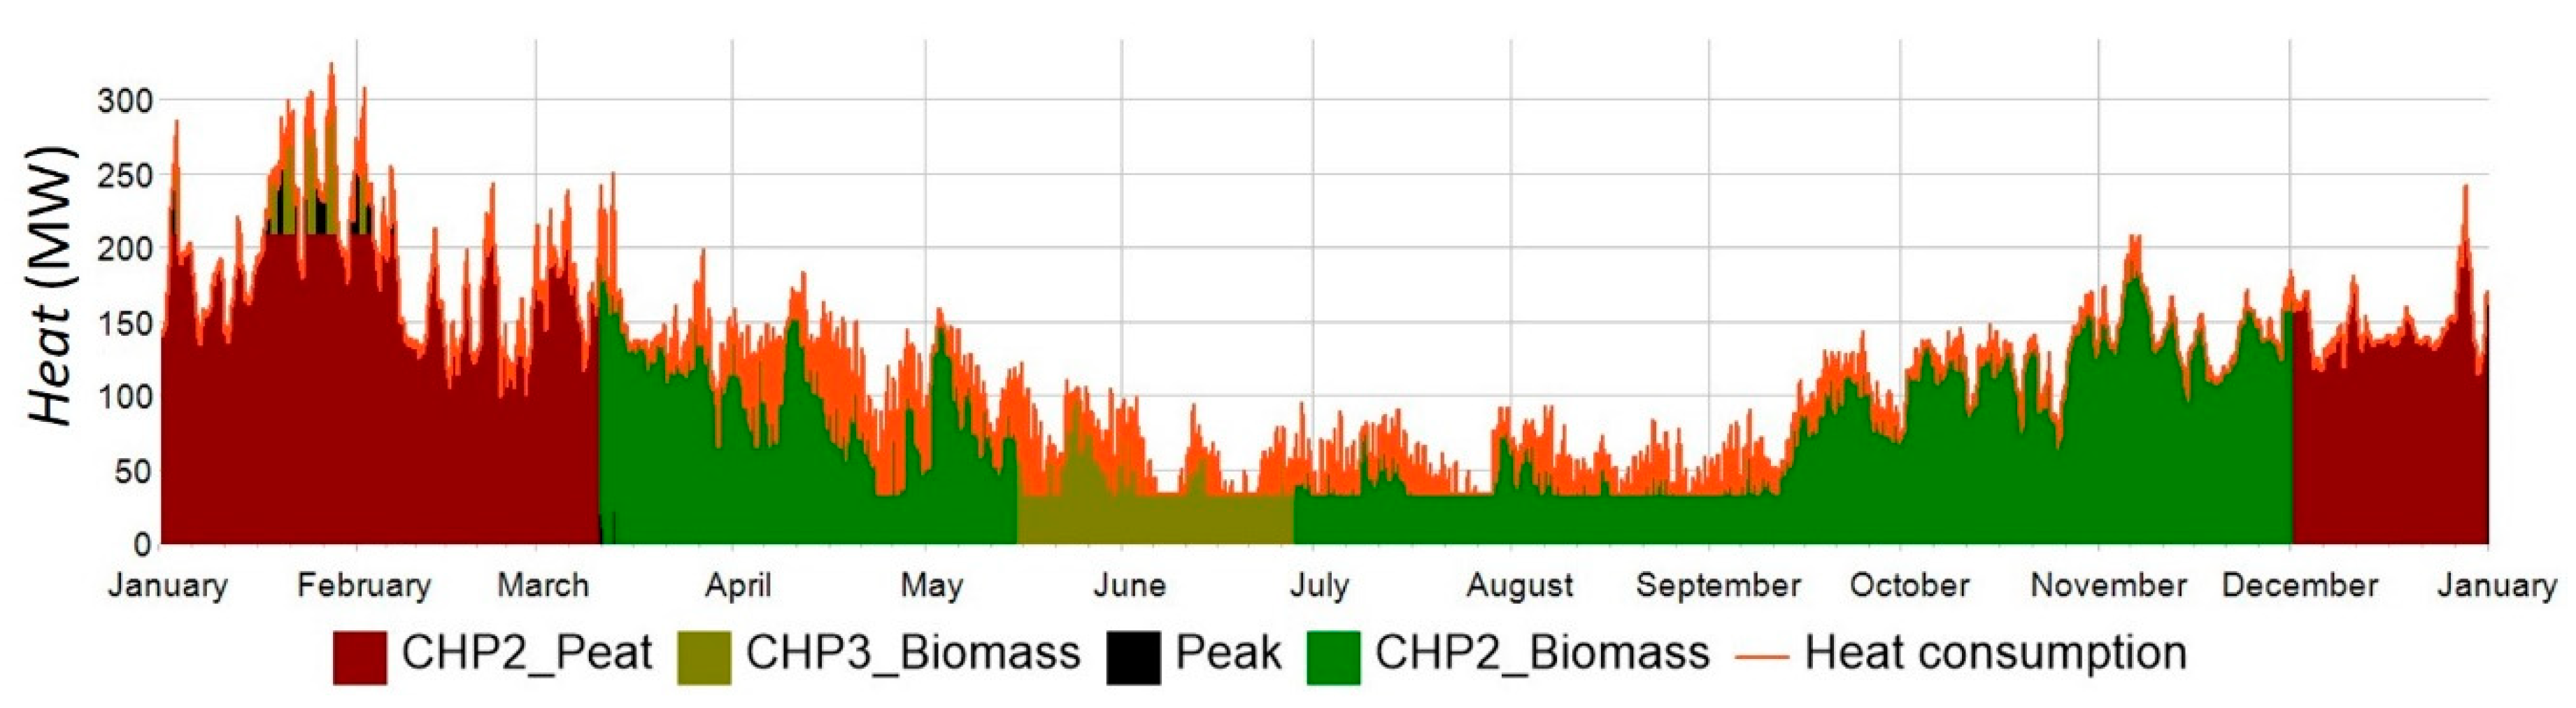
A series of simulations were run for a period of one year, starting from 1 January 2030 for calculating the annual average break-even price for future heat production. Values from Table 2 and Table 3 and the hourly timeseries for outside temperatures and electricity prices of corresponding years were used as input to Reference and Models 1–4. The used software optimized the production between the plant units by minimizing the total variable costs while meeting the hourly heat demand. The output data from the simulations were used to calculate operational expenses and revenue from electricity sales needed for break-even analysis. Figure 2 shows the hourly time series for heat demand for baseline simulation of the reference year 2019.
The heat demand profile, drawn in red in Figure 2, is used in all simulations. Heat demand is highest from January to February, resulting from cold outside temperatures, and lowest from June 1st to the beginning of September. The minimum heat load value seen in the figure during summer months is around 30 MW corresponding to the 30% constant heat demand, consisting mainly of domestic hot water consumption. As seen from the production profile, biomass is used from mid-May to the end of June in the smaller plant, CHP3, and during autumn and winter months with the larger plant, CHP2. During the coldest period from January to February, both plants operate simultaneously. During this time and partly in December and March, CHP2 uses only peat. The Peak plants are generally used in the rare cases, when CHP production does not cover the demand due to either lack of capacity or slow start-up.
Simulations generated production unit-specific data of the amounts and costs of fuels used, produced CO2-emissions, electricity generated, and revenue gained from its sales. The amount of produced heat was used to calculate the variable O&M costs and the fixed O&M costs were calculated according to the installed DH capacity using values from Table 3. Production data, revenues, costs, NPV, and the average break-even price calculated from Equation (3) for the five simulated cases are shown in Table 5.
The results show that the break-even price is over 10 EUR higher per MWh of heat in the future scenario for the current configuration. This is mostly due to an increase in the cost of combustible fuels and to some extent, to the decline of electricity prices, both of which are relevant to CHP production profitability. As Simulations 2–4 show, replacing CHP production with heat-only production decreases electricity production and diminishes revenue gained from its sales. On the other hand, turning from peat-fired plants to CO2-free nuclear plants reduces the effect of emission allowances. In addition, changing the fuel to uranium oxide, which has a smaller marginal cost than peat, decreases operational expenditures. As a result, the break-even costs for SMR-driven production in 2030 are, on average, the same as for heat produced with CHP only. The results in Table 5 confirm that CHP production costs are dominated by the variable expenses and SMR production by the fixed costs. The effects of changes in selected variables and fixed costs on the break-even costs for DH are evaluated in Table 6.
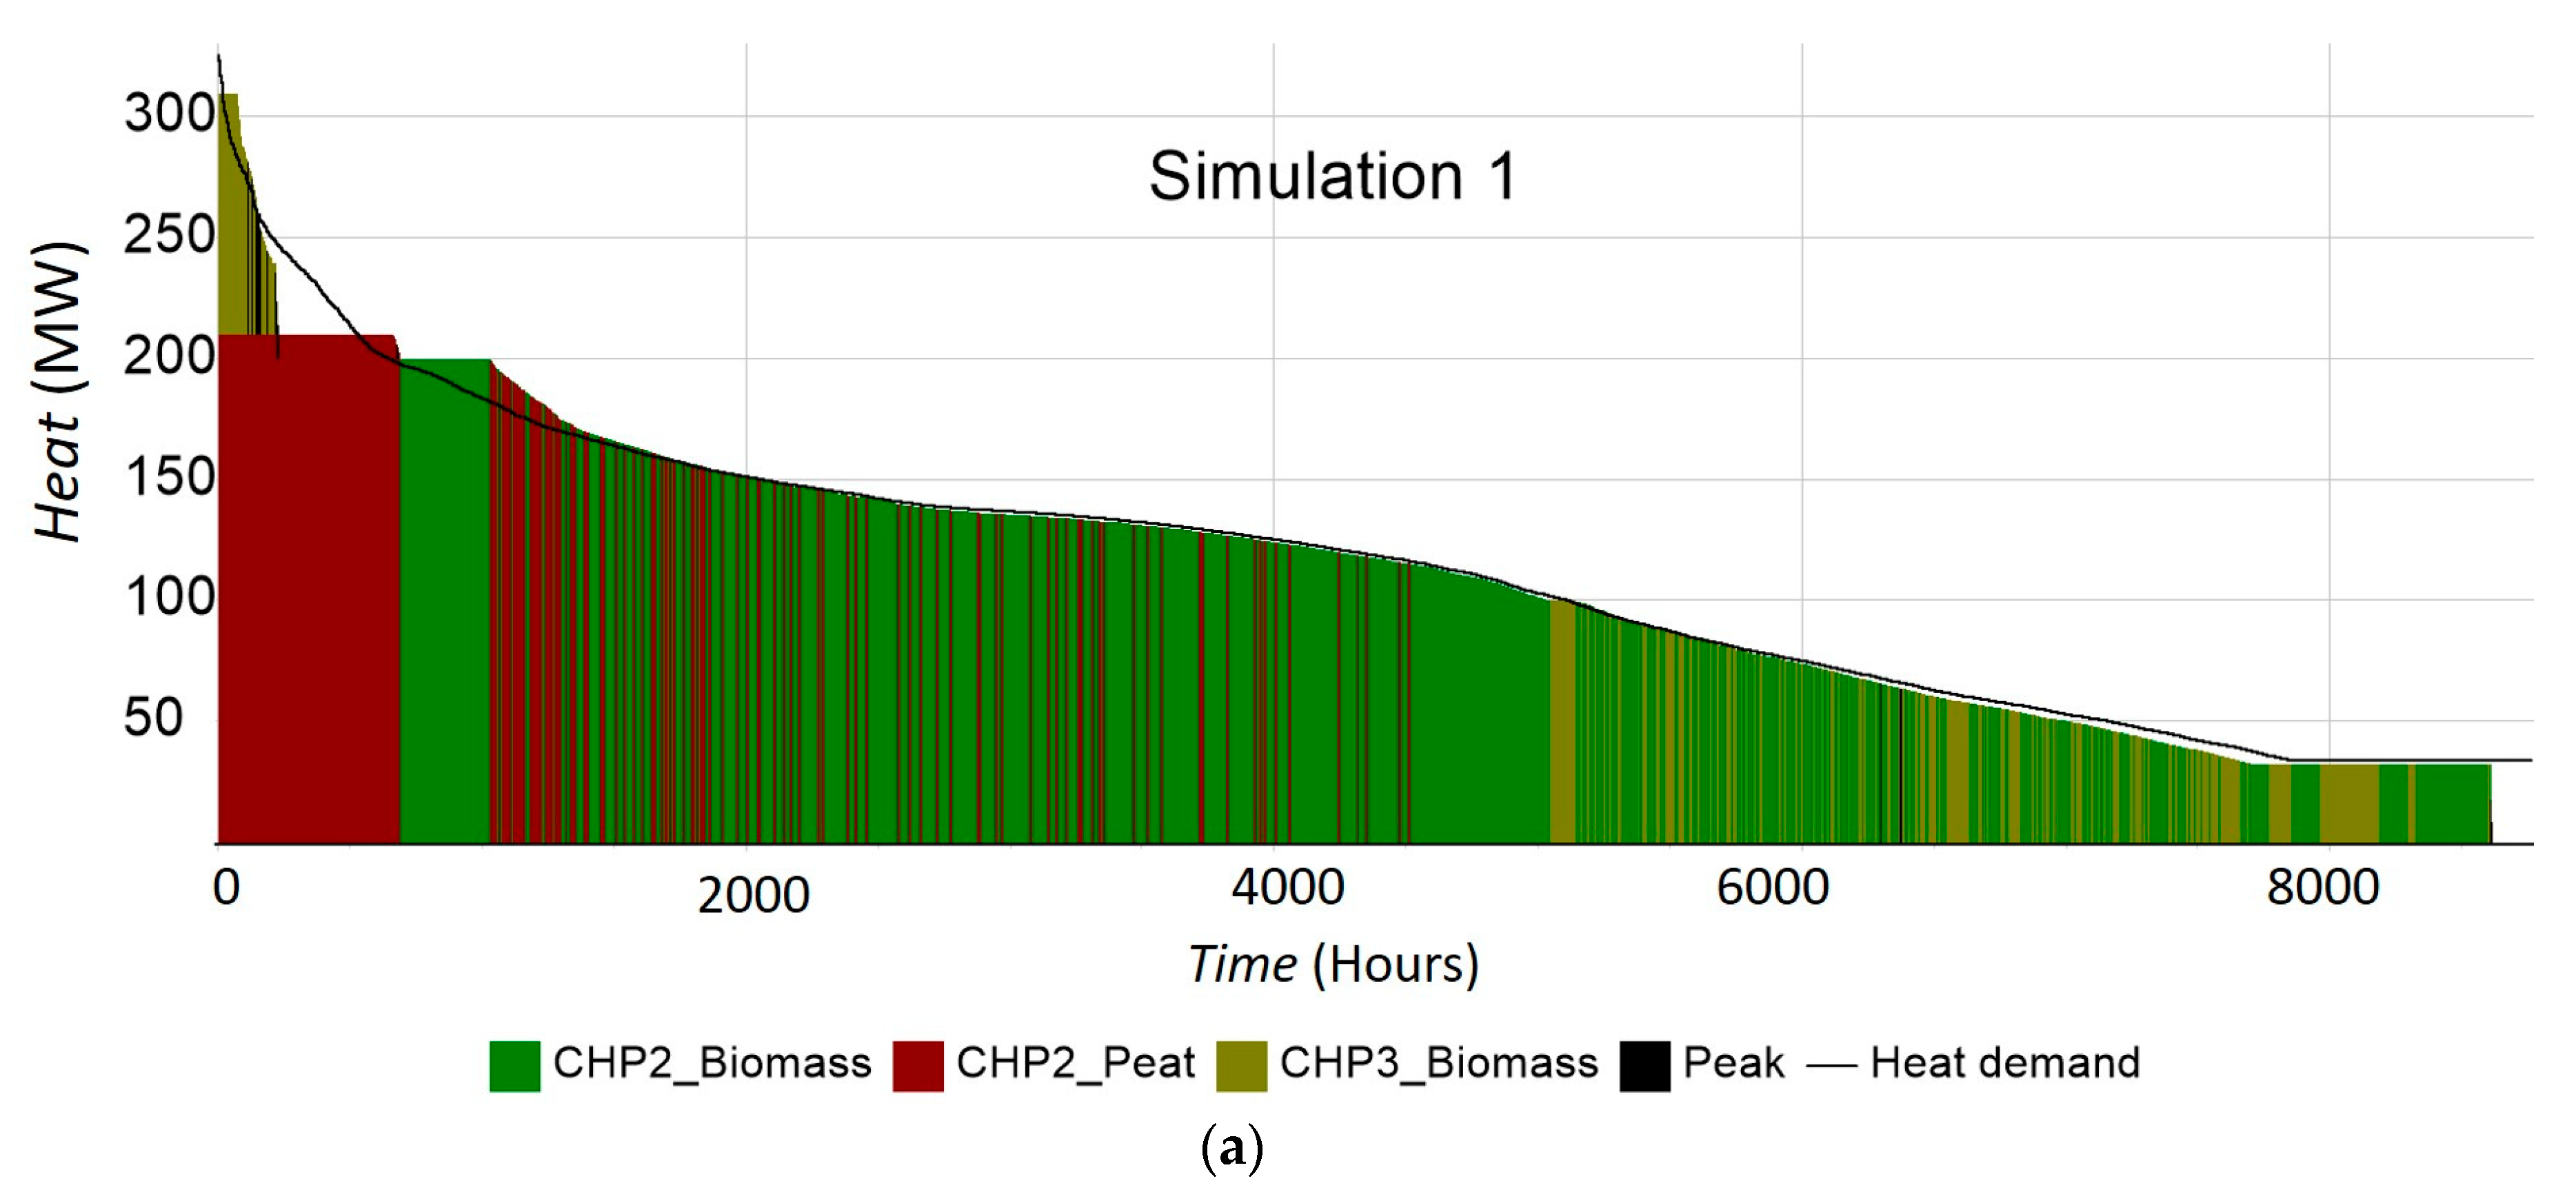
As seen above, the largest uncertainties for CHP production lie in the prices of combustible fuels. A forty percent increase in biomass costs results in over a 10 EUR increase in the marginal cost for heat in Model 1. The price of electricity also influences Model 1 economics, although not as significantly as the fuel costs. SMR investment costs have the greatest affect on SMR production costs. The cost of produced heat increases by 19–28%, depending on the case, if SMR investment rise by 40%. While the fixed O&M costs for SMRs have a noticeable effect on the break-even cost for heat, the effect of variable O&M is marginal. Because of high investment costs, nuclear power is traditionally used as baseload, whereas small biomass boilers can be used for peak production. Duration curves in Figure 3 show that this applies also for the economically optimized heat production in Simulations 1–4.
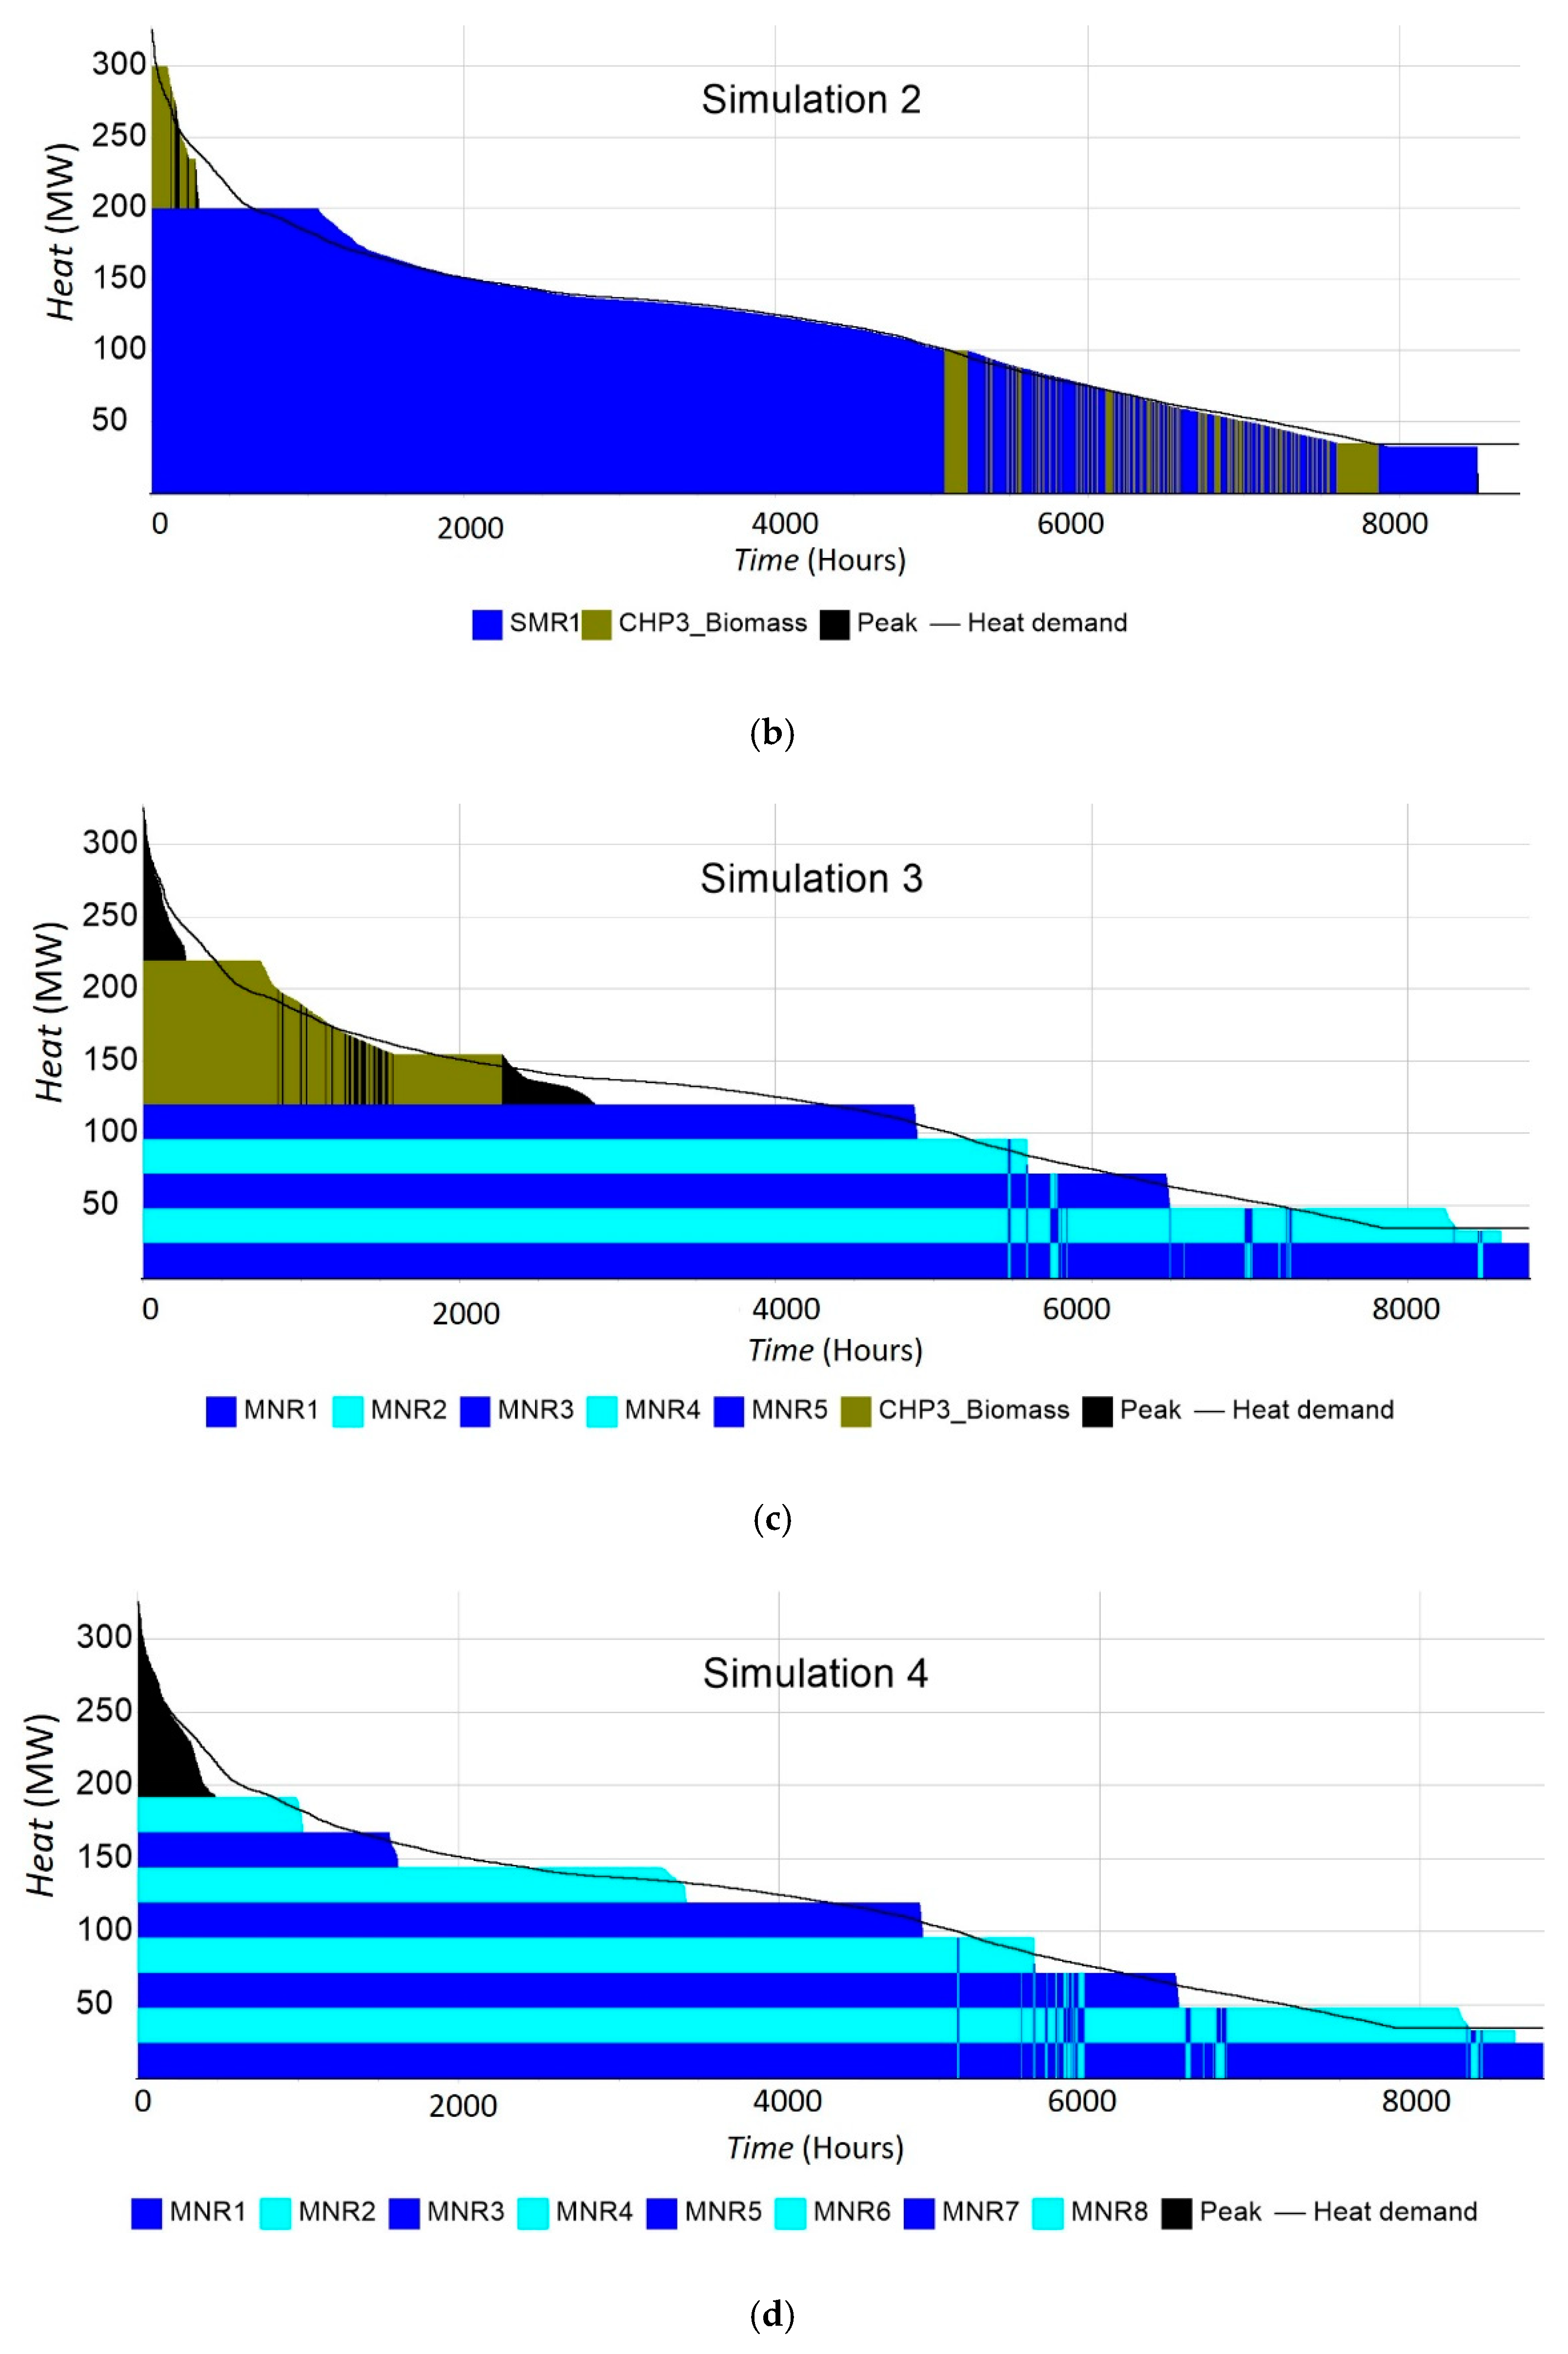
In Simulation 1, the operating hours of the CHP-plants are close to the reference case of 2019, although the operating hours of the peak plants are less as a result of implementing heat storage. This is seen in Figure 3a as gaps between the heat duration curve and the production profile. In Simulation 2 Figure 3b, the baseload is covered by the nuclear reactor SMR and peak demand is covered by biomass-fired CHP3. It can be seen from the figure that actual full load hours for the SMR are a little over 1000 and that most of the time, the SMR runs on reduced output. In Simulation 3 Figure 3c, the nuclear baseload capacity is less than in Simulation 2 and the five MNR units run mostly on full power when not on standby. Because in this case, CHP3 does not cover the coldest period demand entirely, oil-fired plants are needed to cover the peak demand. In Simulation 4, all but peak loads are covered with nuclear MNR units 1–8. The full load hours for the MNRs decrease as their number increases. Since SMR investment costs depend heavily on the unit size, optimization is required. The trade-off between the amount of installed power and load factors results in either costly oversized units running on reduced output or baseload running on high full load hours but requiring alternative means to meet peak demand. Table 7 shows the annual operating hours (OH), number of starts, and equivalent full load hours (EFLH) for Simulations S2–S4.
Figure 3 and Table 5 show CHP3 and SMR1 running on low loads in Simulation 2. Simulation 3 has more economical load factors for both types of units but relies partly on oil-fired plants to cover the peak demand. Since there are no biomass units in Simulation 4, it relies even heavier on oil, but also has poor load factors for some of the MNRs. In addition, the number of start-ups for MNRs are altogether 57, over twice more than in Simulation 3 and nearly 30 times more than in Simulation 2 (27 starts).
4. Discussion
Finnish municipal power companies are well-established in providing heat to their customers and optimizing their power production while minimizing emissions. Strategies to decrease the use of high CO2 emission fuels and plant upgrades, such as implementing flue gas heat recovery systems, will not only reduce emissions, but can improve overall economics, as in the studied case [28]. Plant production can further be optimized by modernizations that increase production efficiency. The implementation of the thermal storage by the power company in this case study brings not only financial gains but also environmental benefit, as it reduces the need for oil-fired peak production. The newly implemented thermal storage proved valuable, as in the simulations, it cut the annual oil need to a third, adding up to a financial saving of nearly 0.5 million EUR annually. There is also a benefit available through CHP production optimization by utilizing the thermal buffer against fluctuating electricity prices. However, these measures do not stop the inevitable trends of increasing costs for combustible fuels and the declining electricity prices. The simulations show that with the current configuration, the case study plant brings a third less revenue from electricity sales in the 2030s than today. A CHP plant produces revenue from both electricity and heat sales. Since the simulated electricity production is less than one-third of the amount of produced heat and as consumer price for heat is higher than that of electricity in all studied models, electricity sales will not cover more than 20% of total revenue. For this reason, the gross profit of the district heating company is not dramatically affected by replacing CHP production with heat-only production. As the average market price of electricity is predicted to come down, the effect becomes even less meaningful. The price of combustible fuels will, however, play a major role in determining the profitability of traditional CHP production in district heating strategies.
This study confirms earlier studies [20,21] by showing economic viability in providing nuclear heat to Nordic municipalities with small heat-only reactors. The three different models 2–4, with conventional CHP production mixed with nuclear heat-only reactors, were all found plausible, as they were able to meet the simulated heat demand with around the same production costs than the current CHP-driven configuration of Model 1 and with less than 1/10 of the CO2-emissions. Looking at the break-even prices for heat, Models 3 and 4 performed best. However, as Lindroos et al. [21] point out, the economics of DH are further affected by the effective full load hours. Although the equivalent full load hours for the 200 MW SMR1 in Simulation 2 are over 4600, it is seen from the duration curve that full power was achieved for little over 1000 h, while for the rest of the time, the plant was operating on partial loads. On the positive side, the apparent overcapacity results in only a marginal need for use of oil. The full load hours for CHP3 in Simulation 2 are only in the hundreds, indicating low average power output. In Simulation 3, the full load hours for both the MNRs and CHP3 are higher, resulting in double the income in electricity sales compared to Simulation 2. On the downside, there are more turn-ons on the CHP3, and oil use is substantial in periods of peak demand. In Simulation 4, the full load hours for MNR7 and MNR8 are less than 2000, which according to [21], is considered a significant risk on profitability. Since adding nuclear capacity would further reduce the load factor, it is evident that it is not beneficial to try to cover the whole heat demand with heat-only SMRs. The optimal solution for SMR use in this district heating case is a hybrid with some biomass-fired CHP and some nuclear for heat-only production. Using smaller unit size brings additional benefits, as the yearly overhauls can be performed in series or partly overlapping. By this approach, the SMRs can be utilized in heat production throughout the summer. Having a single large SMR shut down for several weeks during the summer results in CHP production during a time when electricity prices are usually low. Although Simulation 4 resulted in a competitive break-even price for heat production, it had the worst load factors and there were over twice the number of start-ups compared to Simulation 3 with the most competitive break-even price. None of the Simulations 2–4 represent the absolute optimum solution, but Simulation 3 shows the most promise economically.
The largest uncertainties concerning use of nuclear reactors in heat production lie in their investment costs. Sensitivity analysis shows that a 40% increase in SMR capital costs affects the marginal cost for heat by 19–28%. For Model 3, this increase amounts to a 42.8 EUR/MWh marginal price for heat, which is still less than 10 percent higher than the price for CHP-only production of Model 1. Electricity prices and O&M costs play a much smaller role in the economics of the studied case than SMR capital costs and biomass prices. The possible investment costs for a new CHP plant to replace CHP2 have been omitted in this study. Adding an apparently necessary CHP investment to the calculations would make, in comparison, the SMRs economically even more appealing. A heat-only biomass boiler could be more economical than a CHP-plant, but it would not remove the fuel price risk or risk of availability.
Model 3, replacing CHP2 with five 24 MW microreactors, shows most promise of the three SMR district heating concepts. It would benefit from further development, either by introducing a sixth MNR into the mix or by improving the thermal efficiency of CHP3 by implementing a flue gas heat recovery system to gain extra output. Optimization, aimed at minimizing use of the oil-fired peak plants in Model 3, should include a reference heating year with at least one exceptionally cold period. The overall investment price for SMRs has been the focus of studies [20,21]. They concentrate on SMRs of thermal power around 200 MW that are already either in the demonstration or licensing phase. While there are estimates on costs for these concepts currently on the verge of commercialization, there are no reliable data available on the investment costs for microscale heat-only reactors on the 10–50 MWt scale. This should be the focus on the future studies. The increasing costs and challenges in acquiring wood fuels, such as logging residue chips, drive power companies to seek means to supply heat with methods less dependent on economic fluctuations. This study shows promise in using emerging SMR technology to replace CHP production with heat-only SMRs in medium-sized Nordic district heating networks. The studied SMR scenarios are beneficial in comparison to using the existing CHP in terms of conventional air pollutants, primarily particulate, black carbon, and NOx emissions [41,42]. This study is not directly scalable for larger networks with wider ranges of heat sources available. For instance, heat pumps can be a notable source of DH when suitable heat streams are available [9,43,44]. Considering recent progression in SMRs, investments in local heat producing plants are plausible at the earliest, in the 2030s. Before this, legislation, public acceptance, and other matters need to be resolved.
5. Conclusions
Finland has a huge challenge in the Government’s Official target of reaching carbon neutrality by 2035. The electricity production is already very low-carbon, but the city DH systems are very reliant on fossil fuels and the local high-emission fuel peat. Large-scale switching to biomass fuels would decrease the carbon sinks of Finnish forests, while biomass prices would probably increase dramatically with increasing demand. The possibilities of heat pumps are restricted by the available heat sources. Thus, it is very relevant to study the possibilities of SMRs in solving this challenge in the medium-term future.
This study shows that replacing CHP production with heat-only with SMRs can be profitable to municipal district heating companies The average break-even price for heat production includes a certain amount of uncertainty, but shows that by combining nuclear heating reactors with CO2-free CHP production, a reasonable consumer price for district heating customers can likely be maintained in the coming decades. The results can be applied by power companies to form strategies for coping with the inevitable availability issues for biomass caused by abandoning the use of coal by 2035. In the studied case, the most promising solution consisted of five 24 MW heat-only SMR units combined with a 100 MWt CHP plant. Profitability depends on the variable and fixed SMR costs, which all include uncertainties. The largest uncertainty lies in the investment costs for emerging SMR technologies, and this should be the main focus of follow-up studies. Further studies should also encompass profitability analyses with alternative electricity price developments and with different wintertime heating needs.
Author Contributions
A.T. is the main author, responsible for data curation, performing model runs, validation of results and writing the paper. S.S. participated in conceptualization and methodology and in reviewing and editing the draft text. P.H. participated in modeling of the reference case and in writing of the methods section. All authors have read and agreed to the published version of the manuscript.
Funding
PhD studies of A.T. were funded by Finland’s Employment Fund. The work of P.H. was funded by EU H2020 Grant Agreement number 856602—FINEST TWINS project.
Acknowledgments
The authors wish to thank personnel of Aalto University Department of Mechanical Engineering for their support, Kuopion Energia Oy of fruitful discussions on district heating and Fortum Oy for their kind co-operation. We thank Aira Hast of Statistics Finland, for her advice on future prices for biomass.
Conflicts of Interest
The authors declare no conflict of interest. This work is a part of A.T.’s D.Sc. studies. The work is based on public data sources and all data used are reported in this manuscript or in the references given. This is an academic contribution and does not represent the official view of Fortum Ltd. or Kuopio Energy Ltd.
References
- Energiavuosi 2019—Sähkö. [Energy Year 2019—Electricity]. Energiateollisuus. 2020. Available online: https://energia.fi/files/4360/Sahkovuosi_2019_mediakuvat.pdf (accessed on 27 May 2020).
- Energiavuosi 2019—Kaukolämpö. [“Energy Year 2019—District Heat]. Energiateollisuus. 2020. Available online: https://energia.fi/files/4402/Energiavuosi2019_Kaukolampo_MEDIAKUVAT_20200120.pdf (accessed on 27 May 2020).
- Government Report on the National Energy and Climate Strategy for 2030. Ministry of Employment and the Economy. 2017. Available online: http://julkaisut.valtioneuvosto.fi/bitstream/handle/10024/79247/TEMjul_12_2017_verkkojulkaisu.pdf?sequence=1 (accessed on 27 May 2020).
- Laki Hiilen Energiakäytön Kieltämisestä. [Law to Ban the Energy Use of Coal]. Finlex. 2019. Available online: https://www.finlex.fi/fi/laki/alkup/2019/20190416 (accessed on 29 May 2020).
- Programme of Prime Minister Sanna Marin’s Government. VALTO. 2019. Available online: http://urn.fi/URN:ISBN:978-952-287-811-3 (accessed on 29 May 2020).
- Fuel Classification 2021. Statistics Finland. 2020. Available online: https://www.stat.fi/tup/khkinv/khkaasut_polttoaineluokitus.html (accessed on 9 May 2020).
- Hiilidioksidipäästöt Polttoaineittain (Hyödynjakomenetelmä). [Carbon Dioxide Emissions from Heat and Power Production (Benefit Allocation Method)]. Statistics Finland. 2020. Available online: https://pxhopea2.stat.fi/sahkoiset_julkaisut/energia2019/html/suom0011.htm (accessed on 12 July 2020).
- Helin, K.; Zakeri, B.; Syri, S. Is District Heating Combined Heat and Power at Risk in the Nordic Area?—An Electricity Market Perspective. Energies 2018, 11, 1256. [Google Scholar] [CrossRef] [Green Version]
- Khosravi, A.; Olkkonen, V.; Farsaei, A.; Syri, S. Replacing Hard Coal with Wind and Nuclear Power in Finland- Impacts on Electricity and District Heating Markets. Energy 2020, 203, 117884. [Google Scholar] [CrossRef]
- Ketterer, J.C. The impact of wind power generation on the electricity price in Germany. Energy Econ. 2014, 44, 270–280. [Google Scholar] [CrossRef] [Green Version]
- Brancucci Martinez-Anido, C.; Brinkman, G.; Hodge, B.-M. The impact of wind power on electricity prices. Renew. Energy 2016, 94, 474–487. [Google Scholar] [CrossRef] [Green Version]
- Storm Causes Short-Lived Negative Electricity Prices. YLE. 2020. Available online: https://yle.fi/uutiset/osasto/news/storm_causes_short-lived_negative_electricity_prices/11201041 (accessed on 29 May 2020).
- Kotimaisten Polttoaineiden Käyttäjähinnat Energiantuotannossa. [Delivery Prises for Domestic Fuels in Energy Production]. Statistics Finland. 2020. Available online: http://pxnet2.stat.fi/PXWeb/pxweb/en/StatFin/StatFin__ene__ehi/statfin_ehi_pxt_001_fi.px/ (accessed on 29 May 2020).
- Hast, A.; Syri, S.; Welsch, J.; Korkmaz, P.; Balyk, O. Transition to Carbon Neutral Energy Systems—Implications to District Heating in Cities. EEM 2018, 15, 1–5. [Google Scholar]
- Tulkki, V.; Pursiheimo, E.; Lindroos, T.J. District Heat with Small Modular Reactors (SMR). 2017. Available online: http://www.vtt.fi/inf/julkaisut/muut/2017/OA-District-heat-with-Small.pdf (accessed on 29 May 2020).
- Hidayatullah, H.; Susyadi, S.; Hadid Subki, M. Design and technology development for small modular reactors - Safety expectations, prospects and impediments of their deployment. Prog. Nucl. Energy 2015, 79, 127–135. [Google Scholar] [CrossRef]
- Sainati, T.; Locatelli, G.; Brookes, N. Small Modular Reactors: Licensing constraints and the way forward. Energy 2015, 82, 1092–1095. [Google Scholar] [CrossRef] [Green Version]
- Shropshire, D. Economic viability of small to medium-sized reactors deployed in future European energy markets. Prog. Nucl. Energy 2011, 53, 299–307. [Google Scholar] [CrossRef]
- Locatelli, G.; Bingham, C.; Mancini, M. Small modular reactors: A comprehensive overview of their economics and strategic aspects. Prog. Nucl. Energy 2014, 73, 75–85. [Google Scholar] [CrossRef]
- Värri, K.; Syri, S. The Possible Role of Modular Nuclear Reactors in District Heating: Case Helsinki Region. Energies 2019, 12, 2195. [Google Scholar] [CrossRef] [Green Version]
- Lindroos, T.J.; Pursiheimo, E.; Sahlberg, V.; Tulkki, V. A techno-economic assessment of NuScale and DHR-400 reactors in a district heating and cooling grid. Energy Sources 2019, 14, 13–24. [Google Scholar] [CrossRef]
- Leppänen, J. A Review of District Heating Reactor Technology. VTT Technical Research Centre of Finland. VTT Research Report, No. VTT-R-06895-18. 2019. Available online: https://cris.vtt.fi/en/publications/a-review-of-district-heating-reactor-technology (accessed on 9 May 2020).
- Radiation and Nuclear Safety Authority (STUK). Preconditions for the Safe Use of Small Modular Reactors: Outlook for the licensing system. Julkari. 2020. Available online: http://urn.fi/URN:ISBN:978-952-309-454-3 (accessed on 29 May 2020).
- Partanen, R. Nuclear District Heating in Finland, 1st ed.; Think Atom: Vesivehmaa, Finland, 2019; pp. 11–23. [Google Scholar]
- Vuosikertomus 2019. [Annual Report 2019]. Kuopion Energia. 2020. Available online: https://www.kuopionenergia.fi/yritys/tietoa-meista/avainluvut-2/ (accessed on 9 May 2020).
- Energy Pro manual EMD. energyPRO. 2020. Available online: https://www.emd.dk/energypro/ (accessed on 9 May 2020).
- Voimalaitokset ja Lämpökeskukset. [Power and Heating Plants]. Kuopion Energia. 2020. Available online: https://www.kuopionenergia.fi/yritys/tuotanto-ja-jakelu/voimalaitokset-ja-lampokeskukset/ (accessed on 29 May 2020).
- Observation Stations. Finnish Meteorological Institute. 2020. Available online: https://en.ilmatieteenlaitos.fi/observation-stations?p_p_id=stationlistingportlet_WAR_fmiwwwweatherportlets&p_p_lifecycle=0&p_p_state=normal&p_p_mode=view&p_p_col_id=column-4&p_p_col_count=1&_stationlistingportlet_WAR_fmiwwwweatherportlets_stationGroup=WEATHER#station-listing (accessed on 9 May 2020).
- Seppälä, P.; (Kuopion Energia, Kuopio, Finland). Personal communication, 2020.
- Historical Market Data. Nord Pool. 2020. Available online: https://www.nordpoolgroup.com/globalassets/marketdata-excel-files/elspot-prices_2019_hourly_eur.xls (accessed on 9 May 2020).
- Tärkeimpien Öljytuotteiden Kuluttajahinnat. [Consumer Prices for Essential Oil Products]. Statistics Finland. 2020. Available online: https://www.stat.fi/til/ehi/2019/04/ehi_2019_04_2020-03-12_kuv_002_fi.html (accessed on 29 May 2020).
- Metsäpohjaisen Energian Hinta Käyttöpaikalla, €/MWh. [Delivery Price for Forestry Based Energy, €/MWh]. Metsälehti. 2020. Available online: https://www.metsalehti.fi/puunhinta/metsaenergian-kayttopaikkahinnat/ (accessed on 27 May 2020).
- Energiaverotus. [Energy Taxes]. Finnish Tax Administration. 2019. Available online: https://www.vero.fi/syventavat-vero-ohjeet/ohje-hakusivu/56206/energiaverotus/ (accessed on 29 May 2020).
- Vegel, B.; Quinn, J. Economic evaluation of small modular nuclear reactors and the complications of regulatory fee structures. Energy Policy 2017, 104, 395–403. [Google Scholar] [CrossRef]
- Energinet.dk, Danish Energy Agency. Technology Data for Energy Plants—Generation of Electricity and District Heating, Energy Storage and Energy Carrier Generation and Conversion; Energinet.dk, Danish Energy Agency: København, Denmark, 2015; pp. 138–151. Available online: https://ens.dk/en/our-services/projections-and-models/technology-data/technology-data-generation-electricity-and (accessed on 12 July 2020).
- Naistenlahden Uuden Voimalaitoksen Rakentaminen Alkaa Ensi Vuonna. [Construction of Naistenlahti CHP Plant Begins Next Year]. Aamulehti. 2020. Available online: https://www.aamulehti.fi/a/nsedi00128516 (accessed on 12 July 2020).
- Market and Technical Assessment of Micro Nuclear Reactors. Available online: https://assets.publishing.service.gov.uk/government/uploads/system/uploads/attachment_data/file/787411/Market_and_Technical_Assessment_of_Micro_Nuclear_Reactors.pdf (accessed on 22 May 2020).
- Brealey, R.; Myers, S.; Allen, F. Principles of Corporate Finance, 10th ed.; McGraw-Hill/Irwin: New York, NY, USA, 2008; pp. 20–36. [Google Scholar]
- Bhalla, V. Financial Management, 1st ed.; S. Chand & Company: Ramnagar, New Delhi, India, 2014; p. 429. [Google Scholar]
- Tuloverotus—Yritykset ja Yhteisöt. [Corporate Taxation in Finland]. Finnish Tax Administration. 2020. Available online: https://www.vero.fi/yritykset-ja-yhteisot/tietoa-yritysverotuksesta/tuloverotus/ (accessed on 12 July 2020).
- Judl, J.; Koskela, S.; Korpela, T.; Karvosenoja, N.; Hayrinen, A.; Rantsi, J. Net environmental impacts of low-share wood pellet co-combustion in an existing coal-fired CHP (combined heat and power) production in Helsinki, Finland. Energy 2014, 77, 844–851. [Google Scholar] [CrossRef]
- Karvosenoja Ekholm, T.; Karvosenoja, N.; Tissari, J.; Sokka, L.; Kupiainen, K.; Sippula, O.; Savolahti, M.; Jokiniemi, J.; Savolainen, I. A multi-criteria analysis of climate, health and acidification impacts due to greenhouse gases and air pollution—The case of household-level heating technologies. Energy Policy 2014, 74, 499. [Google Scholar] [CrossRef]
- Wahlroos, M.; Pärssinen, M.; Rinne, S.; Manner, J.; Syri, S. Utilizing data center waste heat in district heating—Impacts on energy efficiency and prospects for low-temperature district heating networks. Energy 2017, 140, 1228–1238. [Google Scholar] [CrossRef]
- Wahlroos, M.; Pärssinen, M.; Rinne, S.; Syri, S.; Manner, J. Future views on waste heat utilization—Case of data centers in Northern Europe. Renew. Sustain. Energy Rev. 2018, 82, 1749–1764. [Google Scholar] [CrossRef]
Figure 1.
EnergyPRO Model used in simulation 1. The power plant area is shown inside the dashed line.
Figure 1.
EnergyPRO Model used in simulation 1. The power plant area is shown inside the dashed line.

Figure 2.
Simulated heat demand and production profiles for the reference year 2019.

Figure 3.
Duration curves: (a) Simulation 1; (b) Simulation 2; (c) Simulation 3; (d) Simulation 4.


Table 1.
Heat sources in Finland in 2019 with associated fuel emission intensity (gCO2/kWh) [2,6,7].
| Share/Emission Intensity | Light Fuel Oil | Coal | Natural Gas | Peat | Biomass | Waste Heat | Other 1 | Total/Mean |
|---|---|---|---|---|---|---|---|---|
| % | 2 | 18 | 11 | 14 | 42 | 10 | 3 | 100 |
| gCO2/kWh | 263 | 335 | 199 | 387 | 0 2 | 0 2 | 208–325 | 150 |
| Year (s) | Heat Demand (GWh) | Electricity Average (EUR/MWh) | Peat Fuel + Tax 1 (EUR/MWh) | Biomass (EUR/MWh) | Light Fuel Oil + Tax (EUR/MWh) | UO2 (EUR/MWh) | EUA (EUR/tCO2) |
|---|---|---|---|---|---|---|---|
| 2019 | 997 | 44.0 | 16.1 + 3.0 | 18.0 | 40.0 + 27.8 | − | 25.0 |
| 2030–2060 | 1000 | 29.9 | 15.6 + 6.0 | 24.7 | 36.2 + 30.8 | 2.12 | 30.9 |
1 In CHP production, tax on the heat produced is multiplied by 0.9 [33]. Electricity production is not taxed.
Table 3.
Variable and fixed costs for simulated CHP and SMR units [20].
Table 3.
Variable and fixed costs for simulated CHP and SMR units [20].
| Heat Producing Unit | Marginal Investment (kEUR/MWdh) | Variable O&M (EUR/MWhdh) | Fixed O&M (kEUR/MWdh/a) | Plant Overall Efficiency (%) | Economic Life (a) | Constr. Time (a) |
|---|---|---|---|---|---|---|
| Woodchip CHP | 1549 | 4.16 | 23,519 | 90 | 30 | 2 |
| Heat-only SMR | 1555 | 1.30 1 | 30,976 | 93.8 | 30 | 4 |
Table 4.
Simulations.
| Simulation | Model | CHP 2 (MW dh/el.) | CHP 3 (MW dh/el.) | Heat Storage (MWh) | Heating Reactor (MWdh) | Ref. Heating Year |
|---|---|---|---|---|---|---|
| Baseline | Reference | 210/60 | 100/45 | - | − | 2019 |
| Simulation 1 | Model 1 | 210/60 | 100/45 | 800 | − | 2019 |
| Simulation 2 | Model 2 | − | 100/45 | 800 | 1 × 200 | 2019 |
| Simulation 3 | Model 3 | − | 100/45 | 800 | 5 × 24 | 2019 |
| Simulation 4 | Model 4 | − | − | 800 | 8 × 24 | 2019 |
Table 5.
Economic data for the simulated cases. Discount rate r = 6% for all investments.
| Production Values/Costs | Reference Case | Simulation 1 | Simulation 2 | Simulation 3 | Simulation 4 |
|---|---|---|---|---|---|
| Produced heat (GWh) | 997 | 1000 | 1000 | 1000 | 1000 |
| CO2 emissions (tonnes) | 221,144 | 128,794 | 443 | 7061 | 7270 |
| Produced electricity (GWh) | 296 | 299 | 43 | 79 | 14 |
| Revenue from produced electricity (kEUR) | 14,774 | 10,144 | 2540 | 4742 | 424 |
| Fuel tax peat (kEUR) | 1077 | 1988 | |||
| Fuel tax oil (kEUR) | 225 | 51 | 52 | 826 | 851 |
| Carbon cost peat (kEUR) | 5473 | 3943 | |||
| Carbon cost oil (kEUR) | 53 | 14 | 14 | 217 | 224 |
| Fuel cost peat (kEUR) | 9103 | 5169 | 971 | ||
| Fuel cost oil (kEUR) | 324 | 60 | 61 | 6174 | 1000 |
| Fuel cost biomass (kEUR) | 14,827 | 26,487 | 2716 | 6174 | |
| Fuel cost UO2 (kEUR) | 2081 | 1850 | 2174 | ||
| CHP Variable O&M (kEUR) | 4117 | 4155 | 324 | 657 | 58 |
| SMR Variable O&M (kEUR) | 1197 | 1063 | 1250 | ||
| Variable costs total (kEUR) | 35,200 | 41,867 | 6444 | 17,933 | 5556 |
| CHP Fixed O&M (kEUR) | 7329 | 7329 | 2390 | 2390 | 38 |
| SMR Fixed O&M (kEUR) | 6195 | 3717 | 5947 | ||
| Fixed costs total (kEUR) | 7329 | 7329 | 8585 | 6107 | 5985 |
| SMR investment (kEUR) | − | − | −311,003 | −186,602 | −298,563 |
| NPV (EUR) | 0.0 | 0.0 | 0.0 | 0.0 | 0.0 |
| Break-even price for heat production (EUR/MWh) | 27.8 | 39.1 | 40.4 | 36.1 | 37.9 |
Table 6.
Sensitivity of the heat production break-even prices to change in expenditures and the price of electricity.
Table 6.
Sensitivity of the heat production break-even prices to change in expenditures and the price of electricity.
| Parameter | Simulation 1 | Simulation 2 | Simulation 3 | Simulation 4 |
|---|---|---|---|---|
| Break-even price for heat production (EUR/MWh) | 39.1 | 40.4 | 36.1 | 37.9 |
| Effect of ±40% change in biomass costs (EUR/MWh) | ±10.5 | ±1.1 | ±2.4 | − |
| Effect of ±40% change in electricity price (EUR/MWh) | 4.0 | ±1.0 | ±1.9 | ±0.2 |
| Effect of ±40% change in SMR capex (EUR/MWh) | − | ±11.2 | ±6.7 | ±10.8 |
| Effect of ±40% change in SMR fixed O&M (EUR/MWh) | − | ±2.5 | ±1.4 | ±2.4 |
| Effect of ±40% change in SMR variable O&M (EUR/MWh) | − | ±0.5 | ±0.4 | ±0.5 |
| Effect of +100% increase in UO2 costs (EUR/MWh) | − | +2.1 | +1.7 | +2.2 |
Table 7.
Annual operating hours and turn-ons for Simulations S2–S4.
| Simu-Lation | Para-Meter | CHP3 | SMR1 | MNR1 | MNR2 | MNR3 | MNR4 | MNR5 | MNR6 | MNR7 | MNR8 |
|---|---|---|---|---|---|---|---|---|---|---|---|
| S2 | OH | 1042 | 7711 | − | − | − | − | − | − | − | − |
| Starts | 17 | 2 | − | − | − | − | − | − | − | − | |
| EFLH | 638 | 4604 | − | − | − | − | − | − | − | − | |
| S3 | OH | 2183 | − | 8424 | 8357 | 6758 | 5871 | 4910 | − | − | − |
| Starts | 24 | − | 2 | 2 | 8 | 6 | 9 | − | − | − | |
| EFLH | 1439 | − | 8424 | 8357 | 6758 | 5871 | 4899 | − | − | − | |
| S4 | OH | − | − | 8424 | 8357 | 6758 | 5871 | 4910 | 3414 | 1618 | 1025 |
| Starts | − | − | 2 | 2 | 8 | 6 | 9 | 13 | 11 | 6 | |
| EFLH | − | − | 8424 | 8187 | 6730 | 5844 | 4899 | 3368 | 1593 | 1008 |
© 2020 by the authors. Licensee MDPI, Basel, Switzerland. This article is an open access article distributed under the terms and conditions of the Creative Commons Attribution (CC BY) license (http://creativecommons.org/licenses/by/4.0/).
Share and Cite
MDPI and ACS Style
Teräsvirta, A.; Syri, S.; Hiltunen, P. Small Nuclear Reactor—Nordic District Heating Case Study. Energies 2020, 13, 3782. https://doi.org/10.3390/en13153782
AMA Style
Teräsvirta A, Syri S, Hiltunen P. Small Nuclear Reactor—Nordic District Heating Case Study. Energies. 2020; 13(15):3782. https://doi.org/10.3390/en13153782
Chicago/Turabian StyleTeräsvirta, Antti, Sanna Syri, and Pauli Hiltunen. 2020. "Small Nuclear Reactor—Nordic District Heating Case Study" Energies 13, no. 15: 3782. https://doi.org/10.3390/en13153782
Note that from the first issue of 2016, this journal uses article numbers instead of page numbers. See further details here.