1. Introduction
The coronavirus SARS-CoV-2 emerged in Wuhan, a city of 11 million people in China’s Hubei province in late 2019. Cases of the COVID-19 disease grew by several thousand per day in China in late January and February 2020 [
1] since then, the outbreak evolved in a pandemic centered in Italy, with major outbreaks in South Korea, Iran and the US. In particular, the northern Italian regions of Lombardia, Veneto and Emilia-Romagna have been most affected by the outbreak, with thousands of infected patients and deaths. In an attempt to slow down the infection, the Italian government started a nationwide lockdown on 8th March 2020, with huge economic repercussions on the country. During the lockdown, the government imposed countrywide precautionary measures. This involved not only the forced quarantine for the population, closing of schools and churches, shops, bar, restaurants, retail shops, but also shut down of national and international flights, closure of non-essential ports and airports and non-essential firms and industries. This caused a reduction in energy consumption, leading to a decrease in the overall demand in the energy market.
The COVID-19 measures in Italy quickly started to cause a noticeable impact on energy consumption, which reflected in daily profiles and market prices. Notably, the forced closure of industries and tertiary activities highly flattened the working hour consumption curves in comparison with the daily pre-lockdown ones. Although many people started home working through smart working, the increasing of residential consumption did not compensate for the general reduction of demand. As a result, the daily consumption curve is now less pronounced than a typical spring day. In the morning, electricity consumption ramps up slower, since there is no morning commute. The evening peak is still observable, as people prepare meals, turn lights on and spend time watching TV and playing games—but it is much lower than would normally be expected.
The COVID-19 outbreak on a global scale is deeply influencing the whole energy industry, causing an overall reduction of oil and natural gas demand which, coupled with strategic tensions among the leading producing nations, led to an unprecedented reduction of their selling prices. BRENT oil price plummeted about 59% from the last peak reached on 17 of February (40 days before the writing of this study) to a minimum value of USD 24 per barrel, an all-time minimum since 2002. Similarly, natural gas prices fell to USD 1.63 per million metric British thermal units (mmBtu), showing a relative decrease of 38% from the November 2019 peak, reaching its minimum since November 1995. The combination of both local and global effects caused a strong reduction in electricity demand prices, which is going to influence the entire electricity supply chain in the short and middle term [
2]. In addition, the IEA reports forecasted a global yearly total demand decrease of 6%, especially hitting the production from non-renewable energy sources [
3]. Europe, moreover, showed a consumption decrease of roughly 10% during the final weeks of March and the first week of April [
4]. This decrease has been observed to be particularly severe in Italy, which reportedly reached a decrease in consumption of about 23% [
4] as described also in the IAEE Energy Forum [
5] which analyses worldwide the impacts of COVID-19 on the energy industries in term of demand drops, supply-side shocks, facilities shutdowns and new patterns of electricity demand.
Due to the aforementioned reasons, the effects associated with the COVID-2019 outbreak are difficult to assess with the traditional evaluation of the performance of critical infrastructures, based on classical risk assessment methods, which consider credible and predictable hazards and threats [
6]. The ubiquitous effects on the power system should be indeed studied from a resilience perspective. Resilience definitions and frameworks have been proposed in different disciplines and applied in a variety of case studies worldwide [
7]. In most resiliency studies, energy systems are subject to major disruptions affecting economic activities, operation of infrastructure and the society as a whole [
8]. Even though, in this case, the resiliency issues arise from a crisis that has occurred in civil society and impacted the operation of the Italian power system and its related energy market prices.
Thus, the data relative to the COVID-19 outbreak period will be of vital importance for testing the reliability of the currently employed planning, scenario-making and resilience testing methodologies. In particular, accurate analysis of the current situation will allow a better estimation of scenarios with higher penetration of renewable energy sources (RES) and their effects on the future power industry. In this context, the goal of this study is to provide detailed and comprehensive information related to the alterations on load profiles, electricity demand and both wholesale and ancillary services market prices in Italy due to the restrictions and lockdown of the activities, providing powerful insights about the resilience of the entire electricity sector for a prolonged period of low consumption/production ratio and posing issues which can serve as inspiration for future research.
2. Generation and Consumption in Italy before the COVID-19 Outbreak
2.1. Generation
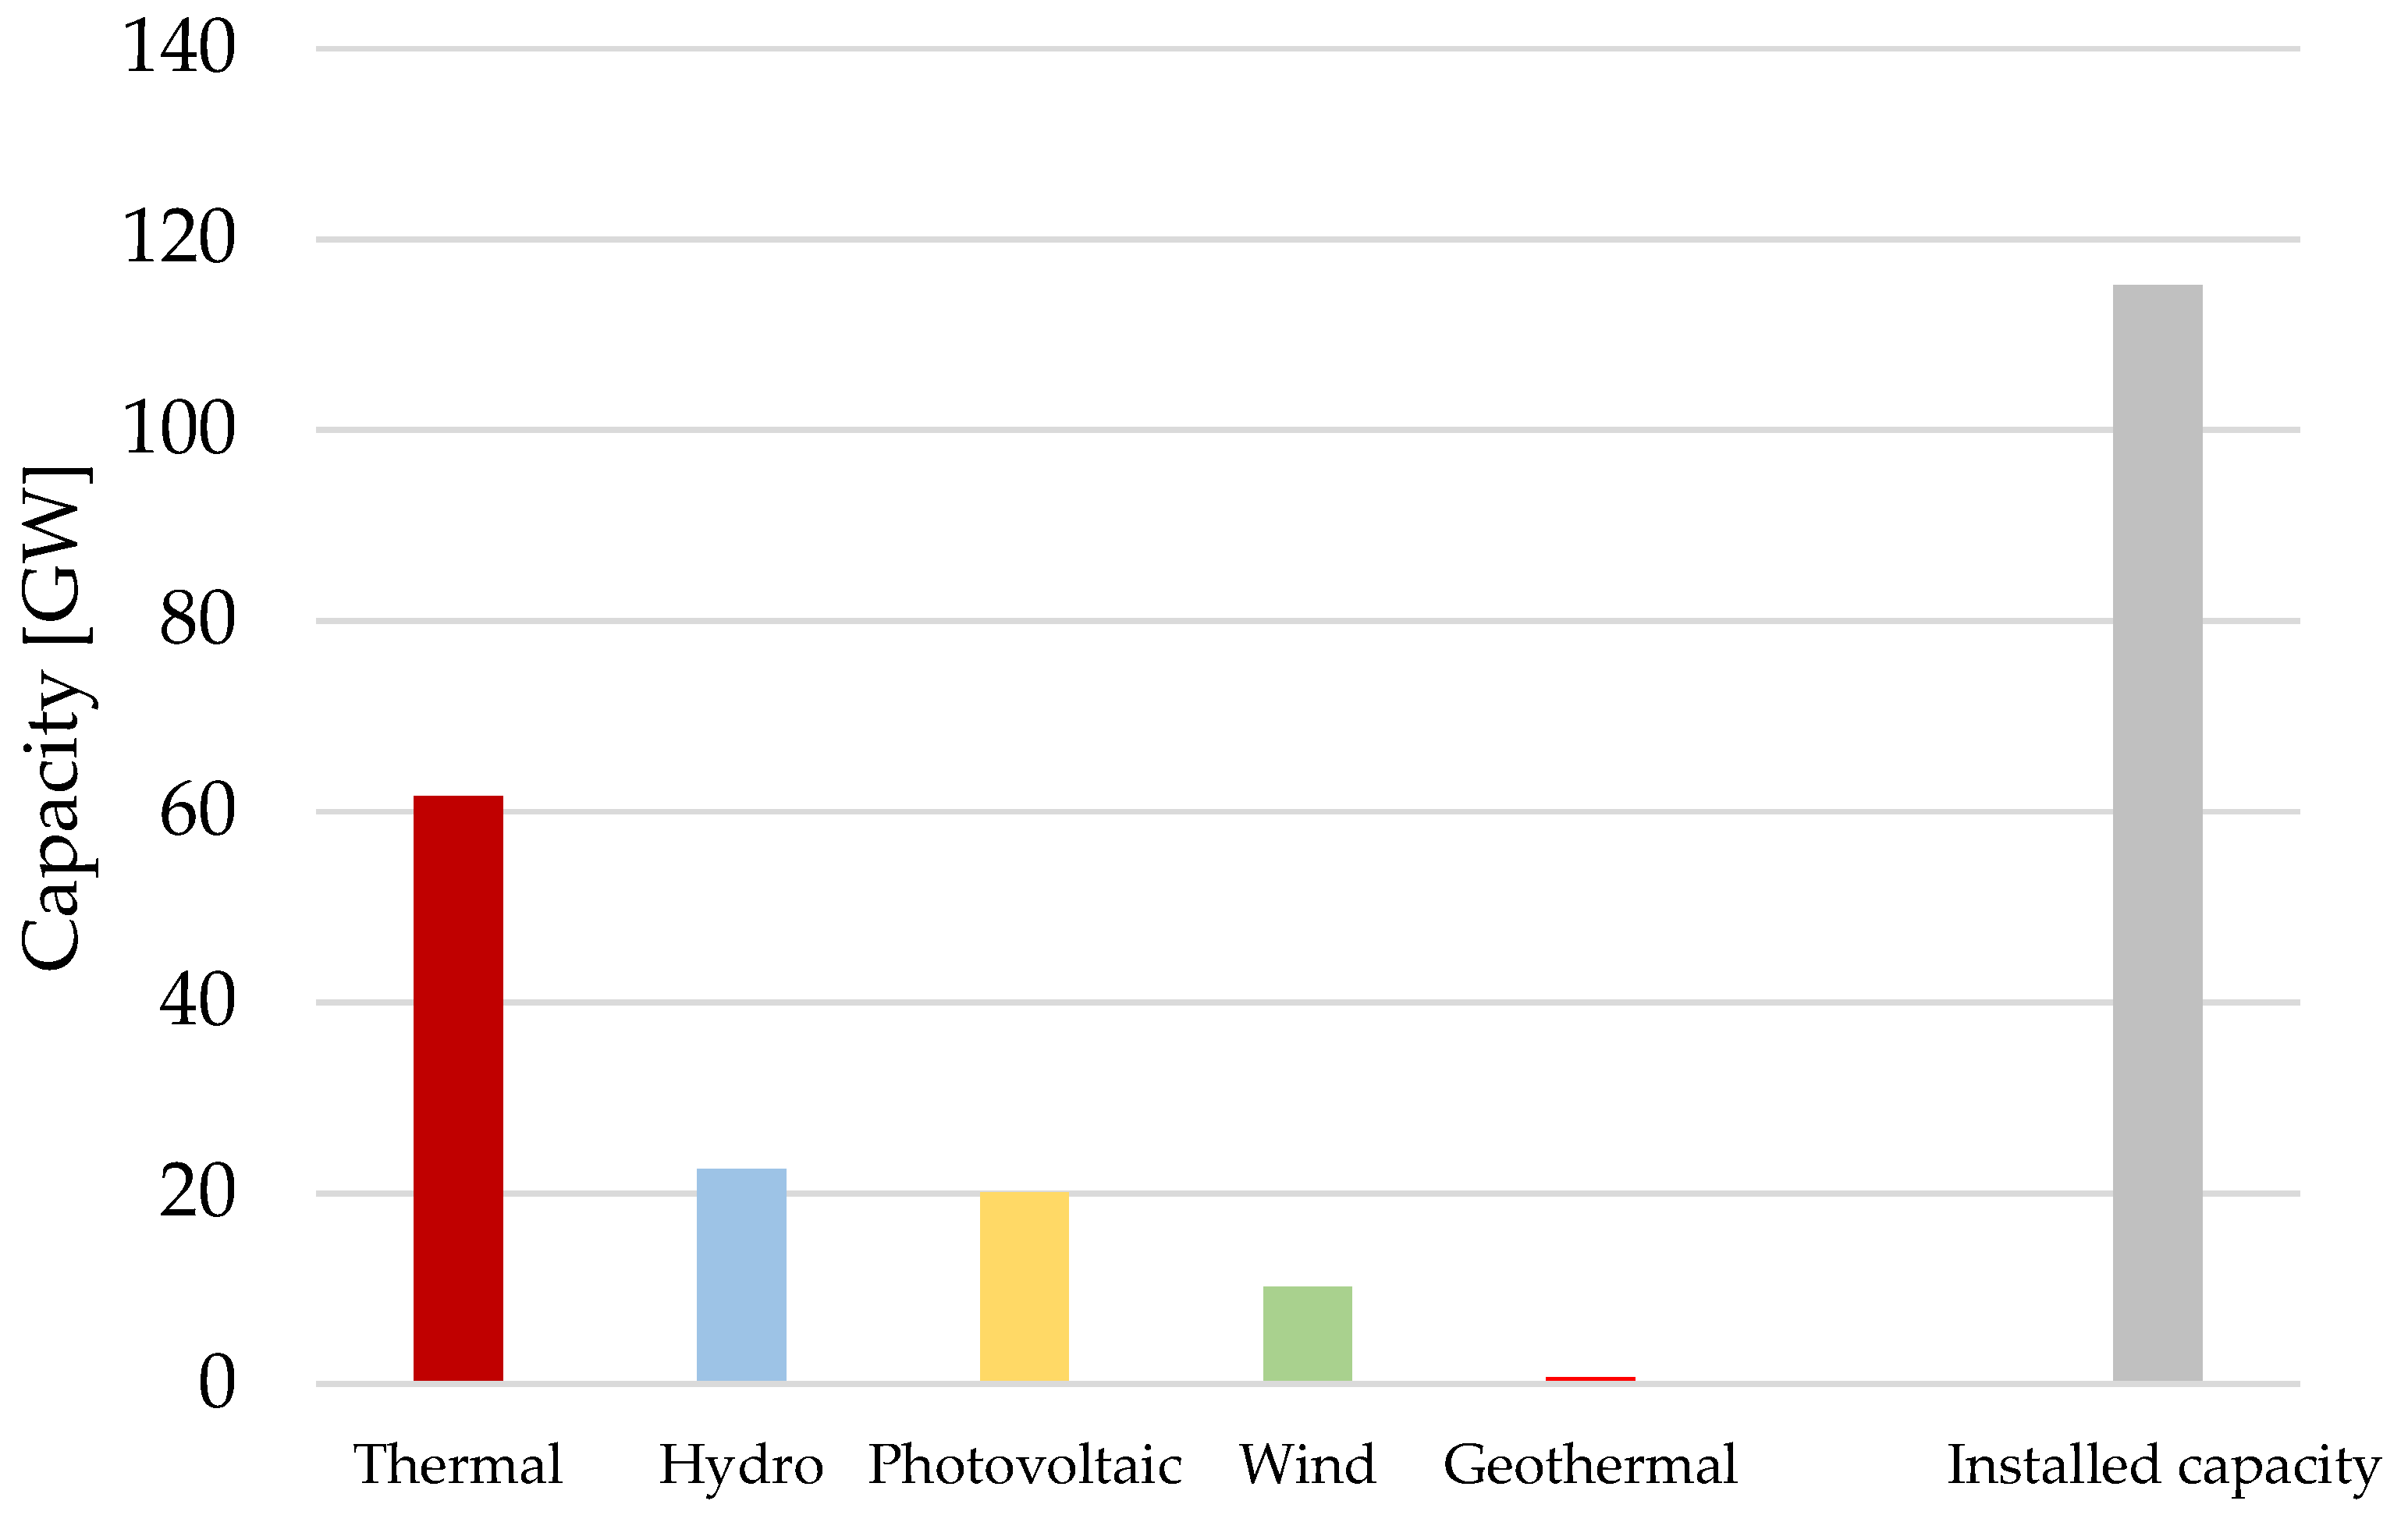
The Italian electrical system is the energy backbone of the third-largest economy of the European Union. In 2018, the Italian electricity system had a peak consumption of around 60 GW and a generation capacity of 115.20 GW [
9]. As depicted in
Figure 1, the generation capacity in Italy consists mainly of thermal generation (coal, gas, oil) and renewable energy sources (RES); nuclear production is forbidden by law since 1987 and about 15% of the electricity is imported from abroad.
RES consolidated their leading role in the Italian energy system, confirming themselves as a decisive factor for the sustainable development of the country in the energy transition. According to Italian national energy strategy (NES) [
10], the integrated national energy and climate plan [
11] and the national electricity transmission grid development plan [
12], RES capacity is expected to grow up to 93 GW in 2030, with almost 40 additional GW with respect to 2017. The main contribution will be from solar photovoltaic (PV), with almost +30 GW, followed by wind, with almost +9 GW.
The actual gross electricity production from RES in summarized in
Table 1 [
13]. Thermal generation is fueled by natural gas sources (72.6%); whereas coal and oil account for 20.9% and 6.5%, respectively.
2.2. Load Profile of the Italian Power System
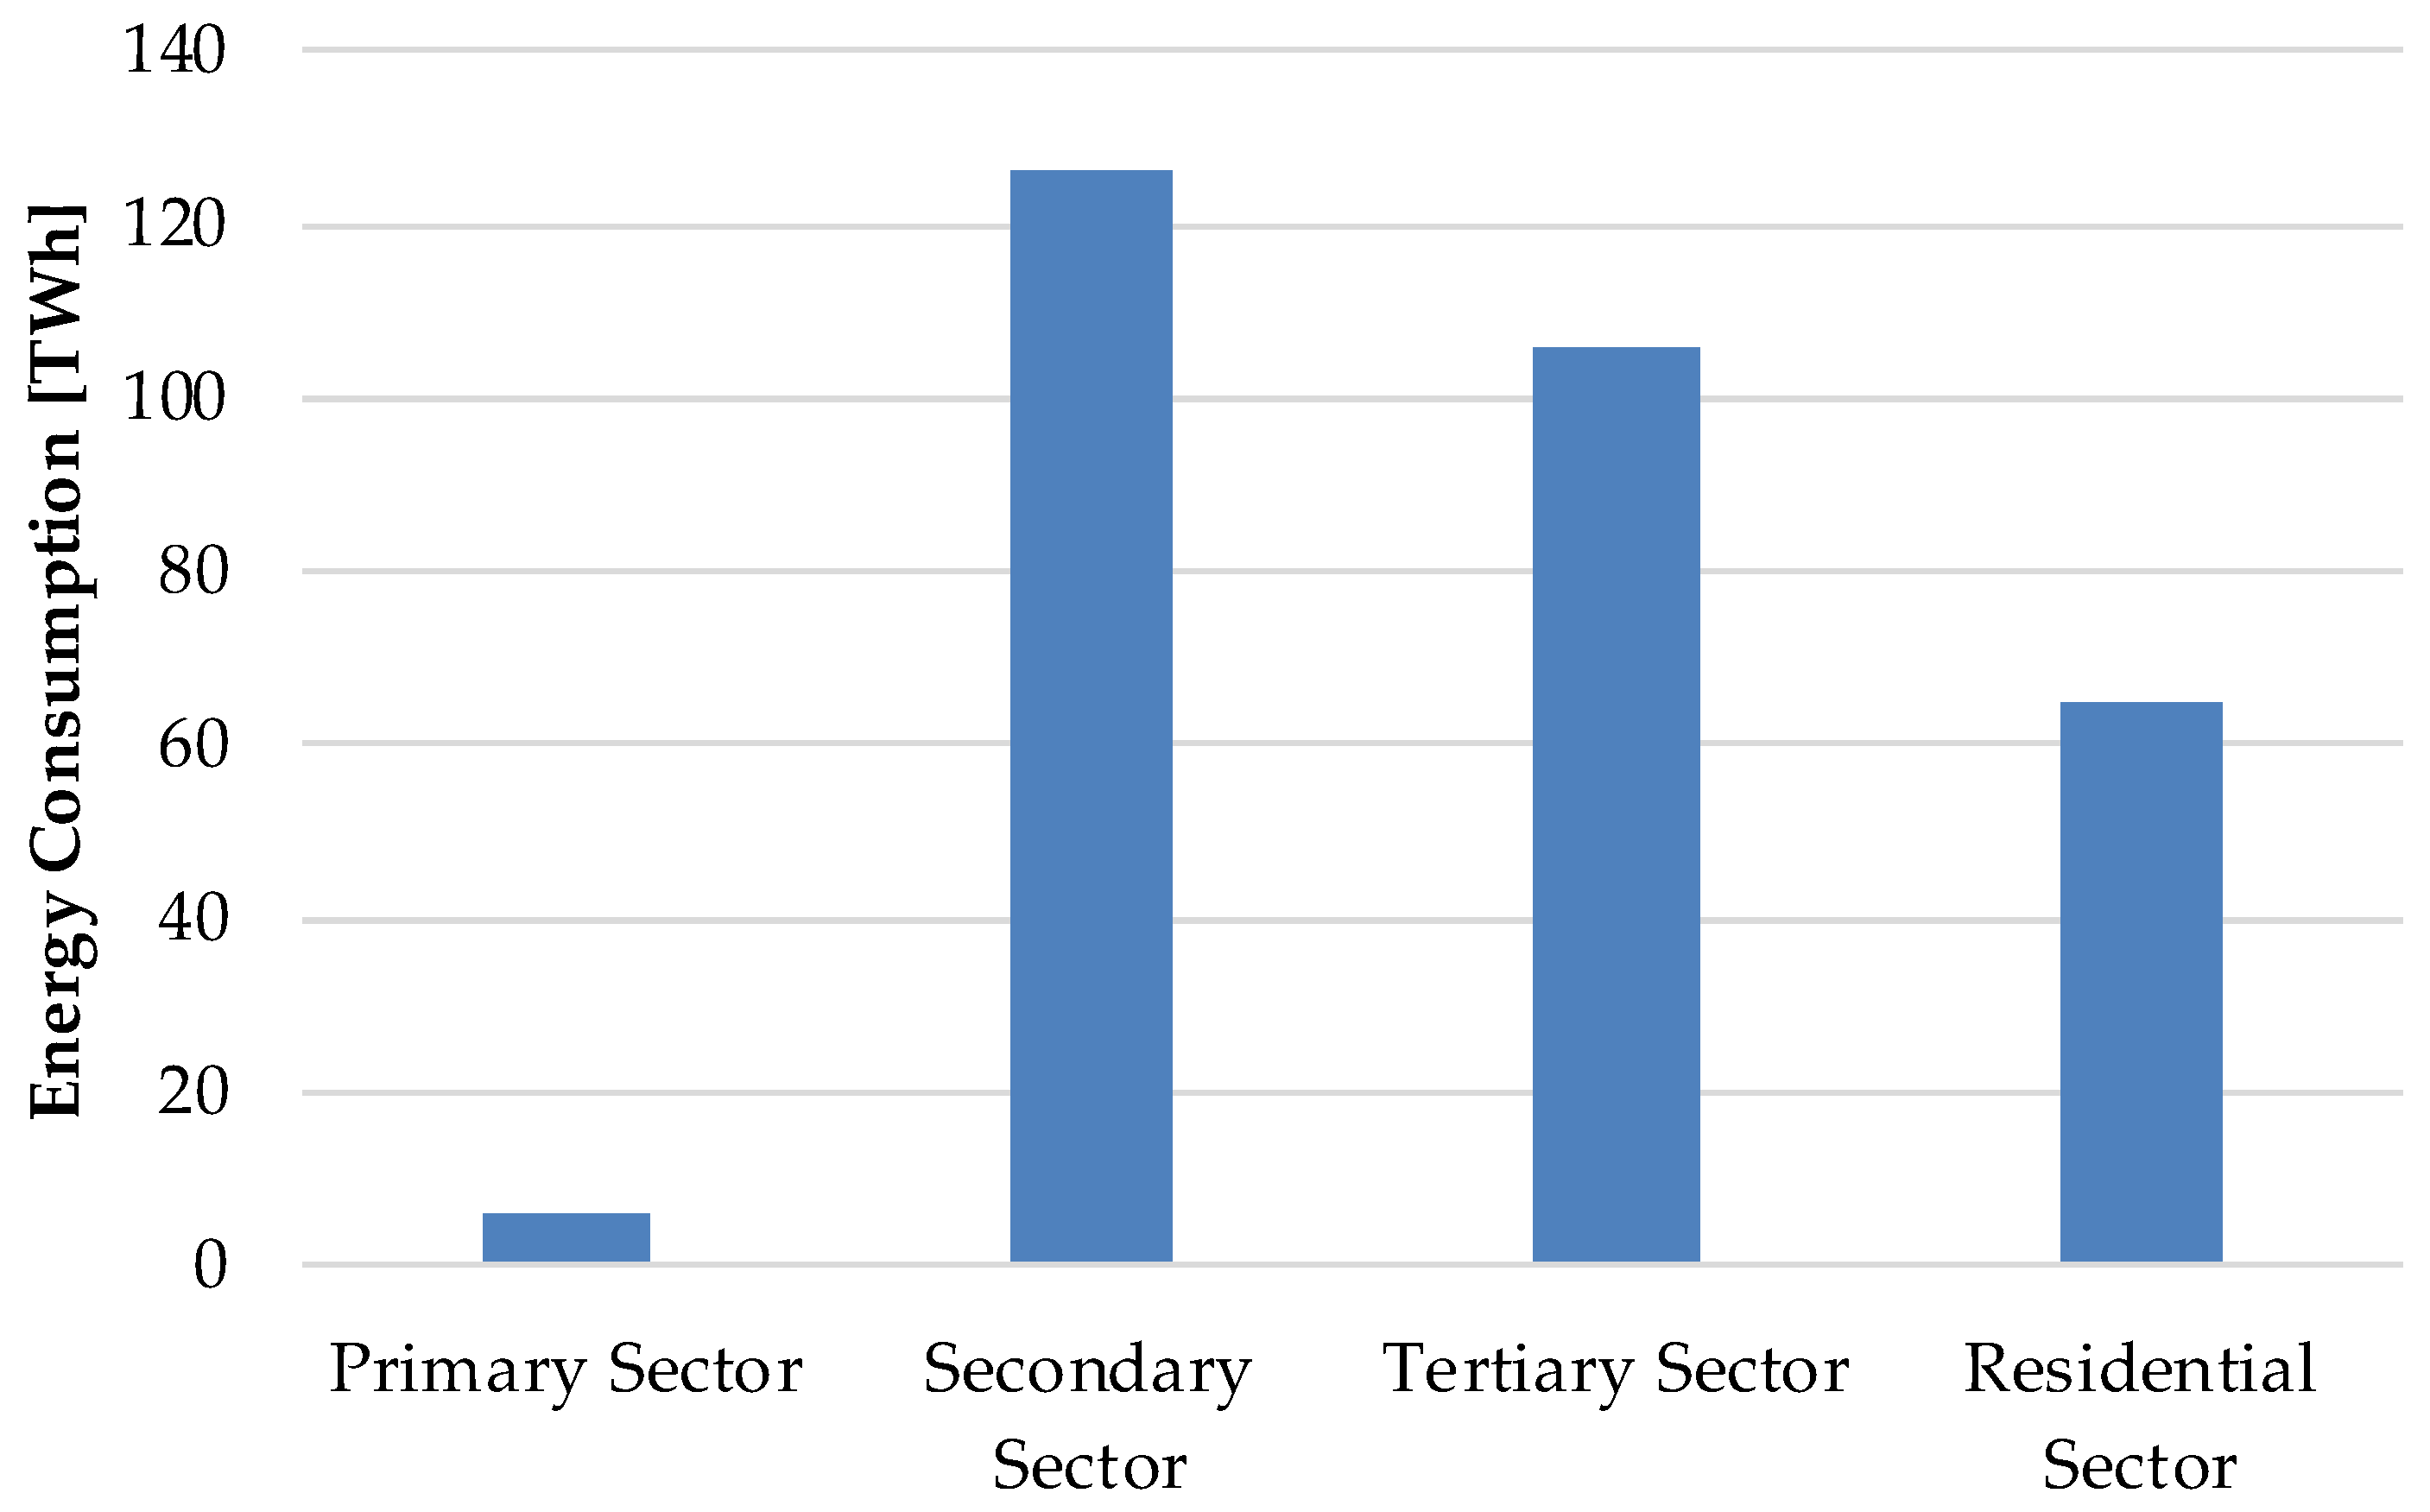
Figure 2 shows the different contributions of consumption for each sector in Italy during the year 2018. The main consumption comes from the residential load (39%). The secondary (industrial) and tertiary (services) sectors have 37% and 22% of total load, respectively, whereas the primary sector (agriculture, raw materials) account for 2% of total demand [
9].
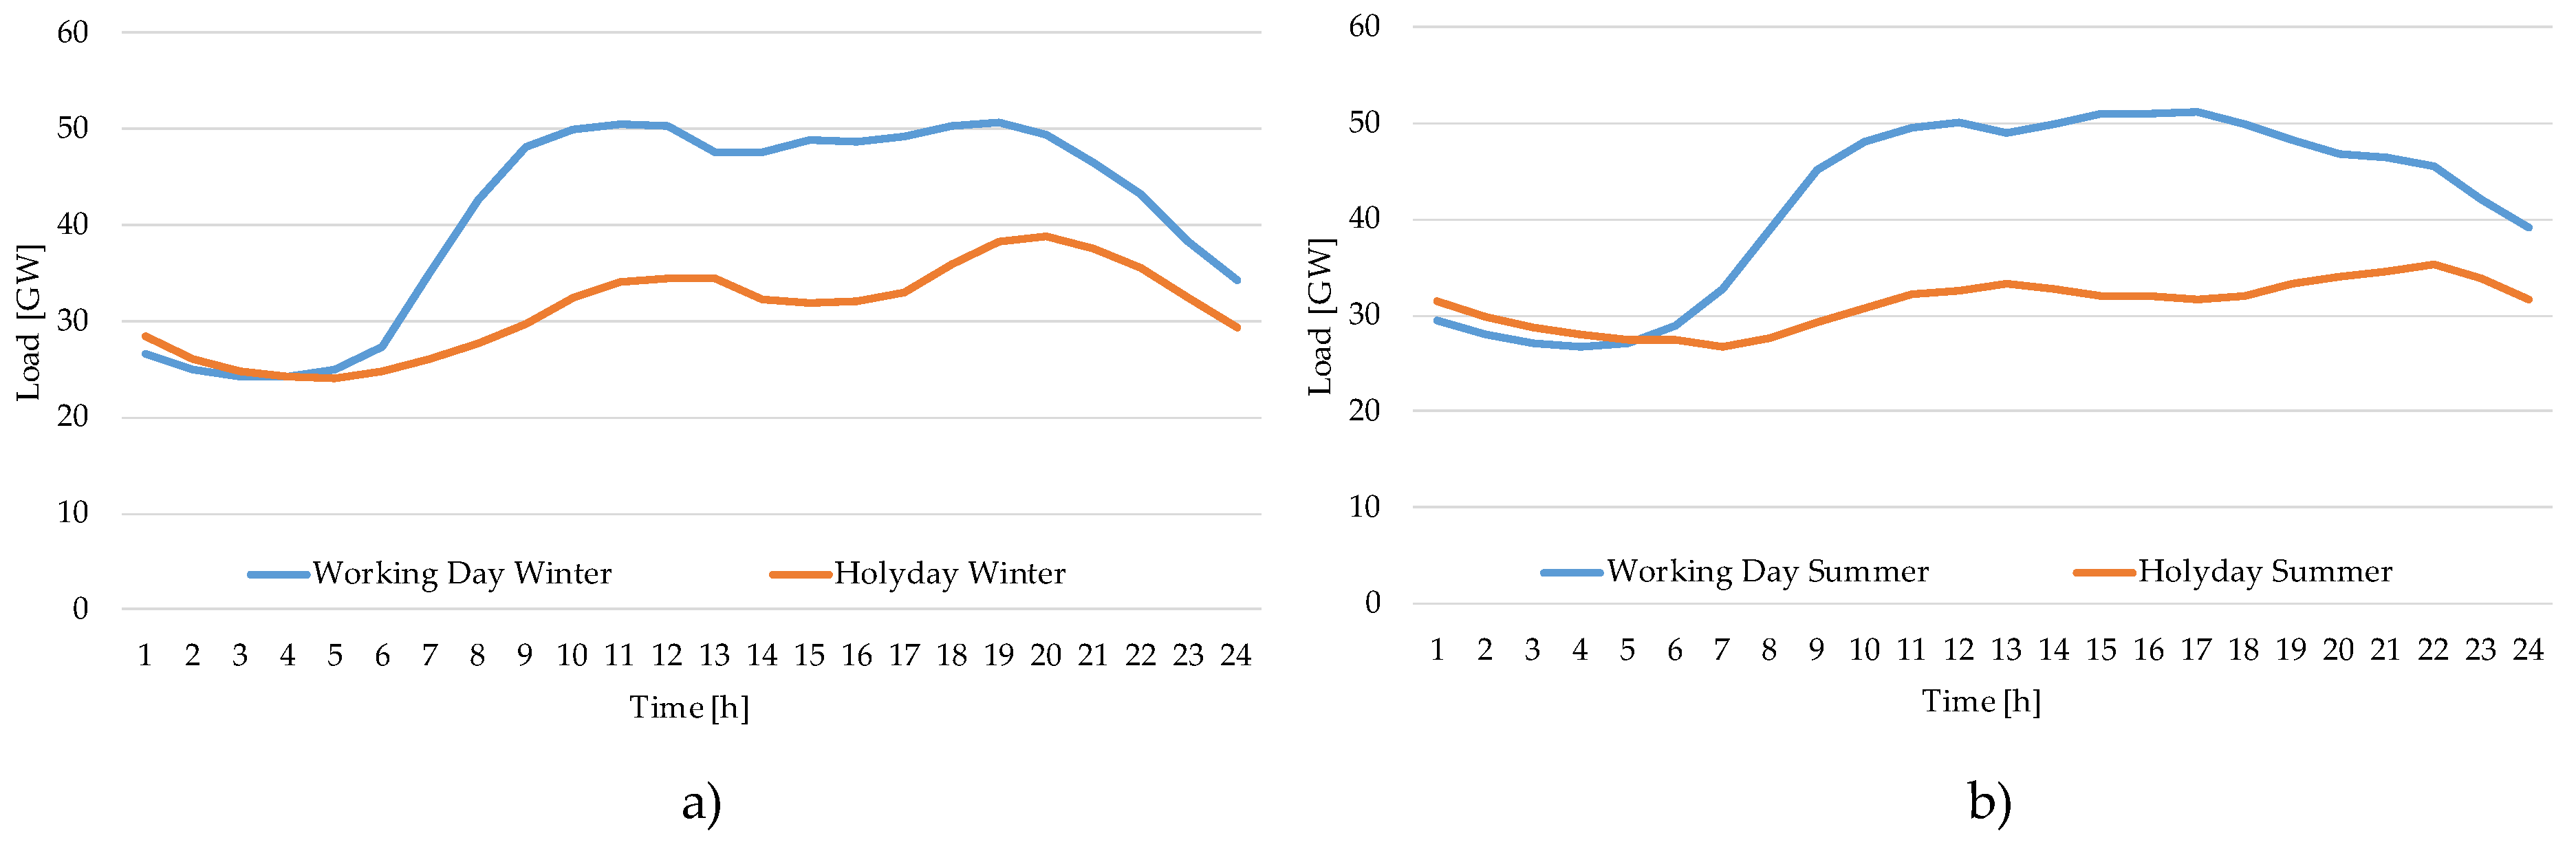
The load profile is the shape of the electrical load over time. The load profile for a given area varies considerably according to the categories of users, including commercial, residential or industrial users. Peak electricity demands also vary according to seasonal and holiday needs. A typical Italian load profile in 2019, for winter (January) and summer (July) weekdays and weekends, is shown in
Figure 3. Electricity consumption normally follows a regular daily shape; quick rising as people wake up and go to school or work, smoothening throughout the day and then peaking at dinner time when people get back home. In Italy, the flattening of the load curve during the daytime, as shown in
Figure 3b, is exacerbated in summer by the production from PV distributed generation in distribution networks [
14,
15].
Operating pre lockdown conditions were characterized by a peak load of about 60 GW in summer (58.81 GW on 25 July 2019) and a minimum load of 20 GW in winter (18.27 GW on 25 December 2019). In winter, on the contrary, the peak load is 55 GW and the summer minimum load is 21 GW [
9,
14].
3. Impact on Electricity Consumption and Load Profiles during COVID-19
The lockdown sequence consists of three main dates:
6th March 2020: closing of all schools and universities;
12th March 2020: All territory of Italy becomes a “red zone”. Non-essential factories, companies and public buildings are closed (partial shutdown);
21st March 2020: airports and seaports closed to passenger traffic (shutdown).
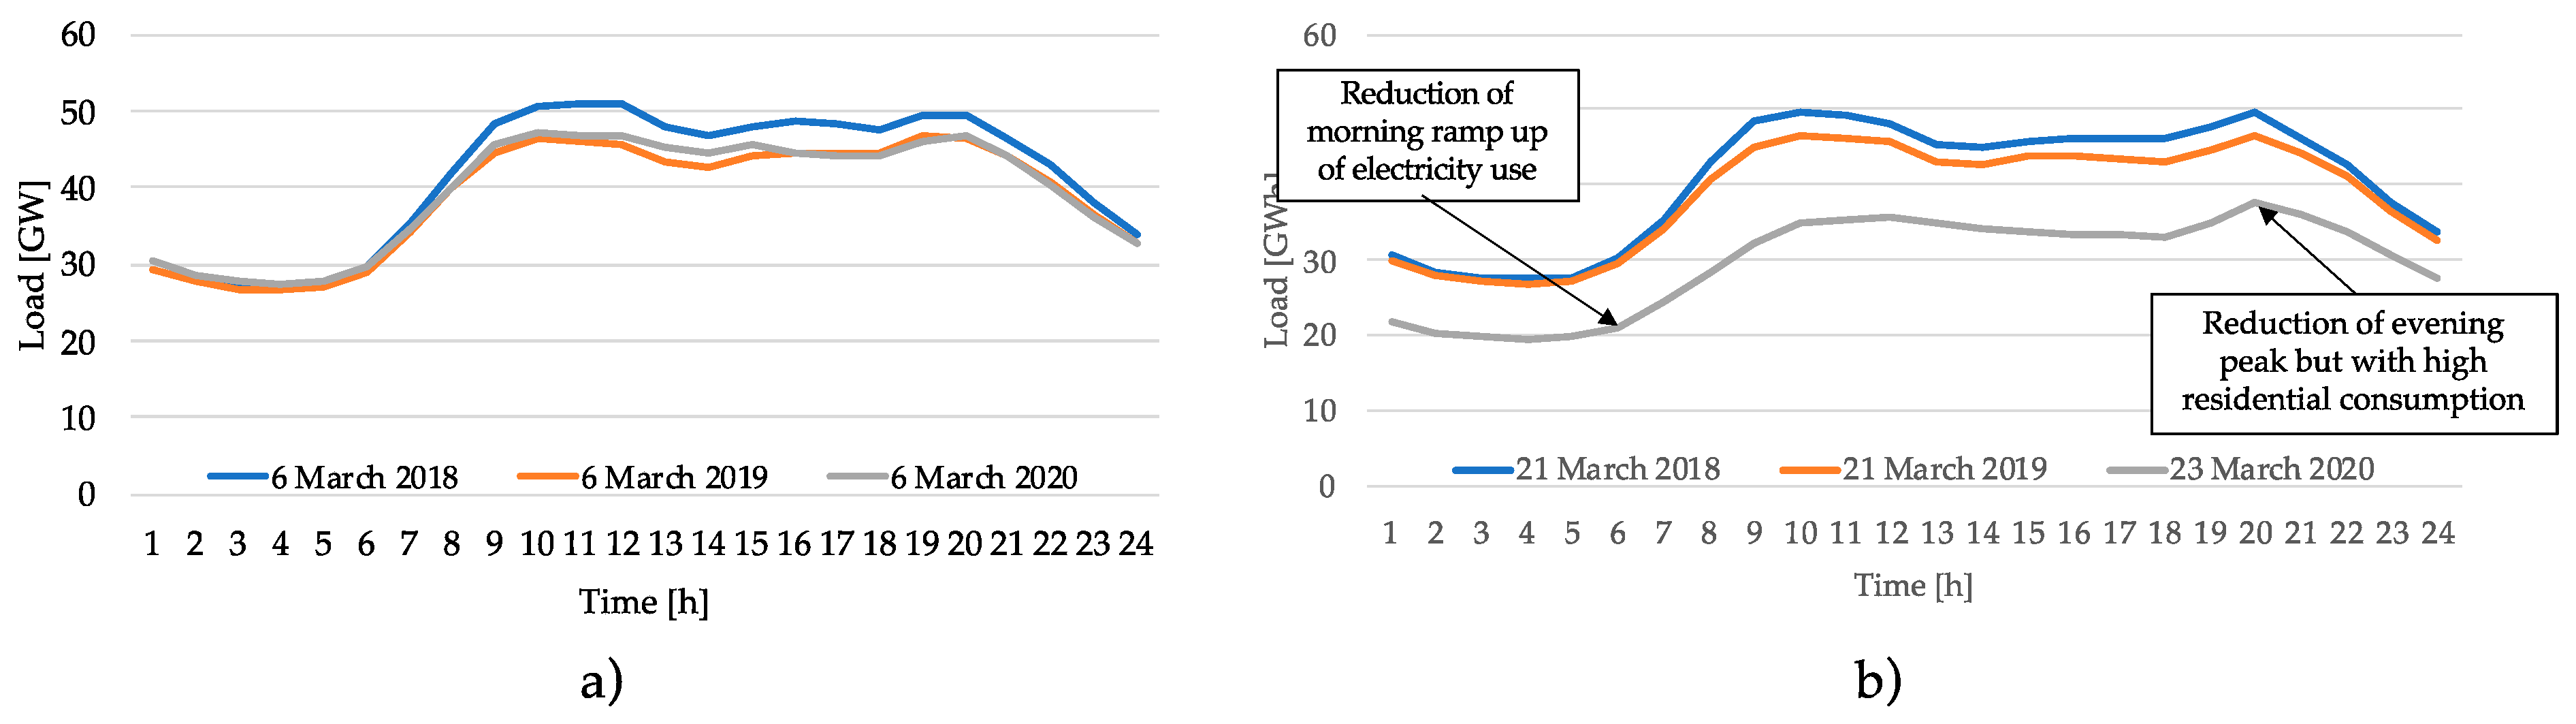
The forced closure of public buildings, industries and tertiary activities during COVID-19 outbreak restrictions highly reduced the consumption curves during the daily working hours and in the evening. In
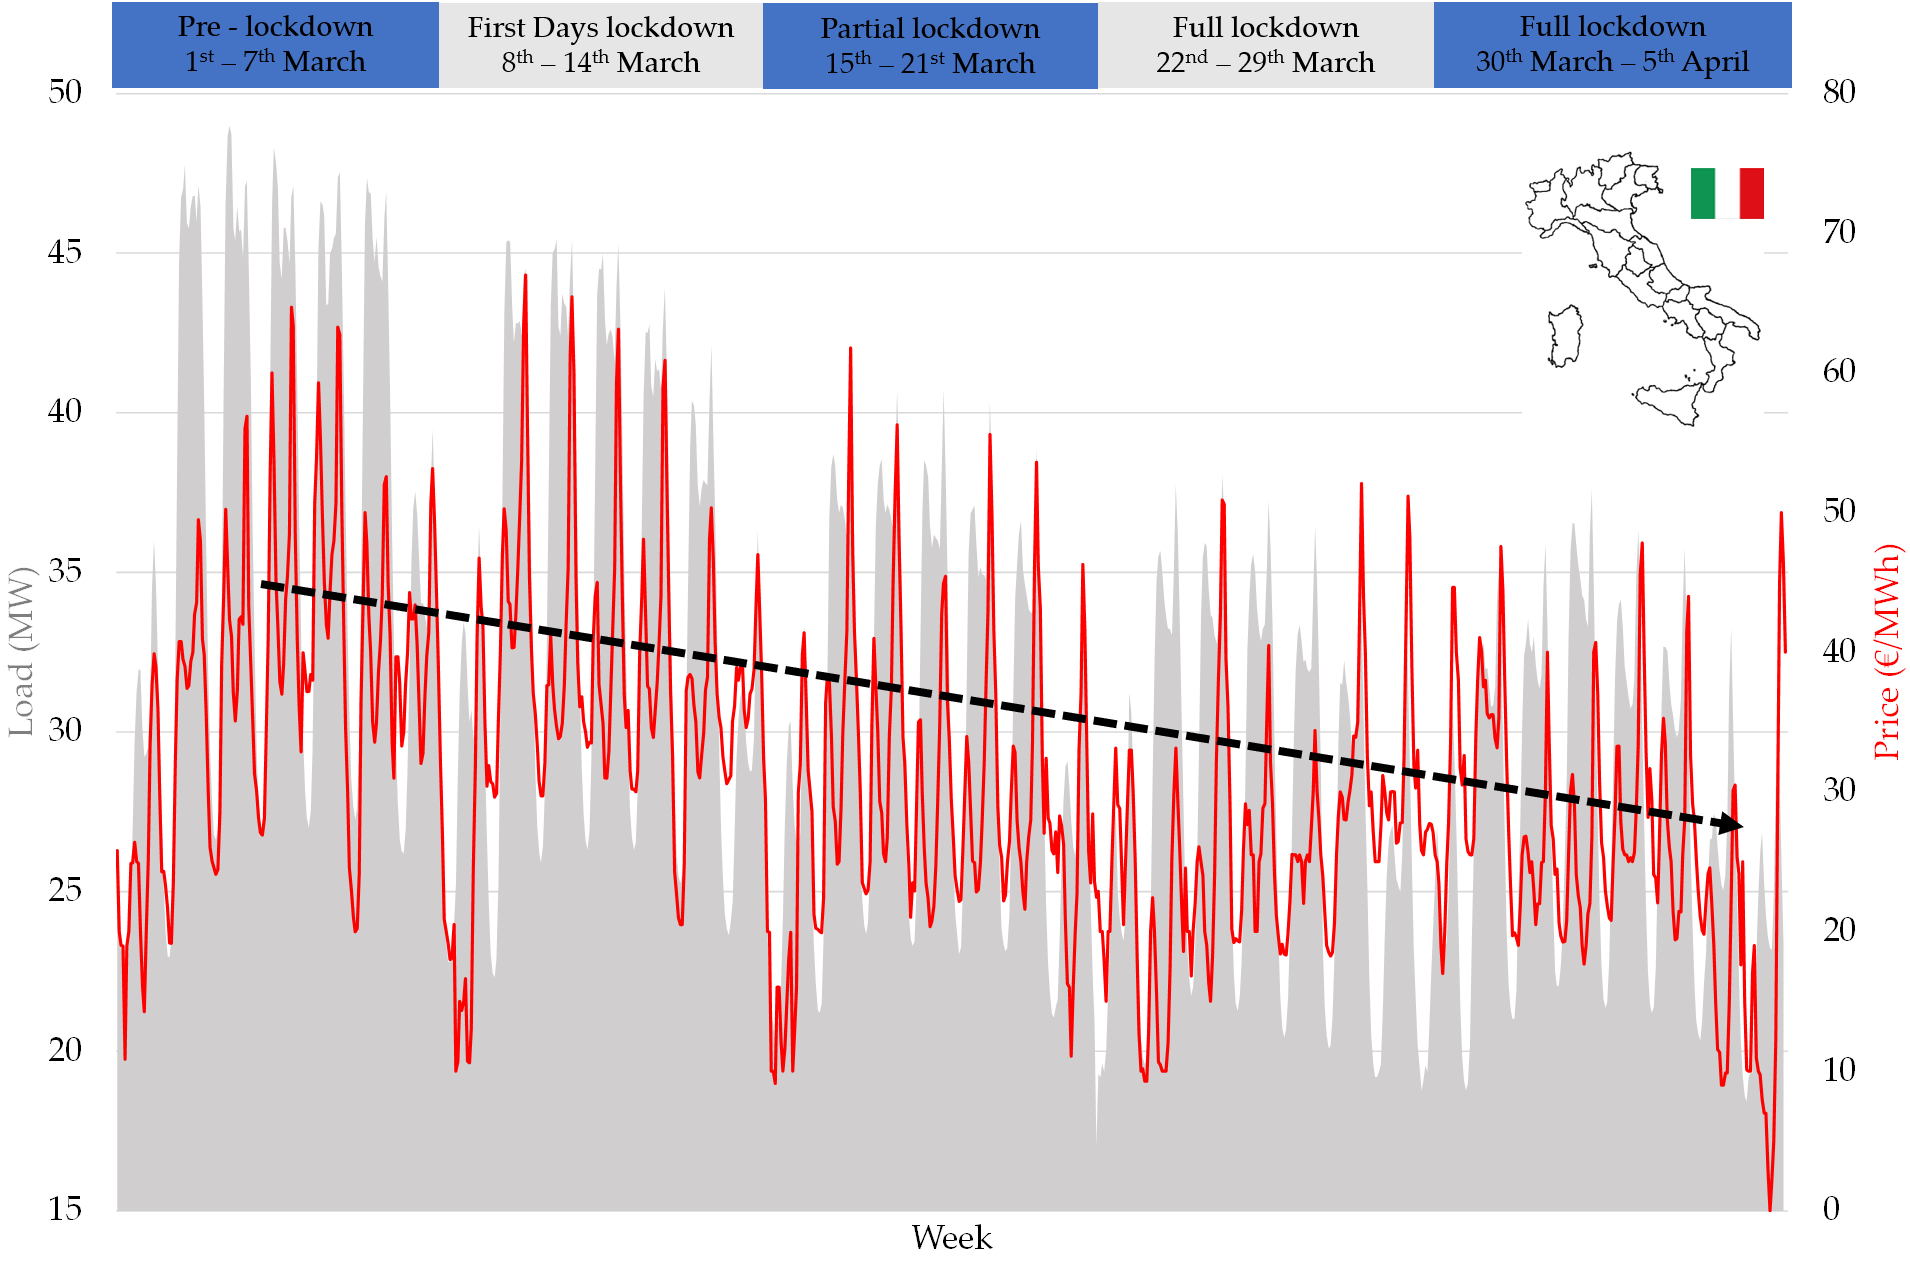
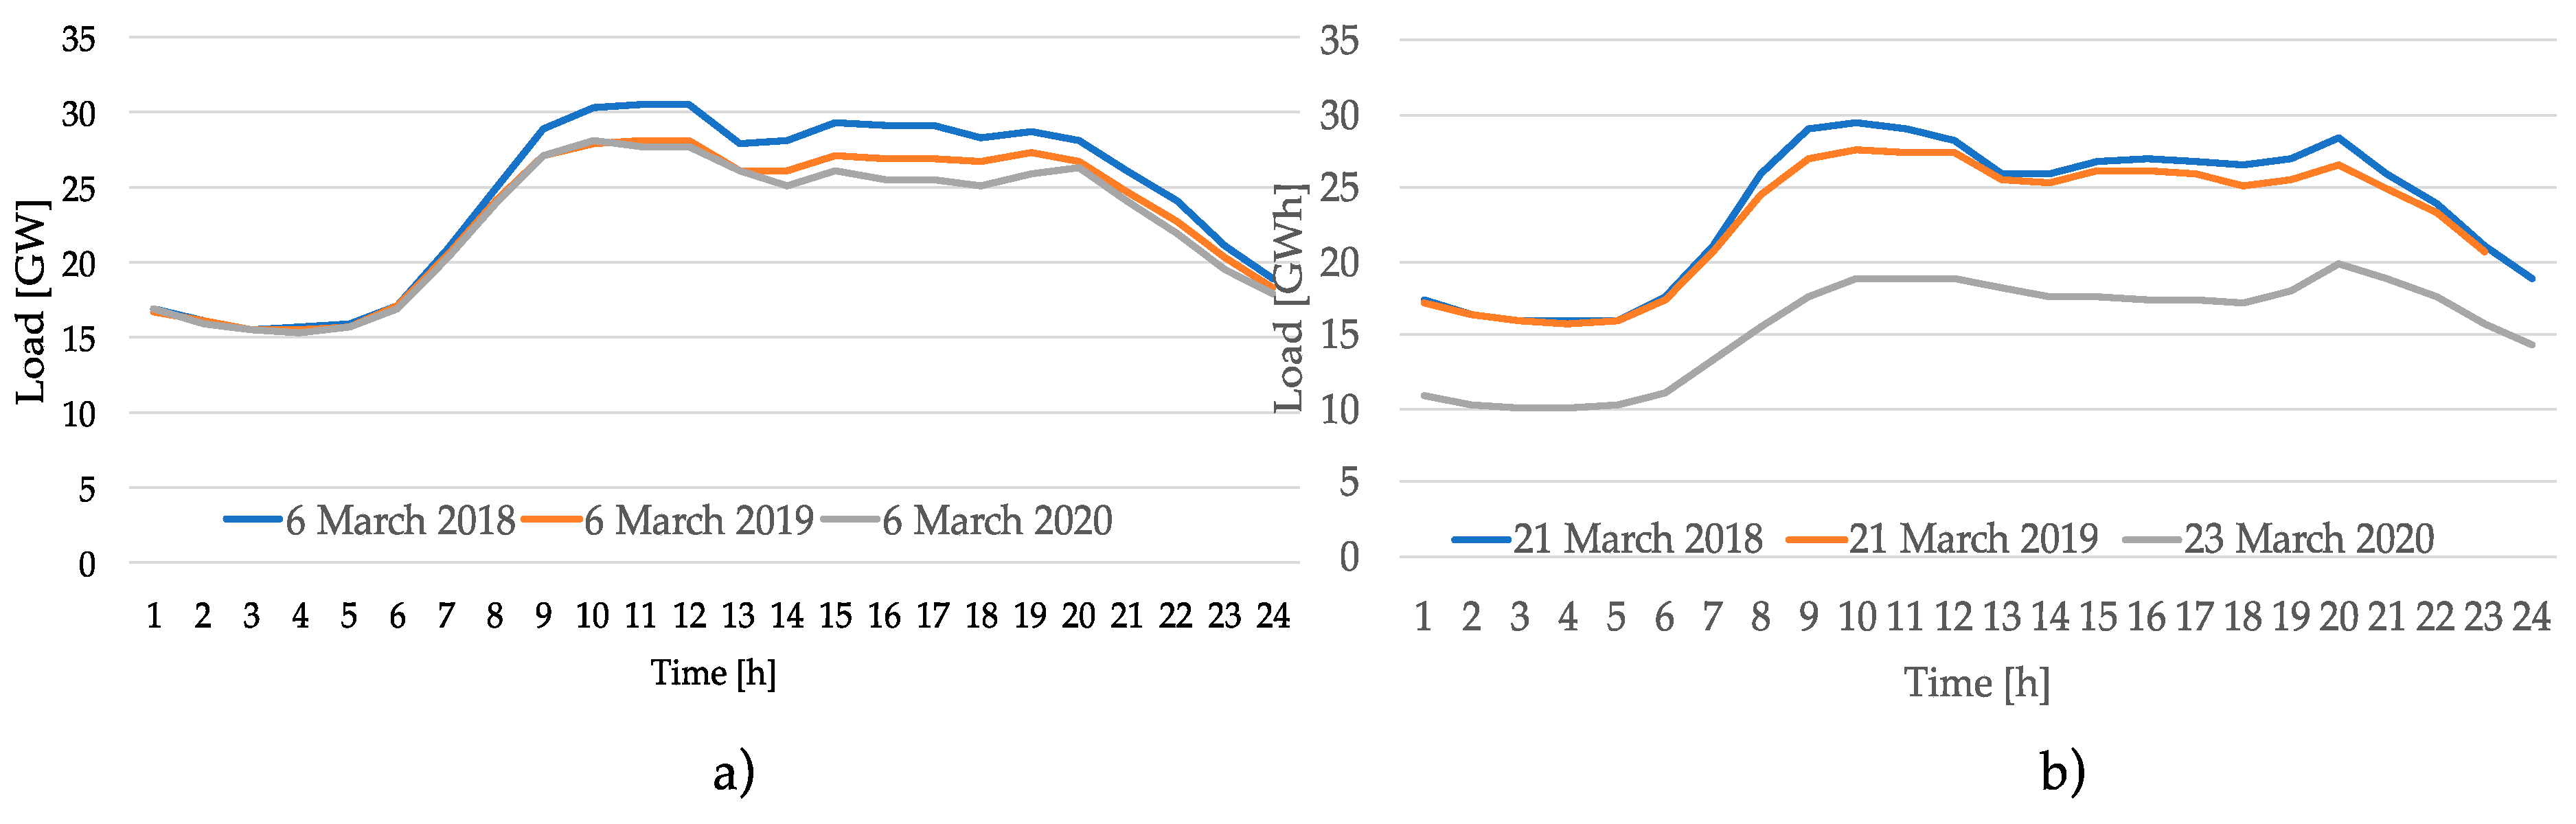
Figure 4, the daily load profile of the days 6th and 21st (for 2020, 23rd, the first available Monday) March is compared for the last three years, although neglecting weather differences and further related economic issues, a consistent reduction of the consumption has been registered. As a result of the lockdown, the daily consumption curve changed their typical pattern. In the morning, electricity consumption ramps up more slowly and the evening peaks remain sustained as people prepare meals and spend time with their families watching TV, using electric appliances and electronic devices; these peaks are anyway lower than one would normally be expected.
The evening peak is reached with a much greater gradient than in the past, putting under stress the regulation capabilities and flexibility of thermoelectric power plants that are working close to the minimum, especially if the regulating capacity of hydroelectric plants (impoundment facility and pumping storage) should not be sufficient. However, the electric system must be able to manage at any time such changes in load in a range of values that, in 2018, fluctuated between a minimum of 20.2 GW and a maximum of 57.8 GW. To assess that issue the residual load, defined as the difference between current load and production from renewable sources, has assumed remarkable importance in the last years, due to the increase of the renewable resources, in particular with the high penetration of PV plants. The residual load corresponds to the actual load that must be covered by dispatchable generation plants. Besides, the shape of the residual load has evolved in the last years, even more differentiating from the pattern of the whole electrical profile, and this phenomenon will be increasingly evident in the forecasted future scenarios due to the expected increase in PV generation. In the days of this observation, the residual load curve is characterized by the typical duck curve, with relevant variations during daytime and in the steepness of the evening ramp due to the simultaneous increase in demand and reduction in renewable energy production, which determines the need for a rapid increase in production from programmable sources. The RES growth, occurred in the Italian territory, has shown to be often not consistent with the points of major consumption. On the other hand, especially for PV, the installation of the plants led to increasing network congestion situations, due to the asymmetry in their installation location (most of the production is located in South Italy for the solar energy availability).
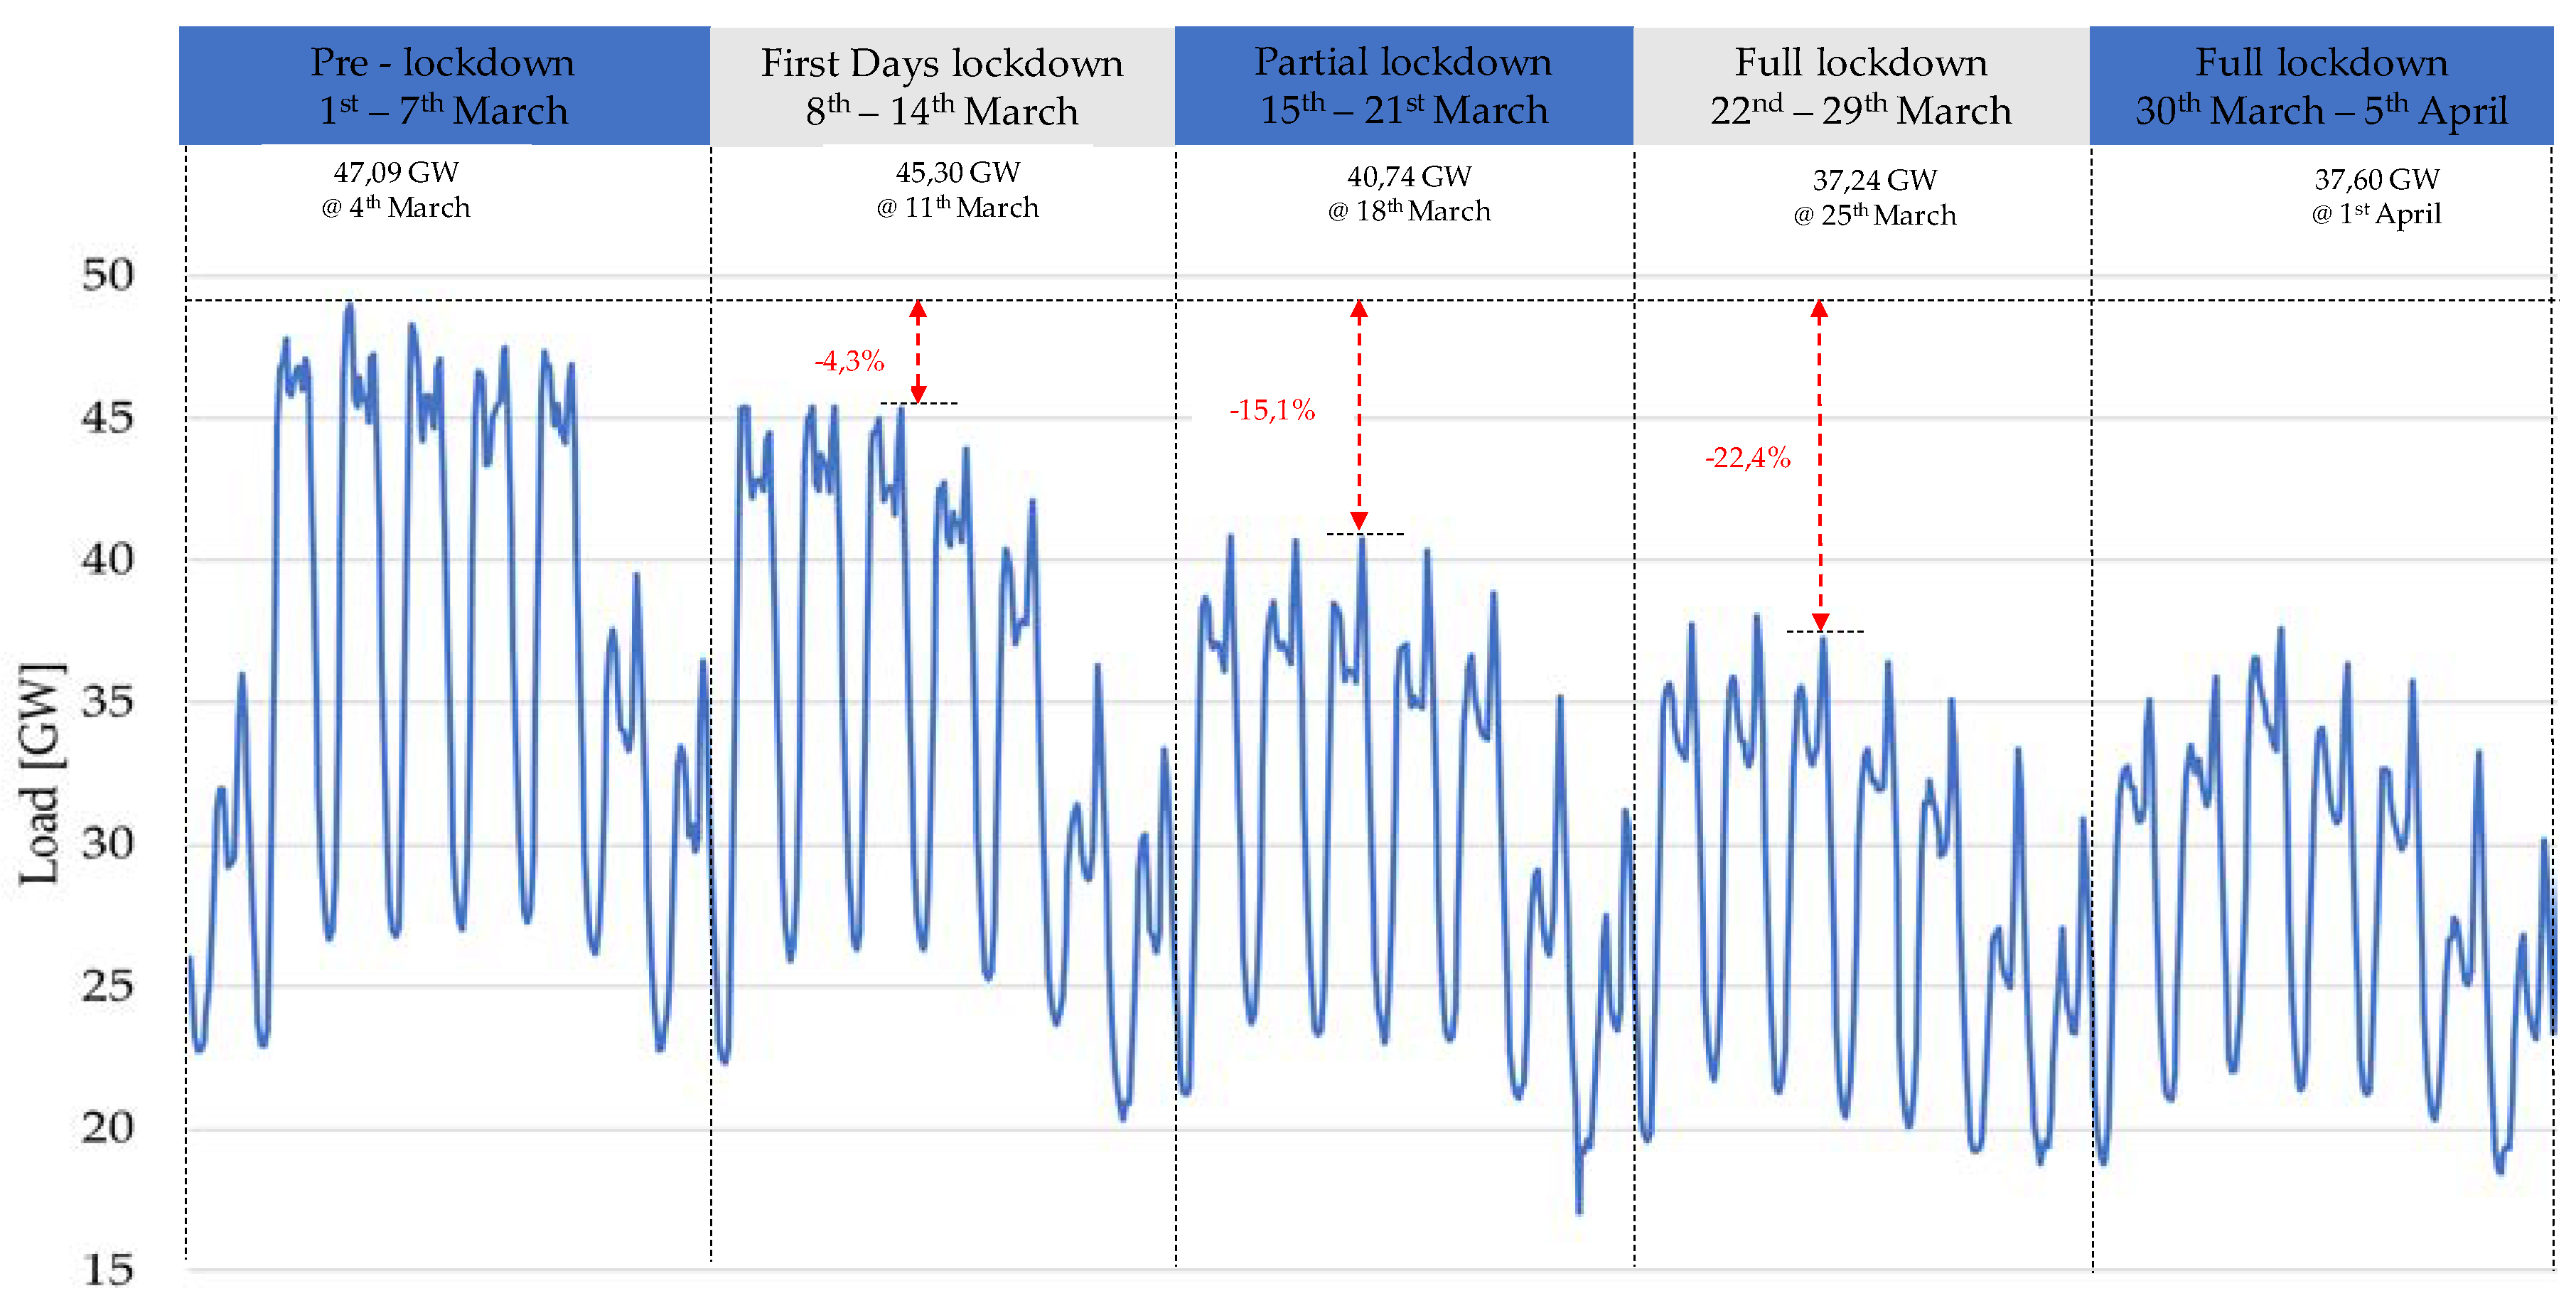
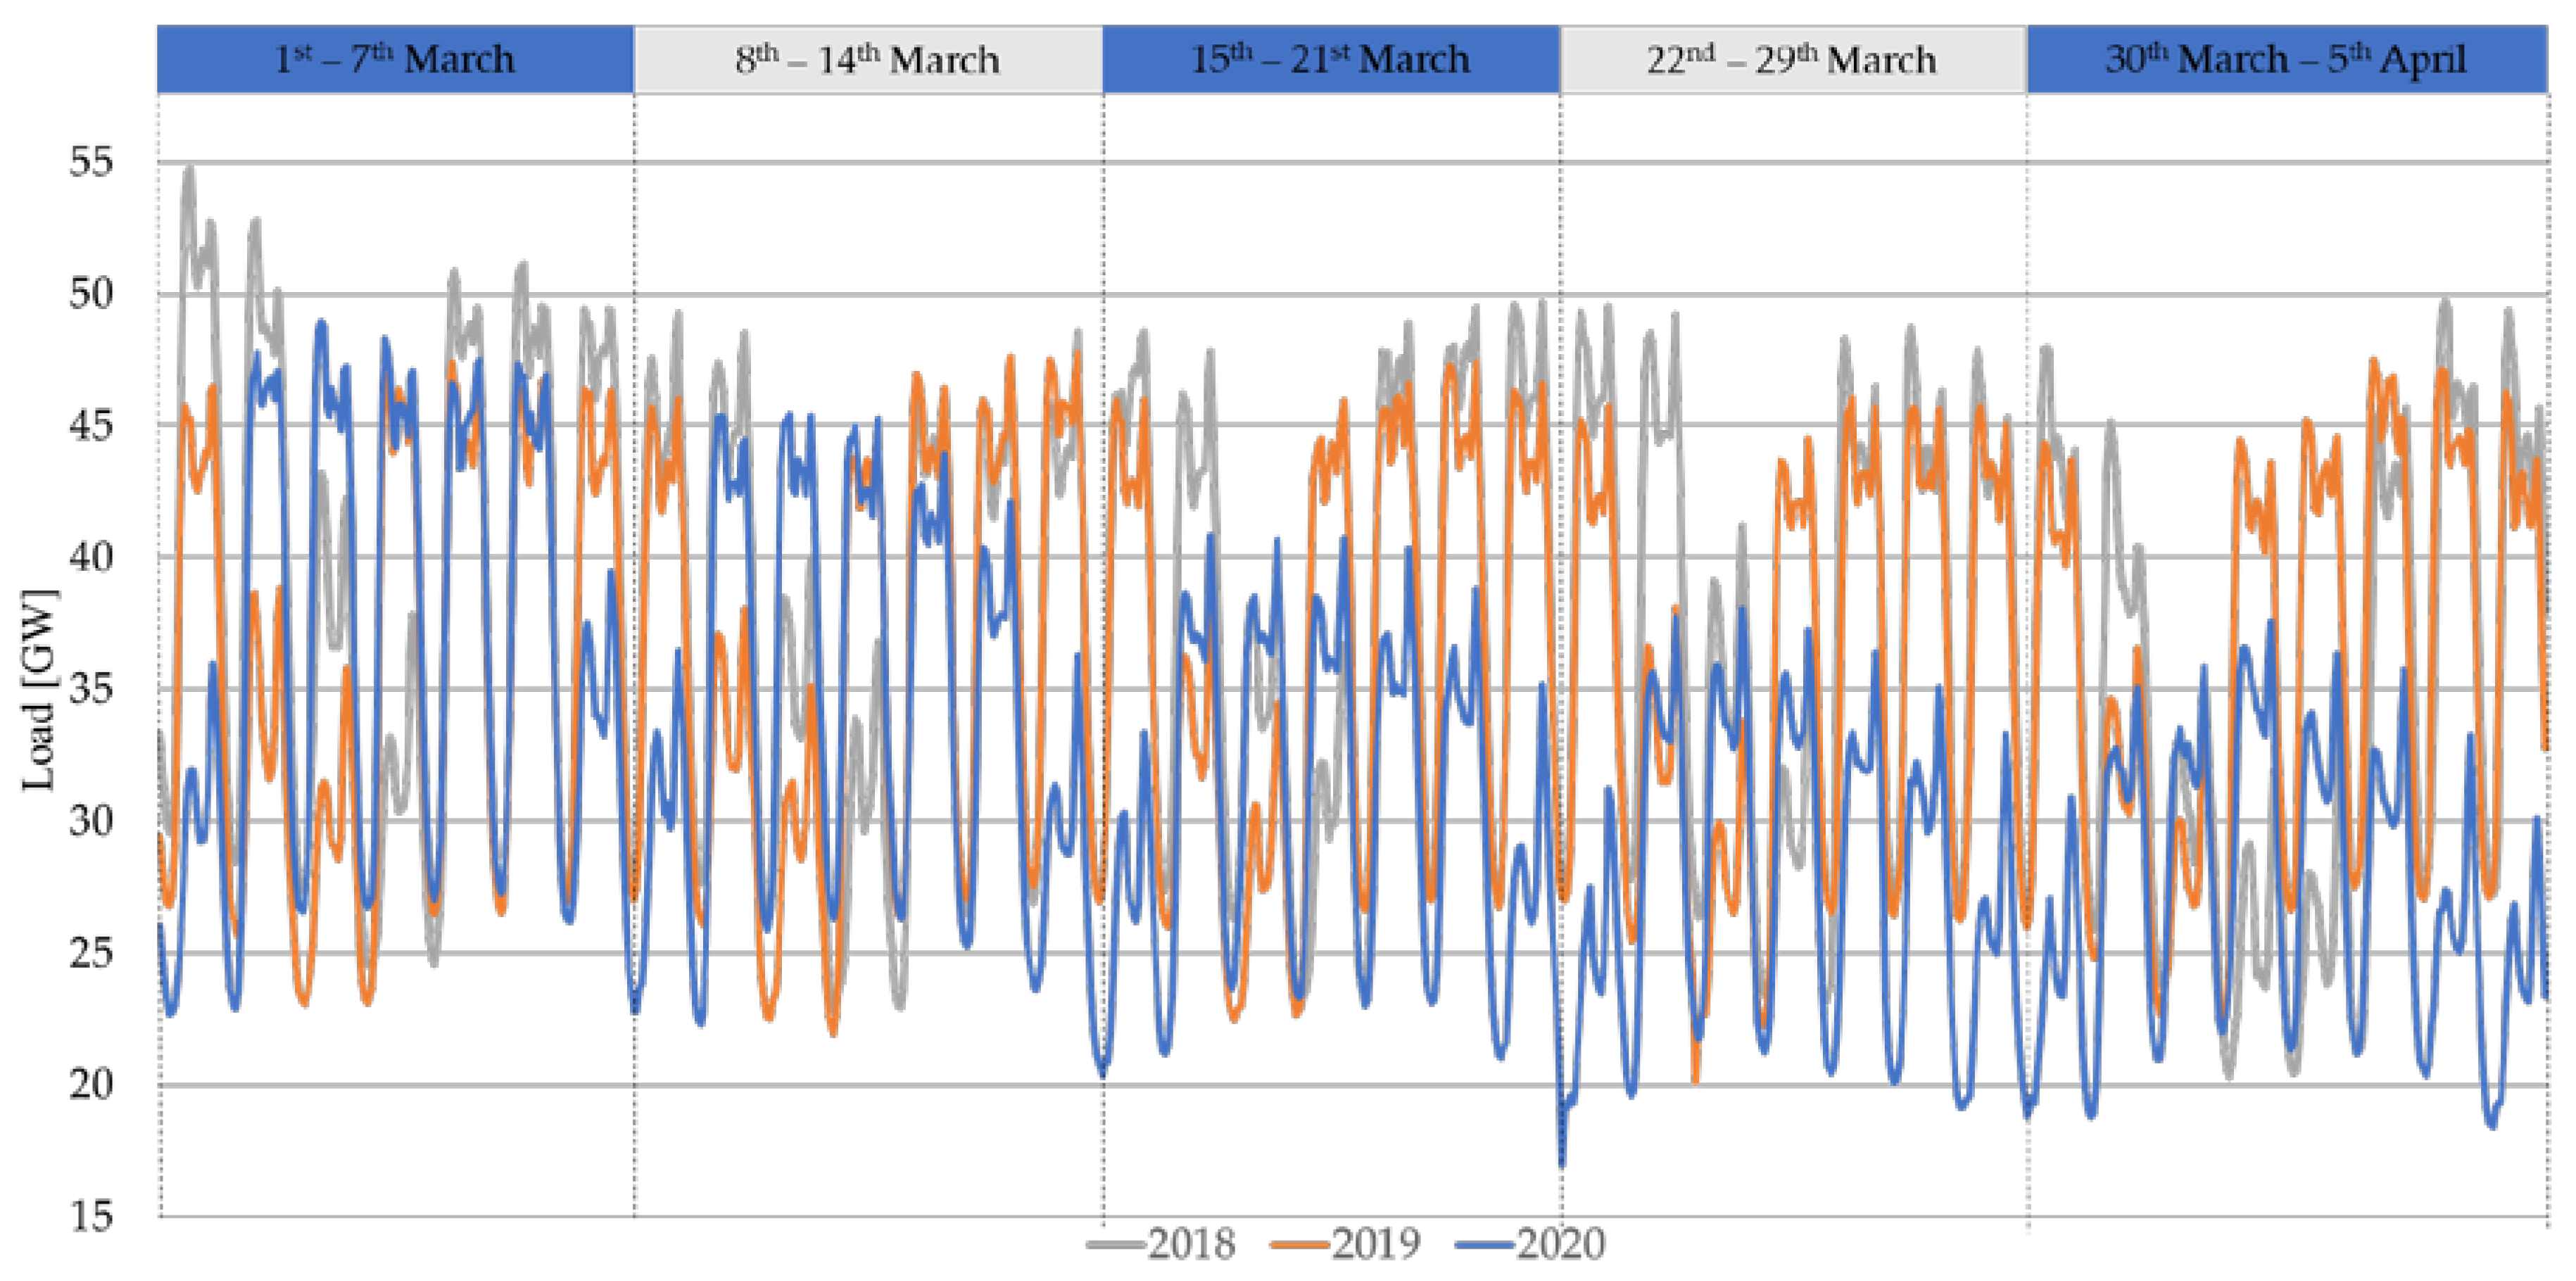
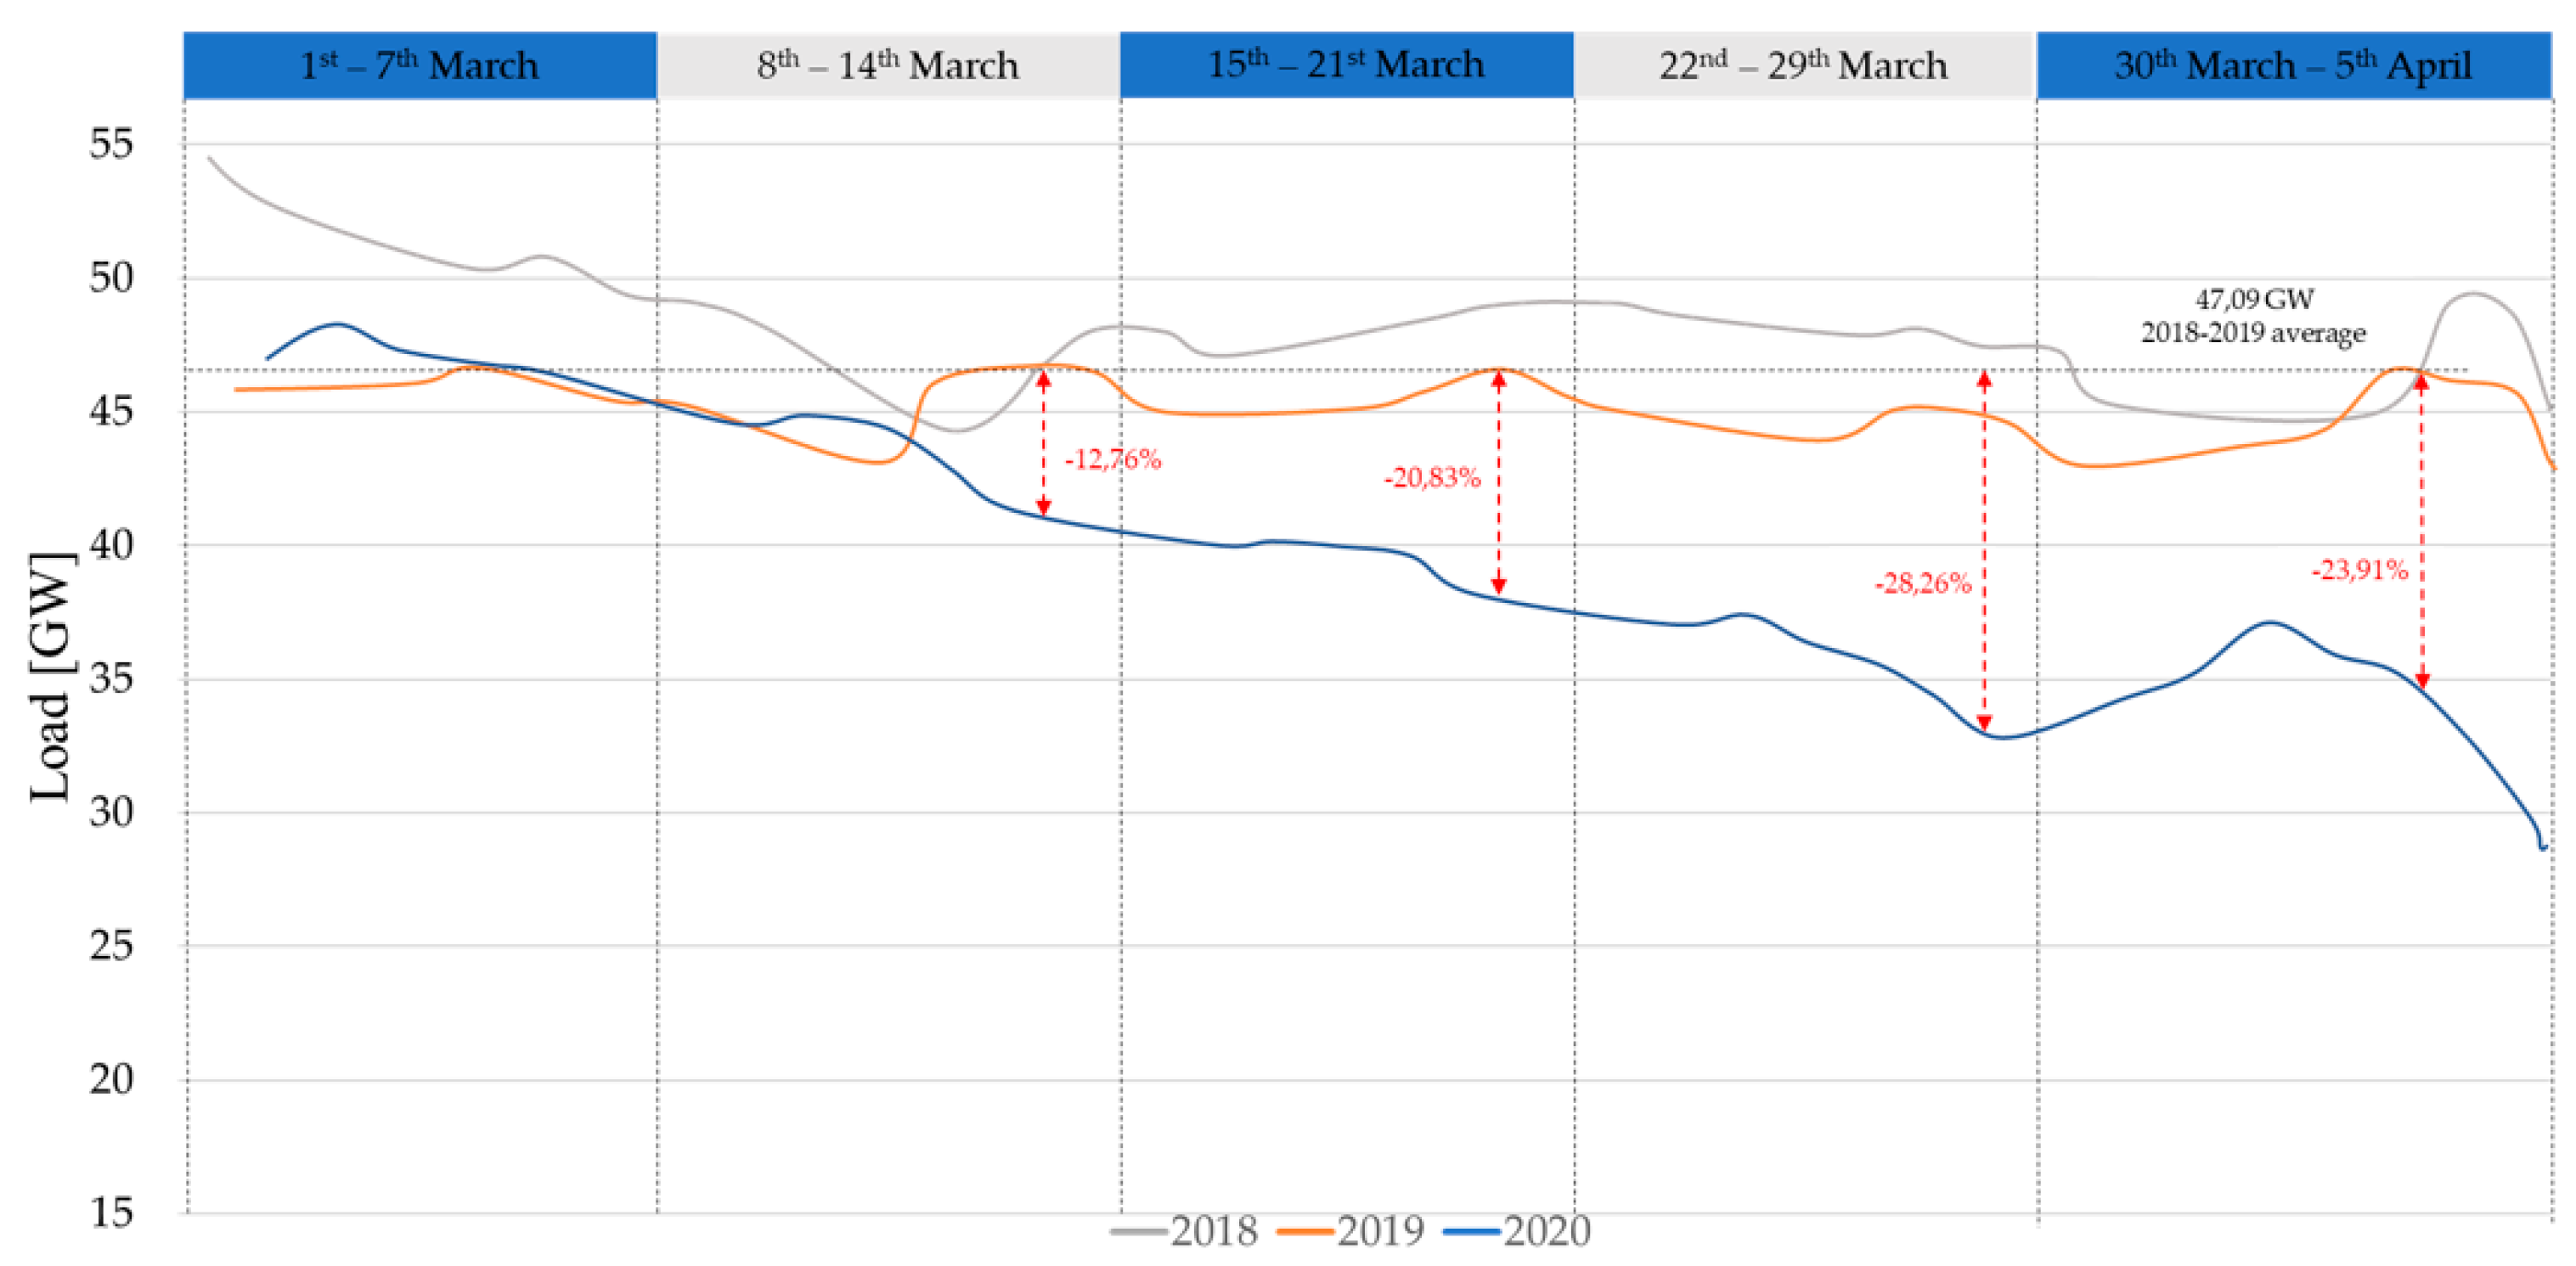
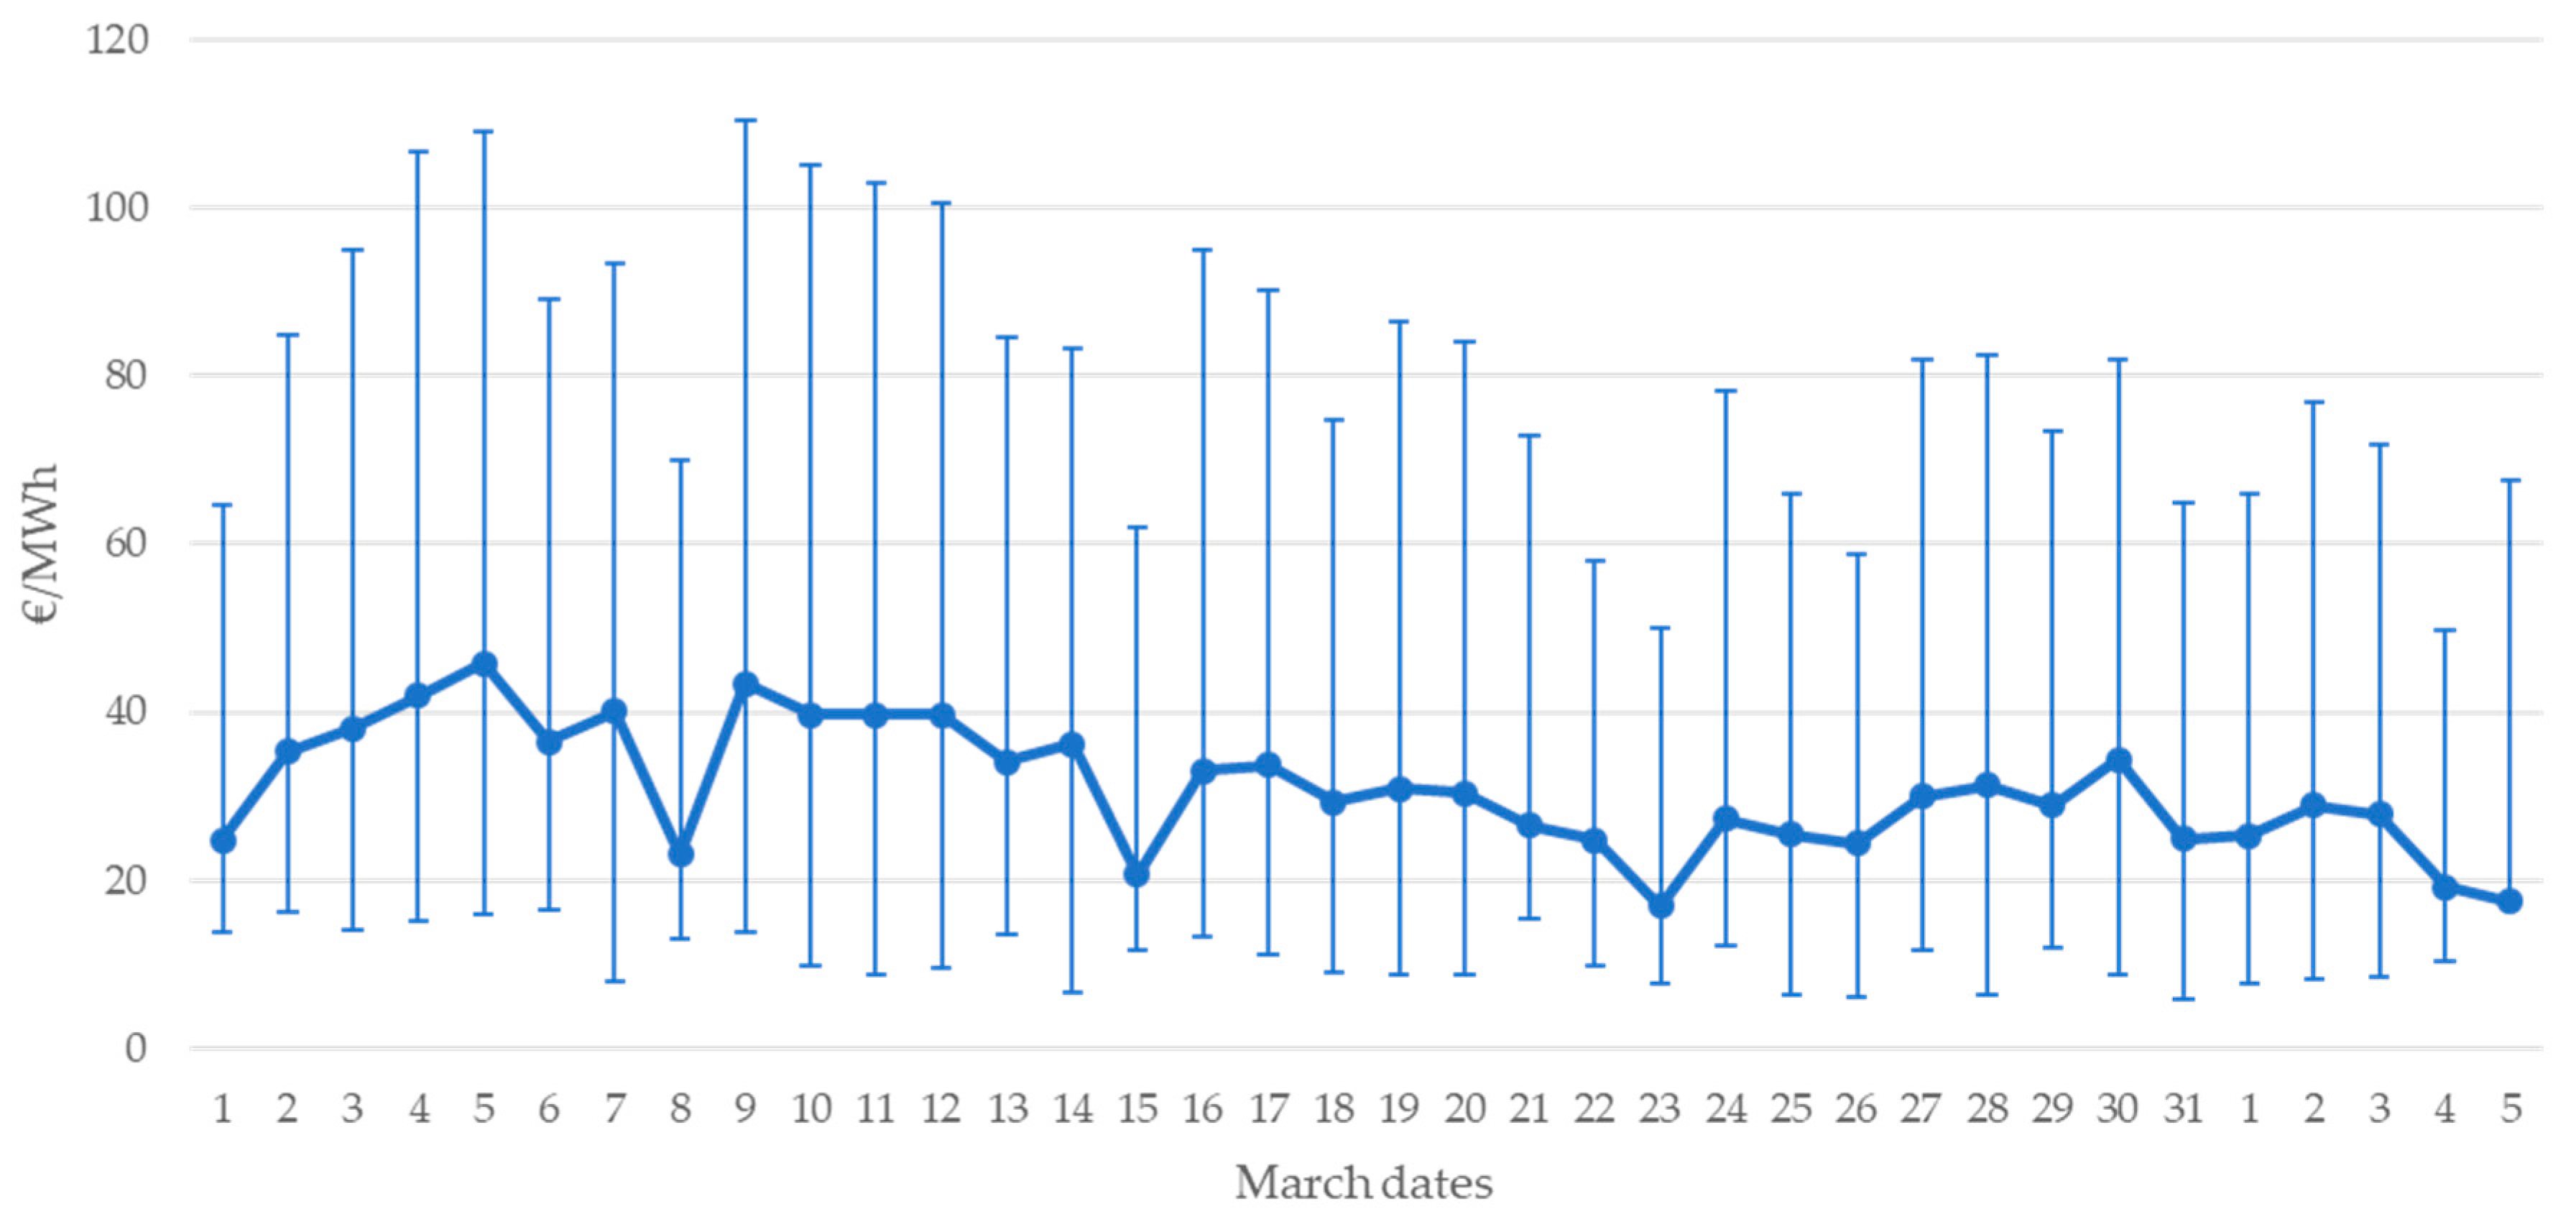
In
Figure 5 the variation of the peak in the demand is considered for March 2020 and the first week of April. The profiles show how increasing lockdown measures caused a sustained decrease in national energy demand. In particular, from the last weeks of March, a decrease in load was observed, following the consecutive closure of production facilities. In
Figure 6, the peak variation is compared for the last three years. To better clarify the phenomena, in
Figure 7 is reported a comparison between 2018, 2019 and 2020 of the peak variation profiles.
Figure 7 shows an evident reduction in consumption, which reached at least 25% less consumption than the average in the previous year.
The analysis was brought to a higher level of detail, to evaluate the impacts of the health emergency, on all the areas of Italy. In particular, the profiles on the northern part of Italy was evaluated. The northern part of Italy, composed by Valle d’Aosta, Piemonte, Liguria, Emilia-Romagna, Lombardia, Veneto, Friuli Venezia Giulia and Trentino Alto Adige is the main productive zone of the nation, accounting for about half of the national gross domestic product.
Figure 8 shows the load profiles in the North of Italy. As shown in
Figure 8, their trends reflect those of the whole nation, describing a lowering of the load by almost half compared to normal conditions. The northern part of Italy is characterized by the highest penetration of industrial facilities and the impact on consumption of the lockdown was quite remarkable.
4. Impact on Electricity Market during COVID-19
4.1. Italian Electricity Market
In Italy, the electricity market (Italian Power Exchange—IPEX) was set up as a result of Legislative Decree no. 79 dated 16 March 1999 (“Bersani Decree”) as part of the implementation of the EU directive on the creation of an internal energy market (Directive 96/92/EC repealed by Directive 2003/54/EC).
The Italian electricity market is divided into:
- -
Day-ahead market (MGP);
- -
Intra-day market (MI);
- -
Dispatching services market (MSD).
In the MGP and MI—also referred to as energy markets—producers, wholesalers and end customers, as well as Acquirente Unico (AU), responsible for acquiring energy for captive customers and Gestore dei Servizi Energetici (GSE), responsible for selling energy for renewable producers, buy and sell wholesale quantities of electricity for the next day. These markets, which are managed by Gestore dei Mercati Energetici (GME), define system marginal prices at which the energy is traded. In the MSD, the transmission system operator (TSO), Terna, procures the resources it needs to manage and control the system (solving intranational congestions, creating energy reserves, real-time balancing). Given that transport capacity limits exist, the Italian power system is subdivided into market zones and are cleared through the local market algorithm. The number of constrained zones or “point of limited production”, are zones whose maximum generation exportable to the rest of the grid is lower than the maximum possible generation owing to insufficient Transmission capacity [
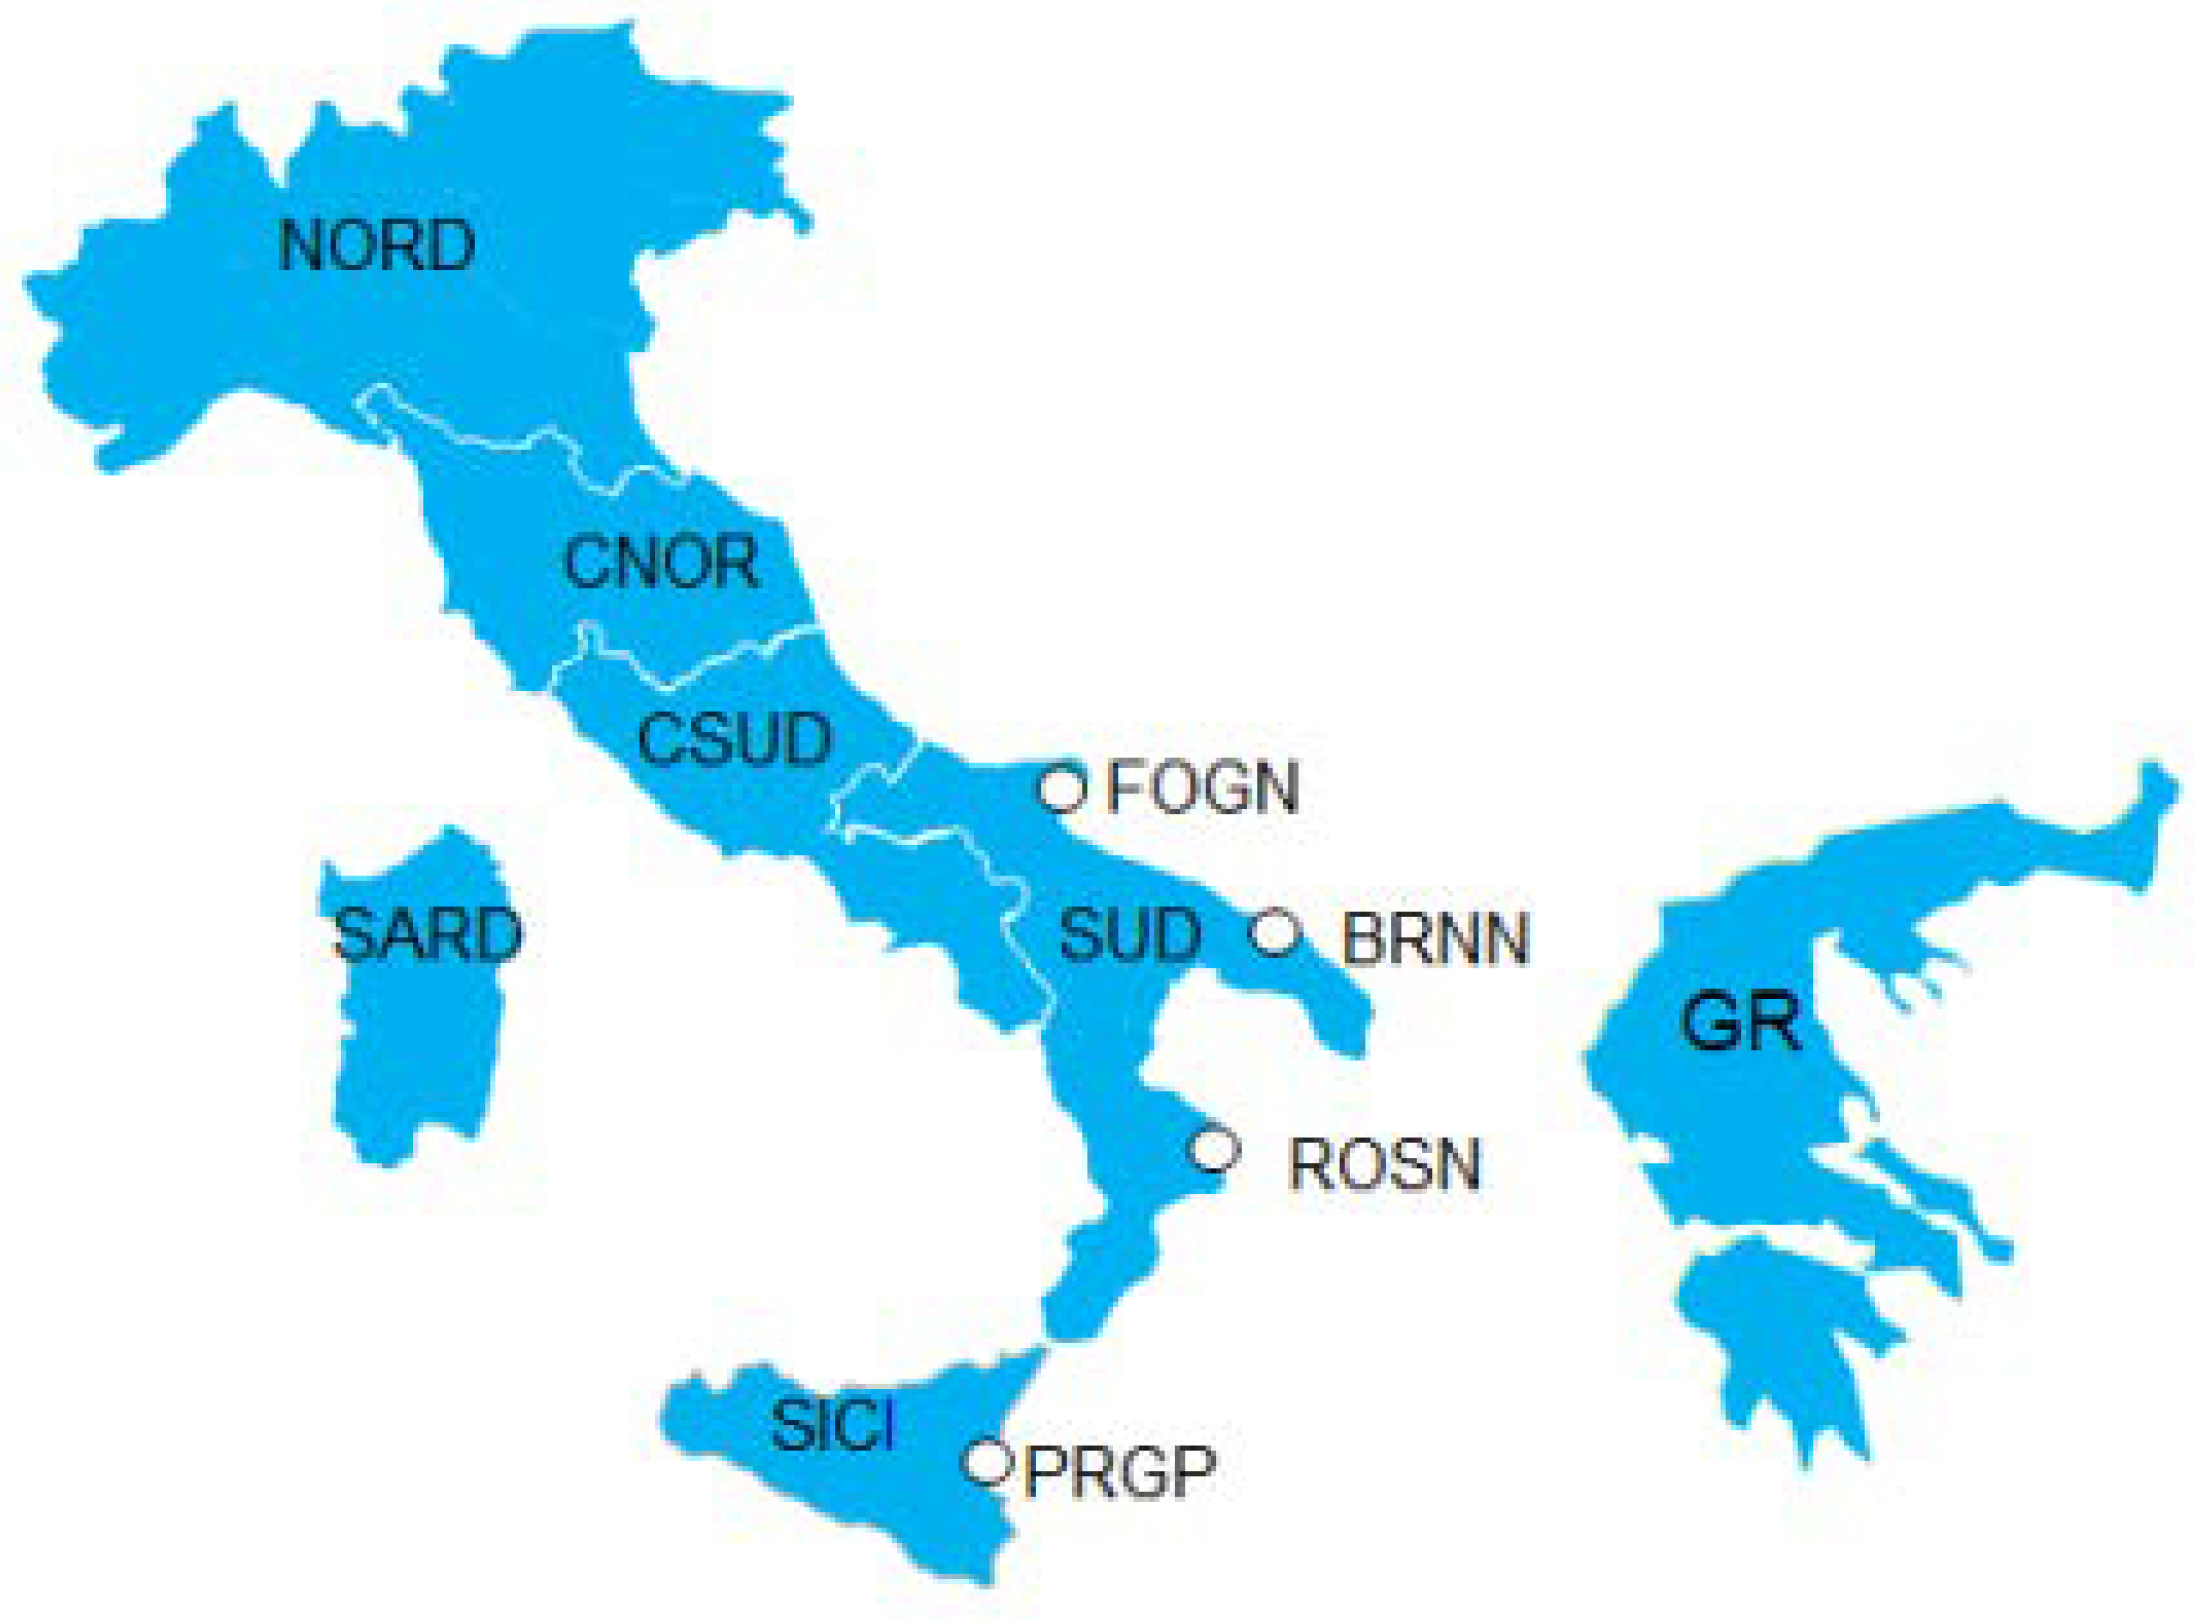
14]. Currently, the zones are as follows (
Figure 9):
Geographical zone: representing a portion of the national grid. Geographical zones are northern Italy (NORD), central-northern Italy (CNOR), central-southern Italy (CSUD), southern Italy (SUD), Sicilia (SICI), Sardegna (SARD);
National virtual zone: constrained zone (“point or pole of limited production”). It includes Rossano (ROSN);
Foreign virtual zone: point of interconnection with neighboring countries. It includes France (FRAN), Switzerland (SVIZ), Austria (AUST), Slovenia (SLOV), Slovenia coupling representing the interconnection dedicated to the market coupling between Italy and Slovenia (BSP); Corsica (CORS), Corsica AC (COAC), Greece (GREC), France coupling (XFRA), Austria coupling (XAUS), Malta (MALT), Switzerland coupling (XSVI) and Montenegro (MONT).
Market zone: aggregation of geographical and/or virtual zones such that the flows between the same zones are lower than the transmission limits notified by the TSO. This aggregation is defined on an hourly basis as a result of the resolution of the day-ahead market and intra-day market. In the same hour, different market zones may have different zonal prices.
The day-ahead market algorithm runs the first time at the national level. If the capacity limits among zones are not reached, the outcome is an equal price for all the zones, otherwise, the market is split into one or more zones. All supply offers and demand bids are valued at the marginal clearing price of the zone to which they belong. This price is determined, for each hour, by the intersection of the zonal demand and supply curves and is different from one zone to another zone when transmission capacity limits are saturated. The accepted demand bids pertaining to consuming units belonging to Italian geographical zones are valued at the “Prezzo Unico Nazionale” (PUN—national single price); this price is the weighted mean of the prices of the geographical zones, weighted for the quantities purchased in these zones [
14].
Commonly, Italy shows significant differences among the market prices of different zones. This is due to bottlenecks in the north-south transmission lines that are unable to manage the regional imbalance of generation and demand between the two zones. Currently, plans have been made to strengthen transmission lines and to achieve further transmission capacity to accommodate higher renewables according to the national electricity transmission grid development plan [
12] and ENTSO-E TSO cooperation regarding the network development and long-term planning defined in Ten-Year Network Development Plan (TYNDP) [
16]. For instance, the construction of three main high voltage direct current (HVDC) lines is being considered, which will connect south and north of Italy through the main Islands of Sardinia and Sicily (
Figure 10) [
17].
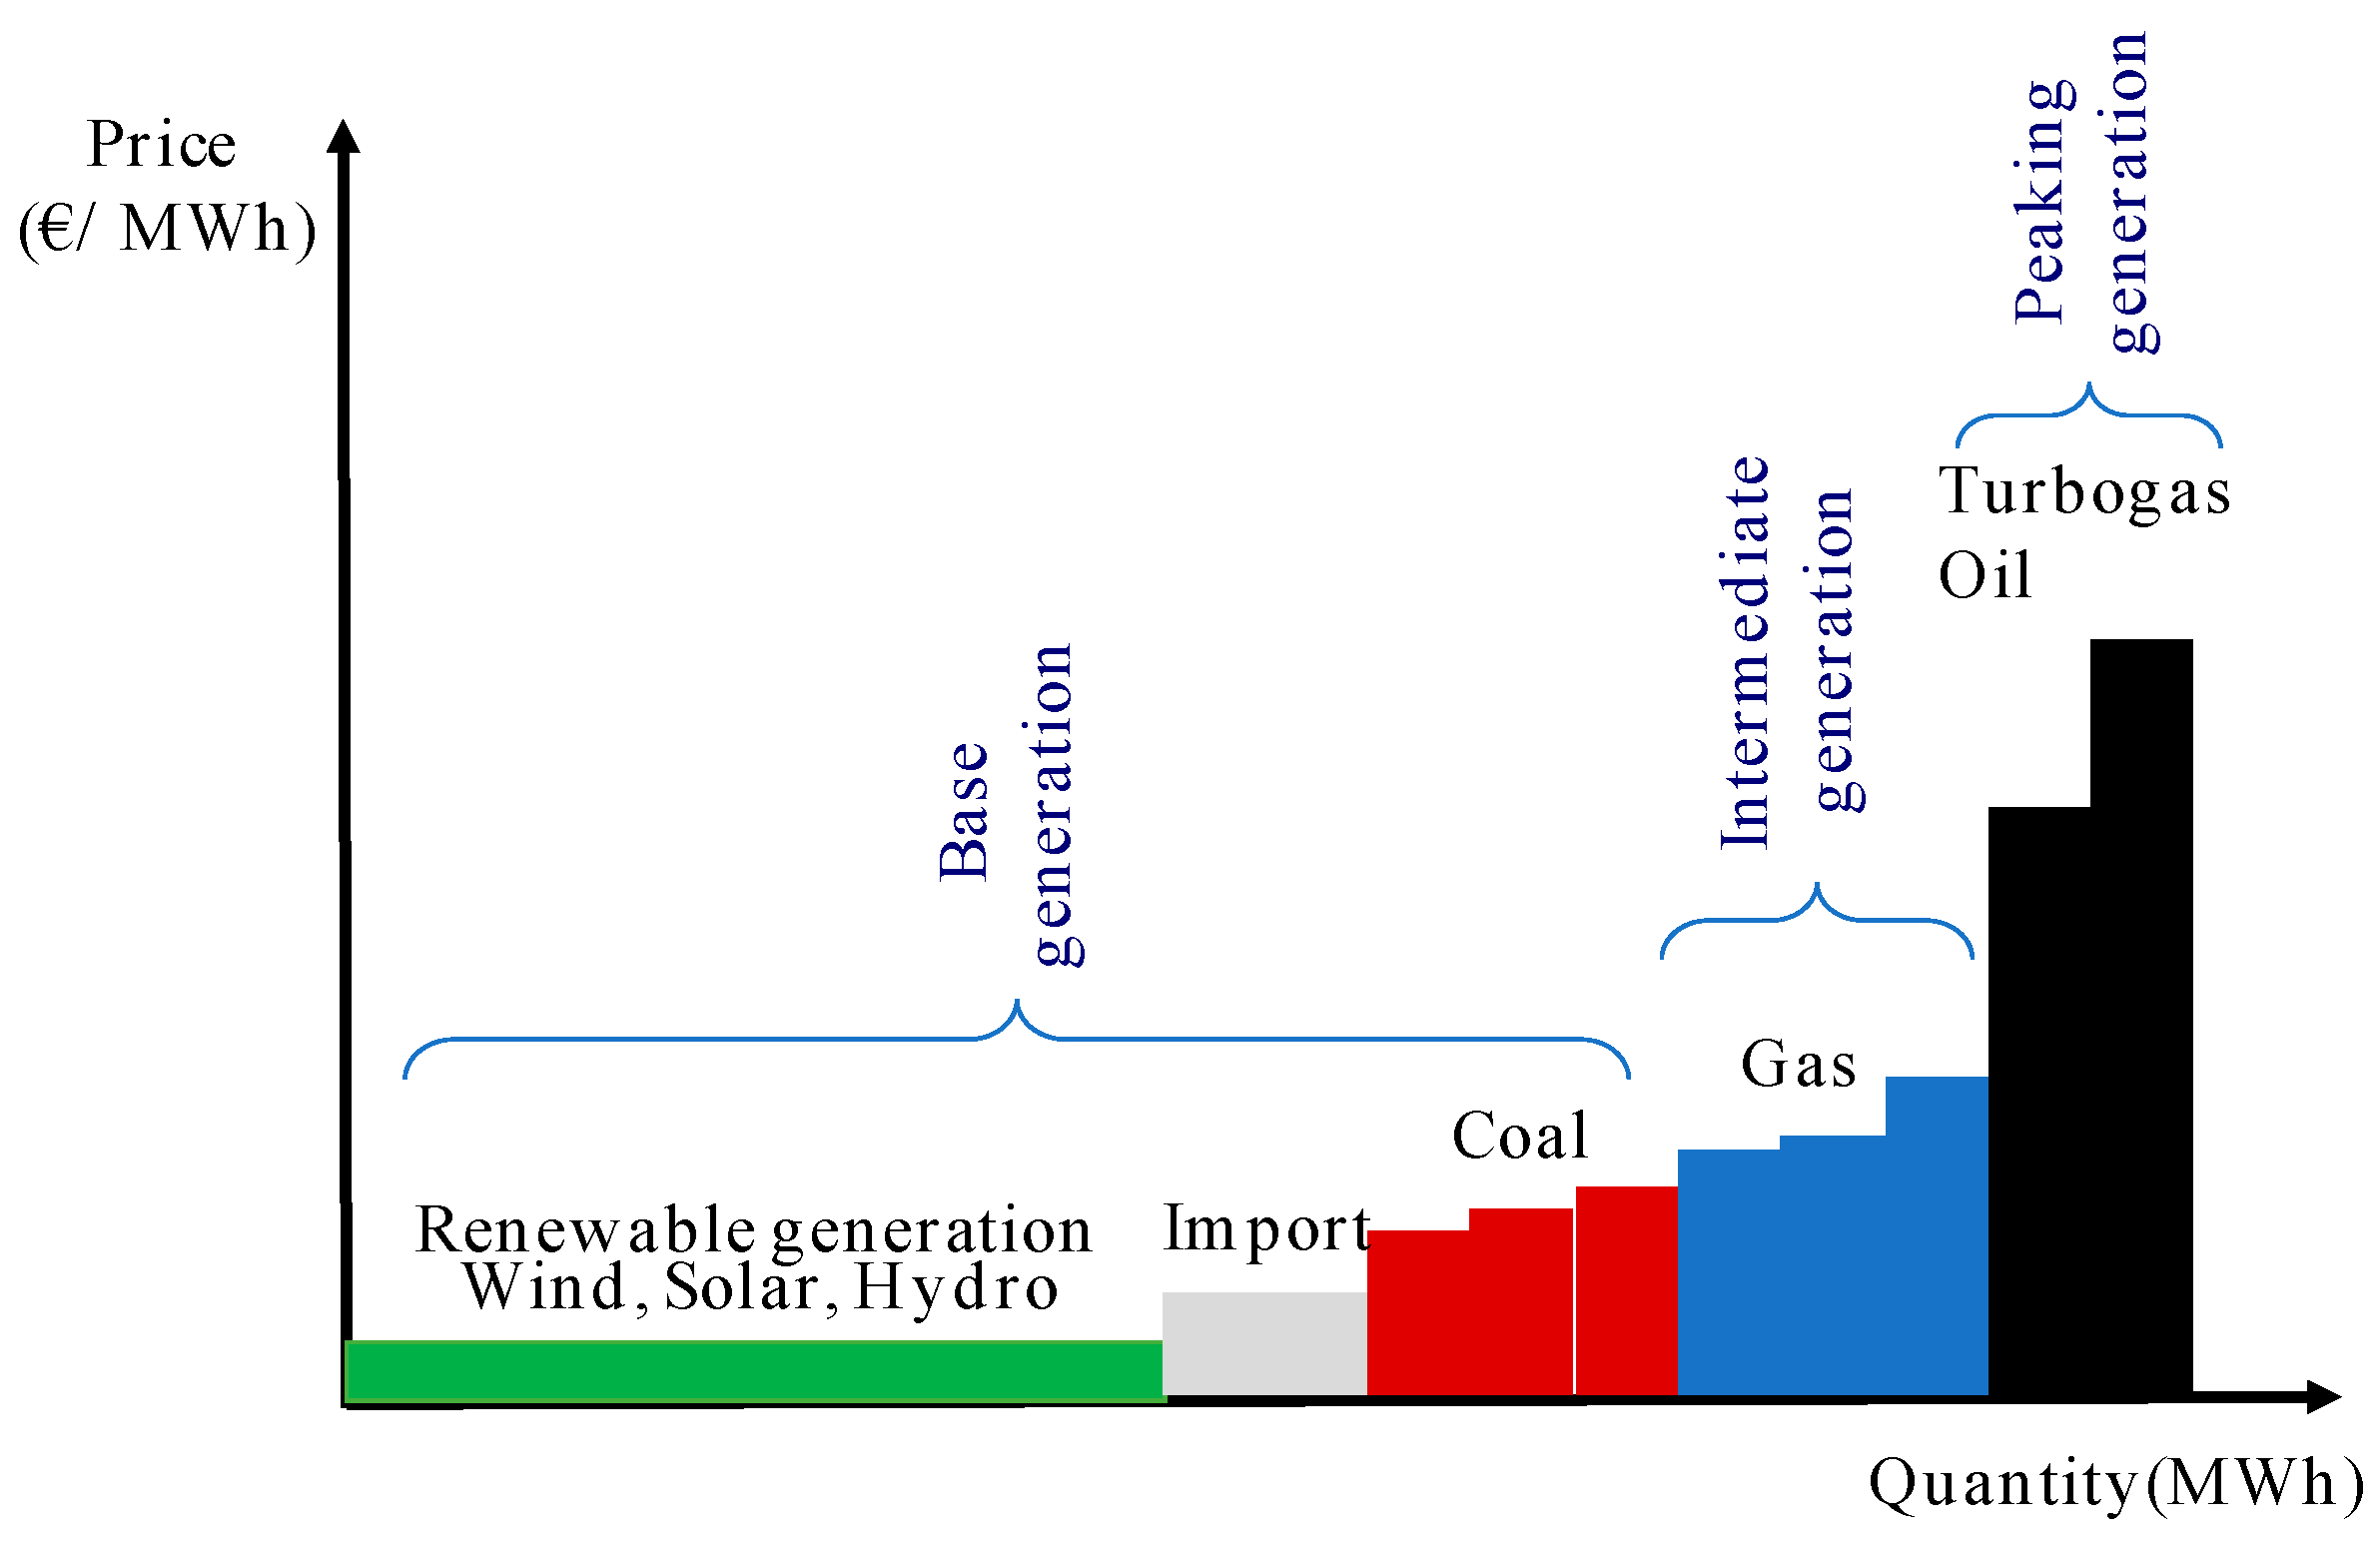
Besides, the growth of renewable power has forced down wholesale electricity prices given that the clearing power price is determined by the “merit order”—the sequence in which power producers contribute power to the market, with the cheapest offer made by the producer. Power from renewable installations such as wind and PV is offered at null cost (price takers). That means they lower the entrance price and push more expensive conventional producers down in the merit order list (
Figure 11).
The growth of renewable sources has led to a significant decrease in the hours of use of thermal plants with the highest production costs and a significant reduction in the PUN. As can be seen in
Figure 12, high quantities of RES lead to low prices of energy in the market, specially recorded in the summer months.
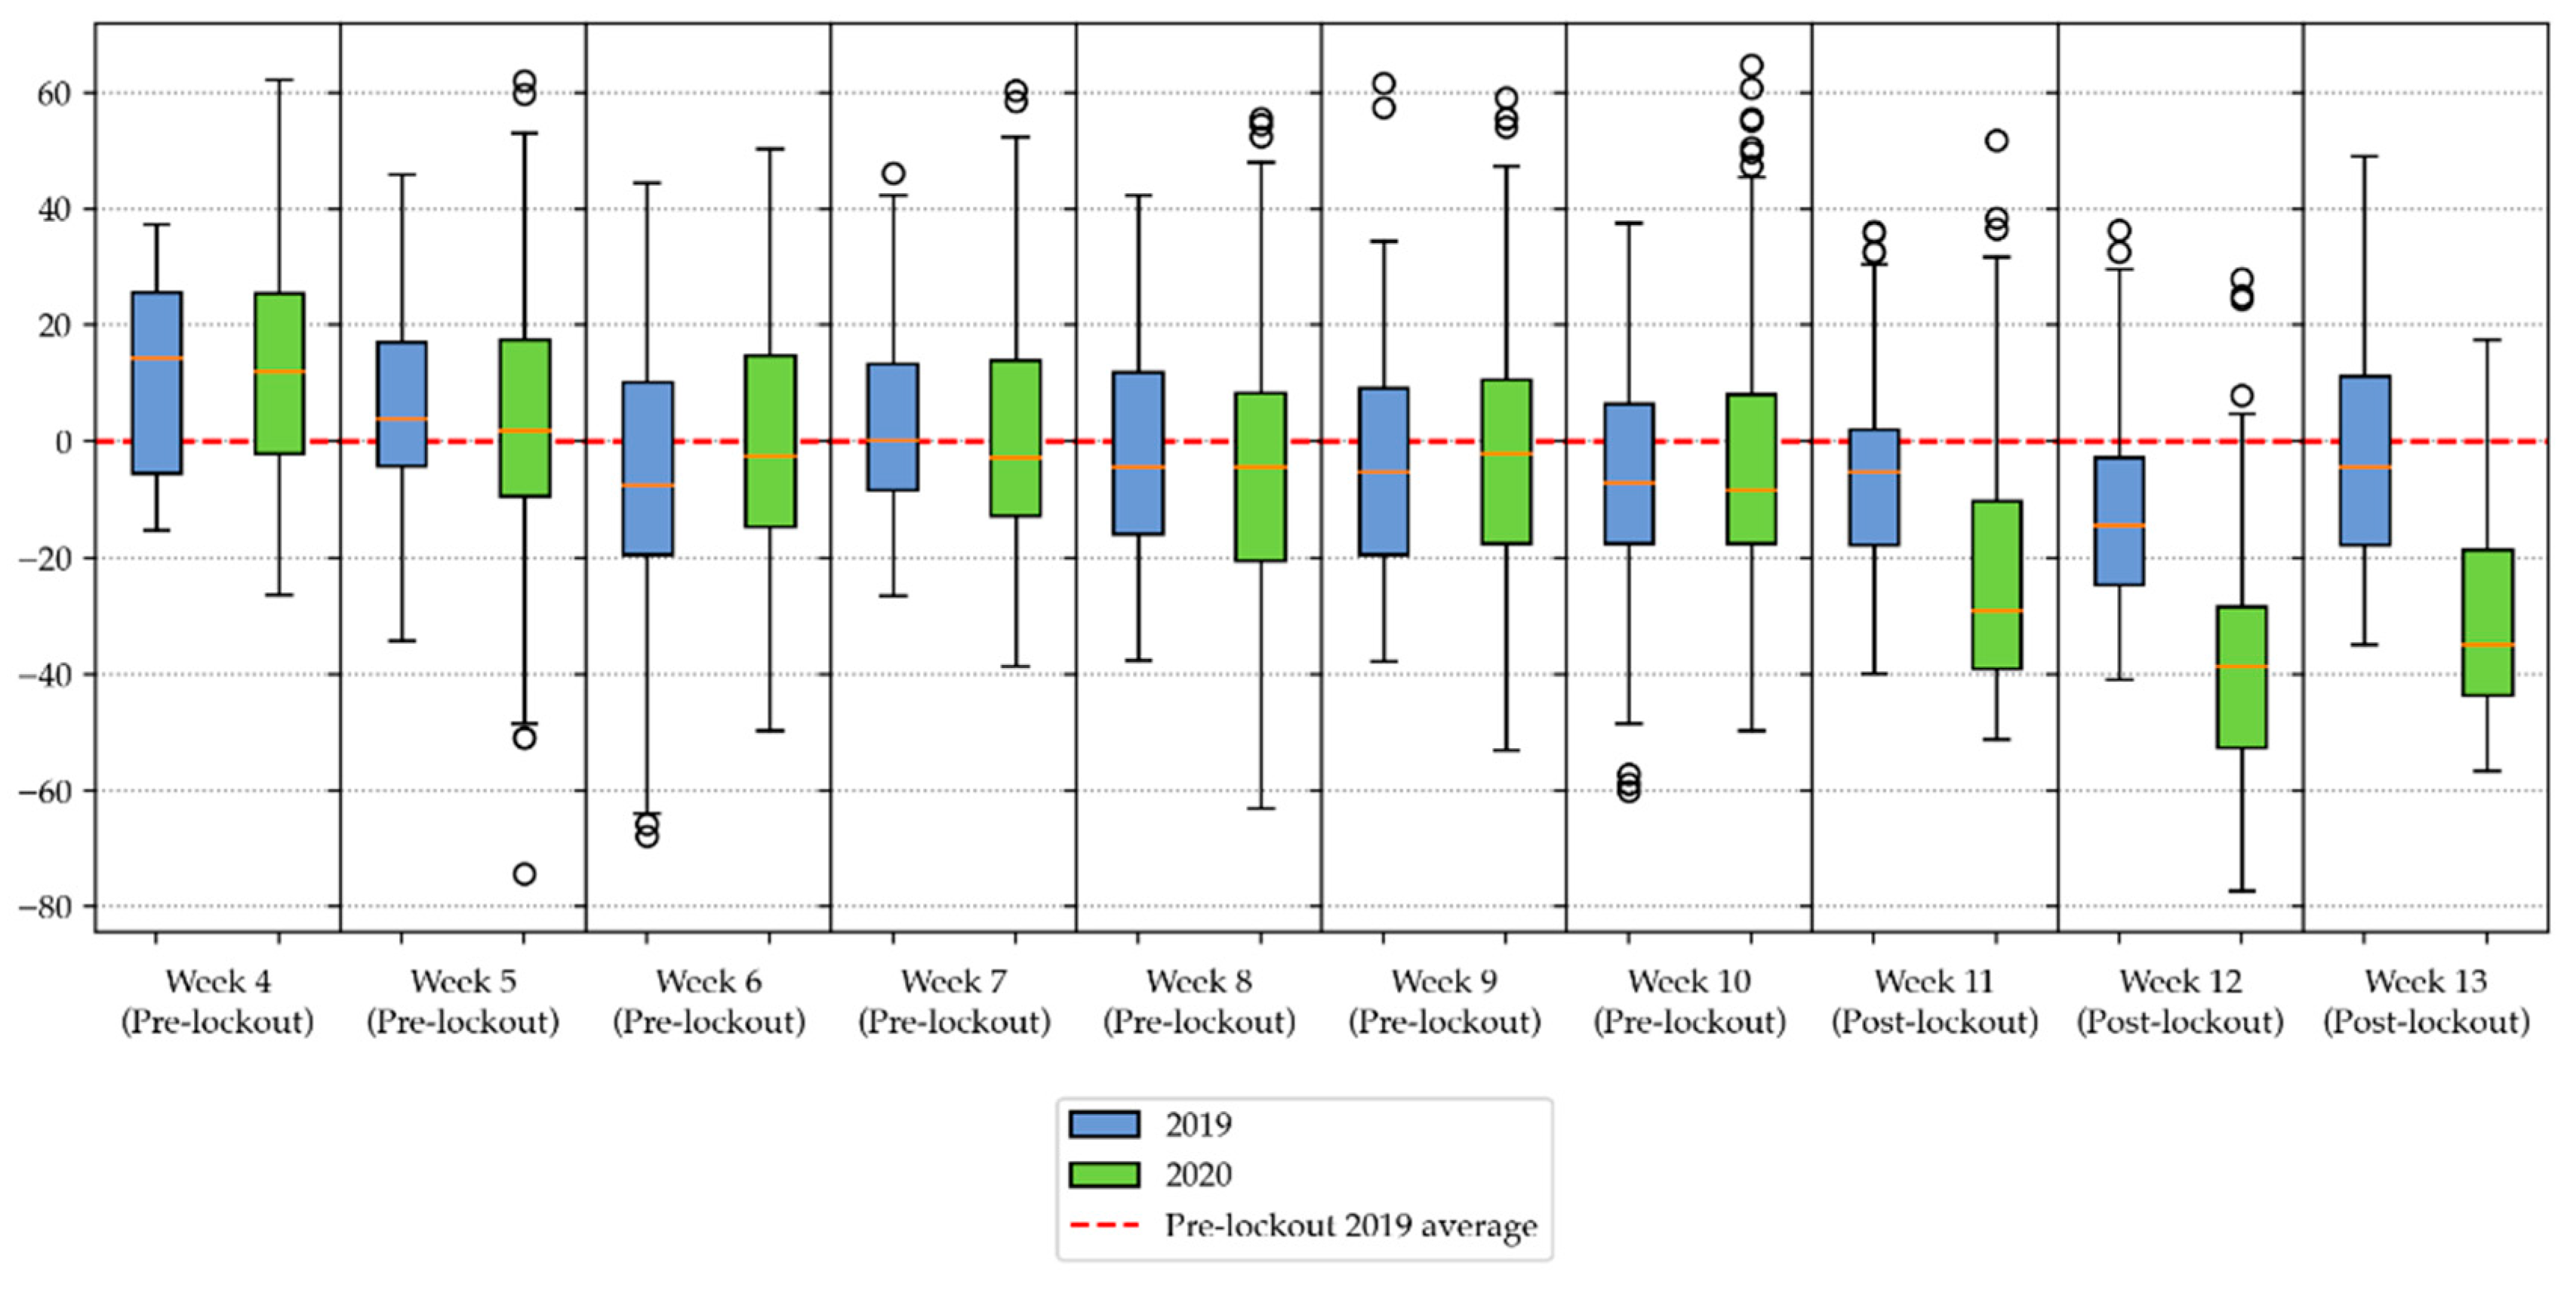
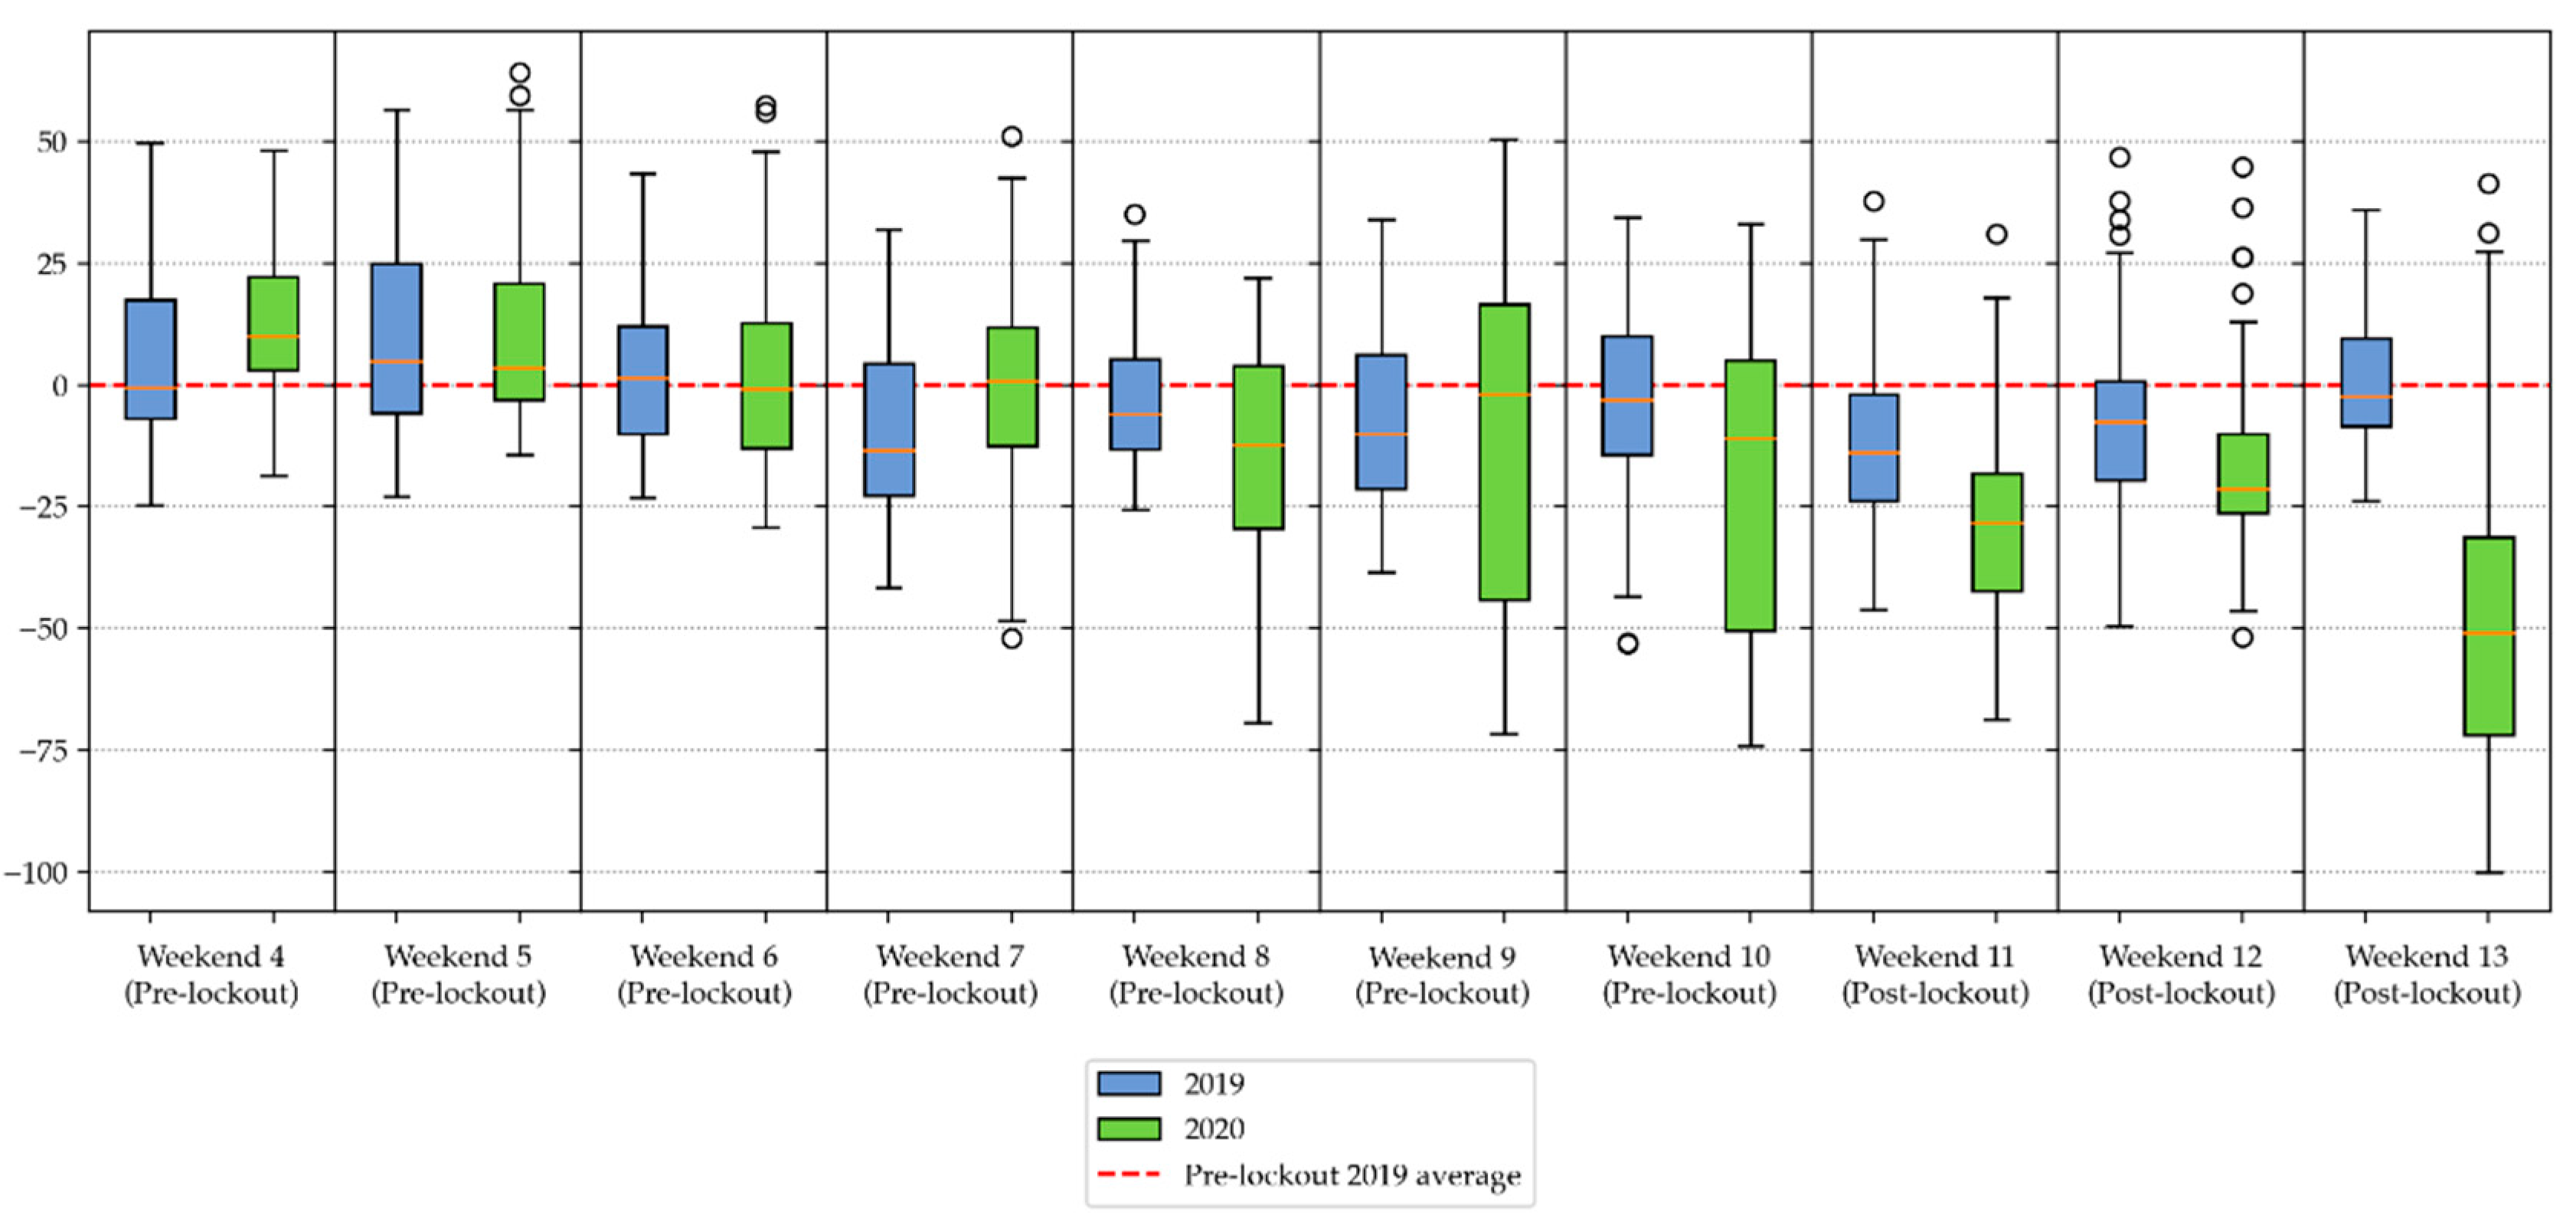
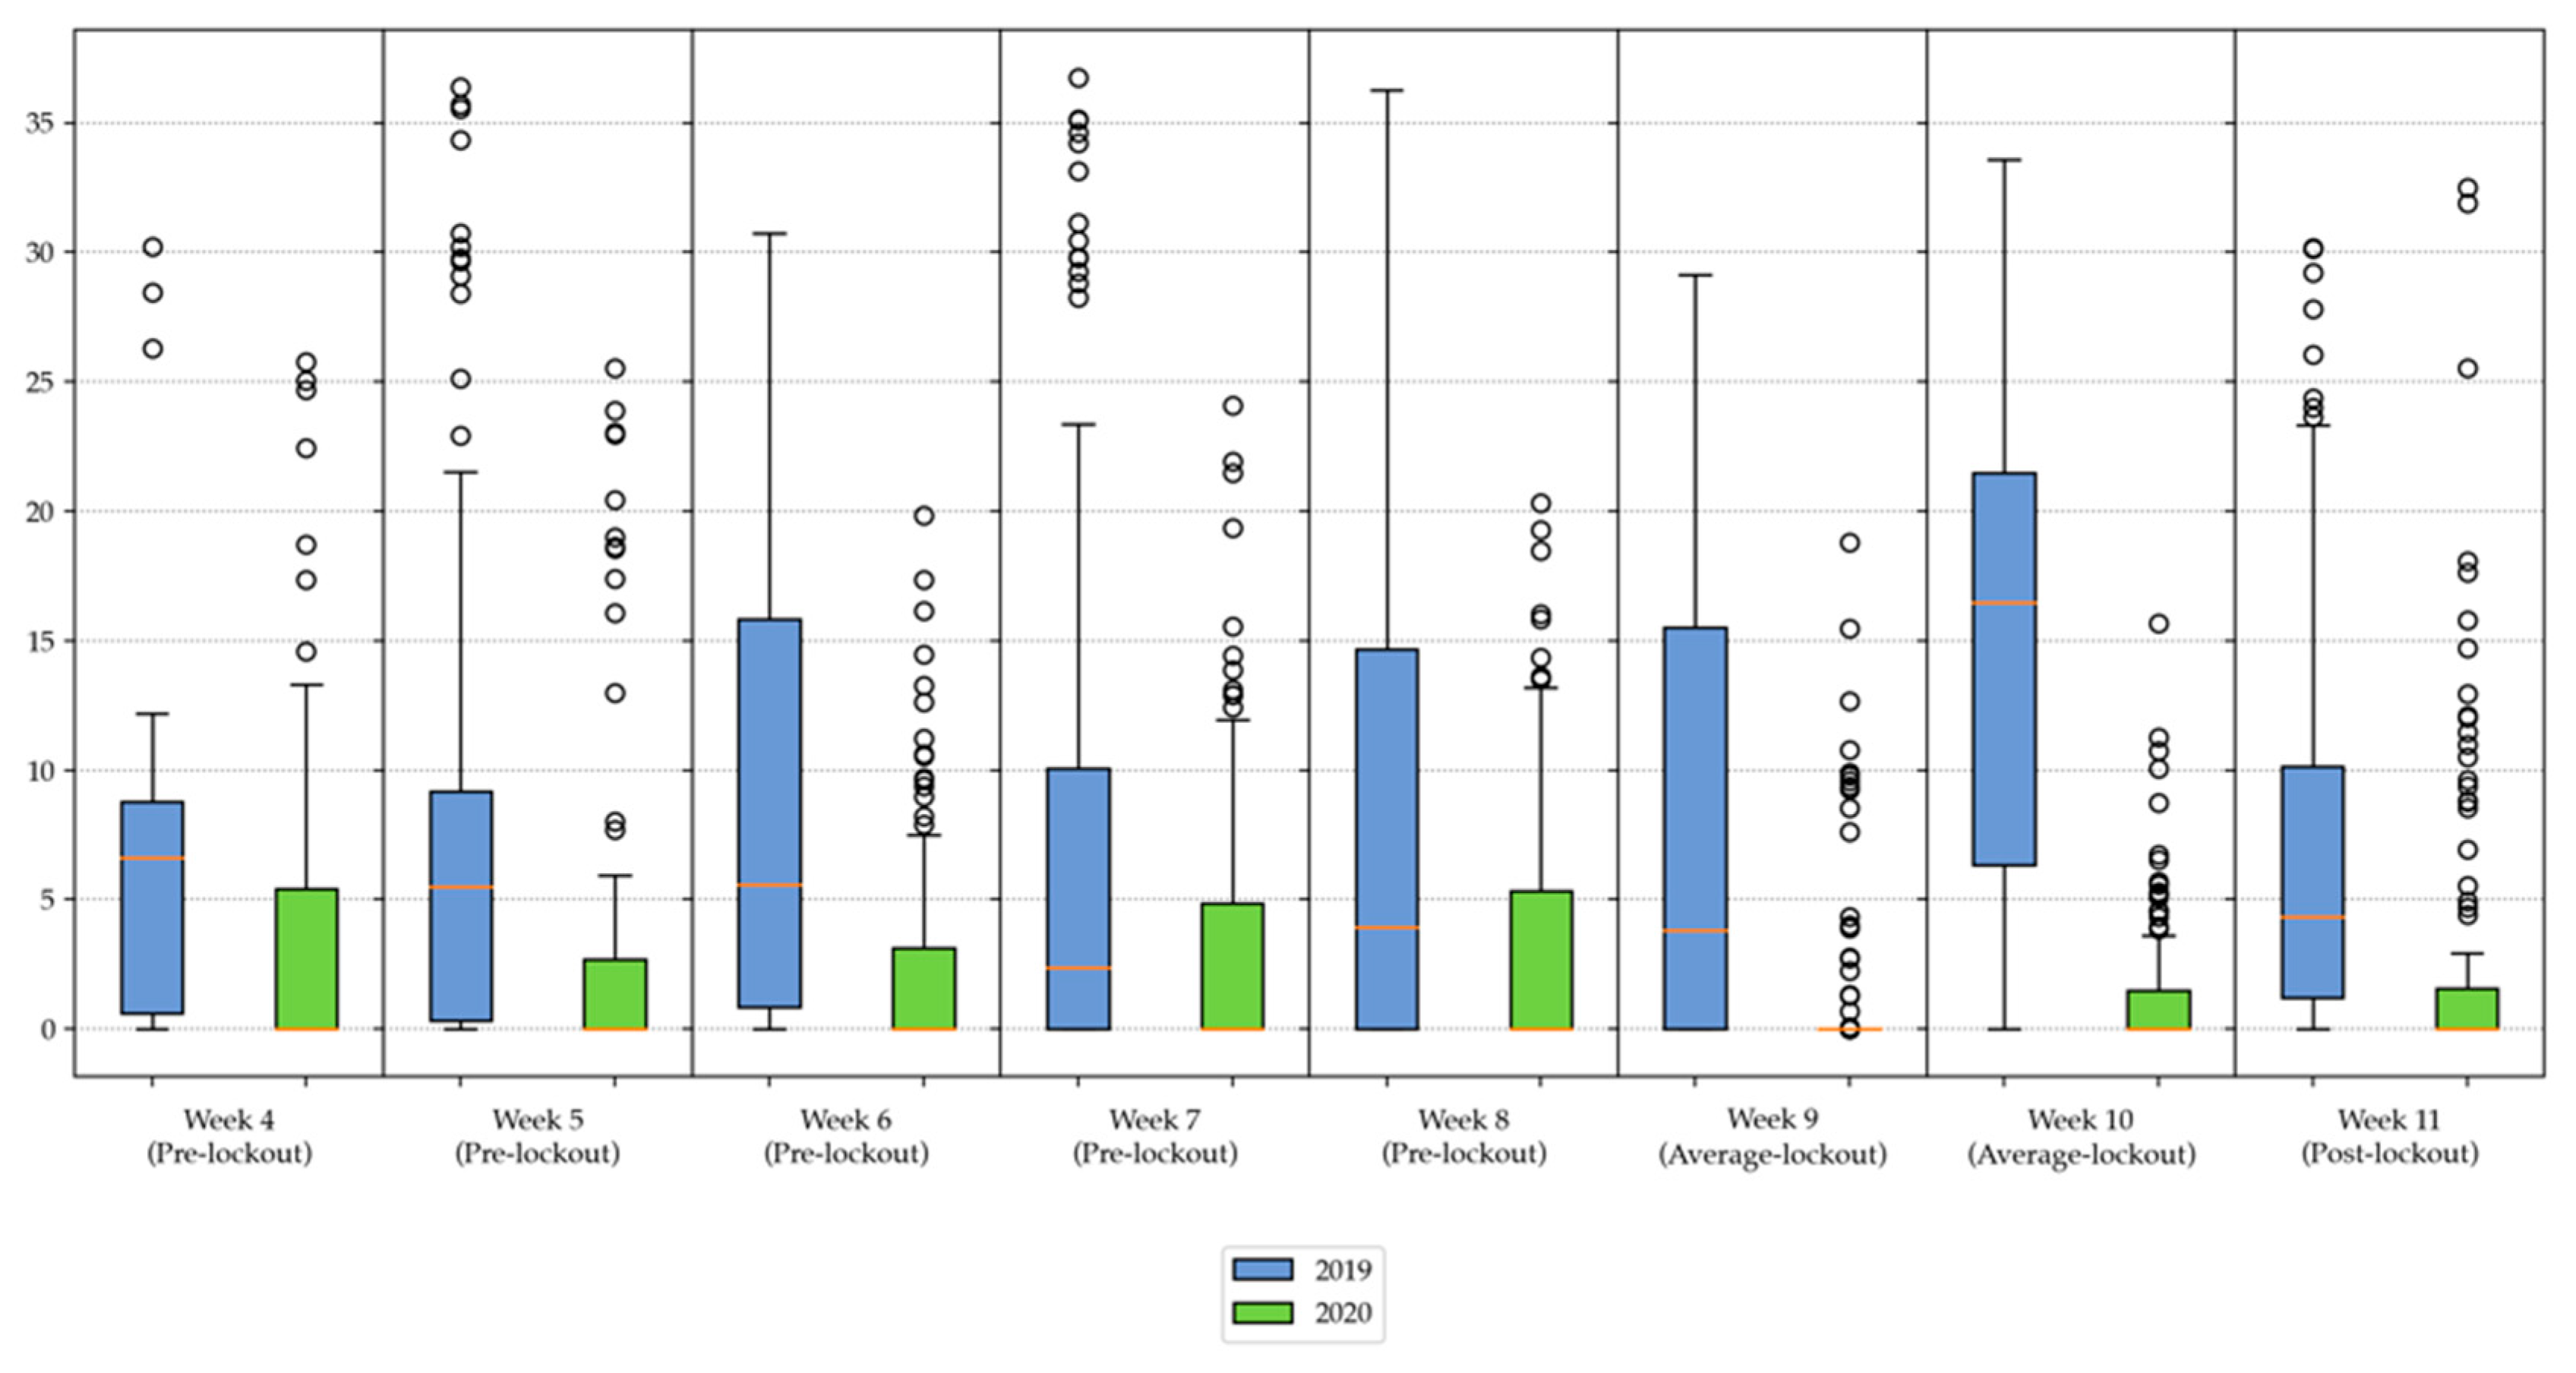
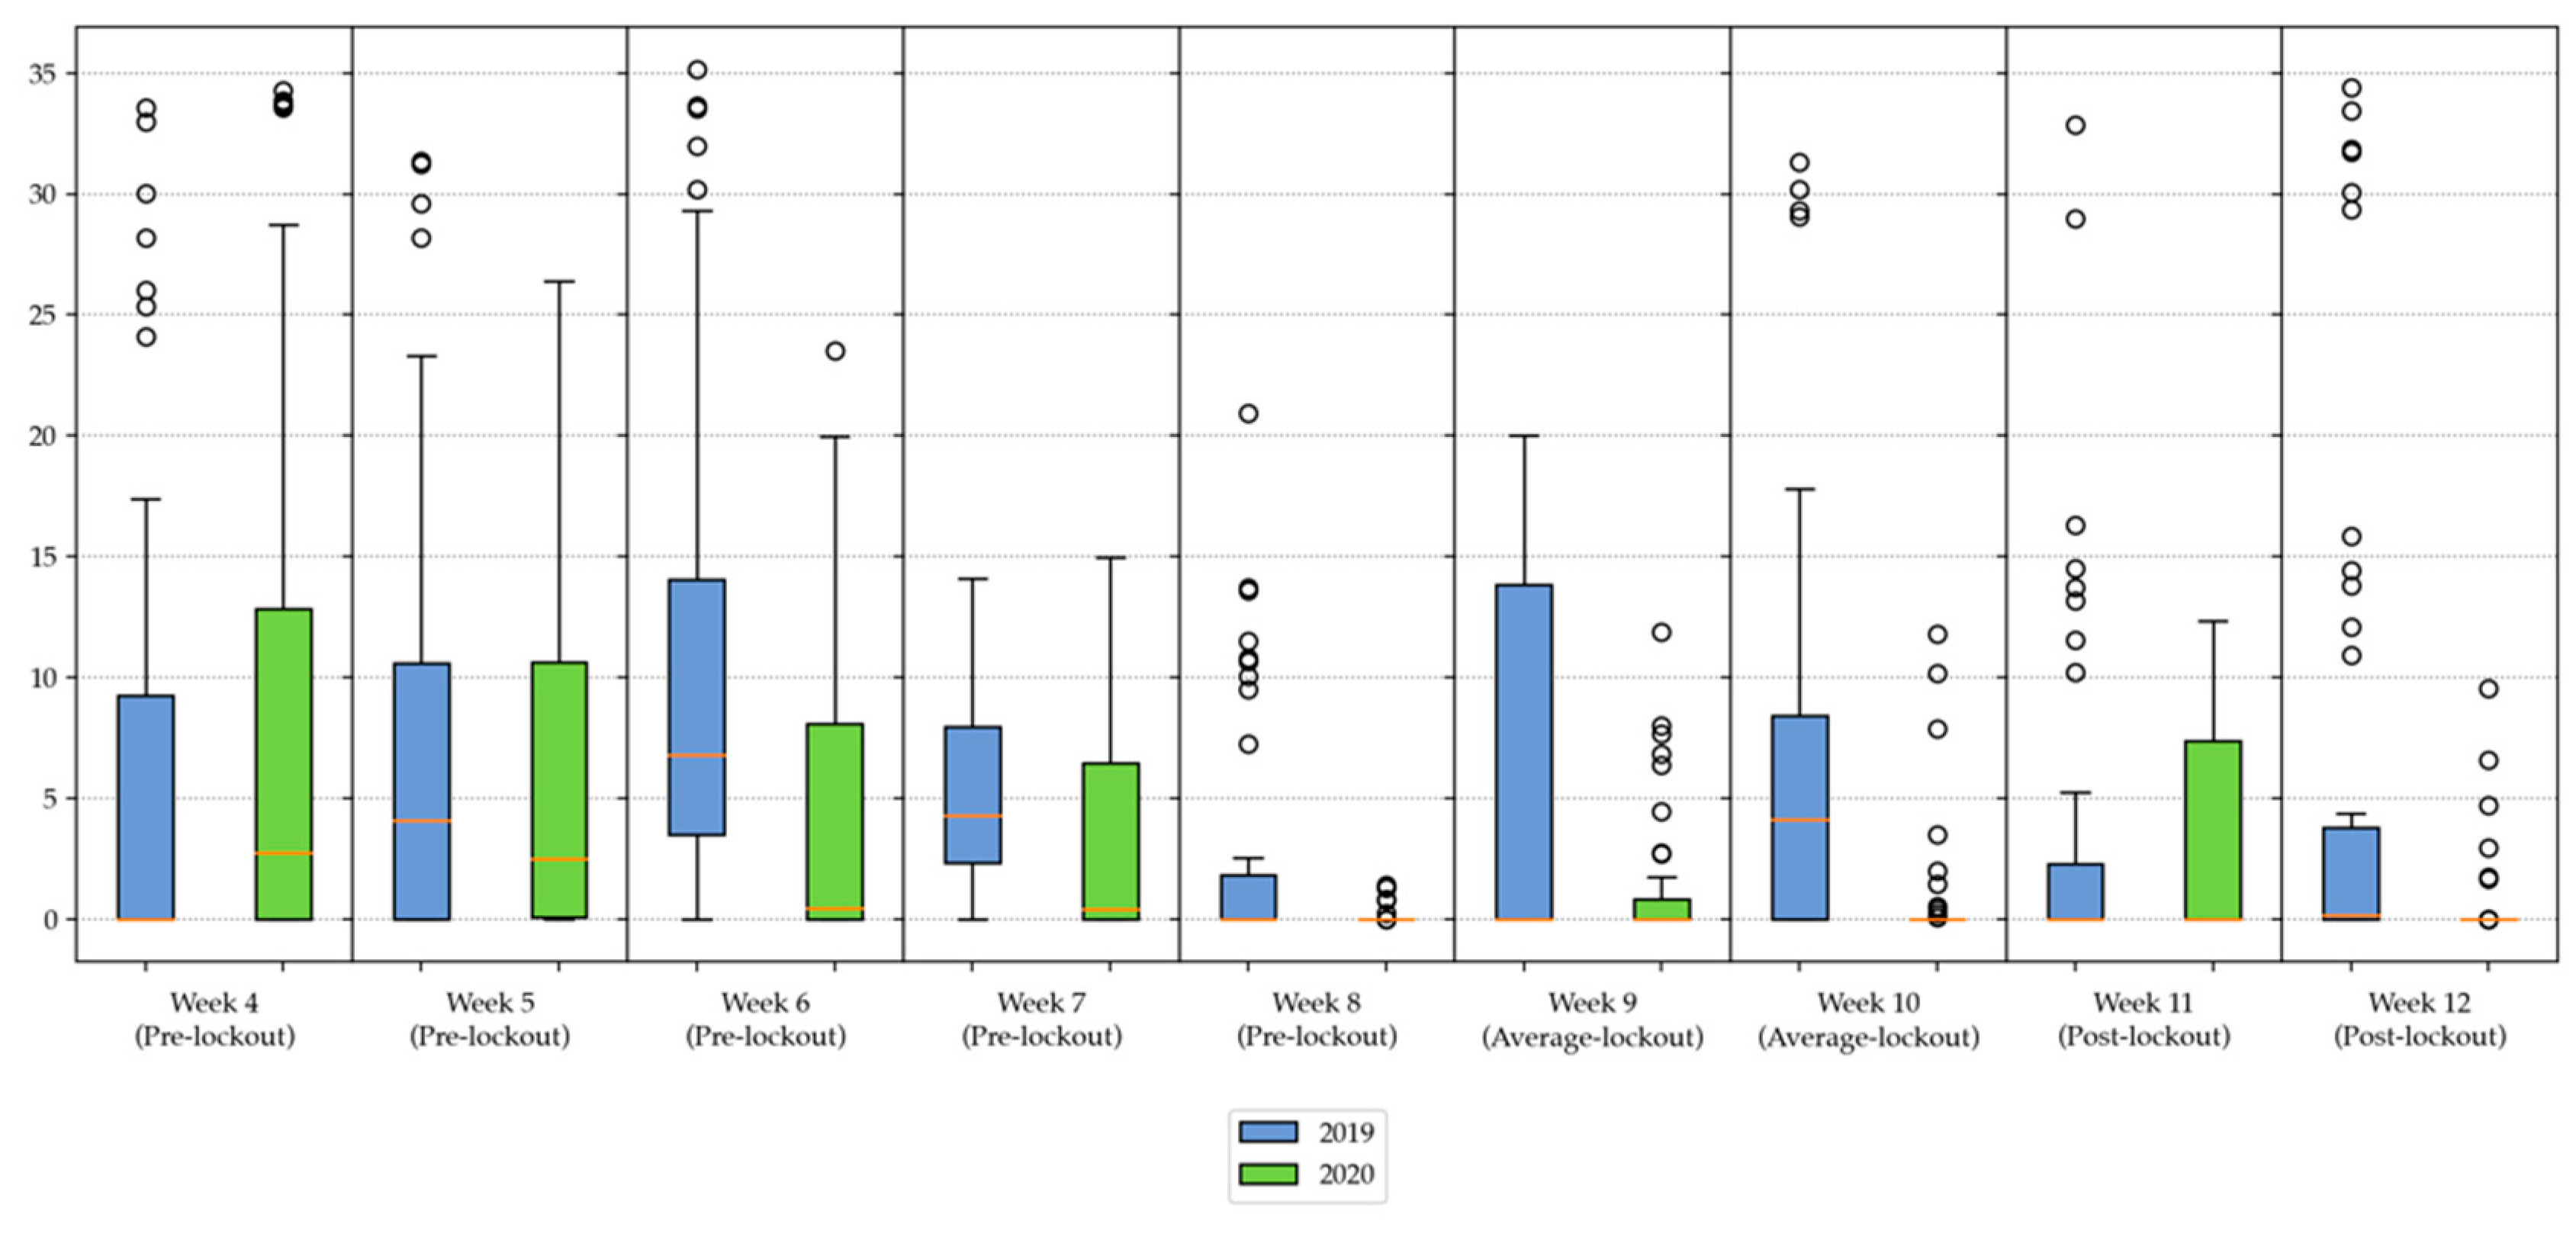
4.2. Statistical Comparison of Pre- and Post-Lockdown Day-ahead Market Prices
To understand the effects of the COVID-19 lockdown, a statistical analysis was performed, aiming to compare the different pre and post lockdown MGP prices distributions.
Figure 13 and
Figure 14 show the boxplots of the relative deviation from the mean of pre-lockdown market prices
, in order to perform a diff-in-diff analysis.
the observed hourly PUN prices
were aggregated in sets of observed prices per each week of the reference year, for days between Monday and Friday (weekdays), represented by the sets
. Then, sets of their relative differences (in percentage) from the pre-lockdown mean price
were computed using (1), where the pre-lockdown mean price
was calculated as in (2).
The same aggregation was performed for weekend days (Saturday and Sunday), obtaining the sets . These sets normalized the observed market prices concerning the average prices observed in the month before. In this way, it was possible to compare the normalized observables in pre- and post-lockdown times, and to add a comparison with the behavior of observed prices in 2019.
The results of the performed analysis are shown as weekly boxplots, for weekdays and weekend days, respectively and both the year 2019 and 2020, for the sake of comparison. The figures show how the normalized prices started to drop after the lockdown (from week 12). In particular, a strong decrease was observed in the median and quartiles, for both weekdays and weekend days. The median weekday prices dropped about 40% during week 13, whereas the median drop of weekend prices (approx. 50%) was observed during the weekend of week 13. Besides, the boxplot relative to week 15 shows that 25% of the observed weekend days prices were below 70% of the pre-lockdown average. All the highlighted observations were not present in the same period of 2019.
4.3. Italian Day-ahead Market Prices during the COVID-19 Outbreak
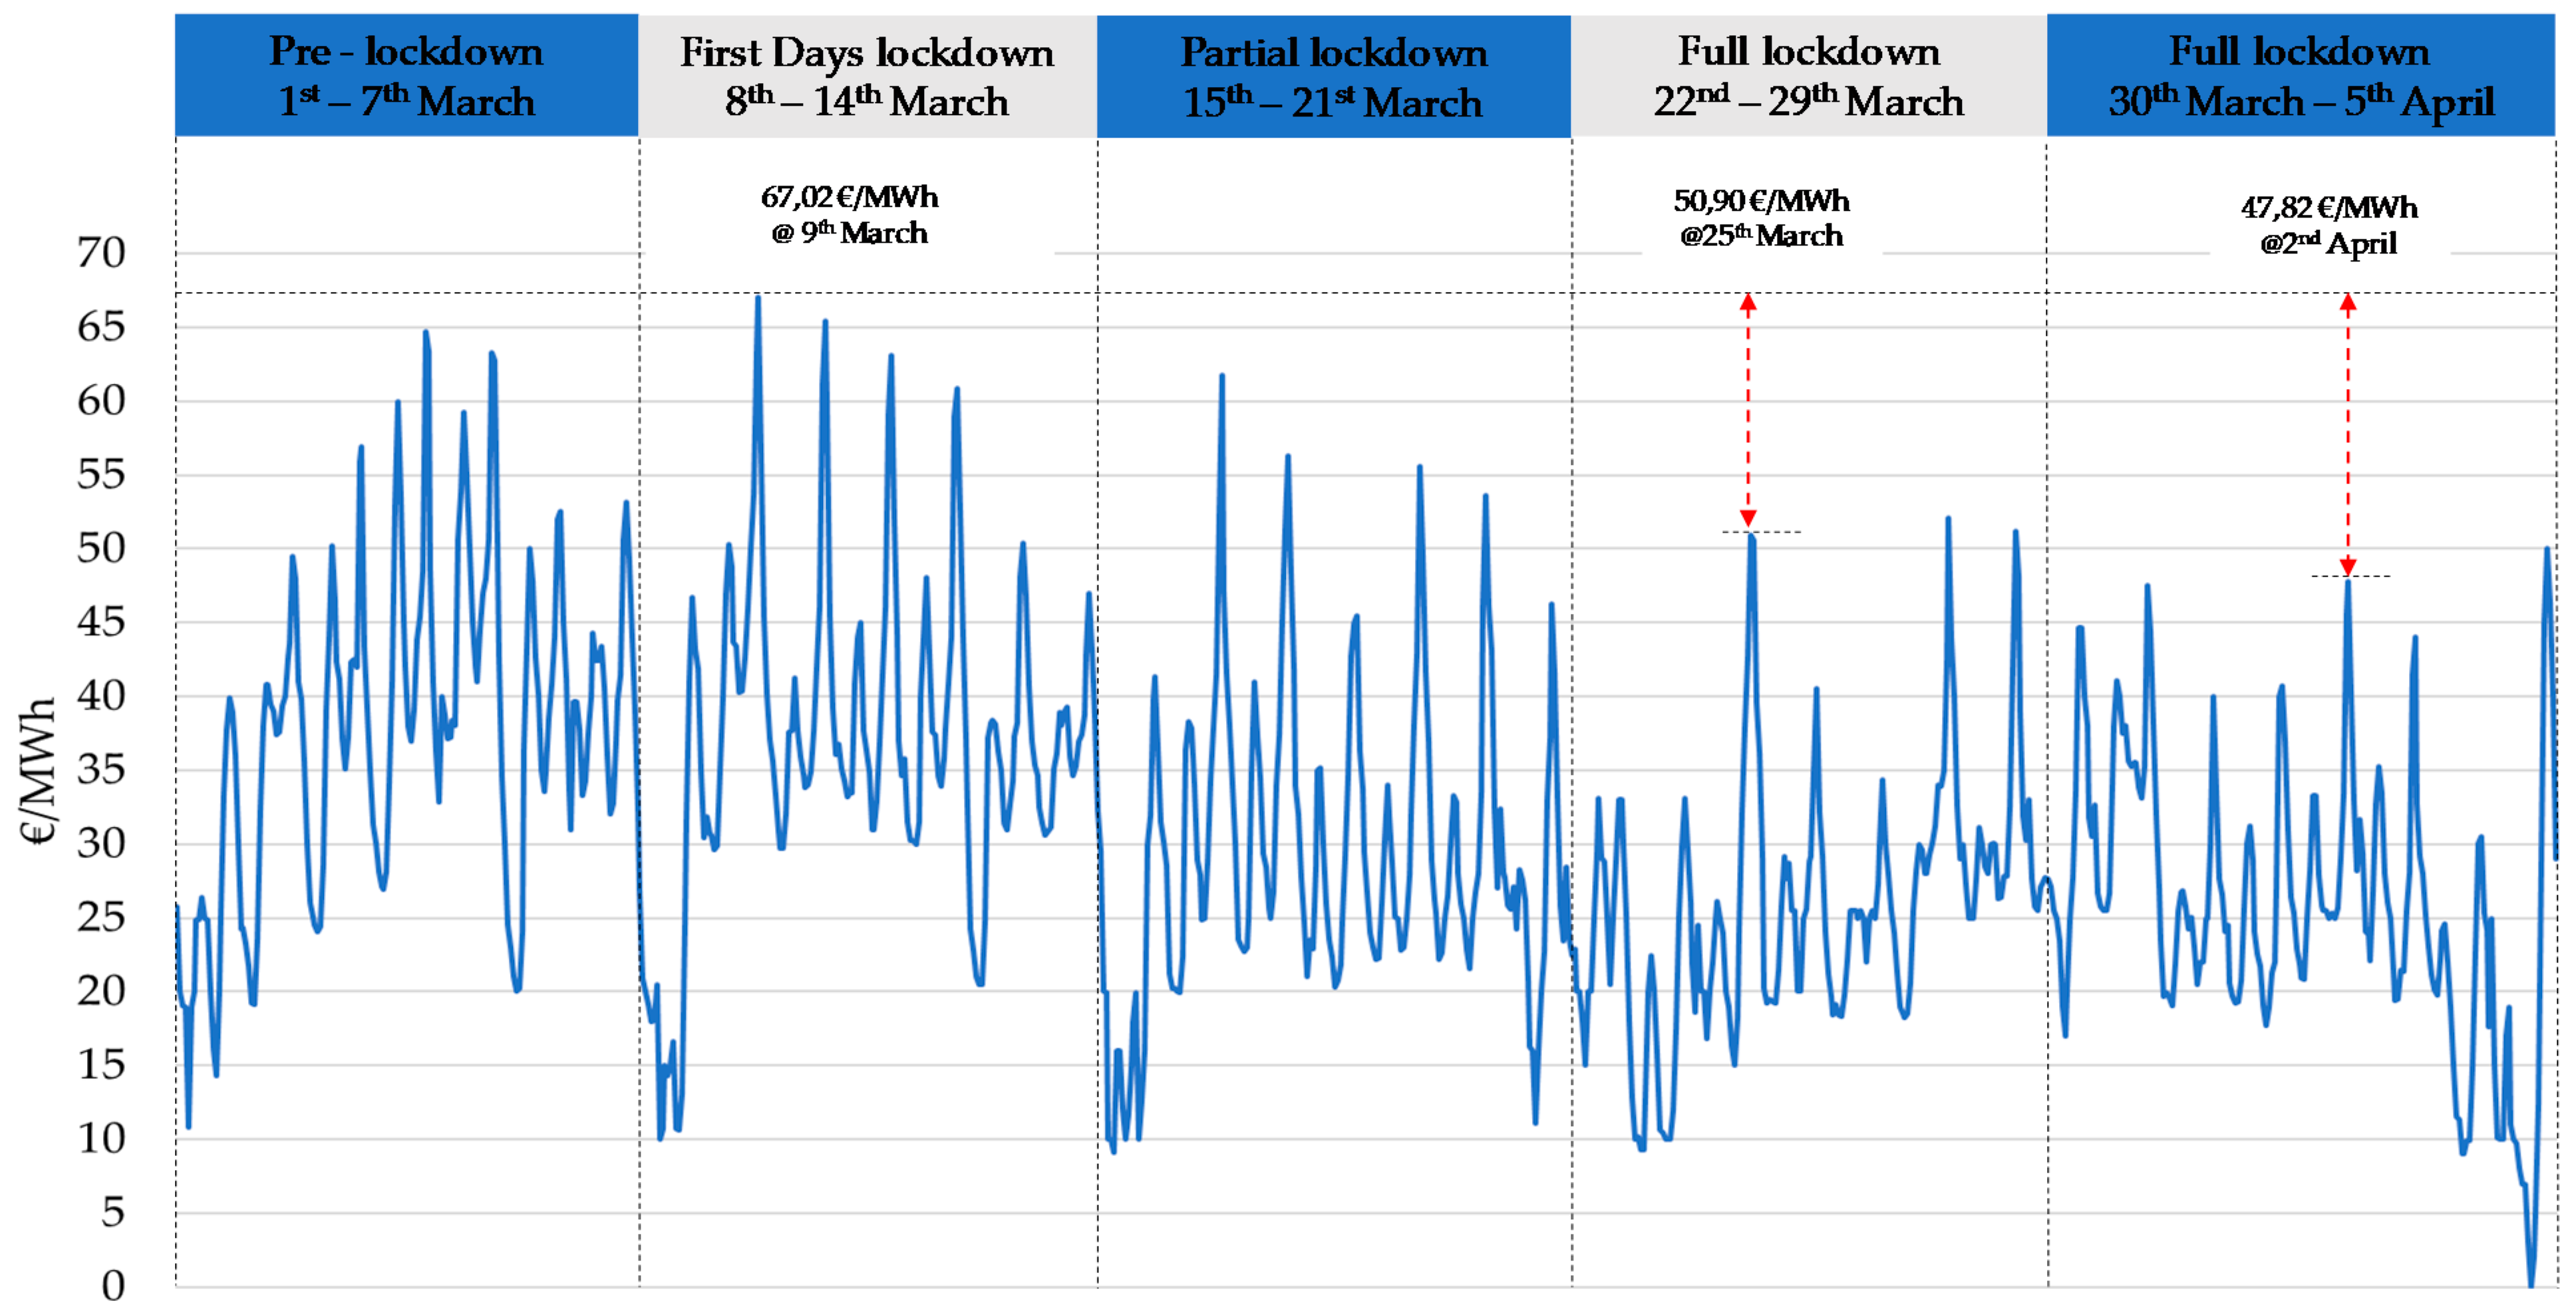
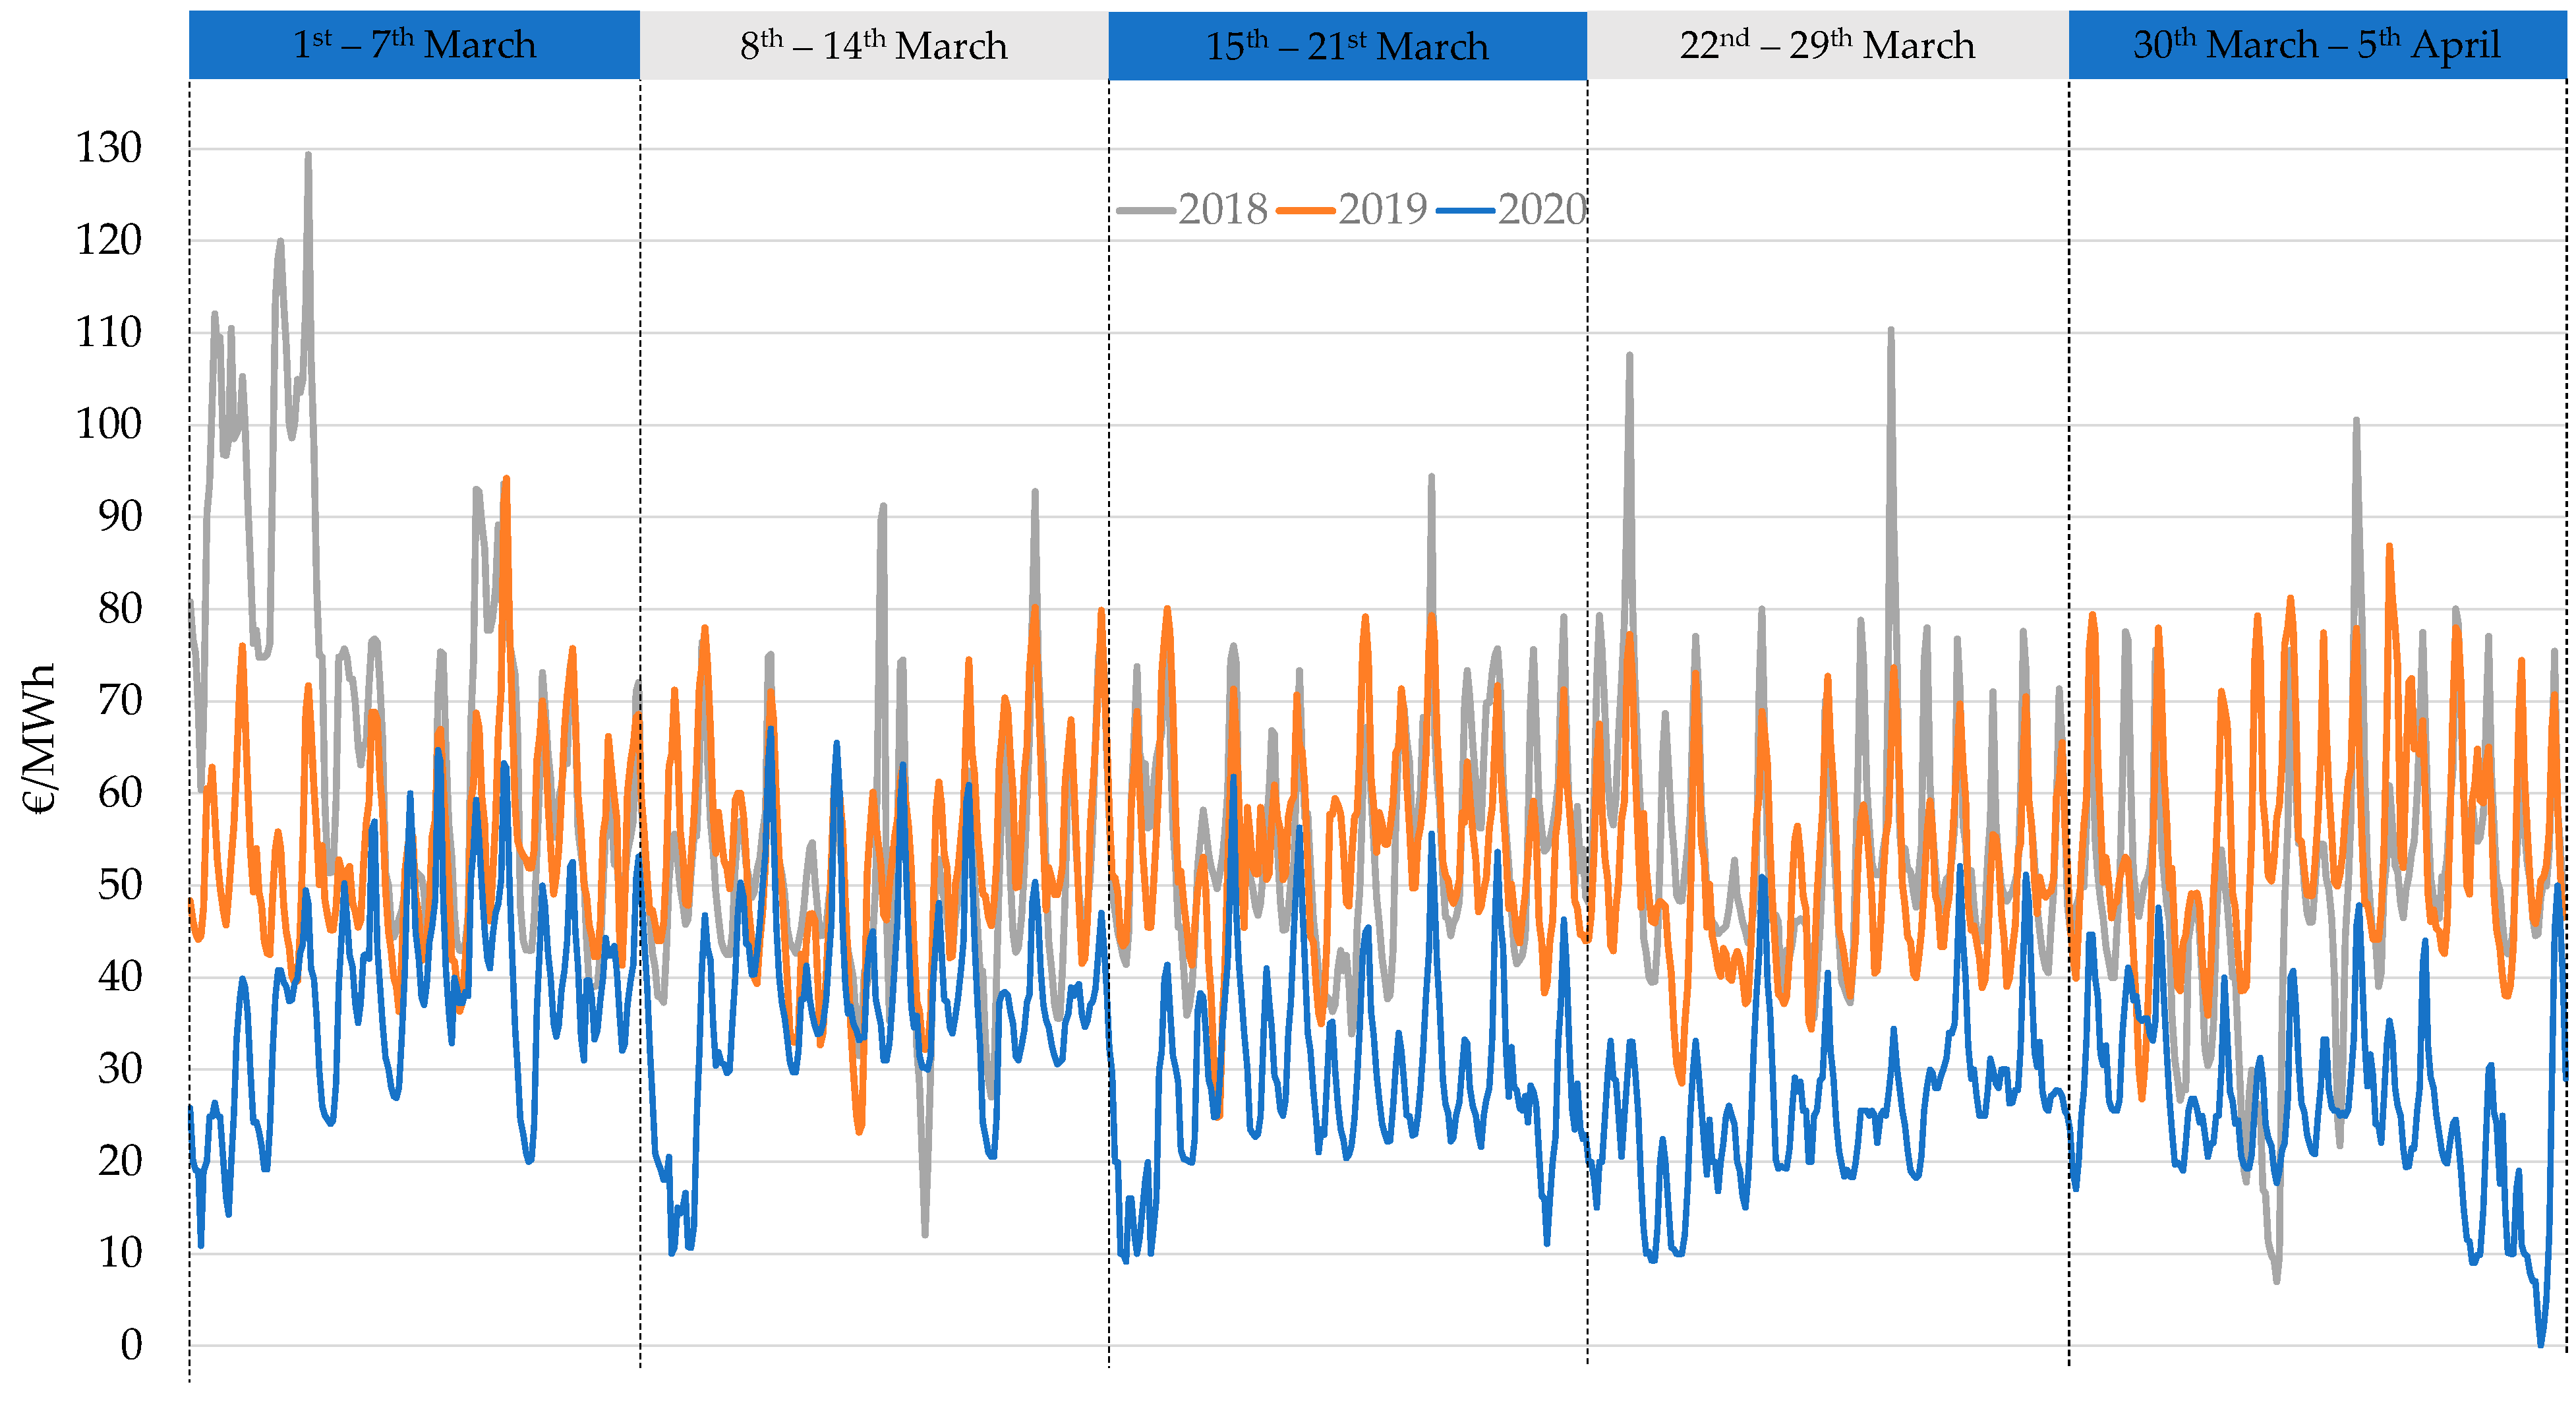
During the COVID-19 outbreak, the Italian PUN price steeply decreased in both peak and off-peak hours (
Figure 15). In particular, the daily peak registered on the 23rd of march displayed an average PUN reduction by 37% and a decrease of 24% of the peak price with respect of the second week of the same month, updating the negative historical record to 26.3 €/MWh [
18]. In
Figure 16 and
Figure 17 the average PUN in comparison with previous years is shown. In particular, in
Figure 17, throughout the March period, the average PUN reaches peaks about 37% less than in previous years.
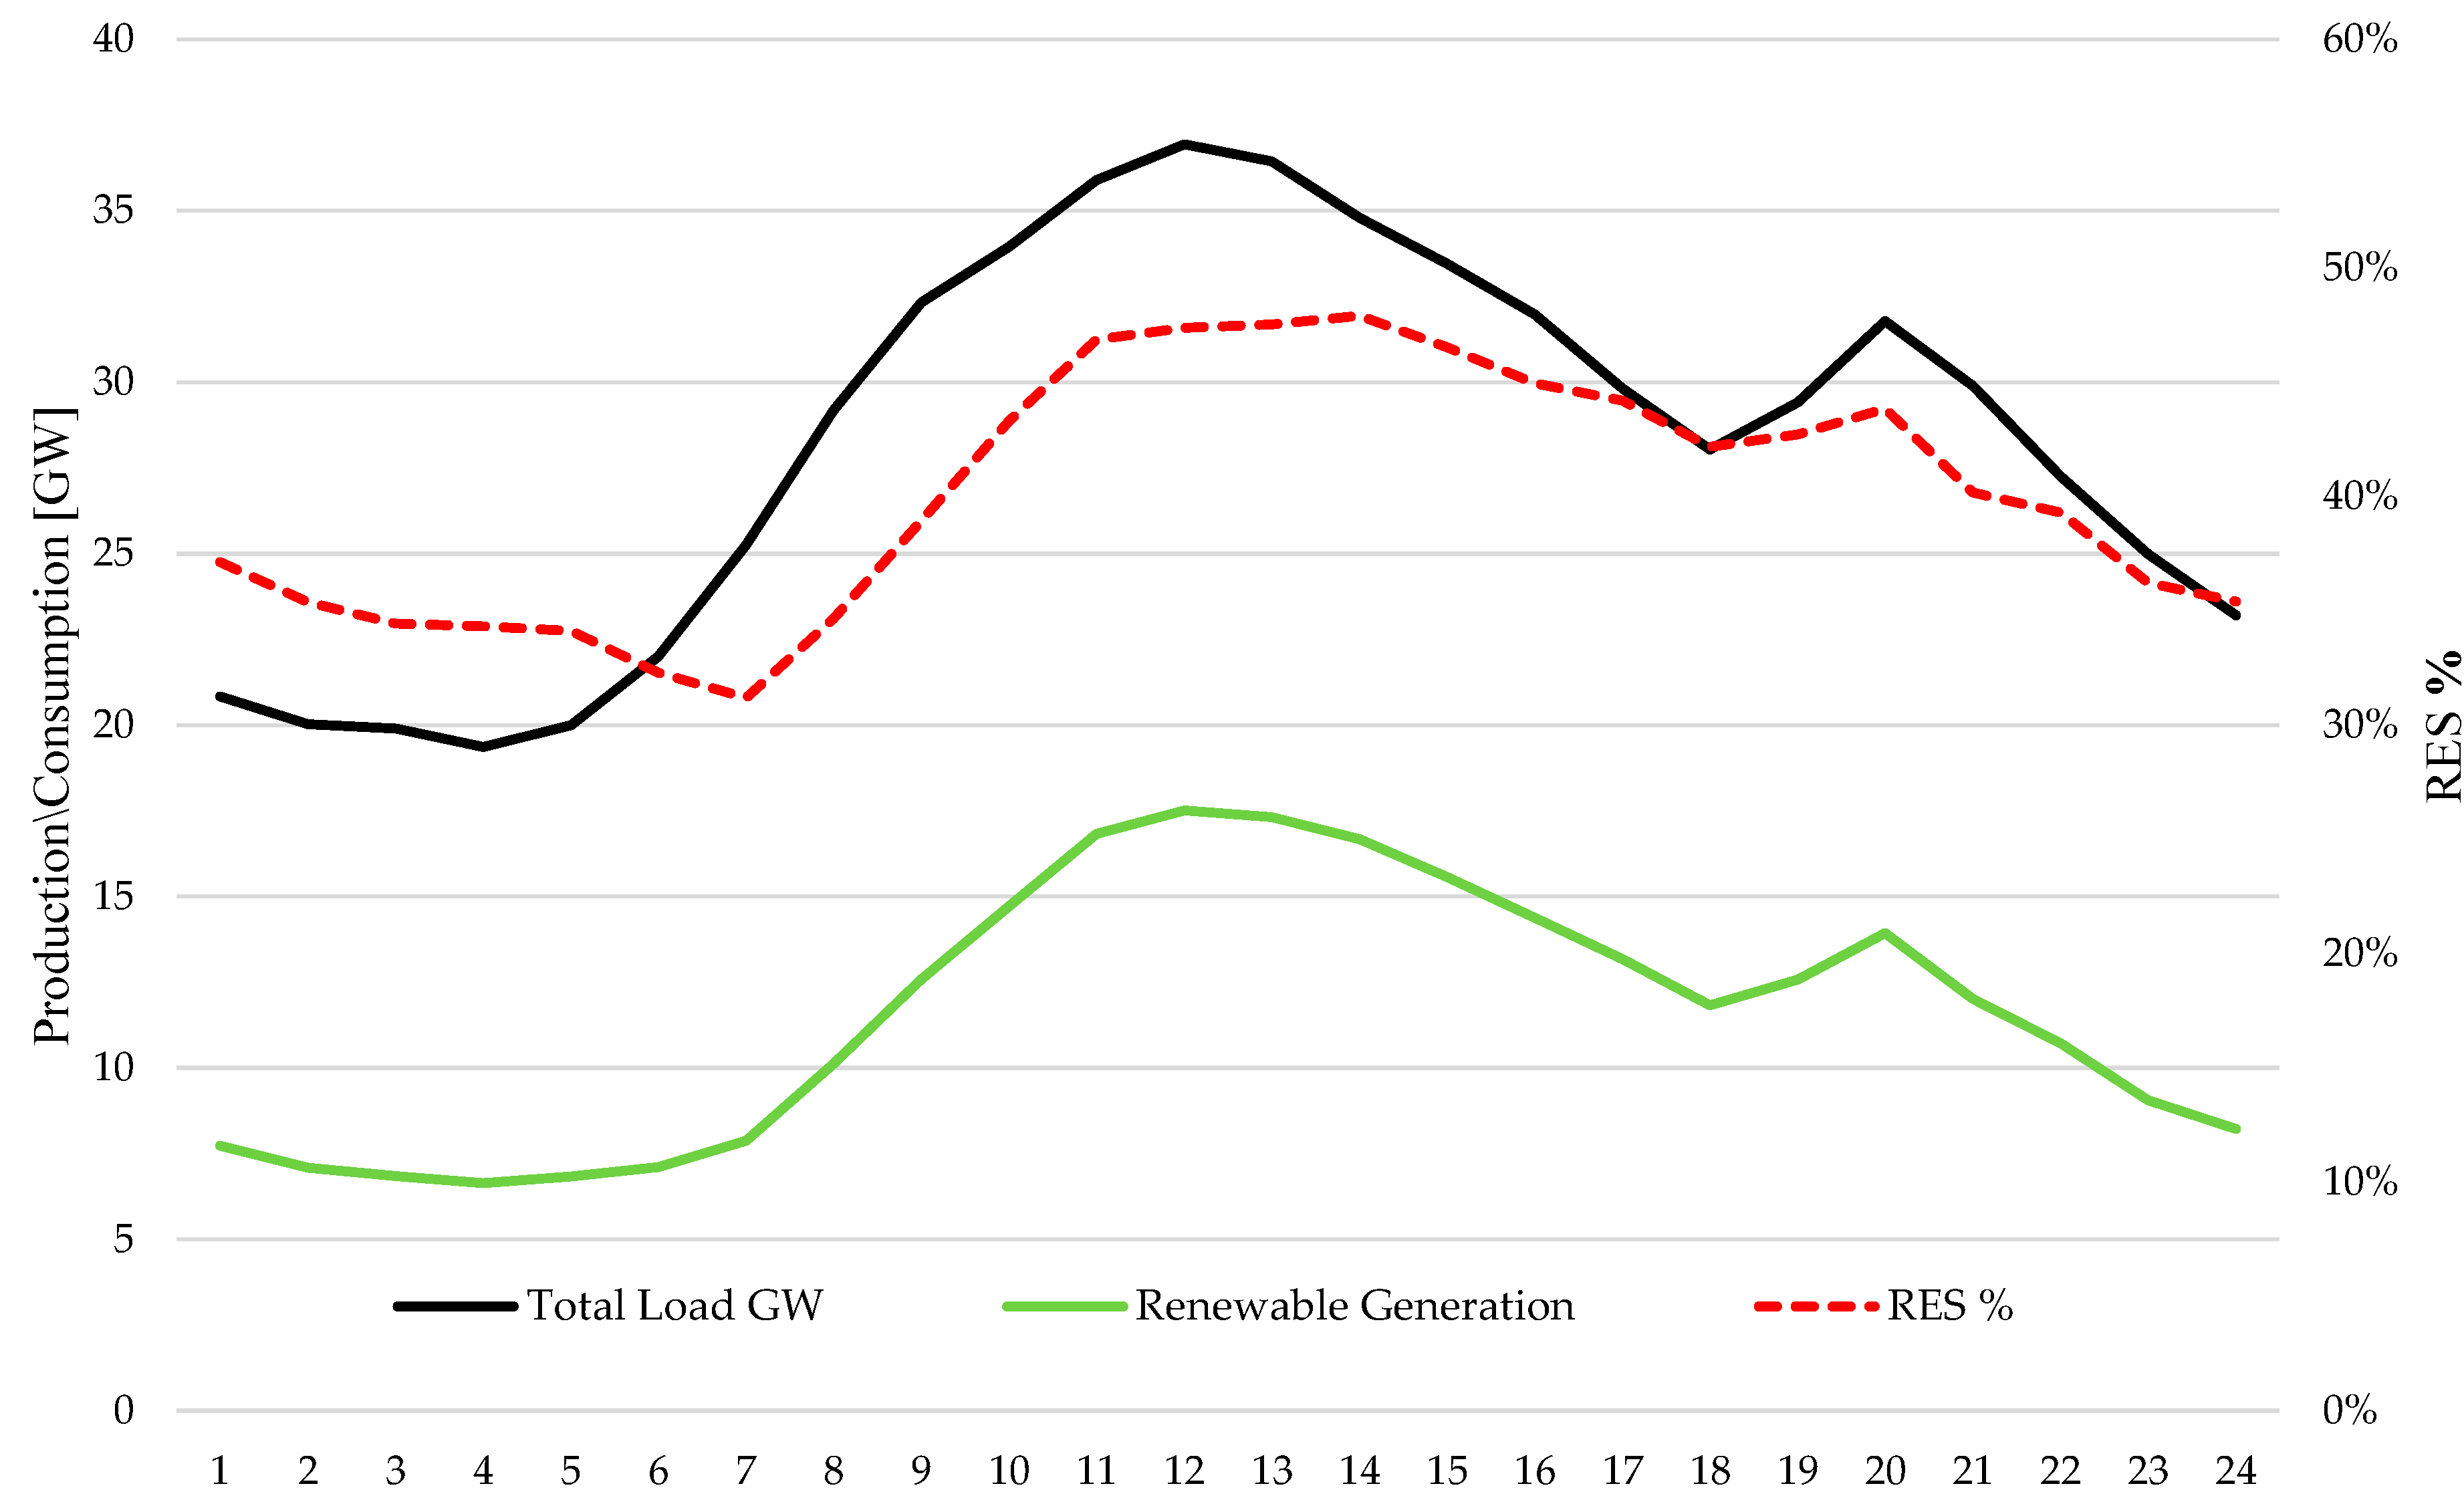
This behavior is due to low consumptions and high RES production, as depicted for example in
Figure 18, for the 23rd March 2020 when the hourly production from RES in the middle hours overcomes the 40% of the total consumption.
Figure 19 shows that the minimum values of the prices have not been modified compared to the maximum values, which instead have larger fluctuations.
This situation hits the electricity-producing industry in two ways. First of all, the daily needed generation was cut about 40%, cutting out the high marginal costs power plants shown in
Figure 12. Second, the low PUN prices highly decreased the profit for all the generation sector. This second issue can be overcome with the market dynamics since the competition will likely raise the bids placed by the thermal generation facilities in the ancillary services market instead of the day-ahead market. The first one, on the other hand, has a difficult solution and will likely cause the high marginal cost generation facilities to shut down their production, possibly leading to decreased flexibility of the power system in the short and middle term. For this reason, it will be interesting to evaluate the effects of this phenomenon, which will provide useful insights for enhancing power systems resilience towards exogenous factors.
Besides, the price difference among the different market zones highly decreased during the lockdown weeks, as shown in
Figure 20 and
Figure 21. This is due to a strong reduction in contingencies with the unloading of the power system consequently to demand reduction. It is easy to notice how their standard deviations are not zero or anyway very small (<1 €) only in sporadic events during the average- and post-lockdown times, thus reducing unfair outcomes in national wholesale markets. The existence of such high price spreads is due to the high demand from the NORTH area and the strong production from the SOUTH area. This led to the violations of some constraints on the power lines and forced the separation of the Italian market into different market areas. There is a strong likelihood that such behavior is determined by the combination of two main factors: low demand and high generation in particular from renewable sources during the middle hour. During the lockdown, however, the reduction of north consumption reflected on the zonal exchanges, strongly reducing contingencies and price splitting among zones, leading to the strong spread reduction observed in the last weeks of
Figure 21.
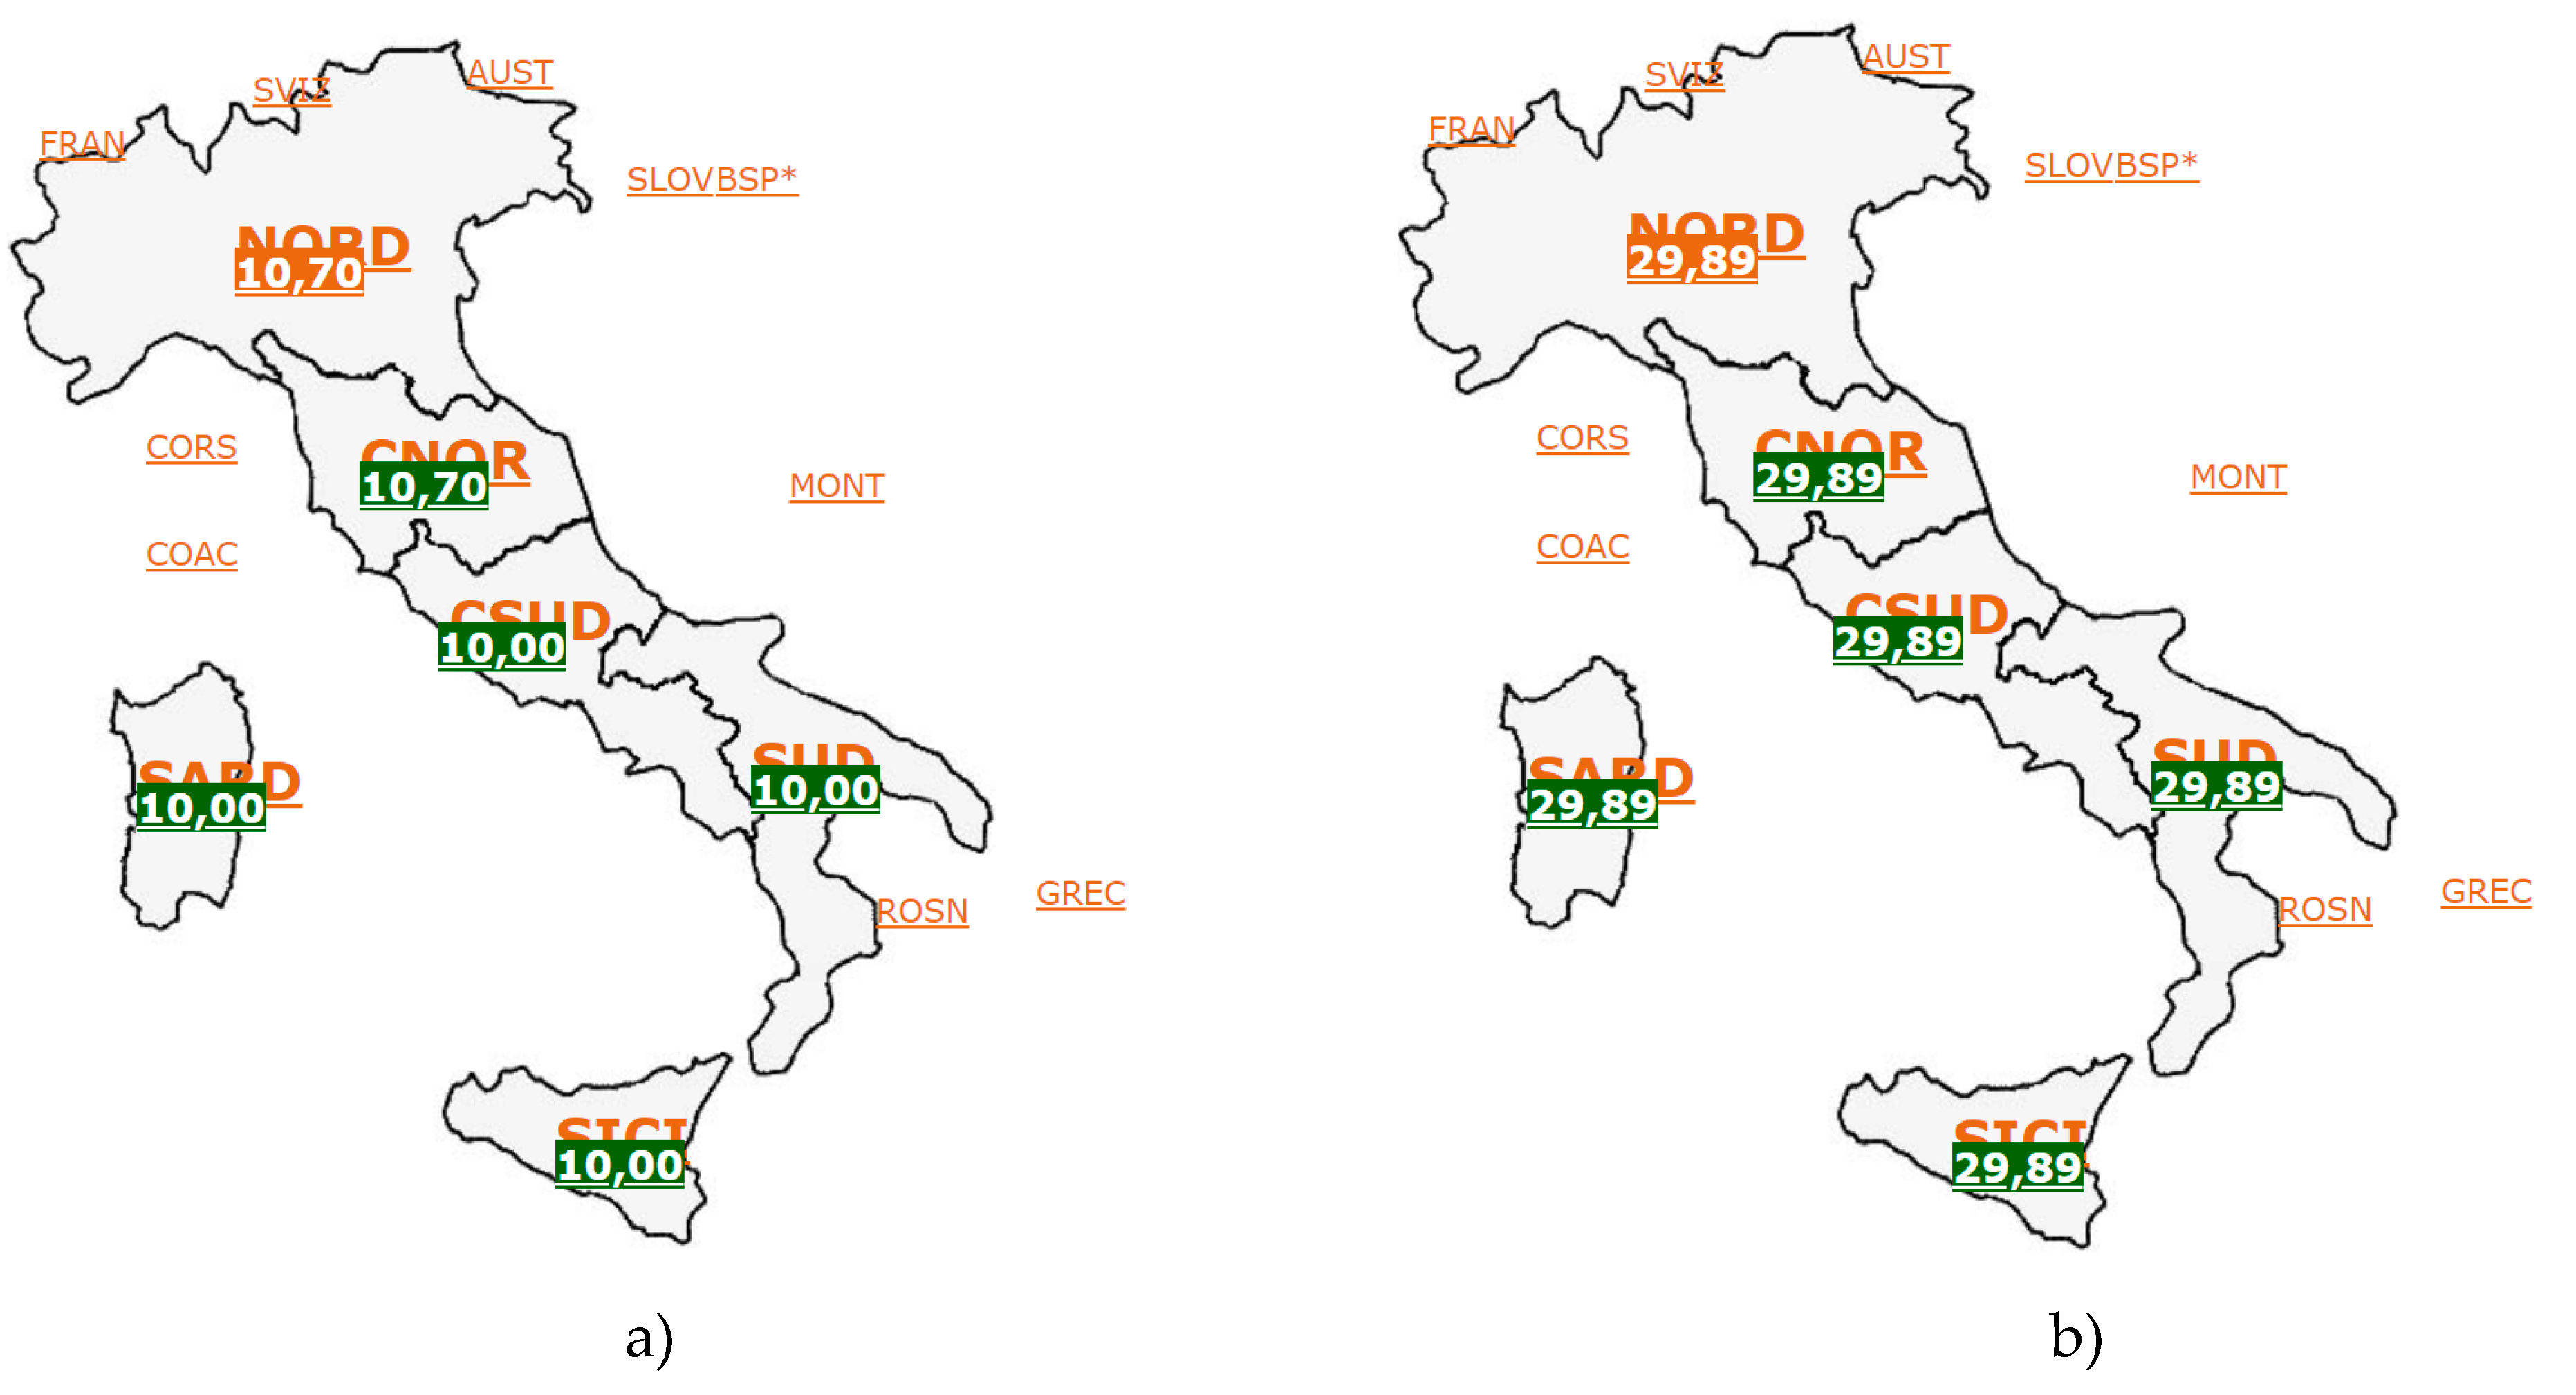
Besides, in
Figure 22 it is shown a representative snapshot of the situation of the 23rd of March, one of the days in which the commonly observed price spread between zonal prices almost disappeared. In particular, sales prices ranged between 10.70 €/MWh, at noon, to 29.89 €/MWh, at 19:00. Such prices turn out to be different since, as described in
Section 4, the hourly clearing price is calculated considering the matching between expected consumption and generation. During day time the large quantity of renewable generation, mostly PV, contributes to the reduction of the market price up to 10.70 €/MWh; in the evening the clearing prices in the market go up to 29.89 €/MWh as a consequence of the selection of the offers of the thermoelectric plant that are selected as marginal units. However, a very interesting aspect is the fact that price has remained unchanged among zones, this denotes that all technical constraints between the zones are satisfied leading therefore to a single price for the whole of Italy. It is possible to observe that the evening prices are identical for all Italy. This means that the technical grid constraints are in for all areas and no price splitting has to occur for removing contingencies. A similar shape is observable in the early hours of the day. In this time, there are slight differences in the price between the NORTH and the SOUTH zone, but these differences are anyway very small if compared to the standard, pre-lockdown ones shown in
Figure 21.
4.4. Italian Ancillary Services Costs during the COVID-19 Outbreak
Ancillary services are crucial for system operation security and reliability. In Italy, these services are provided by the dispatching services market (MSD). MSD supplies the resources necessary for the system management and control (resolution of intrazonal congestion, creation of energy reserve, real-time balancing). It is split into two markets: the MSD “ex-ante” for forward contracts and the balancing market (MB) for the intraday trading of power reserves. Power reserve trading takes place in three ways: frequency-controlled reserve (FCR) is the most lucrative, but also the most technically demanding since the required power reserves must be set up within seconds. The automatic frequency restoration reserve (aFRR), in Italy still known as “secondary reserve energy”, is slightly slower and must be set up 15 min after the TSO’s activation command. The third option is the replacement reserve (RR), known as “other services”, used for the management of possible congestions; the preset power must be completely available 15 min after the activation command from the TSO.
MSD ex-ante follows the results of MGP by preparing the power reserves for the next day. Part of the reserves accepted by the TSO is delivered on the MB. The MSD prices are highly dependent on the demand/offer ratio and it is easy to observe high price peaks in the presence of high RES fluctuations. Moreover, the offer of flexibility is highly related to the availability of the ramping capability of thermal power plants. Assuming that few thermal generators are available for offering ancillary services, the demand/offer ratio is going to rise. Thus, if few thermal generating units are kept online during the daytime, (the same period in which much RES fluctuations are observed), it will be easier to observe market price spikes [
19].
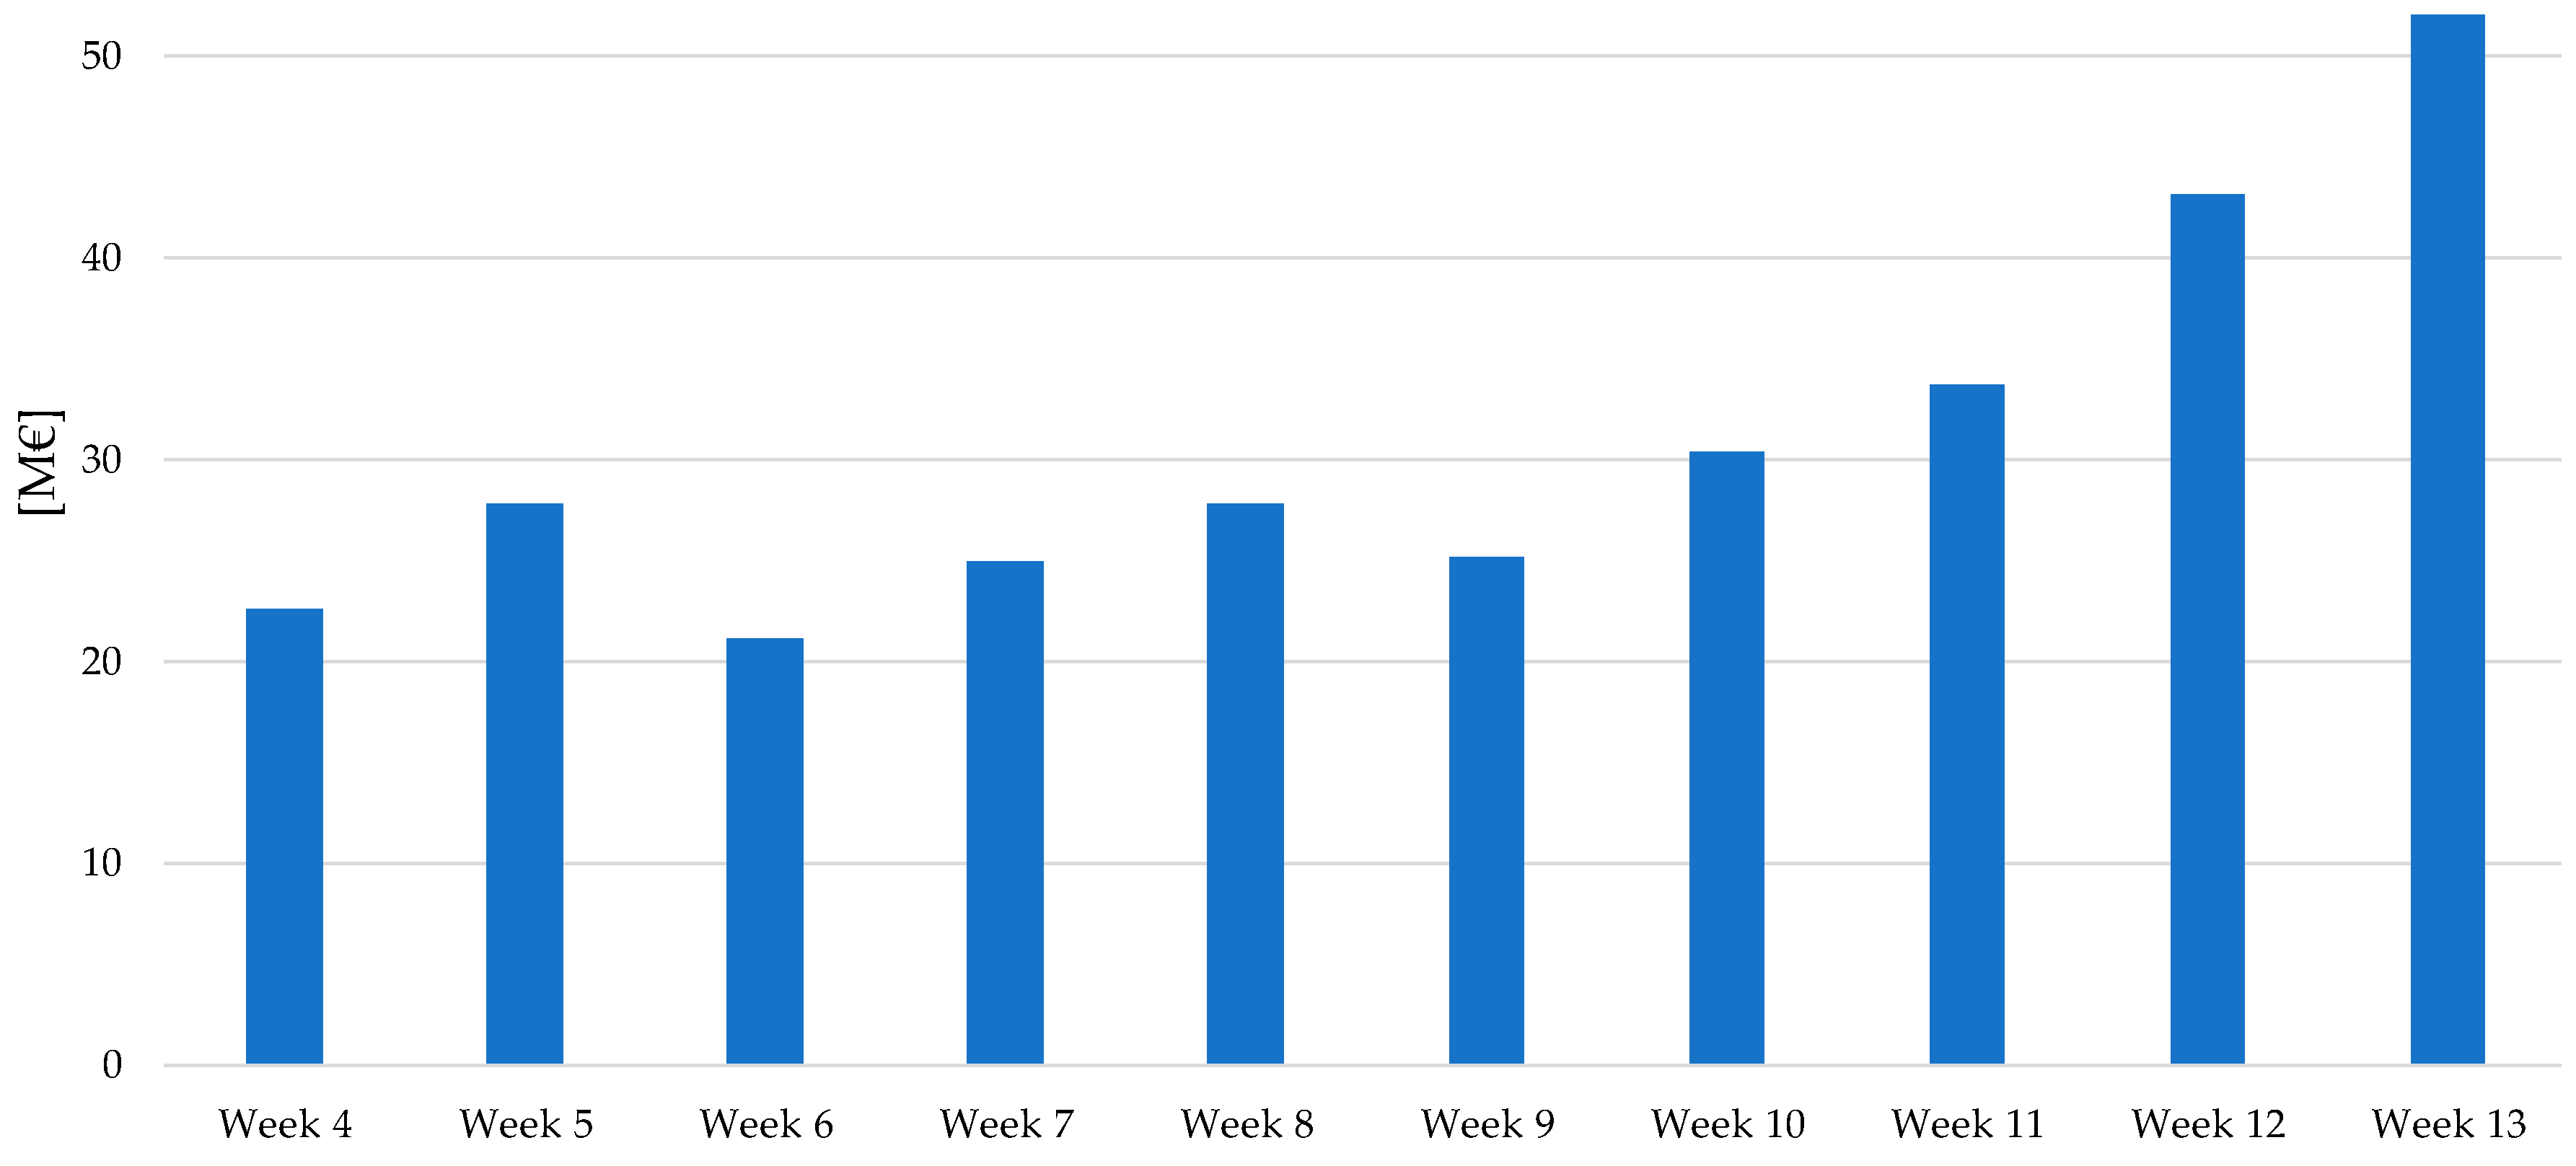
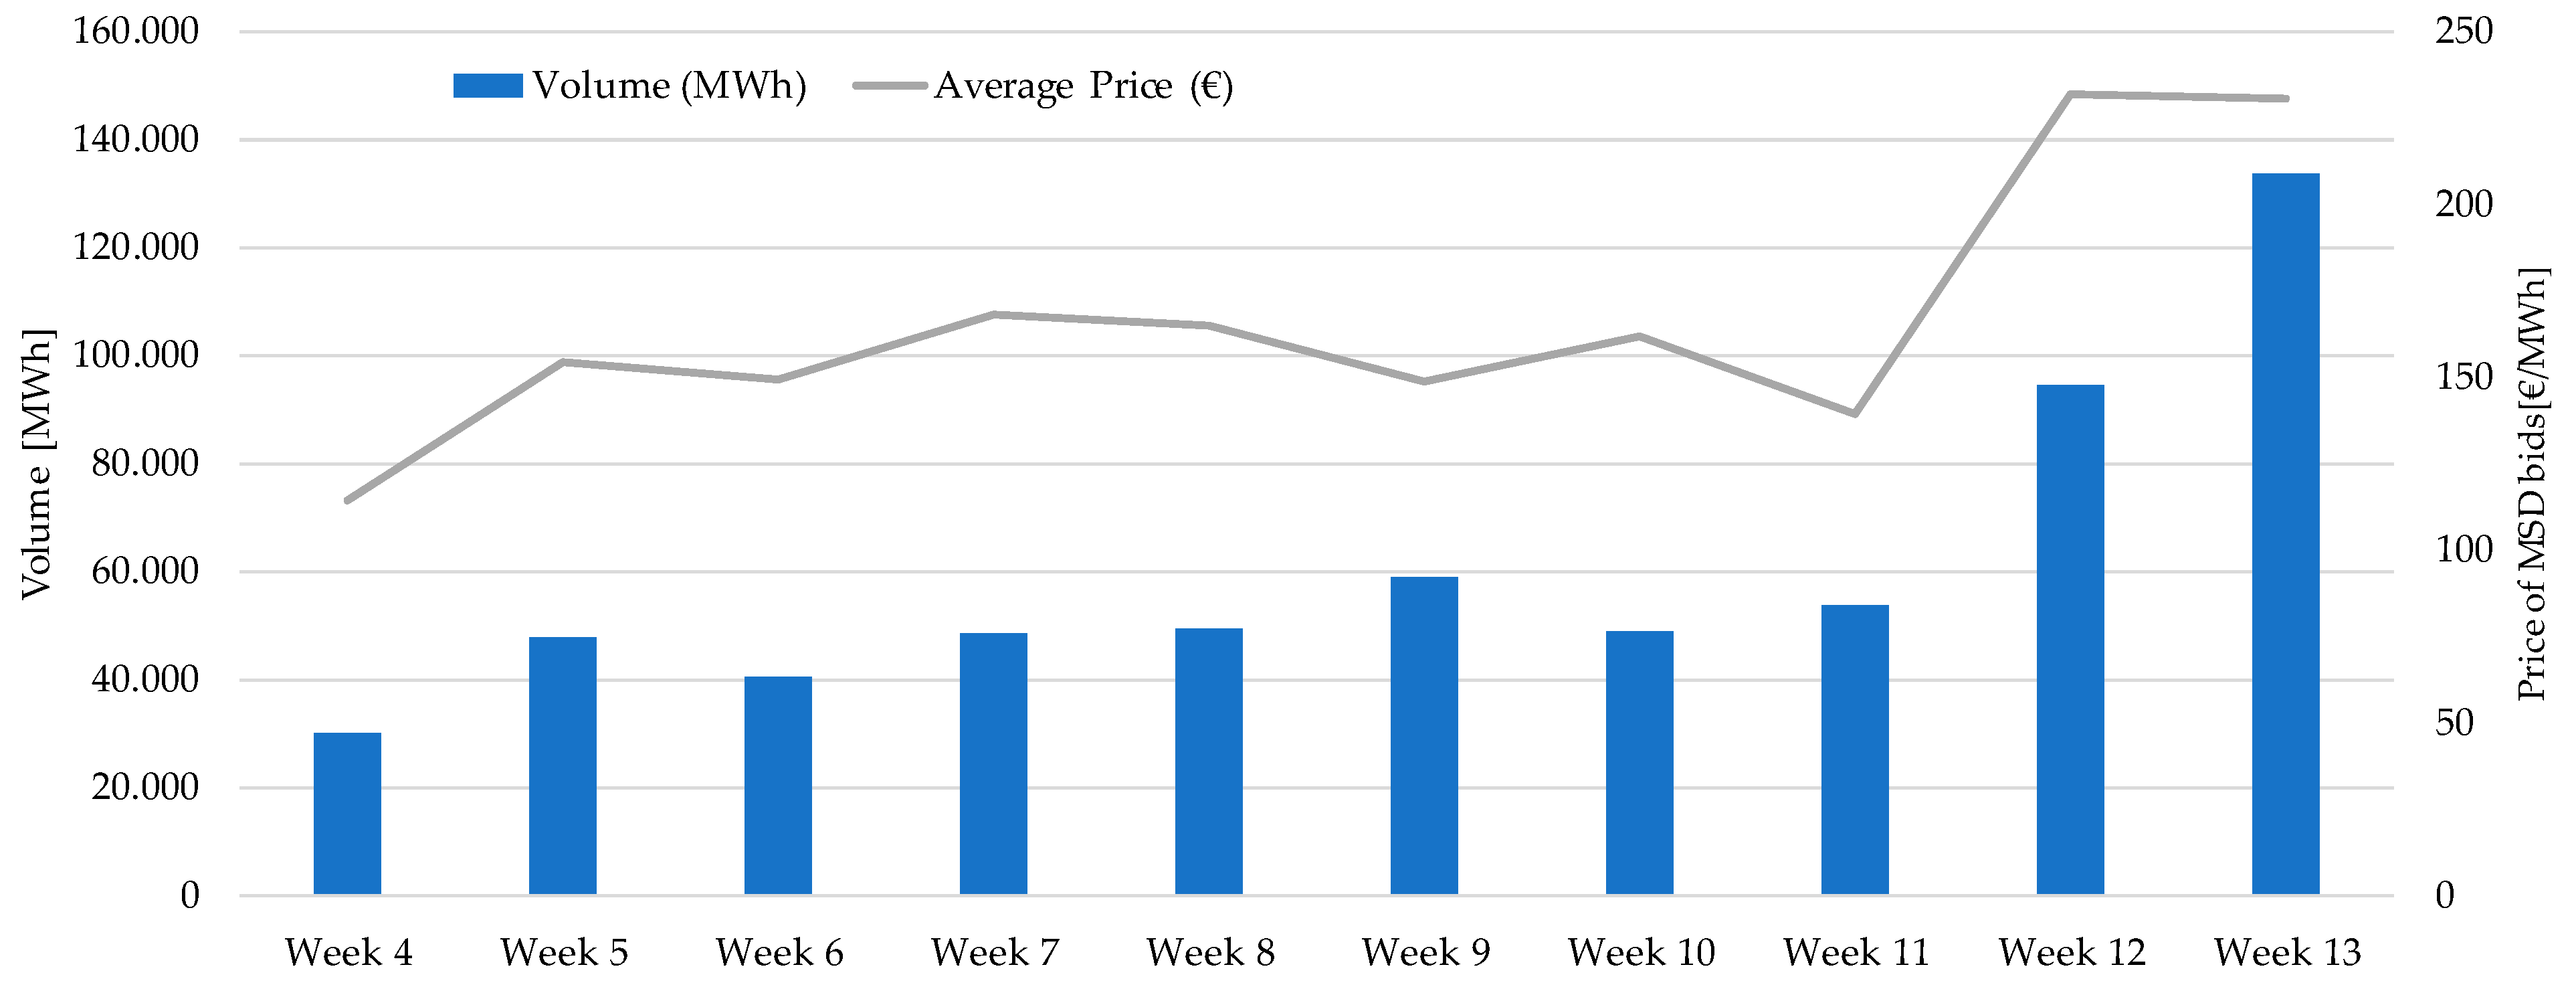
In
Figure 23, the weekly total cost sustained by the TSO for ancillary services is illustrated. As expected, the MSD costs highly raised from the COVID-2019 lockdown.
In particular, a considerable increment of approx. 100% of the costs is registered between week 9 and week 13 (full lockdown started on week 11, partial lockdown was in place from week 9).
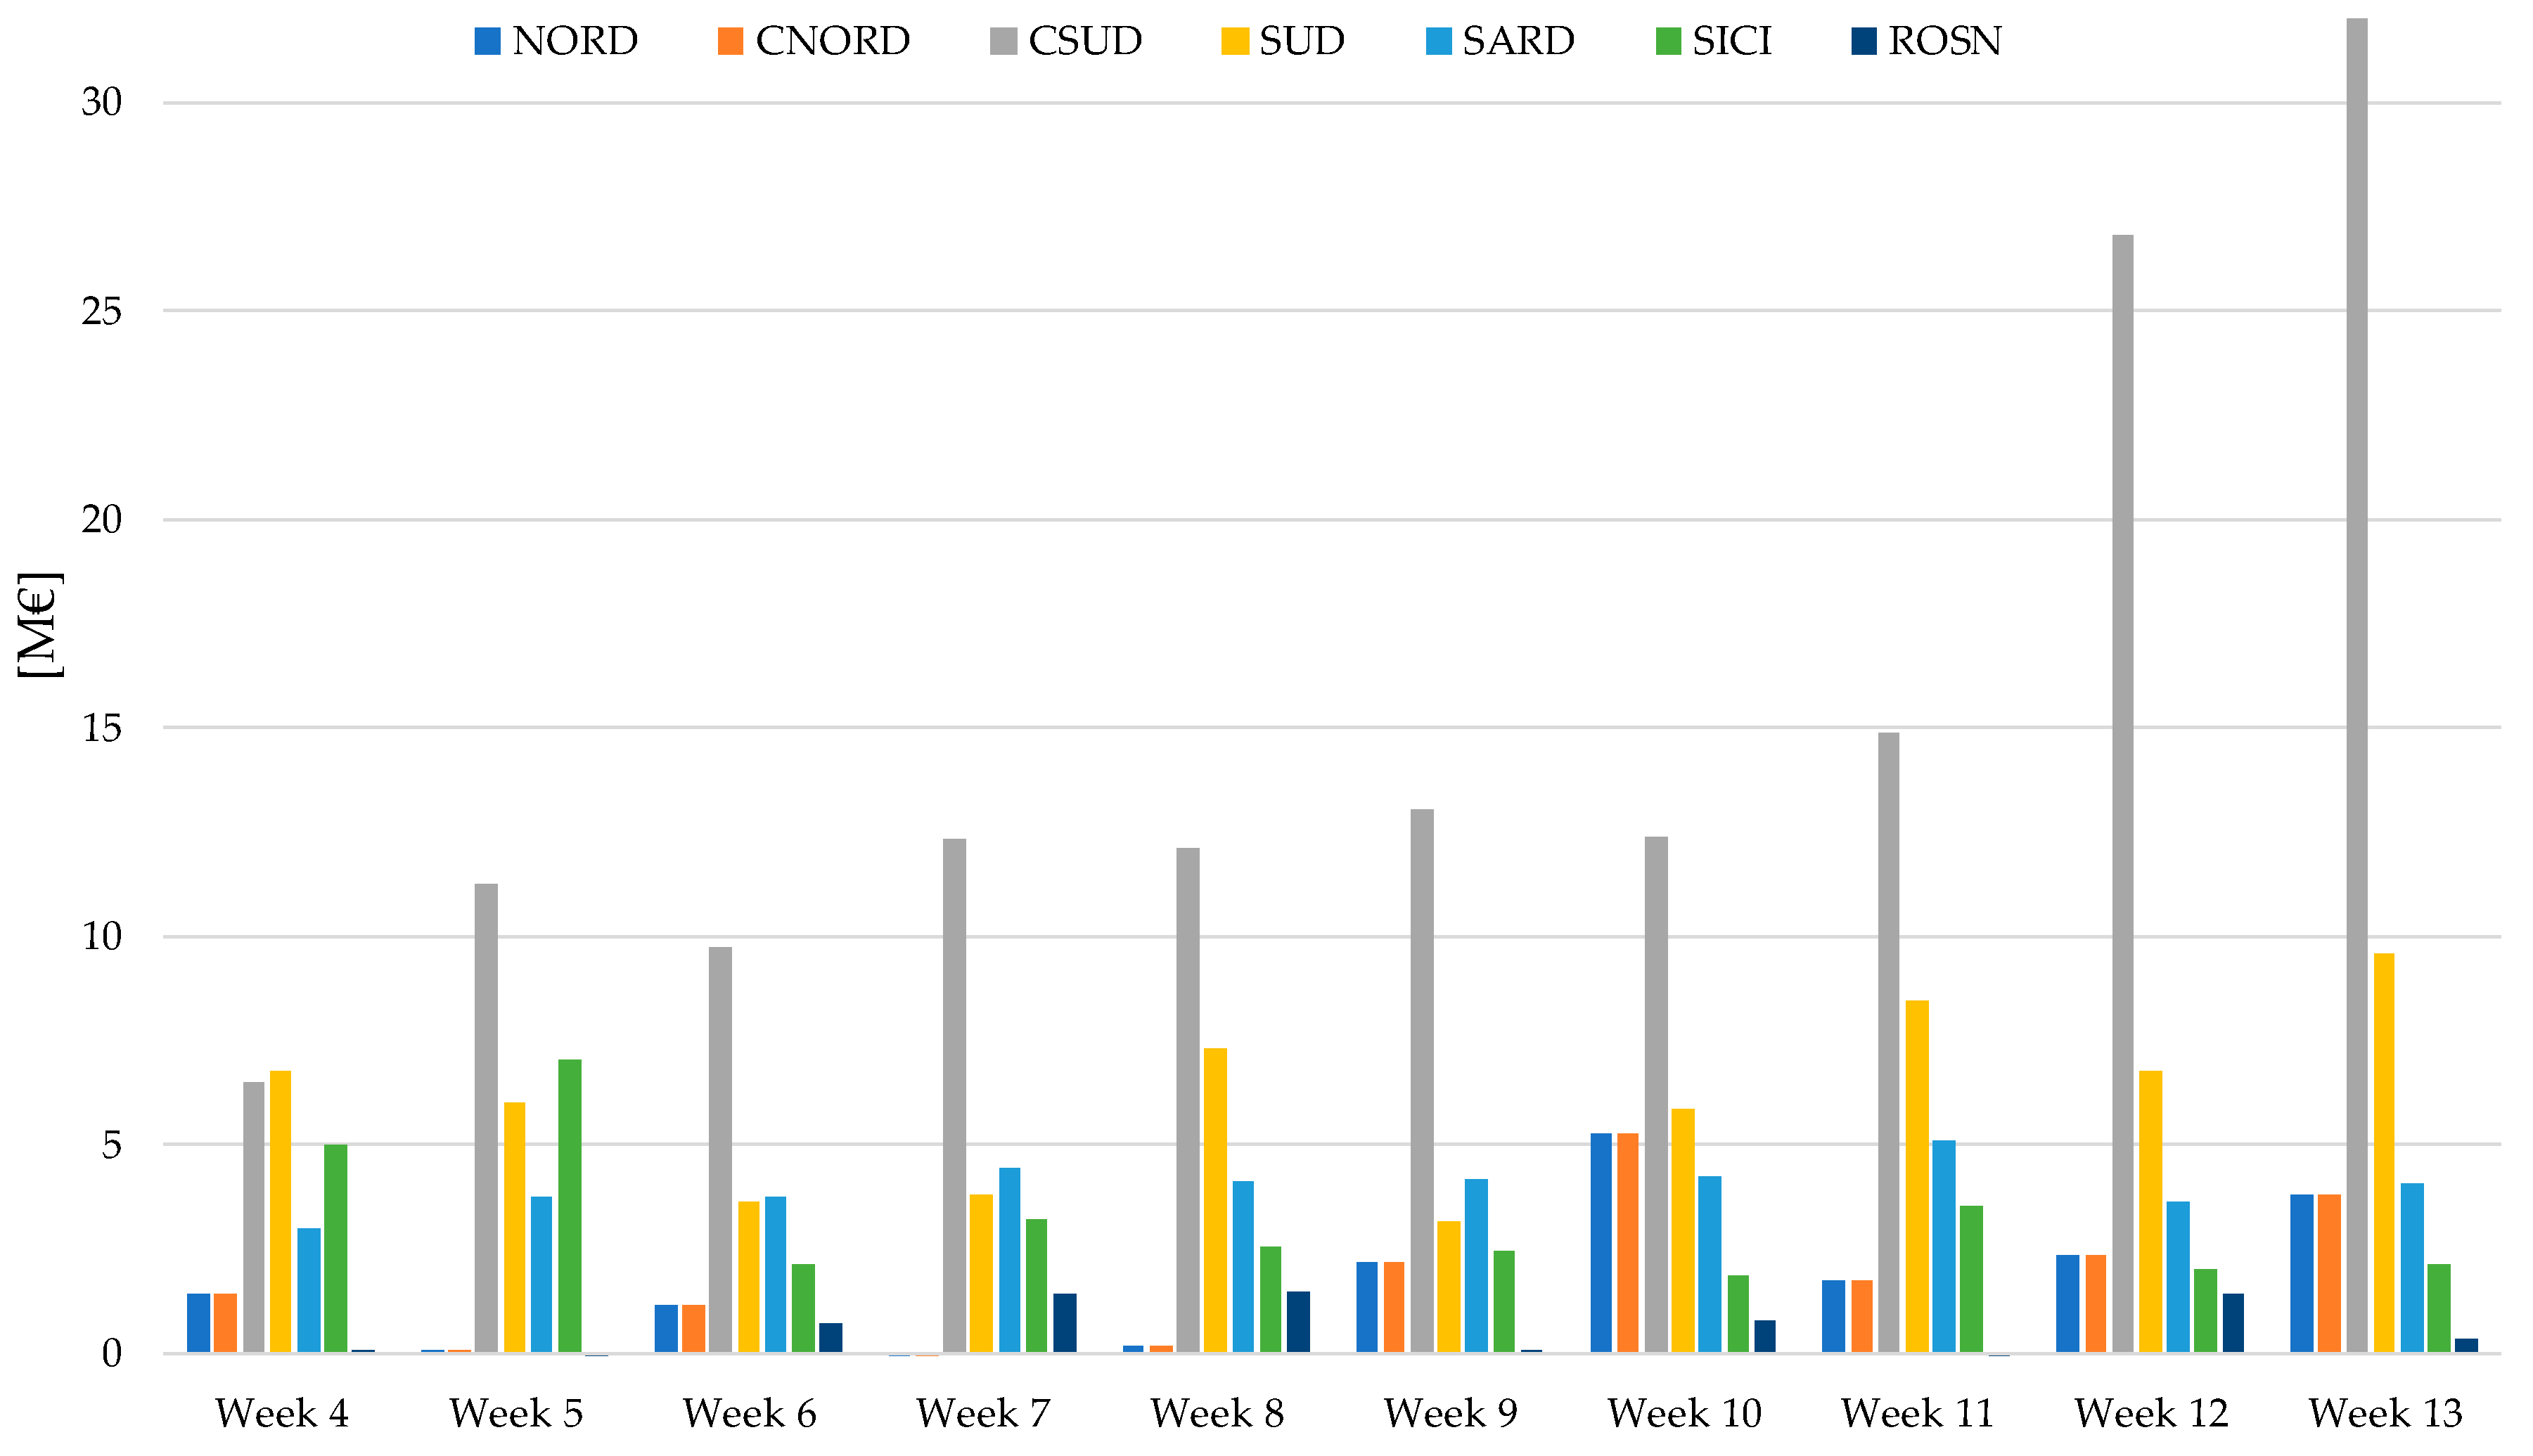
Figure 24 shows how the nationwide costs are subdivided per market zone.
Figure 24 shows a detailed representation of how both the volume and the prices distribution increased during the lockdown period, leading to the overall cost increase showed in
Figure 25. Anyway, it is important to notice also how historically-stable zones as north and centrenorth, which often show low MSD costs, show a great relative increase in costs during the lockdown phase, as a signal of stressful situation spread on the entire power system. This result shows how the effects of the lockdown worked as a stress test for the electricity system, which can be of great interest for understanding the relation between RES/Load ratio and system flexibility.
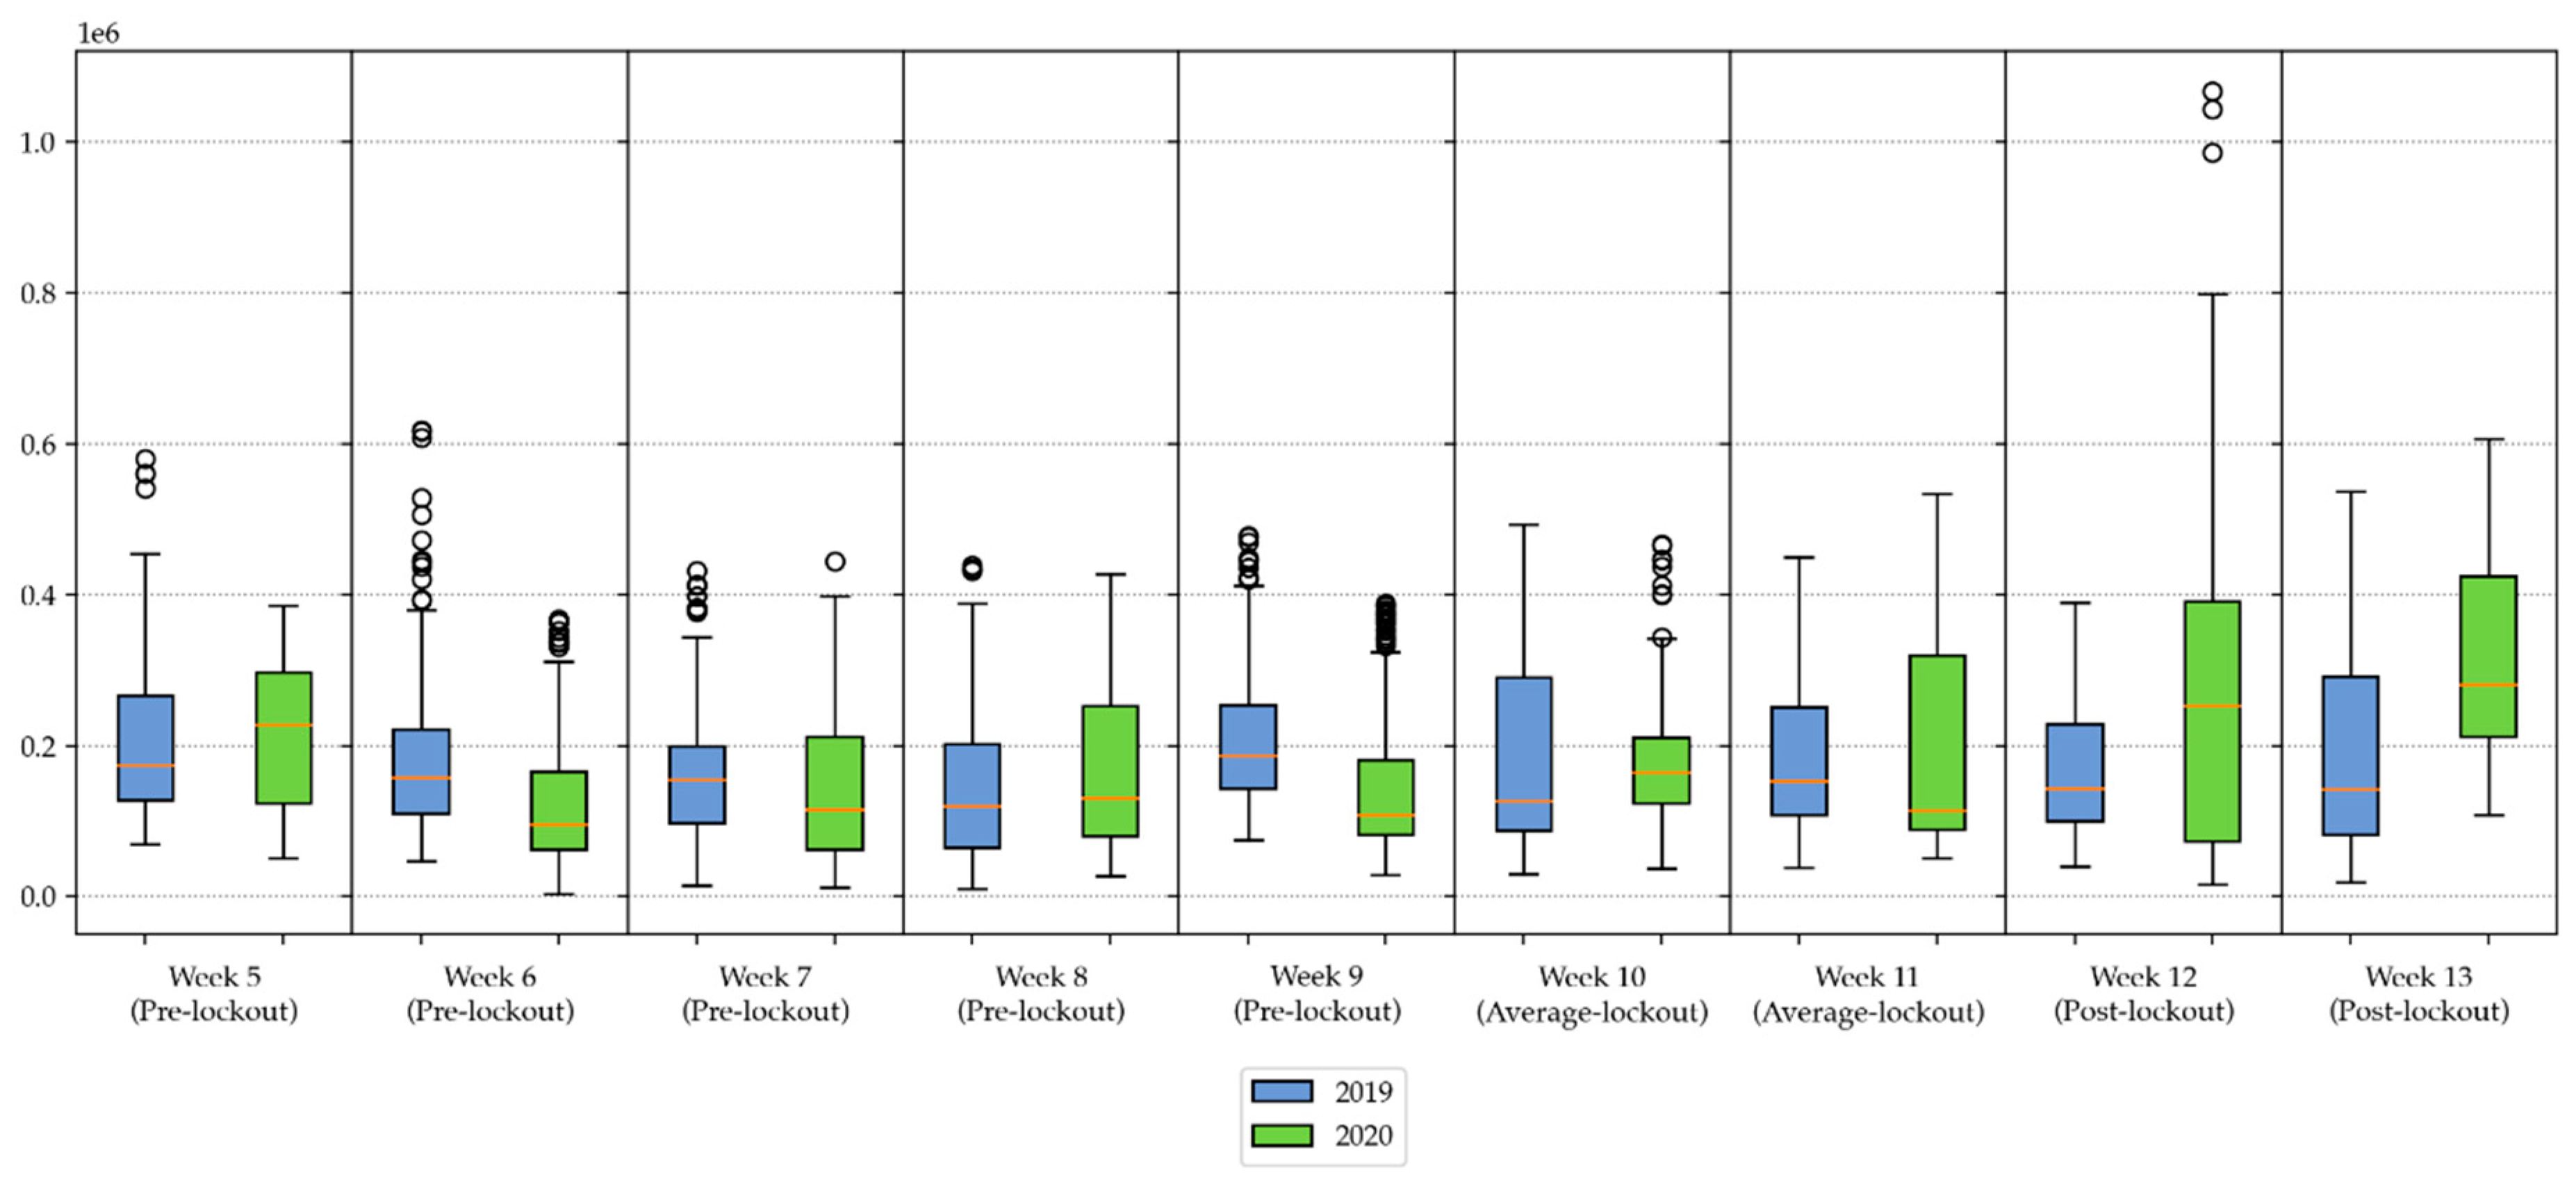
The southern and south-central zones are the ones that experienced the largest cost increases. This effect is due to a large PV-production in the southern part of Italy, and a general lack of hydro pumping facilities in the same areas. Investigating deeper these results, the MSD results of 2019 and 2020 were statistically compared in
Figure 26. In this figure, the weekly boxplots of hourly MSD costs are shown for weeks 5–13 of 2019 and 2020. The plot shows a strong increase in all the statistical cost indicators during weeks 12 and 13. In particular, the median costs almost doubled concerning the previous reference weeks and the previous year. The same observation can be made on the statistical maximum of the distribution, showing strong changes in the observed prices. Besides, it is worthwhile to notice the existence of the very high outliers of week 12.
The dispatching services costs increase substantially due to the unexpected decrease in demand that strengthened the challenges of balancing the Italian power system. Normally, to follow the ramps (evening and morning), rapid balancing actions are required and created by dispatchable units with high modulation capacities and fast response times. The best resources for this service are the hydroelectric production and pumping units, which can enter service and vary the production in a very short time. Thermoelectric plants can also be used, but they must be kept at a technical minimum in the hours when their production is not needed (although they have unsurmountable physical limits of minimum uptime, downtime, ramp up/down capabilities). Besides, as a result of the non-programmable renewable sources, the ramps (especially the evening one) become steeper. For this reason, it is, therefore, necessary an increased reserve capacity to cover the steeper loading ramps accentuated by the loss of photovoltaics in the evening hours and/or the loss of the wind in the morning hours, in particular in South Italy, leading to an increase in dispatching costs (for services that can be offered almost exclusively by thermoelectric units).
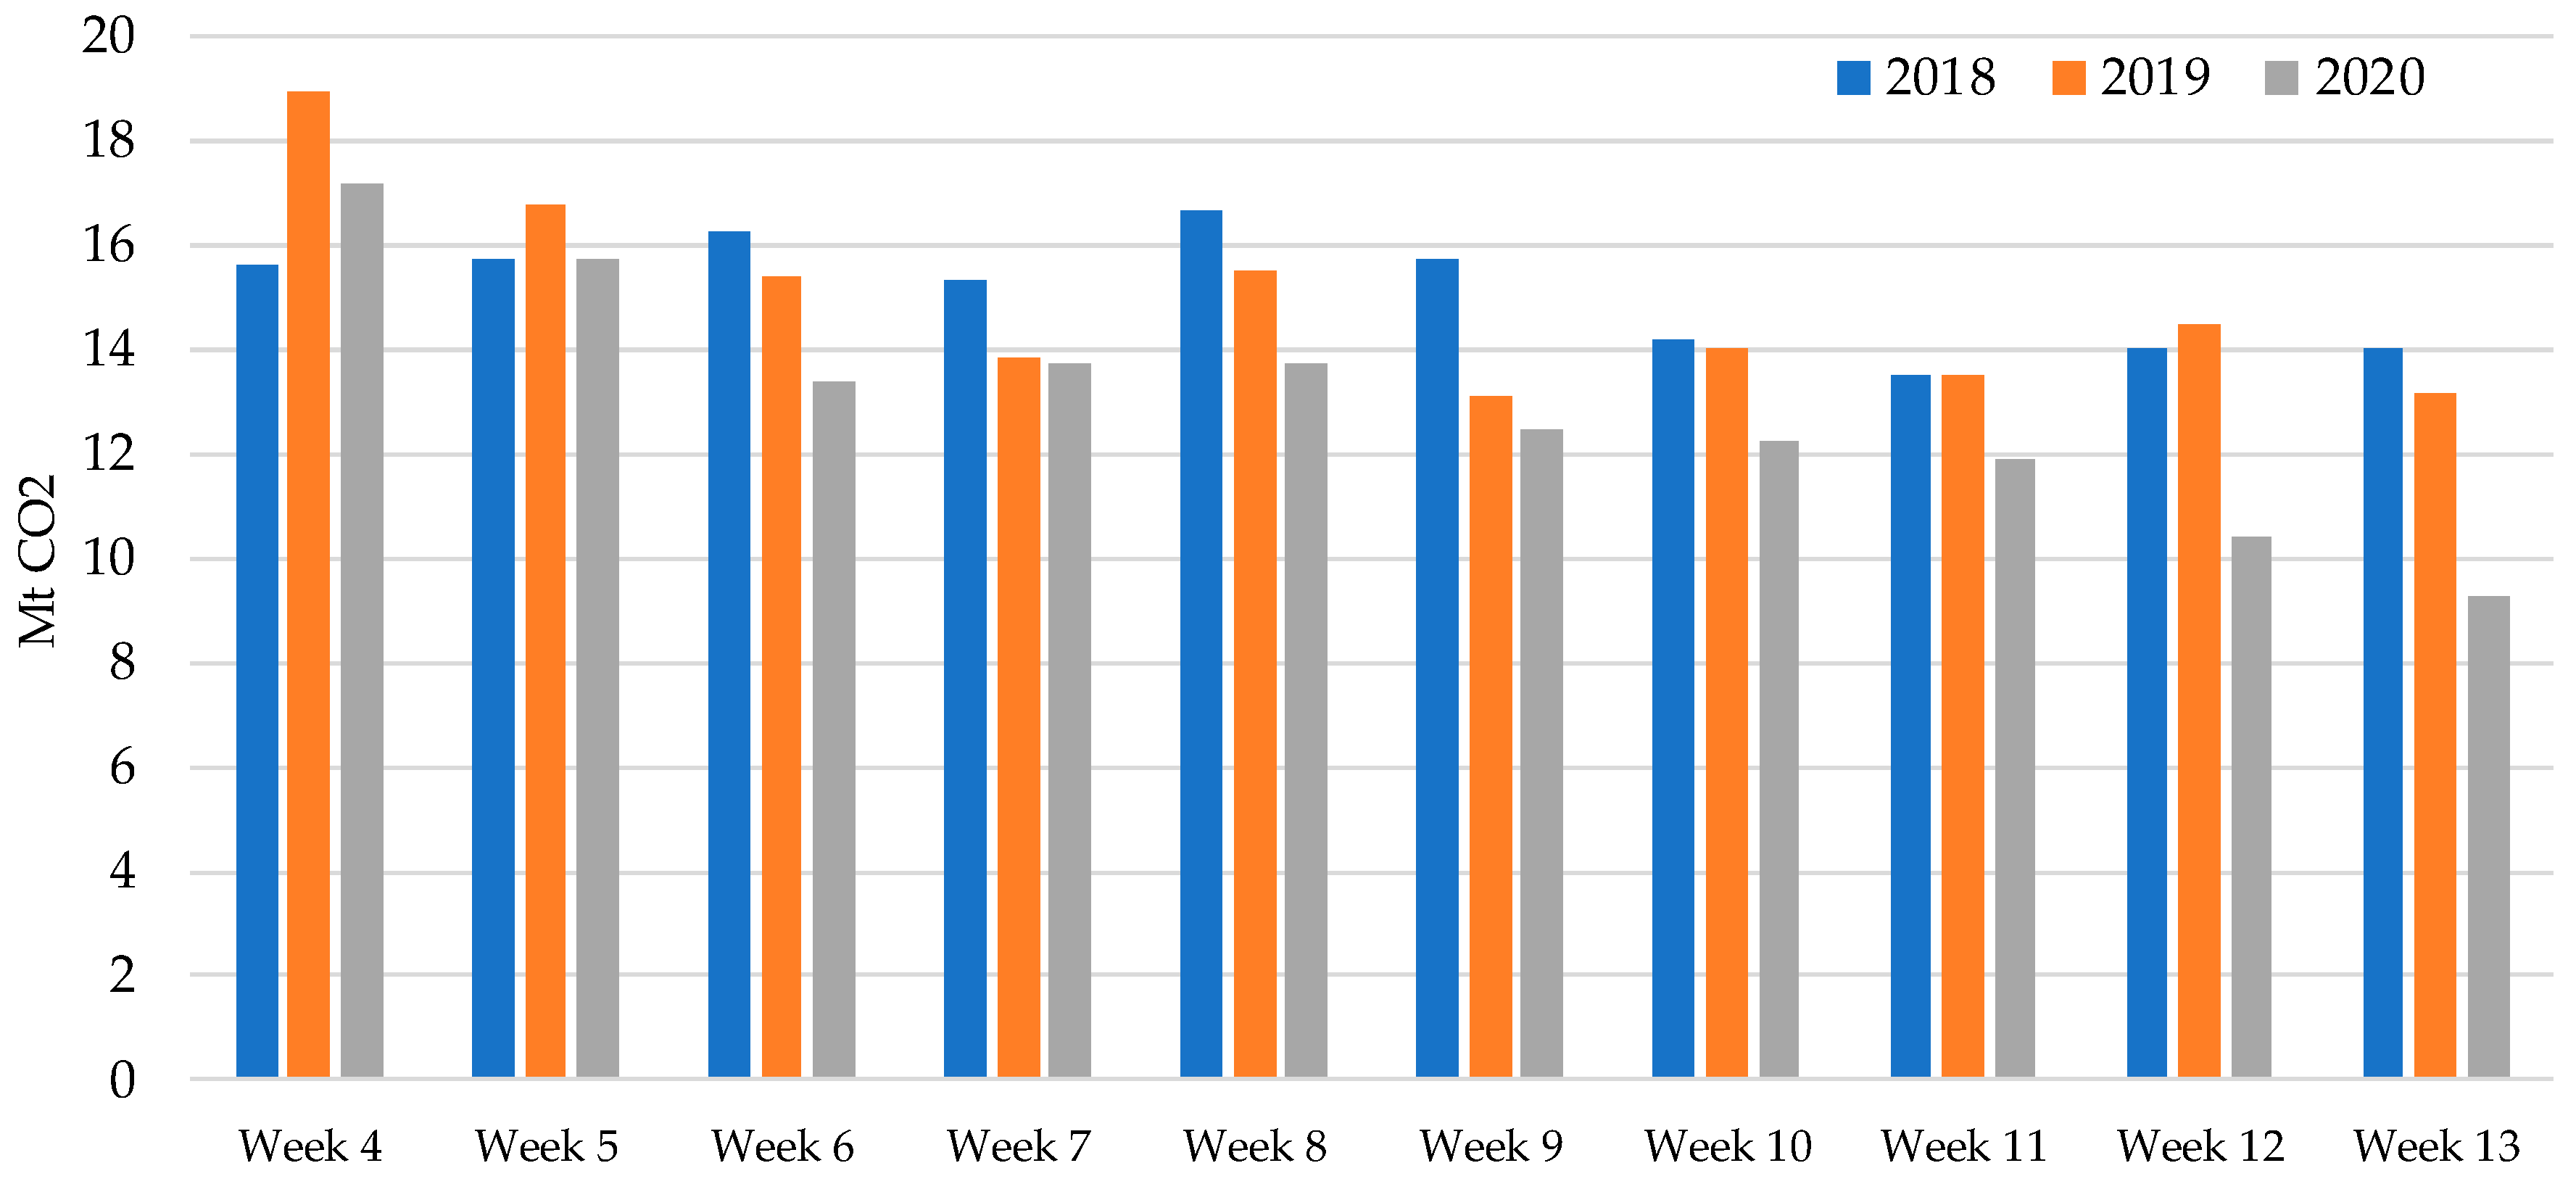
4.5. Power System CO2 Emissions during COVID-2019 Outbreak
In this last part of the study, the environmental impact of the COVID-19 is evaluated by considering the changes in CO2 emissions for the Italian power system. To quantitatively evaluate the reduction in CO2 emissions, the share of energy produced by CO
2 emitting generation facilities was calculated, by using the approach described in [
20]. This value was then multiplied by the national Emission Factor (EF) for electricity production of thermal origin in 2017, which was 433.2 g CO2eq/kWh. This value is far below the European average, equal to 575 g CO2eq/kWh [
20].
Figure 27 shows the total estimated emissions of the whole electricity system during the observed weeks. As a suggestion for future research, a more precise EF can be estimated for this period to better estimate this value since the shares of energy supplied by different thermal technologies will likely change. At the time of writing this study, however, these data are unfortunately not available.
For instance, considering the open data in [
15], the total production decreased by approximately 15% between the last week of March 2019 and the last of March 2020, whereas the RES production was approximately unchanged (−3%) and the thermoelectric generation was strongly reduced (−26%). This reduced thermal generation caused a change in total CO
2 emissions which reached a decrease of 40% during the last week of March. Surely this phenomenon is positive for the national development plan, as well as the for the European one. Such a reduction in emissions through a short time is certainly interesting because it could lead to future developments in the field of CO
2 reduction. It would certainly be interesting as a future study to analyze whether this decreasing trend is going to continue, perhaps with some fluctuations or whether it will return to the historical emission values known.
5. Conclusions
The economic effects of crises arising from COVID-19 have manifested themselves in the disruption of supply chains and the consequent interruption of productive and commercial activities. These changes have caused in the electricity sector tangible changes in power consumption profiles due to the shutdown of public offices, schools and various business facilities, with consequences on the entire operation of the electrical system. These effects on the Italian electricity system can be regarded as an unexpected country size experiment and resiliency test performed on the electric power system.
The study shows that the pandemic caused a reduction of consumption up to 37% compared to the same time as the previous year. The observed reduction in electricity consumption has had immediate effects on the day-ahead electricity market. The reduction in consumption excluded part of the costly thermoelectric generation, which is automatically taken out of the market due to the production cost compared with renewable generation. As a consequence, wholesale energy prices decreased about 30% in the last weeks of march and in the first week of April, and in some cases reached a value of 0 €/MWh. This circumstance has had immediate consequences also on the reduction of CO2 emissions.
Starting from these observations, this study investigates the observed price changes, to understand if they can only be related to exogenous factors or if the unexpected crisis triggered already existent systemic weaknesses. The observations highlighted a strong increase in the ancillary market costs, which showed an average increase of about 70% for the weeks before the lockdown, and almost doubled during the last week of March. These extra costs were determined by the need of TSO to achieve system adequacy and security recurring to the flexibility of conventional plants for providing ancillary services such as real-time load balancing, frequency regulation and reserve margins formation, which are obtained in a competitive context and cannot be guaranteed from renewable sources. The ancillary cost growth was common in all the Italian market zones, but it was observed to be significant in the Italian Southern zone, where the majority of the RES generation is installed.
Finally, the impact of COVID-19 pandemic on the generation mix is discussed. In particular, it was observed that the reduction in overall consumption did not affect the RES generation, but rather the amount of energy supplied by conventional sources. The share of energy supplied by RES steeply increased, reaching a daily RES penetration higher than 40%, when the average seasonal value was about 23%.
The contents of this study allow improving the knowledge about techno-economic effects on the power industry and society due to unpredictable events such a pandemic and can stimulate deeper investigation about the resilience of power systems with high RES penetration. Altogether, the availability of testing data will grant the possibility to achieve a much better tuning of scenario-based analysis, allowing more accurate planning phases and processes. One key message from the paper is that it is possible to run the power system with high shares of generation from RES but the cost for ancillary services could be very high without a high level of flexibility on the demand side and the installation of significant energy storage capacity.


