1. Introduction
Investors are motivated by high stock returns, but stock movements are a random walk. Stock prices are driven by a variety of factors which are related to firm-specific variables, market performance, and macroeconomic variables, as well as to investor sentiment. Investors have limited control in the stock price dynamics, and predicting stock movements is not an easy task. Some argue that stock prices and profitability measures tend to return to their historical average over time (see for example,
Nissim and Penman 2001;
Fairfield et al. 2009; see also,
Brooks and Buckmaster 1976;
Freeman et al. 1982;
Fairfield et al. 1996). However, the determinants of stock performance and future profitability do not mean–revert when firms are classified by their corporate life cycle phase (
Dickinson 2011). The reason is that differences in the firm life cycle may distort convergence rates and reversion patterns (to the long run mean) of future profitability. Therefore, the firm’s corporate life cycle phase can be taken as a useful tool to assess market performance and the future horizons of profitability (
Anthony and Ramesh 1992).
Every firm that is traded in the stock market is like a living organism, that goes through several stages of a life cycle. Firms are born, grow, reach maturity, and then decline (
Gort and Klepper 1982). Their ultimate task is to grow rapidly and enter the mature phase where the firm’s performance is optimized. However, each firm has its unique life cycle. Life cycle stages last for different amounts of time and the firm does not necessarily evolve along the sequence of distinct phases of the life cycle (
Miller and Friesen 1984). Arguably, there are new-born firms which pass directly from the birth stage to the decline stage without being sorted through the growth stage and growing companies which find that growth is only short lived. Indeed, the factors which allow firms to grow rapidly are the same variables that can bring them up against a shake-out or even a decline. Thus, separating the firm into the distinct life cycle stages is a process that makes it possible to capture the variations on a firm’s performance and future profitability.
To this end, this article investigates the predictability of financial–accounting indicators of the firm’s corporate life cycle phase. The identification of the financial–accounting variables associated with a high probability of a firm being classified at a distinct life cycle stage is important for the design of corporate policies and the development of efficient early warning systems.
This study focused on the European REIT sector, over the period 2006–2023. In the empirical analysis section, the cash flow pattern is used for each REIT for an ex-ante classification into the different phases of their corporate life cycles. Then, a multinomial panel logit model is used to estimate the classification probability as a function of the financial–accounting variables, such as the dividend distribution, the leverage ratio, the return on equity, the market to book value, the sales, and the size.
Indeed, the main contribution in this paper is the provision of empirical evidence on the financial–accounting predictors of a firm’s corporate life cycle, concentrating on the real estate sector. To the best of the author’s knowledge, this is the first study to examine the influence of financial–accounting ratios on the firm’s life cycle phase, focusing on the REIT market.
The empirical findings suggest that leverage, dividend distribution, size and sales are significant predictors of the corporate life cycle classification of the REIT. Specifically, more leverage is associated with a higher probability of the REIT being classified in the early stage of its corporate life cycle, rather than in the maturity stage. Higher leverage is also a significant predictor for the REIT being categorized in the shake-out stage, instead of the maturity phase. A negative coefficient of the sales indicator, the size variable and lower dividend distribution are all associated with an elevated probability of the REIT being classified in the decline stage, rather than in the maturity phase.
In the extant literature a number of studies focus on the interrelationship of the corporate life cycle of the firm and its performance. Hence, there are studies which examine the relationship of the different life cycle stages of the firms with profitability (see, for example,
Warusawitharana 2018), and others which assess the interaction of the firm’s life cycle with dividends, earnings, revenue growth, capital structure and growth opportunities (
Fama and French 2001;
DeAngelo et al. 2006).
There are also studies in the literature suggesting that variations in future profitability can be explained by current profitability (returns of net operating assets), and increases in asset turnover (
Fairfield and Yohn 2001), and other studies which reveal the role of the firm’s life cycle in evaluating the value of the firm and the future returns (see, for example,
Dickinson 2011).
The remainder of the paper proceeds as follows.
Section 2 provides the literature review, and the hypothesis development, and
Section 3 describes the methodology.
Section 4 discusses the data sources and provides the descriptive statistics and also displays and discusses the empirical results, providing the robustness tests. The last section concludes the analysis and makes suggestions for future research.
2. Literature Review and Hypothesis Development
Although the life cycle theory has its origins in behavior literature and the qualitative approaches, a series of studies follow a more quantitative (than qualitative) approach to classify firms at a specific life cycle stage. Firstly, there are studies which use univariate quantitative measures, such as a firm’s age and size, to evaluate the corporate life cycle of the firm (
Bradshaw et al. 2012;
Khan and Watts 2009;
Bhattacharya et al. 2004). Indeed, these univariate measures provide adequate information about the firm’s maturity stage; however, these approaches are simply considered a linear approximation of the firm’s evolution over the life cycle. Arguably, a firm evolves dynamically over the corporate life cycle (
Helfat and Peteraf 2003).
Other studies intend to overcome the above-described limitations and follow a more dynamic approach by using the univariate retained earnings over net assets ratio (or the retained earnings over total assets ratio), to sort the firm into a specific life cycle phase (
Habib and Hasan 2017;
Hasan et al. 2015). Yet, there are still standpoints which suggest that the univariate limitations of the former approaches remain, and, hence, are not able to fully capture the firm’s life cycle classification characteristics, only capturing a part of it (
Dickinson 2011).
There are also studies which examine the corporate life cycle of the firm within a multi-stage framework (
Gort and Klepper 1982;
Miller and Friesen 1984). Notably, the study by
Anthony and Ramesh (
1992), was one of the first to incorporate financial-accounting indicators, such as dividend payout, sales growth, and capital investment (and age) in a multistage life cycle approach. Nevertheless, the
Dickinson (
2011) cash-flow (CF) life cycle approach is the most prevalent in financial–accounting literature.
Indeed, Dickinson’s methodology overcomes the flaws of the univariate–one indicator life cycle proxies. It is a multi-level life cycle classification scheme, aiming to capture the dynamic evolution of the firm, based on the firm’s cash flow statement(s), but is also subjected to certain limitations. Specifically, the CF life cycle approach is based on the sign(s) of the cash flow activities but does not consider the size of the cash flow. Furthermore, Dickinson’s methodology necessitates an ex-ante categorization of the firm into a distinct life cycle phase. Therefore, the CF methodology is exposed to a possible mismatch of the cashflow activities, due to either a ‘firm-manipulated’ cash flow misstatement or a transaction timing mismatch, ultimately leading to a life cycle misclassification of the firm.
In the empirical analysis section of the study, after an ex-ante classification of each REIT, based on the Dickinson’s cash flow methodology, the leverage, the dividend distribution, the return on equity, the market to book value, the sales, and the size variable are considered, within a multinomial logit model, to explore whether these financial–accounting indicators are statistically significant explanatory variables of the life cycle of a firm.
To this end, another strand of extant literature examines the relation between a firm’s life cycle stages and financial accounting indicators.
Firstly, with respect to dividend payouts, certain studies suggest that dividend distribution is positively related with a firm being categorized in the maturity stage (see, for example,
Bulan et al. 2007;
Coulton and Ruddock 2011). Arguably, capital constraints of younger firms restrain their capacities of dividend distribution. There are also studies showing that the capital structure of a firm interacts with the firm’s life cycle stage. Interestingly,
Faff et al. (
2016) found that leverage increased for firms passing from the introduction phase to the maturity phase. In the same direction, a series of studies denoted that newborn–growing firms rely more on debt finance, whereas mature firms tend to use more internal, rather than external, capital to finance their activities (see, for example,
Diamond 1989;
La Rocca et al. 2011;
Hasan and Cheung 2018). In addition, there are studies that consider sales growth, the return on equity and the market to book ratio, as explanatory variables of the firm’s life cycle phase, displaying negative variations in the return on equity and the market to book indicators in the introduction, growth, shake-out and decline stages of a firm’s corporate life cycle, as opposed to the maturity phase. It has also been denoted that revenue growth decreases in the decline stage (see, for example,
Costa et al. 2017).
Based on the above, the following research hypotheses were developed:
H1: REITs classified in the maturity stage have higher dividend pay-outs in relation to those classified in the other stages of the life cycle.
H2: REITs classified in the early stage of their life cycles (birth, growth stage) have higher leverage relative to those grouped in the maturity stage.
H3: REITs classified in the decline stage display higher negative variations in sales compared to those categorized in the maturity stage.
3. Methodology
3.1. Life Cycle Classification Process of Firms
This section provides an essential background to the corporate life cycle classification process for the REITs considered in the empirical analysis section. Following
Dickinson’s (
2011) methodology, the REIT cash flows were used to construct an ex-ante classification for each REIT, to a distinct corporate life cycle phase.
Table 1 provides the life cycle classification, based on
Dickinson (
2011).
To develop the categorical dependent variable of the study, and, hence, to obtain an ex-ante proxy of the REIT life cycle phase, the REIT cash flows were categorized as operating, investing, and financing. Note that the operating activities include all cash activities which are related to net income (i.e., revenues, rents, sales, expenses, maintenance costs and management fees). The investing activities include the cash activities which are associated with non-current assets (i.e., properties, equipment, long run investments). The financing activities include the cash activities which are related to non-current liabilities and the owner’s equity (i.e., principal amount of long-term debt, stock sales, repurchases and dividend payments).
The signs (positive or negative) of the above-described REIT cash flows per category (on an annual basis) were used to obtain the direction of the ex-ante classification of the dependent categorical variable (i.e., life cycle phase). The characteristics of the five stages of the life cycle, which were used to group the dependent categorical variable for each REIT into a distinct life cycle phase, are summarized as follows:
At the birth stage, the operating cash flow is expected to be negative, because the company is a new entrant in the market and lacks knowledge. The investing cash flow is also expected to be negative because the firm needs to conduct major investments to enter the market. Financing cash flow should be positive, because of the firm’s need for external funds to expand the business.
At the growth stage, investing cash flow is expected to be negative because the firm grows its business and financing cash flow is positive, due to higher external financing. The operating cash flow should be positive, because, at this stage, the profit margin increases.
At the maturity stage, the operating cash flow is at a maximum, given that the firm now has increased knowledge and a higher profit margin, but, because the growth opportunities tend to cease and the maintenance costs/management fees are higher, the investing cash flow should be negatively affected. At the maturity stage, firms tend to distribute their profits to shareholders (dividend pay-outs) but also to service debt, resulting in a negative financing cash flow.
At the decline stage, the operating cash flow falls (prices fall), while the renegotiation of debts, and the process of the property asset liquidation, should generate a positive investing cash flow. Given that the extant literature does not provide a clear direction regarding the financing cash flows at the decline stage, both types of signs (positive and negative) are considered for this category. Firms which are not classified in any of the above-described categories, are grouped in the shake-out stage.
3.2. The Model
In the empirical analysis, a multinomial logit model was used to estimate the classification probability as a function of the financial–accounting indicators. Therefore, the dividend rate, the leverage (debt to capital) ratio, the market to book value, the return on equity, the size (as expressed by log normalized total assets) and the sales (log normalized revenues) variable, were used as explanatory variables to examine the corporate life cycle classification of the REITs.
The method was based on the following regression:
where
is the log of the odds ratio and
is a categorical dependent variable that represents corporate life cycle phase for each REIT, which takes the value of one (1), two (2), three (3) and four (4) to express the birth, growth, shake-out and decline stages, respectively, and zero (0) represents the base parameter value (maturity phase),
is the vector with the explanatory variables, the terms
are the regression coefficients and
is the residual term of the regression.
4. Data and Empirical Results
4.1. Description of Data
The financial accounting data of 130 publicly listed REITs
1 which are traded in the European market(s) were made available by the DataStream database. The data are annual and span the period from 2006–2023. Note that, while the US REITs and the Australian REITs have existed for some decades now (1960 and 1971, respectively), the European REIT regime was quite recently established, mostly in the early post-2000 period (
Mazurczak 2011). Therefore, the data and the corresponding observations of the public listed European REITs which were considered in the empirical analysis, were readily available from, and best accessed from, the above chosen examining period (2006–2023).
First, the net cash flow data from the operating, investing, and financing activities, were extracted for each REIT company. Given that the financial accounting data were not available for all the REITs, over the whole examining period, and after excluding all outliers, the final dataset consisted of a total of 1291 observations. Note that scatter plots and box plots were used on the corresponding data sets of each available REIT firm, to detect and remove all outliers.
Then, the sample was broken down into (5) five corporate life cycle stages, as described in the previous section.
Table 2 displays the percent share of observations at each life cycle phase, based on the signal composition of the REIT cash flows (operating, investing, financing), over the examining period.
It was observed that the higher share of frequencies was evident in the shake-out stage (64.7%), followed by the maturity (18%) and decline phases (14.5%). Note that a different distribution of frequencies (that excludes the shake-out stage), is considered in the robustness section. In addition, a dataset that excludes the SOCIMIs was also considered to assess whether the (baseline model) sample was driven by the Spanish REITs. An alternative model specification that accounts for the REIT age is also considered in the robustness section.
Further, the annual dividend rate, the leverage ratio (as expressed by the debt to capital ratio), the return on equity, the size (as expressed by the log normalized total assets), the market to book value and sales (as expressed by the log normalized revenues), were employed as the key financial accounting determinants of the corporate life cycle classification (also derived by the DataStream database) of the REITs.
The descriptive statistics of the above selected explanatory variables are presented in
Table 3. From
Table 3, it can be observed that the annual average dividend rate was 0.9% and the annual average leverage (debt-to-capital) ratio was approximately 0.44 over the whole examining period. From the panel data sample, it can also be observed that the average annual return on equity was 0.046, the annual average market to book value ratio was 1.04, the mean sales (log normalized revenues) was 10 per annum and the average annual size (log normalized total assets) was 12.78. The skewness and kurtosis suggest that the distribution of the data sample was symmetric for the variables considered.
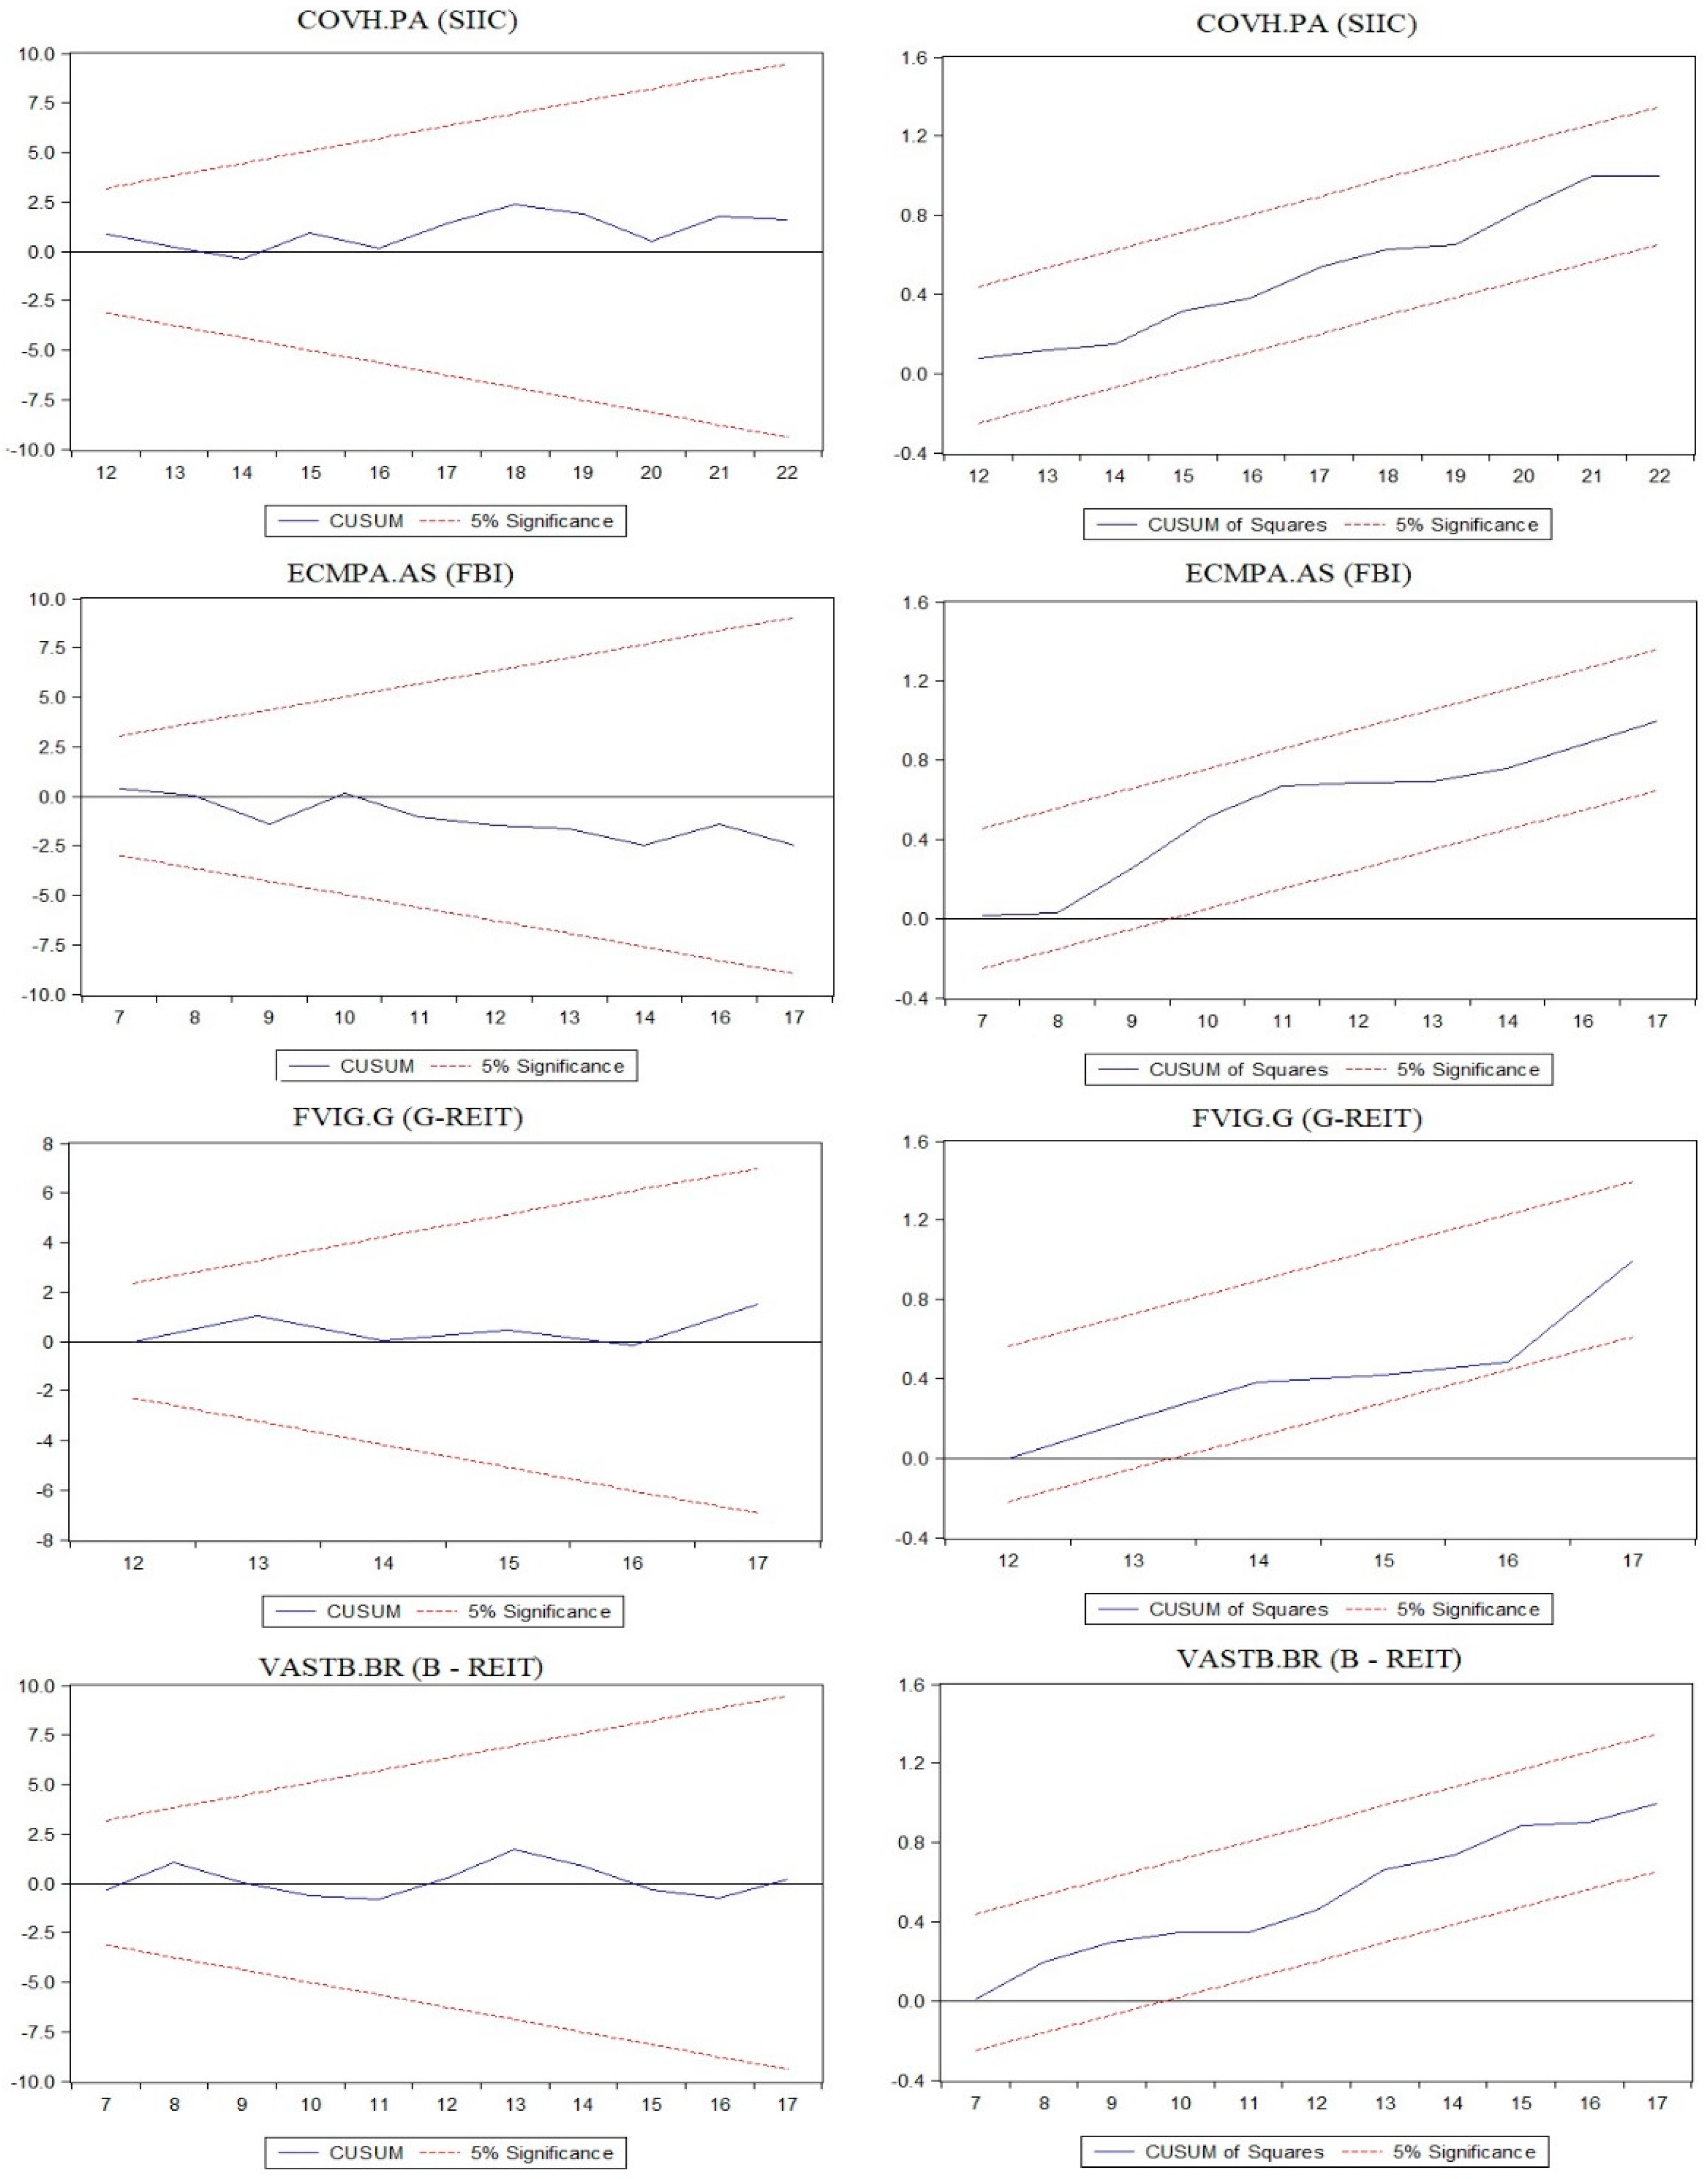
Given that structural breaks might generate spurious regression results, the baseline data sample was tested for any unexpected change in the parameters of the regression model (1) over time. Structural breaks might be caused due to a sudden change in the economy (i.e., due to a Global Financial Crisis, COVID-19). Therefore, the cumulative sum (CUSUM) test and the CUSUM of squares (CUSUMQ) test were both used to examine the structural stability of the model. Due to space contraints,
Figure 1 diplays a representative sample of results from the structural stability tests, which were separately conducted for each REIT firm considered in the model. The results of the stability tests show that the cumulative sum of the recursive residuals and the cumulative sum of squares lay within the standard error bands (5% significance lines), suggesting stability in the parameters of the model (1).
4.2. Empirical Results
4.2.1. Multinomial Logistic Regression Results
In this section, multinomial logit panel regression is conducted in Equation (1), on both multivariate and univariate settings.
Table 4 includes the correlation matrix among the independent variables. It is noted that all independent variables (except for the sales indicator and the size variable) displayed low correlation coefficients. To avoid multicollinearity issues, the sales and size variables were separately considered in the multivariate setting.
Table 5 (top and bottom panel) shows that leverage, dividend distribution, the sales variable and size added significant predictive power to the REIT life cycle classification. Specifically, it was observed that more leverage was associated with an elevated probability of the REIT being classified in the birth stage, rather than in the maturity phase (base parameter stage).
The empirical findings denote that leverage growth remains a significant positive predictor at the growth and shake-out stages. Specifically, it is noted that REITs with positive leverage variation are more likely to be classified in the early phase(s) of the life cycle or in the shake-out stage, rather than in the maturity phase. The results also denote that negative variation in the sales, size and negative dividend distribution are all associated with an increased probability of a REITs being grouped in the decline stage, rather than in the maturity phase.
Additionally,
Table 6 (top and bottom panels), summarizes the univariate setting tests. The findings of the multivariate setting clearly display the predictability powers of leverage, dividend distribution, the sales indicator, and the size variable. Given that models with higher McFadden R-squared display better predictive ability, the R- squared value is also included (in
Table 5 and
Table 6), as a measure of predictive ability.
From
Table 6 (top and bottom panel), it is observed that the sales variable displayed the highest R-squared value, implying that it is the most significant predictor among the selected variables. Notably, the empirical findings of both the univariate and a multivariate settings provided zero evidence of predictability of the return on equity and the market to book value financial–accounting indicators.
4.2.2. Discussion and Alternative Model Specifications
The positive coefficient on the leverage ratio, provided in the empirical analysis section, is consistent with the literature, suggesting that firms at the early stages of their life cycles (i.e., birth and growth stage) are highly leveraged, due to a lack of sufficient internal funds to finance their business activities. On the contrary, when firms are classified in the maturity stage, they display lower leverage ratios. The reason is that in the maturity stage the firm has generated–accumulated financial resources to increase the level of internal finance over external finance in its business operations (
Warusawitharana 2018).
The results also confirm the evidence that high profitability, (i.e., mature–established) firms pay more dividends, relative to firms that display low profitability, in relation to firms sorted into the decline stage (
Fama and French 2001;
Grullon et al. 2002;
DeAngelo et al. 2006). The former is consistent with the negative sign on the dividend distribution indicator in the decline stage displayed in the empirical results. With respect to sales, as expected, a firm displays a sharp drop in revenues in the decline stage, hence the negative coefficient of the sales variable, in the specific phase (
Costa et al. 2017).
Now, to further assess the predictability of the financial–accounting indicators on the REIT corporate life cycle classification, alternative multinomial logit models were used. First, two alternative model specifications were considered, excluding the market to book and the return on equity variables. According to the results provided by the main analysis, the former indicators provided zero evidence of predictability. Hence, alternative model specifications were considered, by seperately accounting (in Equation (1)) for the following: (a) the dividend rate and leverage (model 2), (b) the dividend rate, leverage, and sales (model 3).
The regression results, which are summarized in
Table 7, provide identical findings to those generated by the main multinomial logit panel regression analysis.
Further, the following two different model specifications were also considered: (a) model 4, which excluded the SOCIMIs in order to test whether the sample was driven by the Spanish REITs and (b) model 5, which included an additional control variable which accounted for the REIT age.
The reliability of the main findings was also examined by considering an alternative frequency distribution on the multivariate setting. Hence, two additional models (6 and 7), were considered, both excluding the observations which matched with the shake–out phase (i.e., model 6 included all explanatory variables (besides size) and model 7, which also excluded the MTB and the ROE variable).
From
Table 8 (top and bottom panels), it is observed that the alternative model specifications (4–7) further elucidated the robustness of the findings of the empirical analysis.
4.2.3. Robustness Tests
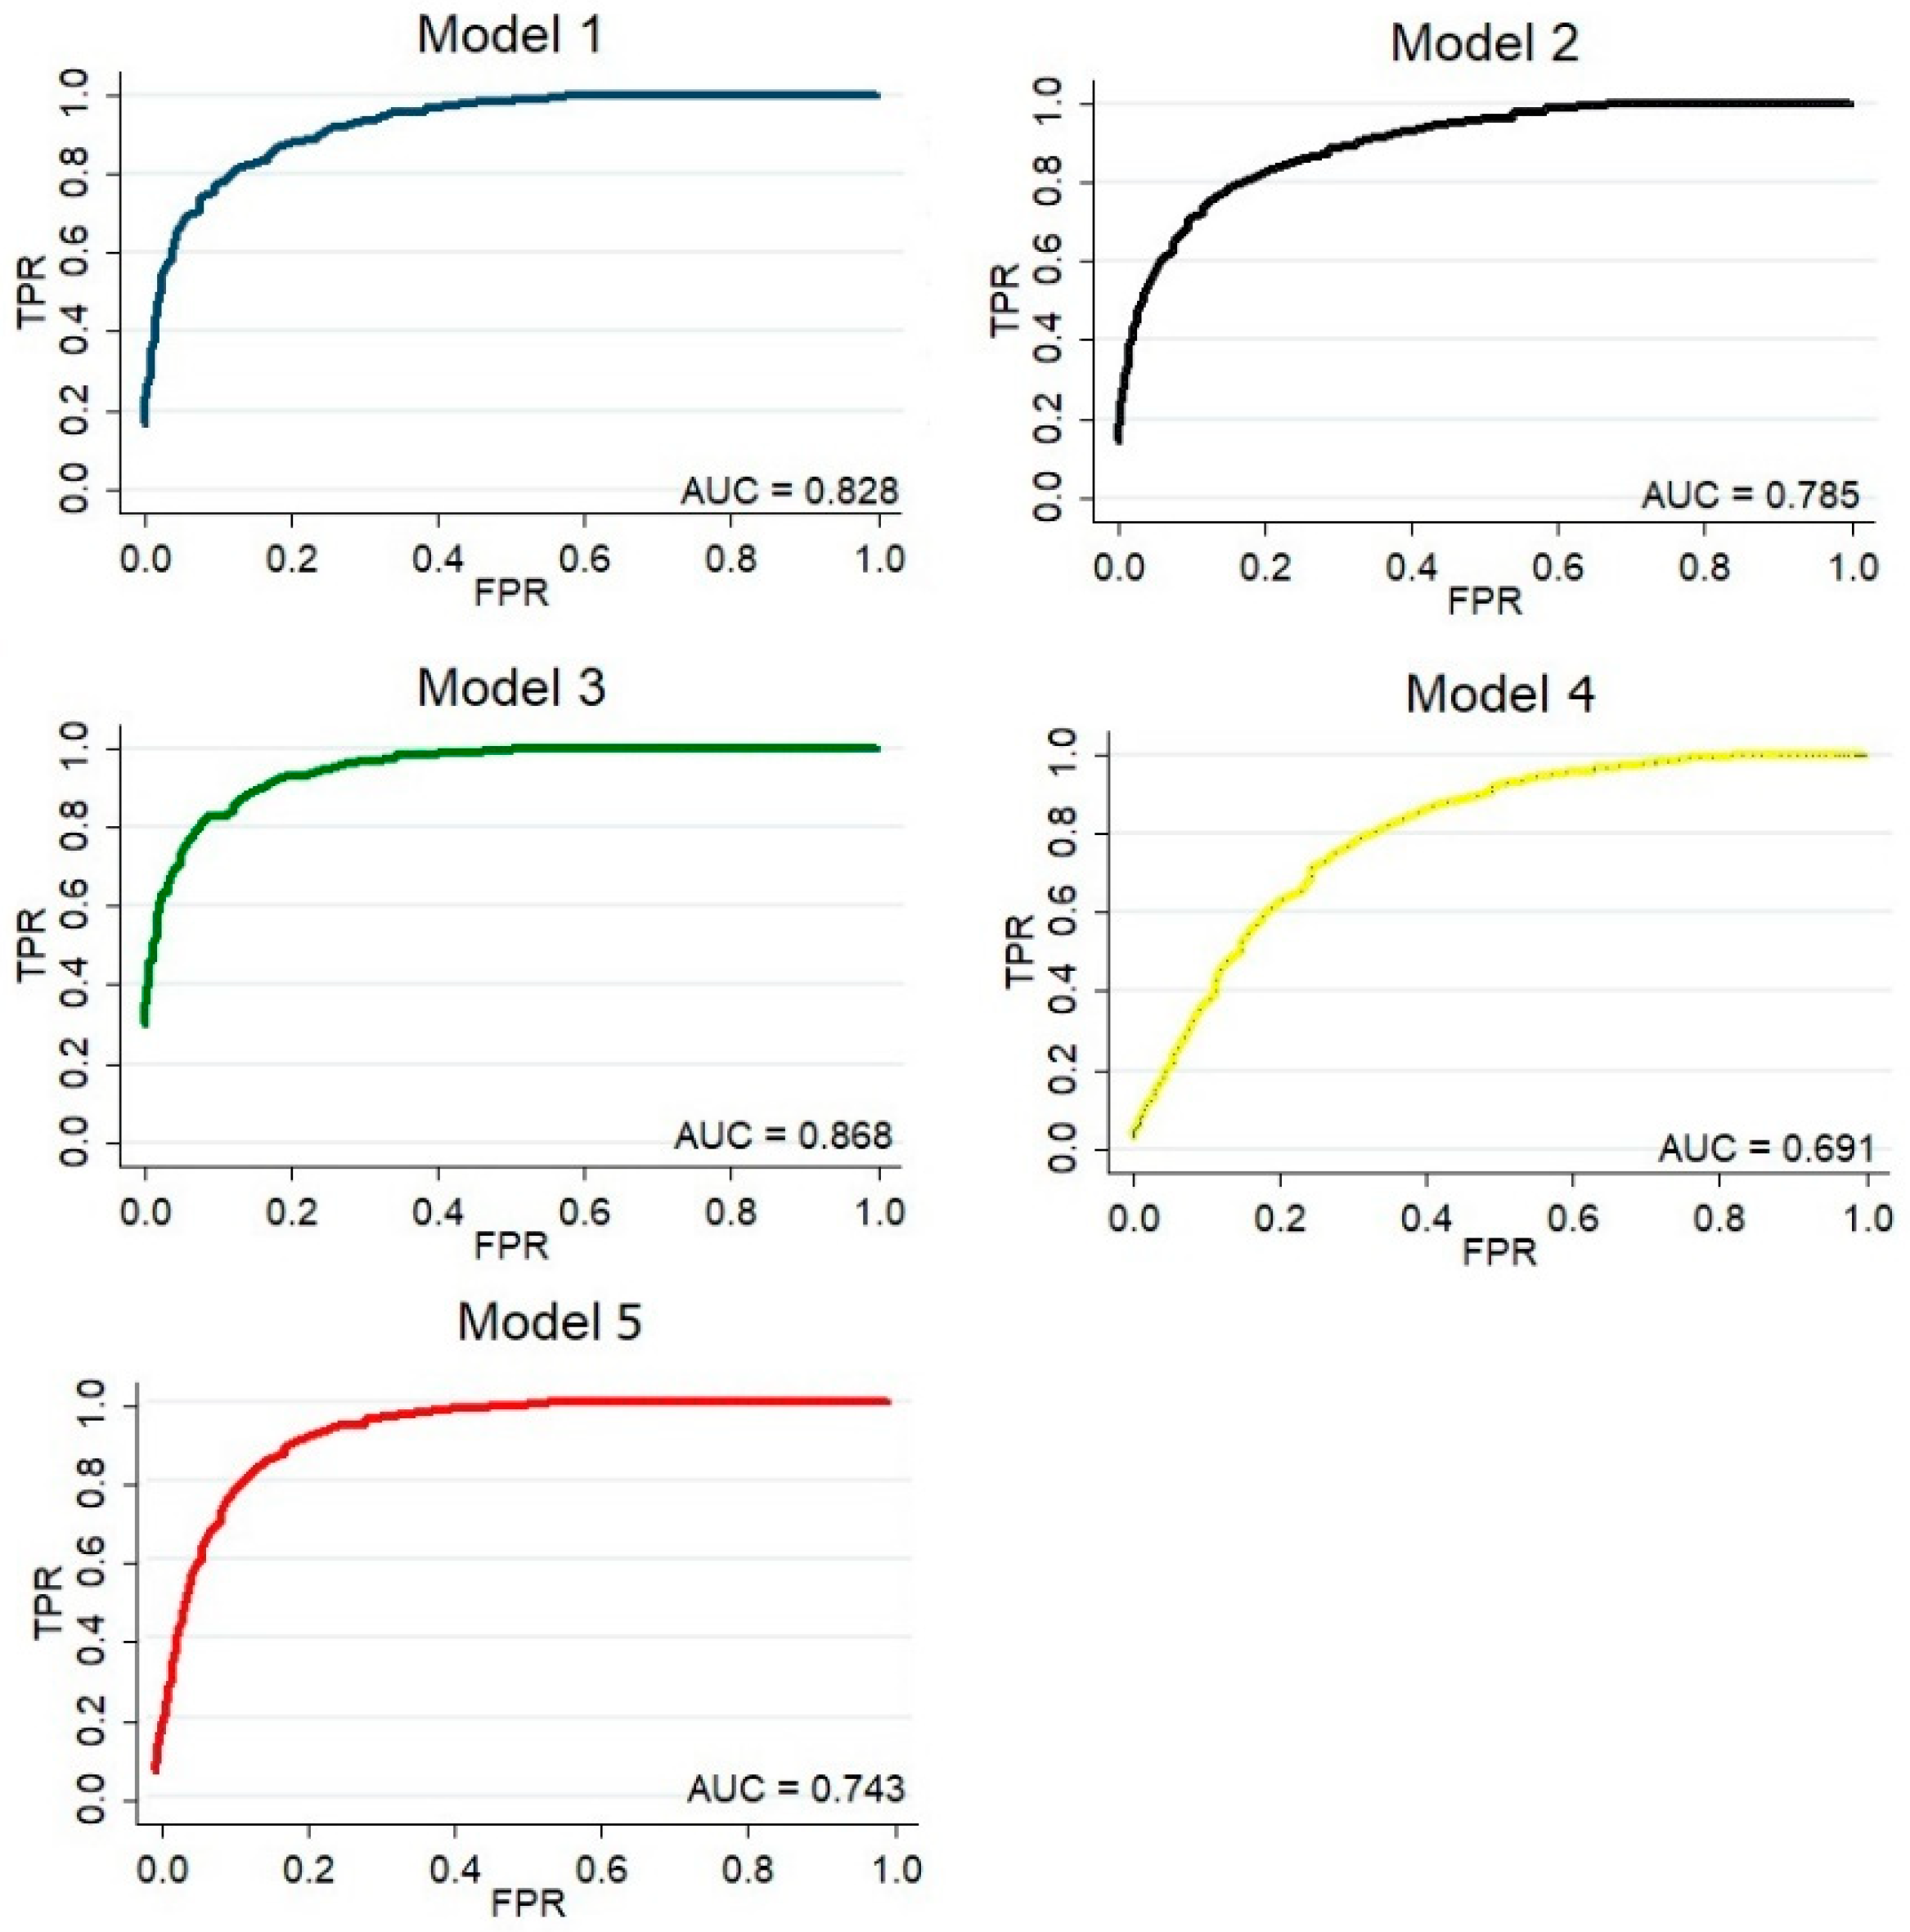
Besides the McFadden R-squared, a multiclass Receiver Operating Curve (ROC) was utilized to test the classification accuracy of the estimated model. The ROC curve tests the predictive performance of the estimated model on the REIT life cycle stage classification, relative to the odds given by just a random flip of a coin. Hence, the ROC curve measures the ability of the specified model to capture positive cases of REIT life cycle phases. The ROC curve plots the false positive rate on the x-axis, hence, the ability of incorrectly identifying the corporate life cycle stage of the firm, against the true positive rate on the y-axis, across all decision levels. The Area Under the Curve (AUC) provides an aggregate measure of performance across all the possible classification thresholds and ranges between values of 0.5–1.0. The higher (and to the left) the AUC, the better the predicting ability of the specified model(s) against the odds of the “coin flip”.
Figure 2 displays the multiclass ROC curves of the baseline model against four alternative model specifications (models 2, 3, 4 and 5). The AUC test statistic was identical when comparing the base line model with models 2–5. Indeed, all model specifications suggested a good level of performance with an AUC close to 1, and, hence, each of the models considered in the empirical analysis outperformed the “coin flip”. It is also noted that model 3, which considered all explanatory variables, but only excluded the market to book and the return on equity variable, displayed the highest predictive ability, relative to the other models.
5. Conclusions
This study examines the predictability of financial accounting ratios on the corporate life cycle of a firm. The study concentrates on the European REIT market and uses an extended dataset of 130 publicly traded REITs, over the period 2006–2023. This is the first study to explore the relationship between financial–accounting indicators and the firm’s corporate life cycle, concentrating on the REIT market. A multinomial panel logit regression model is used, on both univariate and multivariate settings, to assess the classification probability as a function of the financial–accounting variables, such as the dividend distribution, leverage, return on equity, market to book ratio, sales, and size. The empirical results suggest that higher leverage is related to a raised probability of an REIT being classified at the early stage of its corporate life cycle. The findings also denote that positive leverage variation is associated with an elevated probability of an REIT being categorized in the shake-out stage. The REITs that display negative variation in revenues, size or dividend pay-outs are more likely to be classified in the decline stage, as opposed to the maturity phase.
The findings of the study are consistent with the hypotheses developed, suggesting that leverage rate, dividend distribution, size and sales have significant predictive powers over the corporate life cycle classification of an REIT.
The above-described financial–accounting indicators could be used for monitoring corporate stability and for developing early warning systems.
Given that risks and opportunities vary across the different stages of a firm’s corporate life cycle, a firm’s life cycle stage is likely to influence a firm’s strategy regarding different stakeholders (shareholders, suppliers, customers, employees, creditors etc.), which altogether compose the firm’s resources. Therefore, predicting the parameters that influence the firm’s life cycle phase may help the firm to develop a more efficient way to manage its main resources. According to the specific life cycle phase of a firm, it may opt to treat a group of stakeholders that it considers more important differently (or to rely more on a specific group).
A limitation of the study worth noting is related to the risk of mismatching cash flow activities and misstating the categorically dependent variable during the ex-ante classification of the REIT firm at a distinct life cycle stage. Another limitation is related to the opaque exclusion approach provided by the CF methodology with respect to firm classification at the shake-out stage.
This is a research gap and an interesting topic which could be addressed by future studies. Additionally, future studies could use different proxies for the explanatory variables to assess the predictability of financial accounting ratios on an REIT’s corporate life cycle stage.


