1. Introduction
According to Regulation (EU) 2019/631, CO
2 emission standards for new passenger cars in the European Union were set to be reached in 2021 and further reduced by 37.5% until 2030, through an incentive mechanism for zero- and low-emission vehicles (ZLEV) that are credited multiple times for the calculation of the obligatory average fleet emissions, as well as through national tax systems. However, in March 2023, the European Parliament amended that regulation and set a more ambitious target for the reduction of emissions by 55% until 2030 and 100% by 2035. This was a part of the “Fit for 55” package, which aimed to reduce overall greenhouse gas emissions by that percentage until 2030, together with a revision of the Renewable Energy Directive, Energy Efficiency Directive, and Energy Taxation Directive. The impact assessment for amending the regulation projected a reduction in emissions created by transport of 33% in 2030 and above 83% in 2040 in comparison to 2005 levels (
European Commission 2021a).
Strengthening of regulations is very much needed while road transport is the sole segment without reduction of emissions of greenhouse gasses, which actually increased by 21% in 2021, as compared to 1990, while overall emissions were very successfully reduced by 30% in the European Union in the same period (
European Environment Agency 2023). Transport will become greener soon with a dynamic increase in the share of battery electric vehicles (BEV) in total sales of new passenger cars in the European Union to 12.1% in 2022, with a further 9.4% of plug-in hybrid electric vehicles (PHEVs) according to
ACEA (
2023) data. While these developments are considered a great success, they come with a cost. Worldwide electric vehicle (EV) sales are stimulated by public spending on subsidies and incentives that nearly doubled in 2021 to reach USD 30 billion, 12.5 of which accounts for European countries (
IEA 2022). Apart from budget spending on explicit incentives, with the increased use of electricity in transport, Europe will face further fiscal pressure through indirect stimuli due to the fact that oil products are much more taxed than electrical energy, which may result in a decrease in the net fuel tax at a level of USD 35 billion until 2030 (
IEA 2022).
Therefore, subsidizing the purchase and operation of EVs at the current level may not be sustainable, while a thorough redesign of the tax system on vehicle purchase and ownership as well as on fuel and electricity is needed. Several countries have already started lowering the amounts of subsidies or substantially changing levels and criteria for their distribution, which may result in a stall in the adoption of EVs in the transition period until 2035, when the ban on internal combustion engine (ICE)-powered personal vehicles will become operative. On the other hand, there is a growing concern that lower-income households, regions, and countries will not be able to cope with the ongoing developments, which include a significant increase of the prices of new vehicles, as a result of increased prices of raw materials and costly technical solutions to cope with the stringent emission and safety standards. Regardless, it is necessary to thoroughly rethink the overall system of vehicle taxation to come up with optimal solutions.
A recent comprehensive study on the taxation of electric vehicles (
Transport & Environment 2022) set 17 principles for appropriate tax policies regarding vehicles. These include creating a simple, transparent, yet flexible system with clear objectives and an assessment of direct and indirect impacts. A tax system will be based on the sustainable cost/benefit principle, i.e., targeting vehicles with the largest total annual emissions of pollution, while the taxes and subsidies will be applied in a socially just and equitable manner. A cross-country analysis also included in the cited study indicated that most of the European countries have tax policies that significantly differ from these principles, as well as from each other. In the study on fiscal incentives for purchasing efficient and environment friendly vehicles (
IRMO 2013), similar basic principles were set, comprising of, however, only three components. The first principle was that the system of taxes and incentives will be as much as possible fiscally neutral, meaning creating a smart, simple, transparent, and long-lasting system with a large impact, without much taxpayers’ money spent or taxes relieved, especially by avoiding a “campaign” approach with large de facto subsidies that will be subsequently reduced. Additionally, for any change in the fiscal framework, a sound and realistic impact assessment was advised, including the reaction of buyers and impacts on the environment and energy markets. The second principle was not to direct tax money to rich people who can afford high-tech vehicles anyway, as well as not to invent new taxes on the existing vehicles while the less wealthy population cannot afford to replace them with new ones. The third principle suggested that a taxation system should be as efficient as possible if it is set to be explicit, progressive, consistent, and directly linked to incremental increases in the key indicators of emissions and energy efficiency. To a large extent, these principles were accepted by relevant Croatian authorities, which had a significant impact on buying new cars; however, they were not applied for imports of used cars.
Nevertheless, issues of designing an optimal tax system to maintain a smooth and efficient transition towards zero emission transport are still open between policymakers and within the scientific community. Although financial incentives are important to support the uptake of EVs, special attention should be given to their design and implementation to ensure that they are efficient and do not benefit only the wealthy population. Therefore, the main aim of this paper is to investigate how the existing tax systems in the selected European countries go in line with the presented basic principles of taxation of vehicles, i.e., where they are set according to the basic idea “polluter pays”, as well as where they benefit the less wealthy population more and if they are actually efficient.
Environmental tax proved to increase energy efficiency and productivity while stimulating firms to cut emissions, optimize energy consumption, and lean towards clean industries (
Yasmeen et al. 2023). Using the framework of the game theory of decision making,
Jafari (
2023) showed that a reduction in tax rates on energy-efficient products leads to clear benefits both for consumers and the government.
Zheng et al. (
2023) used an adjusted hoteling model for simulating the effects of the possible introduction of carbon taxes in China and concluded that the dynamic carbon tax mechanism would be favourable for the development of the manufacturing of electric vehicles.
Despite the rapid rise in EV adoption, road transport is still not on track to reach carbon neutrality by 2050. Energy prices have been rising due to the Russian invasion of Ukraine and will remain highly volatile throughout the next several years. Additionally, there is an issue of an increase in total global electricity consumption from the current level of 25,000 to 40,000 TWh until 2050, of which 21% will be consumed by electric vehicles, while the use of electricity for heating and industry will also significantly increase (
European Commission 2021b). However, within the EU Reference Scenario, electricity prices shall start falling by 2% annually after 2030, due to the dynamic growth of the use of renewable energies in the production of electricity (
European Commission 2021b). There are also issues with the skyrocketing demand and prices of certain critical raw materials needed for the adoption of electricity powered vehicles. This is evident from the scenario that demand for lithium may increase six times from 2018 to 2030, which will not be met by the supply side (
WEF 2019).
These uncertainties also put a question mark over the year when the production costs of battery powered vehicles will equal those of internal combustion engine vehicles (ICE), making subsidies unnecessary. The idea behind purchase grants is to subsidize a new, beneficial, but more expensive technology in the early phases of adoption until parity in total costs of ownership (TCO) is reached. The European Commission’s impact assessment assumed a decrease in the BEV’s purchase price due to declining production costs. Recent literature has come to somewhat different findings.
van Velzen et al. (
2019) argued that many EVs were sold below production costs, and producers will subsequently keep prices high to recover the high investment costs. The Bloomberg NEF research study (
Bloomberg NEF 2021) estimated the year of price parity as “mid 2020’s”, which is almost identical to the European Consumer Organization (BEUC) study’s (
BEUC 2021) estimate that the parity year shall be as soon as 2026. There is also less optimistic research like
Miller’s (
2020), with parity expected by the end of the decade. Disagreements may stem from methodologies and assumptions used in the projection scenarios, while most of the research in this field used models that rely on production costs and advances in technology without much reference to the overall developments in the underlying market factors, including differences in the price of electricity over fossil fuels as well as explicit and implicit taxation on energy and the purchase and use of vehicles. The model used by
Goetzel and Hasanuzzaman (
2022) focused on recent real-world data on prices and sales of three types of vehicles and for the German market they indicated that large and more expensive passenger cars (segment E/F) may get to price parity (without explicit subsidies) as soon as 2023, while medium sized cars shall reach that point in 2026, and small and less expensive cars not before 2029. If these estimates prove to be accurate, it seems that widespread public opinion that European governments were subsidizing wealthy citizens for buying expensive, large, and heavy vehicles, while failing to provide any significant stimulus for buyers of small and less expensive vehicles is true.
Regarding the impact of subsidies, there is an inherent problem in capturing the real-world behaviour of buyers that try to overexploit subsidies if there is an announcement that they will be reduced, with a sharp decrease in sales after that. This is evident from the data for China, with a dynamic increase in sales of EVs at the end of 2022, and a 50% fall in January 2023.
On the other hand, with rising prices of all passenger cars, both electric and petrol-powered, medium- to lower-income households in rich European countries, as well as the majority of the population in less wealthy states, may only buy cheaper and smaller cars that are less subsidised, while some countries have already started to eliminate the fiscal incentives altogether. Since 2020, Germany has provided the most generous financial support with purchase subsidies up to EUR 9000, which had an immediate market impact: sales of BEV and PHEV vehicles rose by more than 200% in 2020 (
Wittich 2021). However, subsidies for PHEVs in Germany were completely abolished in 2023, while those for BEVs were reduced to EUR 4000, to be annihilated by 2026. Still, the evident and dynamic increase in sales of electrically powered vehicles may have been at least partly the result of uncertainties following the war in Ukraine and eliminating subsidies, together with a shortage of affordable EVs, which may lead to a stall in sales that could make scenarios of a sharp reduction in greenhouse gasses from transport and traffic not realistic.
The aim of the study was to investigate and test two main hypotheses:
H1. Tax systems regarding passenger vehicles in the countries under review were well designed to create adequate effects in the reduction of CO2 emissions and were directed more to vehicles affordable to less wealthy households;
H2. Tax systems regarding passenger vehicles in the countries under review were effective in stimulating sales of battery-powered electric vehicles.
2. Materials and Methods
In order to investigate the described research problem and try to answer the raised research questions, this paper relied on the methodological approach of calculating and comparing the total costs of ownership (TCO) of passenger cars with 3 main types of propulsion (BEV, PHEV, and ICE), including the fiscal costs for savings a unit of CO2 emissions of passenger vehicles regarding their size (small and SUV) and ownership (private and business-owned). The second part of the research employed regression statistical analyses to assess the impacts of fiscal incentives on the uptake of battery electric vehicles by countries. The analysis was carried out for 31 countries, i.e., 27 members of the European Union, together with Iceland, Norway, Switzerland, and the United Kingdom. These countries were included due to the availability of data on taxes and incentives as well as sales by categories of vehicles.
The first step of the analysis was to capture data on taxes and incentives on battery powered electric vehicles and plug-in hybrid electric vehicles as compared to vehicles with internal combustion engines in the selected European countries. National fiscal systems concerning vehicles are extremely complicated, consisting of taxation and grants on purchasing new cars, annual taxes on ownership, benefit-in-kind taxes, as well as tax deductions and depreciation for corporate vehicles. They are also far from transparent, with hardly any similarities between countries. Taxation and grants may be linked to the value of vehicles, engine power and capacity, weight and length, emission indicators, and type of fuel, each of which is different for private and corporate cars. Additionally, some countries provide for purchase grants for zero-emission cars using additional criteria like price thresholds, private or corporate registration, scrapping bonuses, etc.
This analysis relied on the recently published analysis of national fiscal systems, conducted by Transport & Environment, Europe’s leading clean transport campaign group (
Transport & Environment 2022). This report is the first and most valuable comprehensive study into the systems of car taxation in 31 European countries, including almost all forms of taxation. Therefore, the presented analysis employed most of the basic assumptions of the cited study, but with certain additions and modifications. As a dependent variable for the model used in the research behind this paper was the share of BEVs in total sales in 2021 and 2022, national sources were checked to capture incentives that were used for most of the year, while the cited study captured the status as of the end of 2022. Additionally, the problem of very limited total available funds for purchase grants in three countries (Croatia, Estonia, and the Netherlands) that were exhausted in a few days was solved with the assumption that only half of the nominally available explicit purchase incentives per vehicle were actually available. Additionally, the analysis included assumptions about the value loss that were not used in the cited research.
In order to distinguish between active measures targeted at the purchase and ownership of vehicles and the benefits that come from using cheaper electricity instead of petrol, our analysis used sources other than the cited study on the taxes (and prices) of gasoline and electricity, and the assumptions on vehicle consumption were also different from those in the cited research. PHEV consumption was assumed to capture the real-world data, much higher than type-approval values, while only 37% of the mileage for private cars and 20% of business-owned cars are driven using electricity for propulsion (
Plötz et al. 2021). The basic assumptions used in this paper are specified in
Table 1.
To make the analysis feasible, a simple indicator was calculated as implicit total de facto subsidies on the purchase and usage of BEVs and PHEVs as compared to vehicles powered by internal combustion engines, starting from the data on total fiscal duties published in the cited research, recalculating the incentives and value added tax and subtracting fiscal duties on petrol, calculated using Weekly Oil Bulletin data of the European Commission for mid-year 2021 and 2022, and on electricity using Eurostat data for the first half of 2021 and 2022. All data sources are specified in the annexed Data Availability Statement.
For electricity prices, we used Eurostat data for average household consumers, including taxes and levies, while most EV owners opt to charge their vehicles at the lowest prices available. Data on carbon dioxide emissions were calculated based on an indicator of the amount of carbon dioxide produced by burning 1 litre of gasoline fuel (2390 g) and the EU27 average data on greenhouse gas emissions from electricity generation (275 g CO2e/kWh). Losses in transport and charging were implicitly calculated in the assumed consumption of vehicles.
Based on the mentioned data sources, two main indicators were calculated for the country-level analyses:
- (a)
Passive price difference of owning and operating BEV and PHEV over petrol powered vehicles, not directly influenced by specific policies, calculated by subtracting the difference in value loss over 4 years from the savings on fuel by using BEV and PHEV over the same period;
- (b)
Implicit or de facto active subsidies, calculated as the difference in all fiscal duties on ownership and usage of BEV and PHEV compared to ICE vehicles over 4 years, not including taxes on fuel.
After that, a calculation of the amount of active de facto subsidies per 1 ton of CO2 saved was performed for all vehicle categories and countries under review, as well as the average for all countries. Additionally, an “ideal” system of subsidies was constructed with exactly the same amount of total (passive and active) subsidies per 1 ton of CO2 saved over a similar ICE vehicle, arbitrary set as EUR 1000 of total fiscal stimulus allocated for 1 ton of saved CO2 over 4 years. Following that, relative overshooting of actual vs. “ideal” de facto subsidies was calculated for all the countries included in the sample, as well as differences in de facto subsidies for private SUVs over small cars, as an indicator of the social component of national systems of taxes on the purchase and ownership of passenger cars.
The second part of the analysis was focused on research on the impact of tax systems and other possible factors that influence the share of BEV in total sales by countries. The analysis was focused on the variables, for which a description and rationale for use are stated in
Table 2, while all other background indicators as well as data sources are specified in the Data Availability Statement.
For these variables, basic descriptive statistics were calculated, and the test of normality of distribution (kurtosis and skewness) was carried out for pooled data for both years (2021 and 2022). Additionally, a correlation table was computed to indicate possibilities for testing the joint impact of the predictor variables on the sales of battery electric vehicles (
Table 3).
The initial dependent variable (share of BEVs in total sales by countries) is identified as not having a normal distribution by skewness (3.2) and kurtosis (12.4) that was above the reference values. As suggested by
Kline (
2023), data severely deviate from normality if the values of skewness and kurtosis are above 3 and 10, respectively. Therefore, a log transformation is performed for the variable BEVPER, and the transformed variable BEVPERLOG has a normal distribution. As the dependent variable is log transformed, the regression is not simple linear but of the exponential type to match the shape of the curve of the initial dependent variable. Pooled regressions with log transformed variables have much higher values of coefficients of determination (R
2) and statistical significance (
p-values) below the 0.05 threshold. The correlation matrix between the candidates for independent variables was calculated as an early detection of the multicollinearity problem, which occurs when the independent variables are highly correlated to each other while the standard error of the regression coefficient increases, and the statistical significance of these coefficients becomes unreliable. Most of the variables were moderately to highly correlated, with the exception of the SH variable (share of population living in houses in towns and suburbs), which had low correlation coefficients (below 0.4) against all variables except for CON. Therefore, the SH variable was used for multiple regression together with the other 3 variables (GOF, TPD, and DFS), controlled by using the variance inflation factor (VIF) to detect multicollinearity. Apart from these, simple regression was also carried out with the 5 independent variables mentioned.
All 8 regressions were performed as panel data regressions with random effects, according to the results of the Hausman test, with the null hypothesis that individual characteristics are correlated with the repressors. A Breusch–Pagan Lagrange Multiplier test was applied to indicate if the random effects were significant. p-values for all independent variables were controlled to test the null hypothesis that the variable has no correlation with the dependent variable. A regression with robust standard errors was performed to test if the random effect model is robust to heteroscedasticity for all regressions. The coefficients of determination are presented as R2 between (variance between separate panel units), R2 within (variance within the panel units) and R2 overall, as the weighted average of these two. For the multiple regression with the value close to moderate, findings were tested for robustness with the reiterated regression by omitting 6 evident outliers, i.e., 3 countries. For the simple panel data regression that had moderate level of determination coefficient, robustness was not tested as the scatter plot did not show evident outliers.
Basic analyses were carried out using Microsoft Excel Data Analysis tools, while regression analysis was done using Stata 18.0 software package.
3. Results
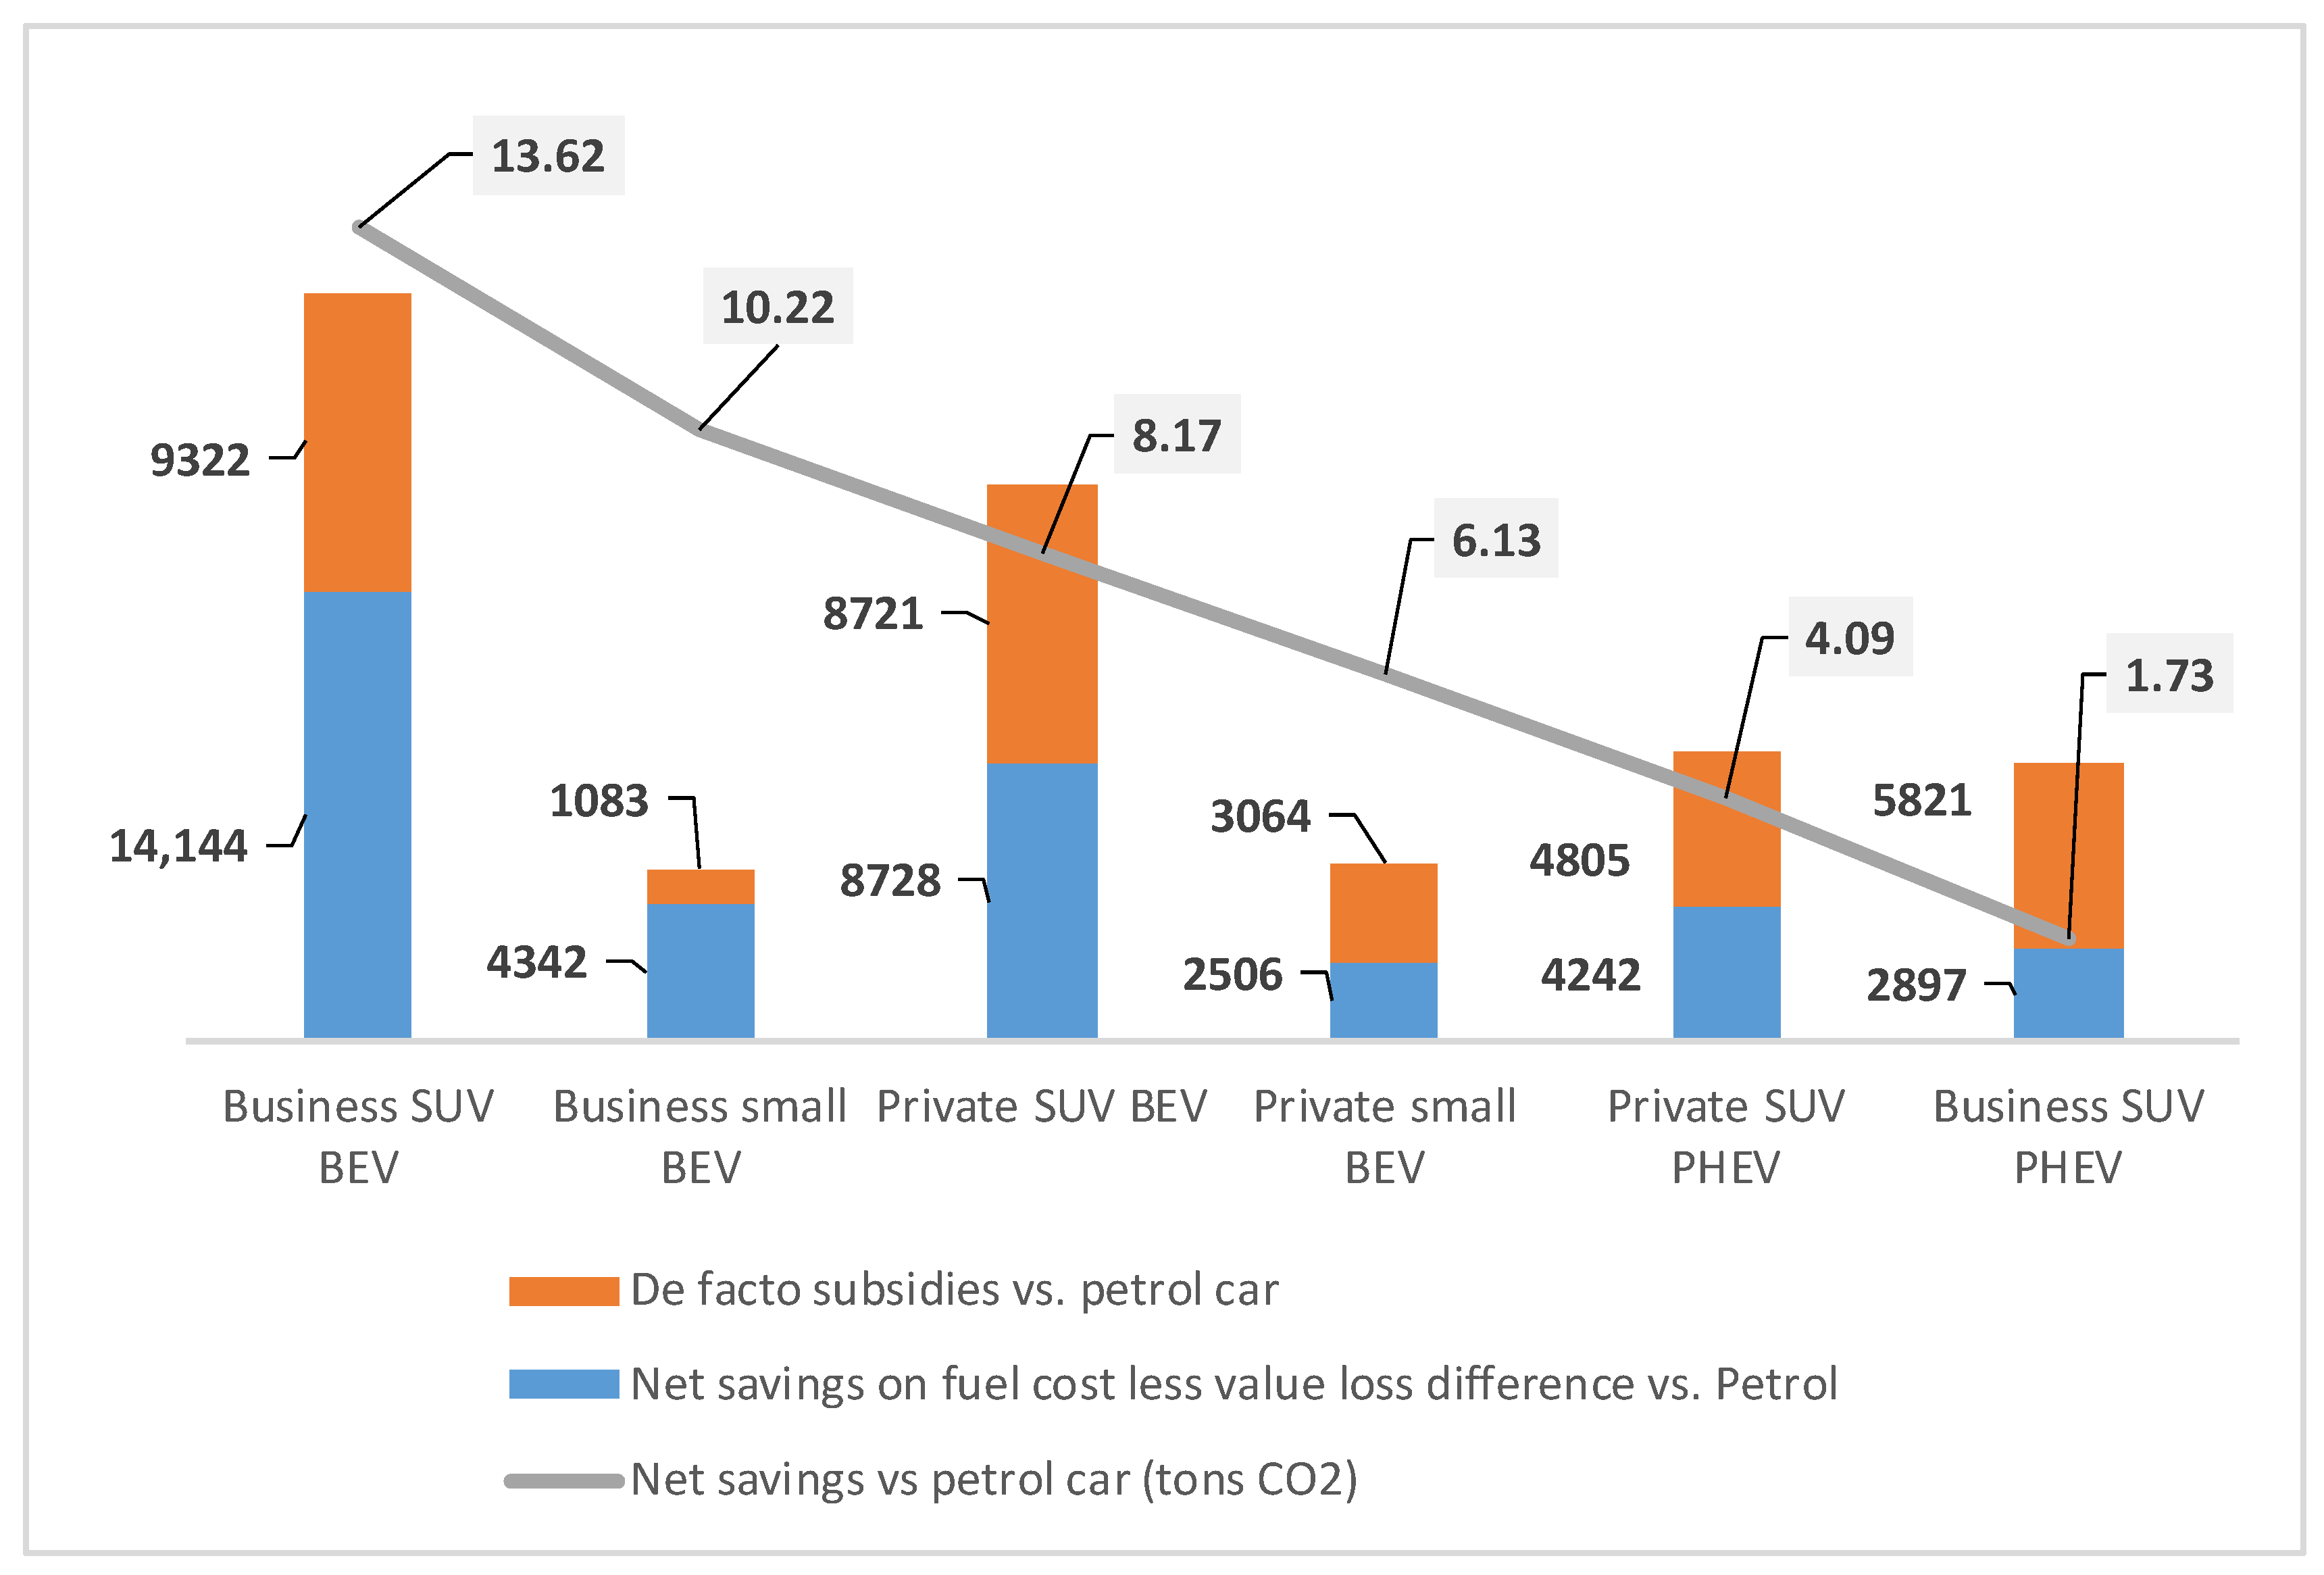
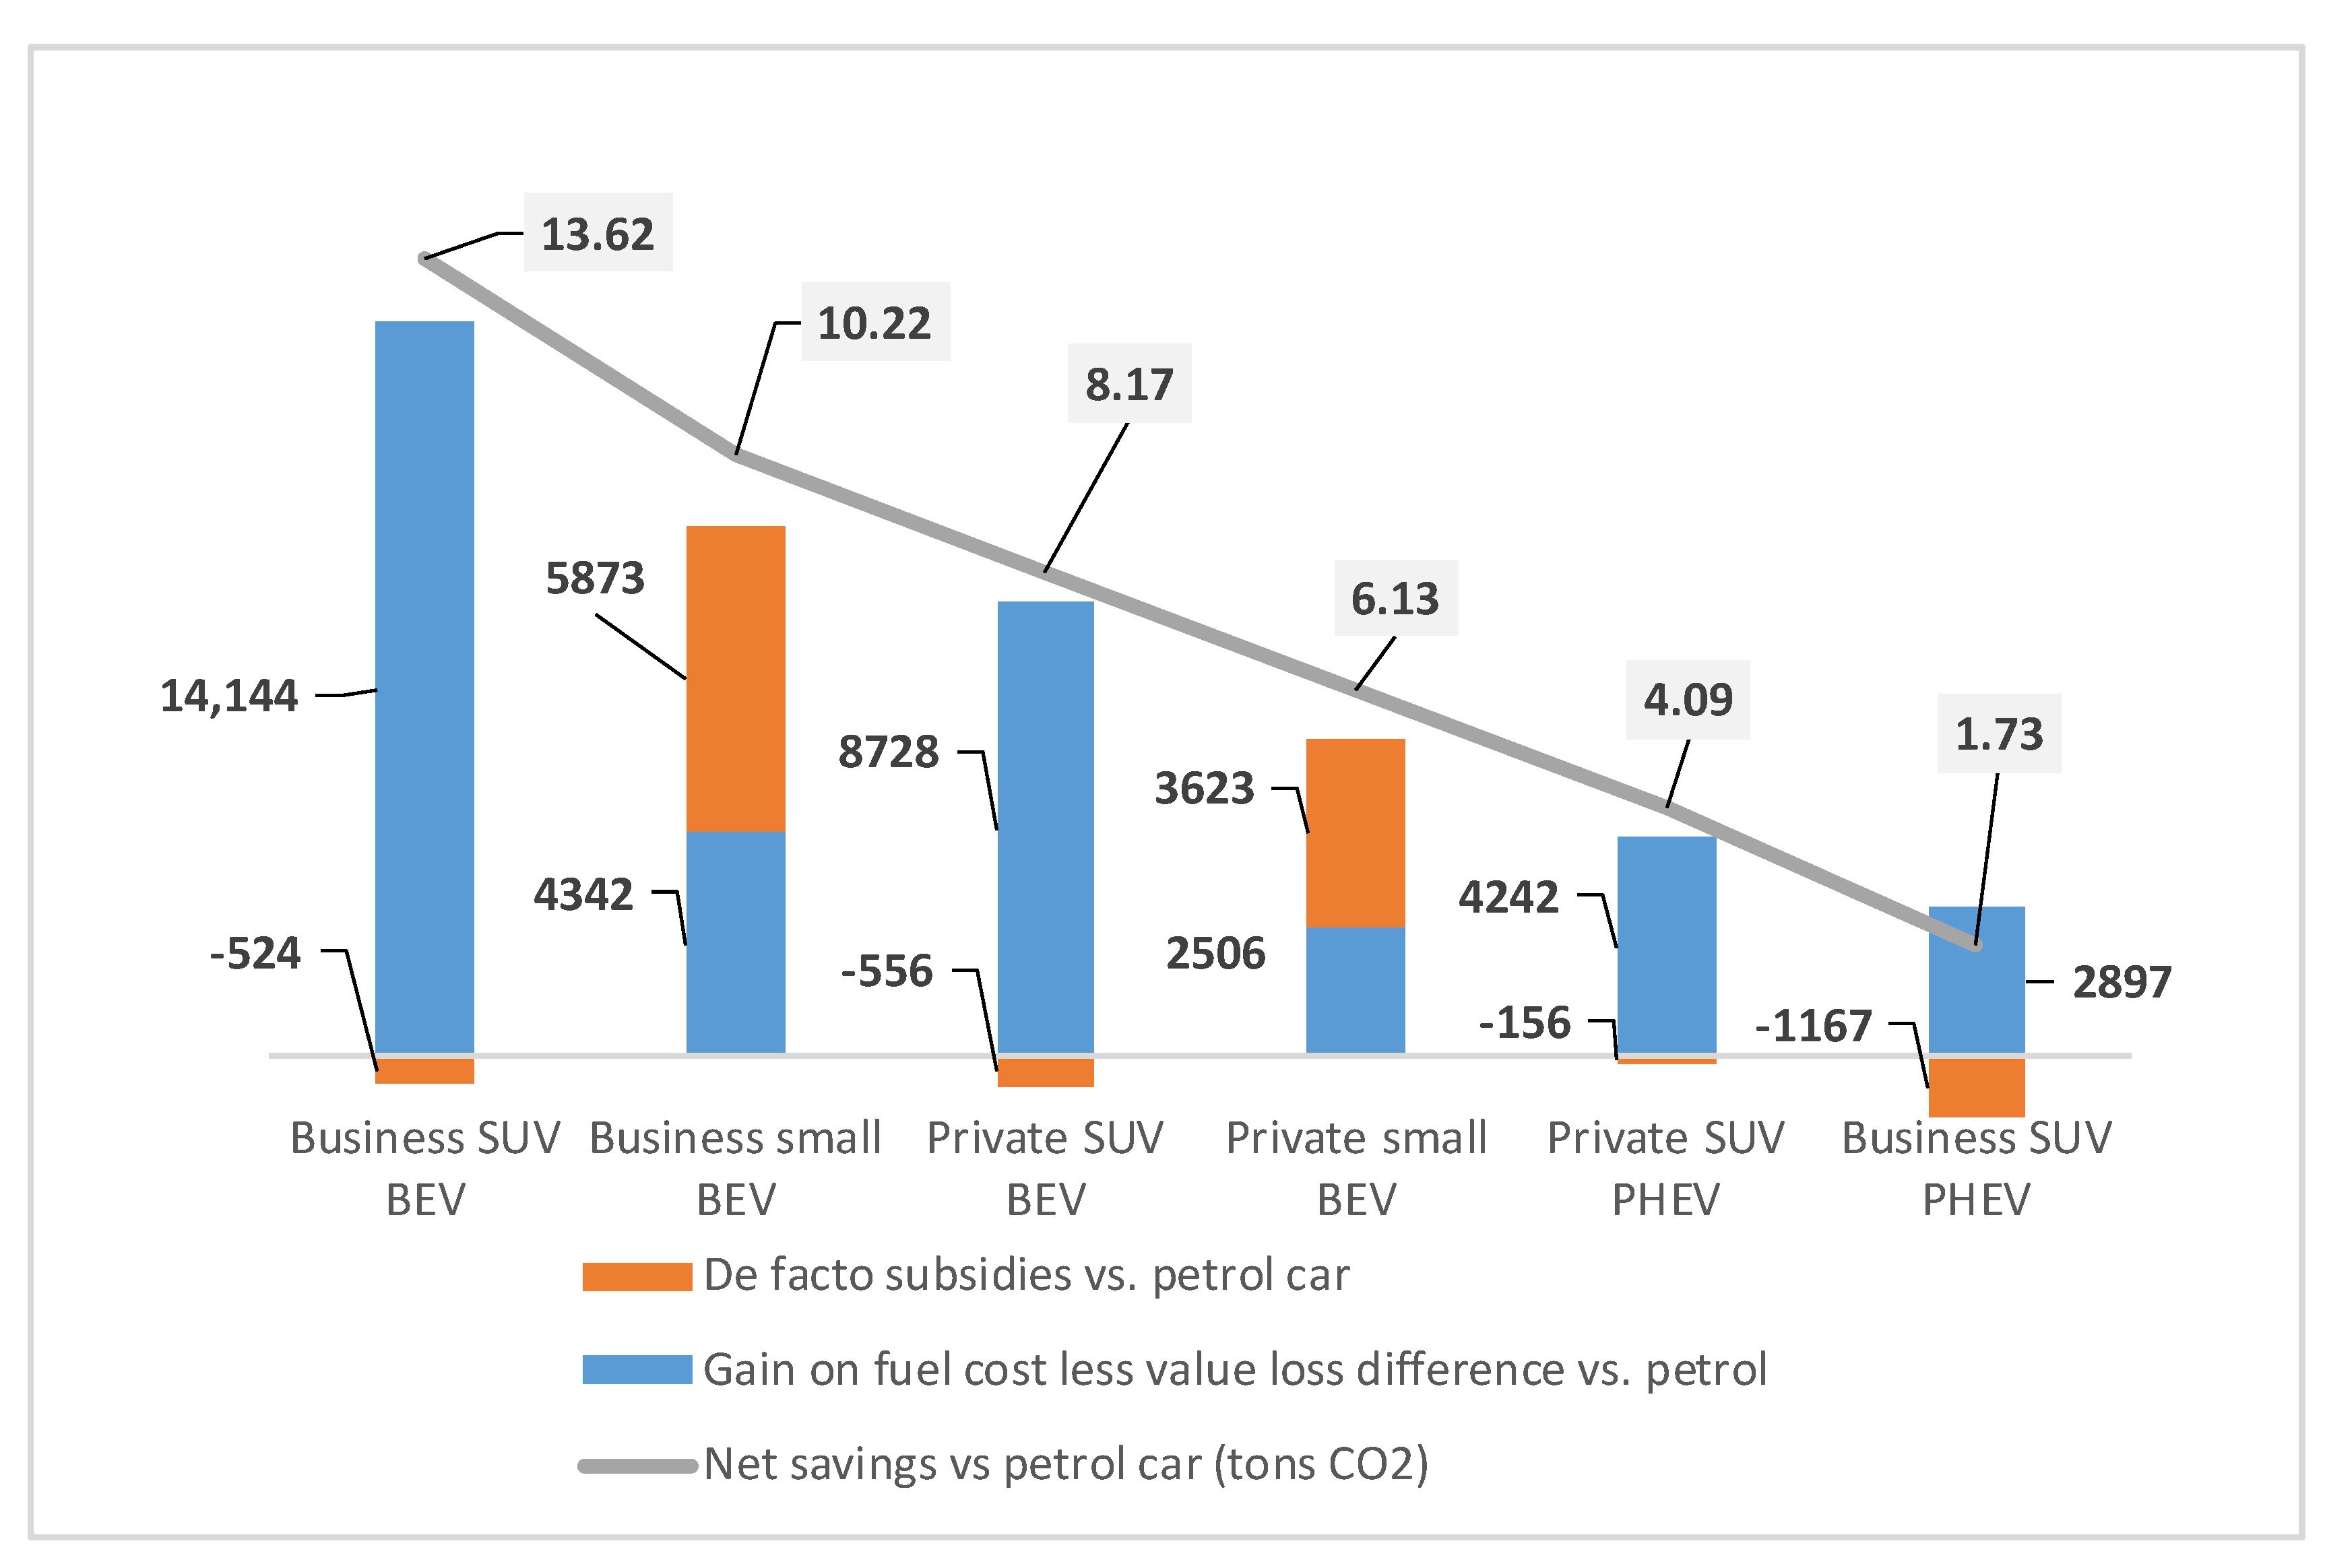
Figure 1 presents two main elements that make the difference between owning and operating EVs and PHEVs as compared to ICE vehicles, calculated as a simple average of data for the individual countries under review. The first is a “passive”, i.e., not directly influenced by specific policies, indicator of the savings on fuel less the difference in the value loss (over 4 years) versus a petrol-powered car. The largest passive gain (EUR 14.1 thousand) is for the business-owned BEV SUV, followed by the same vehicle category when owned privately (EUR 8.7 thousand) due to the assumed lower mileage. Small cars have much lower passive gains over ICE vehicles than SUVs and face higher relative value losses combined with lower gains on fuel, while small ICE vehicles have lower consumption than ICE powered SUVs. Privately owned PHEV SUVs have a passive gain somewhat larger than small BEVs if owned privately and smaller than the same vehicles if owned by businesses. Business-owned PHEV SUVs have very low passive savings over ICE vehicles, due to low usage of the plug-in option while facing a larger value loss than similar ICE vehicles. It should be highlighted that fossil fuels and electricity are similarly taxed on the unit of energy (EUR/MJ), and the advantage of BEVs stems from the approximately three times higher energy efficiency of cars powered by electricity versus those powered by petrol fuels.
For the second element presented in
Figure 1, i.e., implicit or “de facto” subsidies, the difference in all fiscal duties on ownership and usage of BEV and PHEV compared to ICE vehicles was calculated, not including taxes on fuel. Two categories of vehicles that already provide for the largest passive savings (private and business-owned BEV SUVs) also benefit the most from the sizeable active fiscal incentives. On the other hand, instead of compensating the passive disadvantage of owning a small BEV compared to SUVs, the governments of the countries under review applied the rules that resulted in de facto subsidies of only EUR 1.1 thousand per business owned small BEV, so the overall financial benefit of owning a small car as compared to an SUV for business is almost four times lower, in spite of the fact that savings in CO
2 emissions for a small car are only 25% lower than for an SUV. Small BEVs are much less relatively subsidised, mostly because their ICE counterparts are not much taxed anyways, due to their lower base prices. Due to the same reasons, but with the opposite impact, the implicit tax benefits of owning and operating SUV PHEVs over similar ICEs are substantial.
Data on net savings in CO
2 emissions in comparison to a similar petrol car are also presented in
Figure 1. Assumptions for this calculation were previously stated, including data on (EU average) CO
2 emissions in electricity generation. As compared to a similar petrol vehicle over the 4-year period, the highest savings in CO
2 emissions (13.62 tons) are for business SUV BEVs, because of the assumed higher mileage than privately owned vehicles, as well as the savings on fuel costs, while the comparable petrol SUV has a higher consumption than a small car. The least savings in CO
2 emissions (only 1.73 tons) may be expected through the usage of business PHEV SUVs, due to the almost negligible driving in EV mode of this category of vehicles, as specified in the previous chapter.
It is evident that with both categories of financial benefits (active and passive) combined, SUVs seem to be oversubidised, while owning and operating small EVs brings much smaller financial gains. Total financial benefits of BEV SUVs owned by businesses over the 4-year period exceed EUR 23 thousand, and total benefits for small BEVs over similar ICE-powered vehicles are just over EUR 5 thousand, although driving these vehicles using electricity has significant savings on emissions, compared to petrol powered cars. On the other hand, savings on emissions for PHEVs are much smaller, particularly for the business-owned ones, which are not externally charged as often as private ones, while both categories are eligible for rather large de facto subsidies. Data indicate that incentives for business purchases and ownership of PHEVs are totally wrong, being more than five times higher than for a small car, which may save almost six times more CO2 emissions.
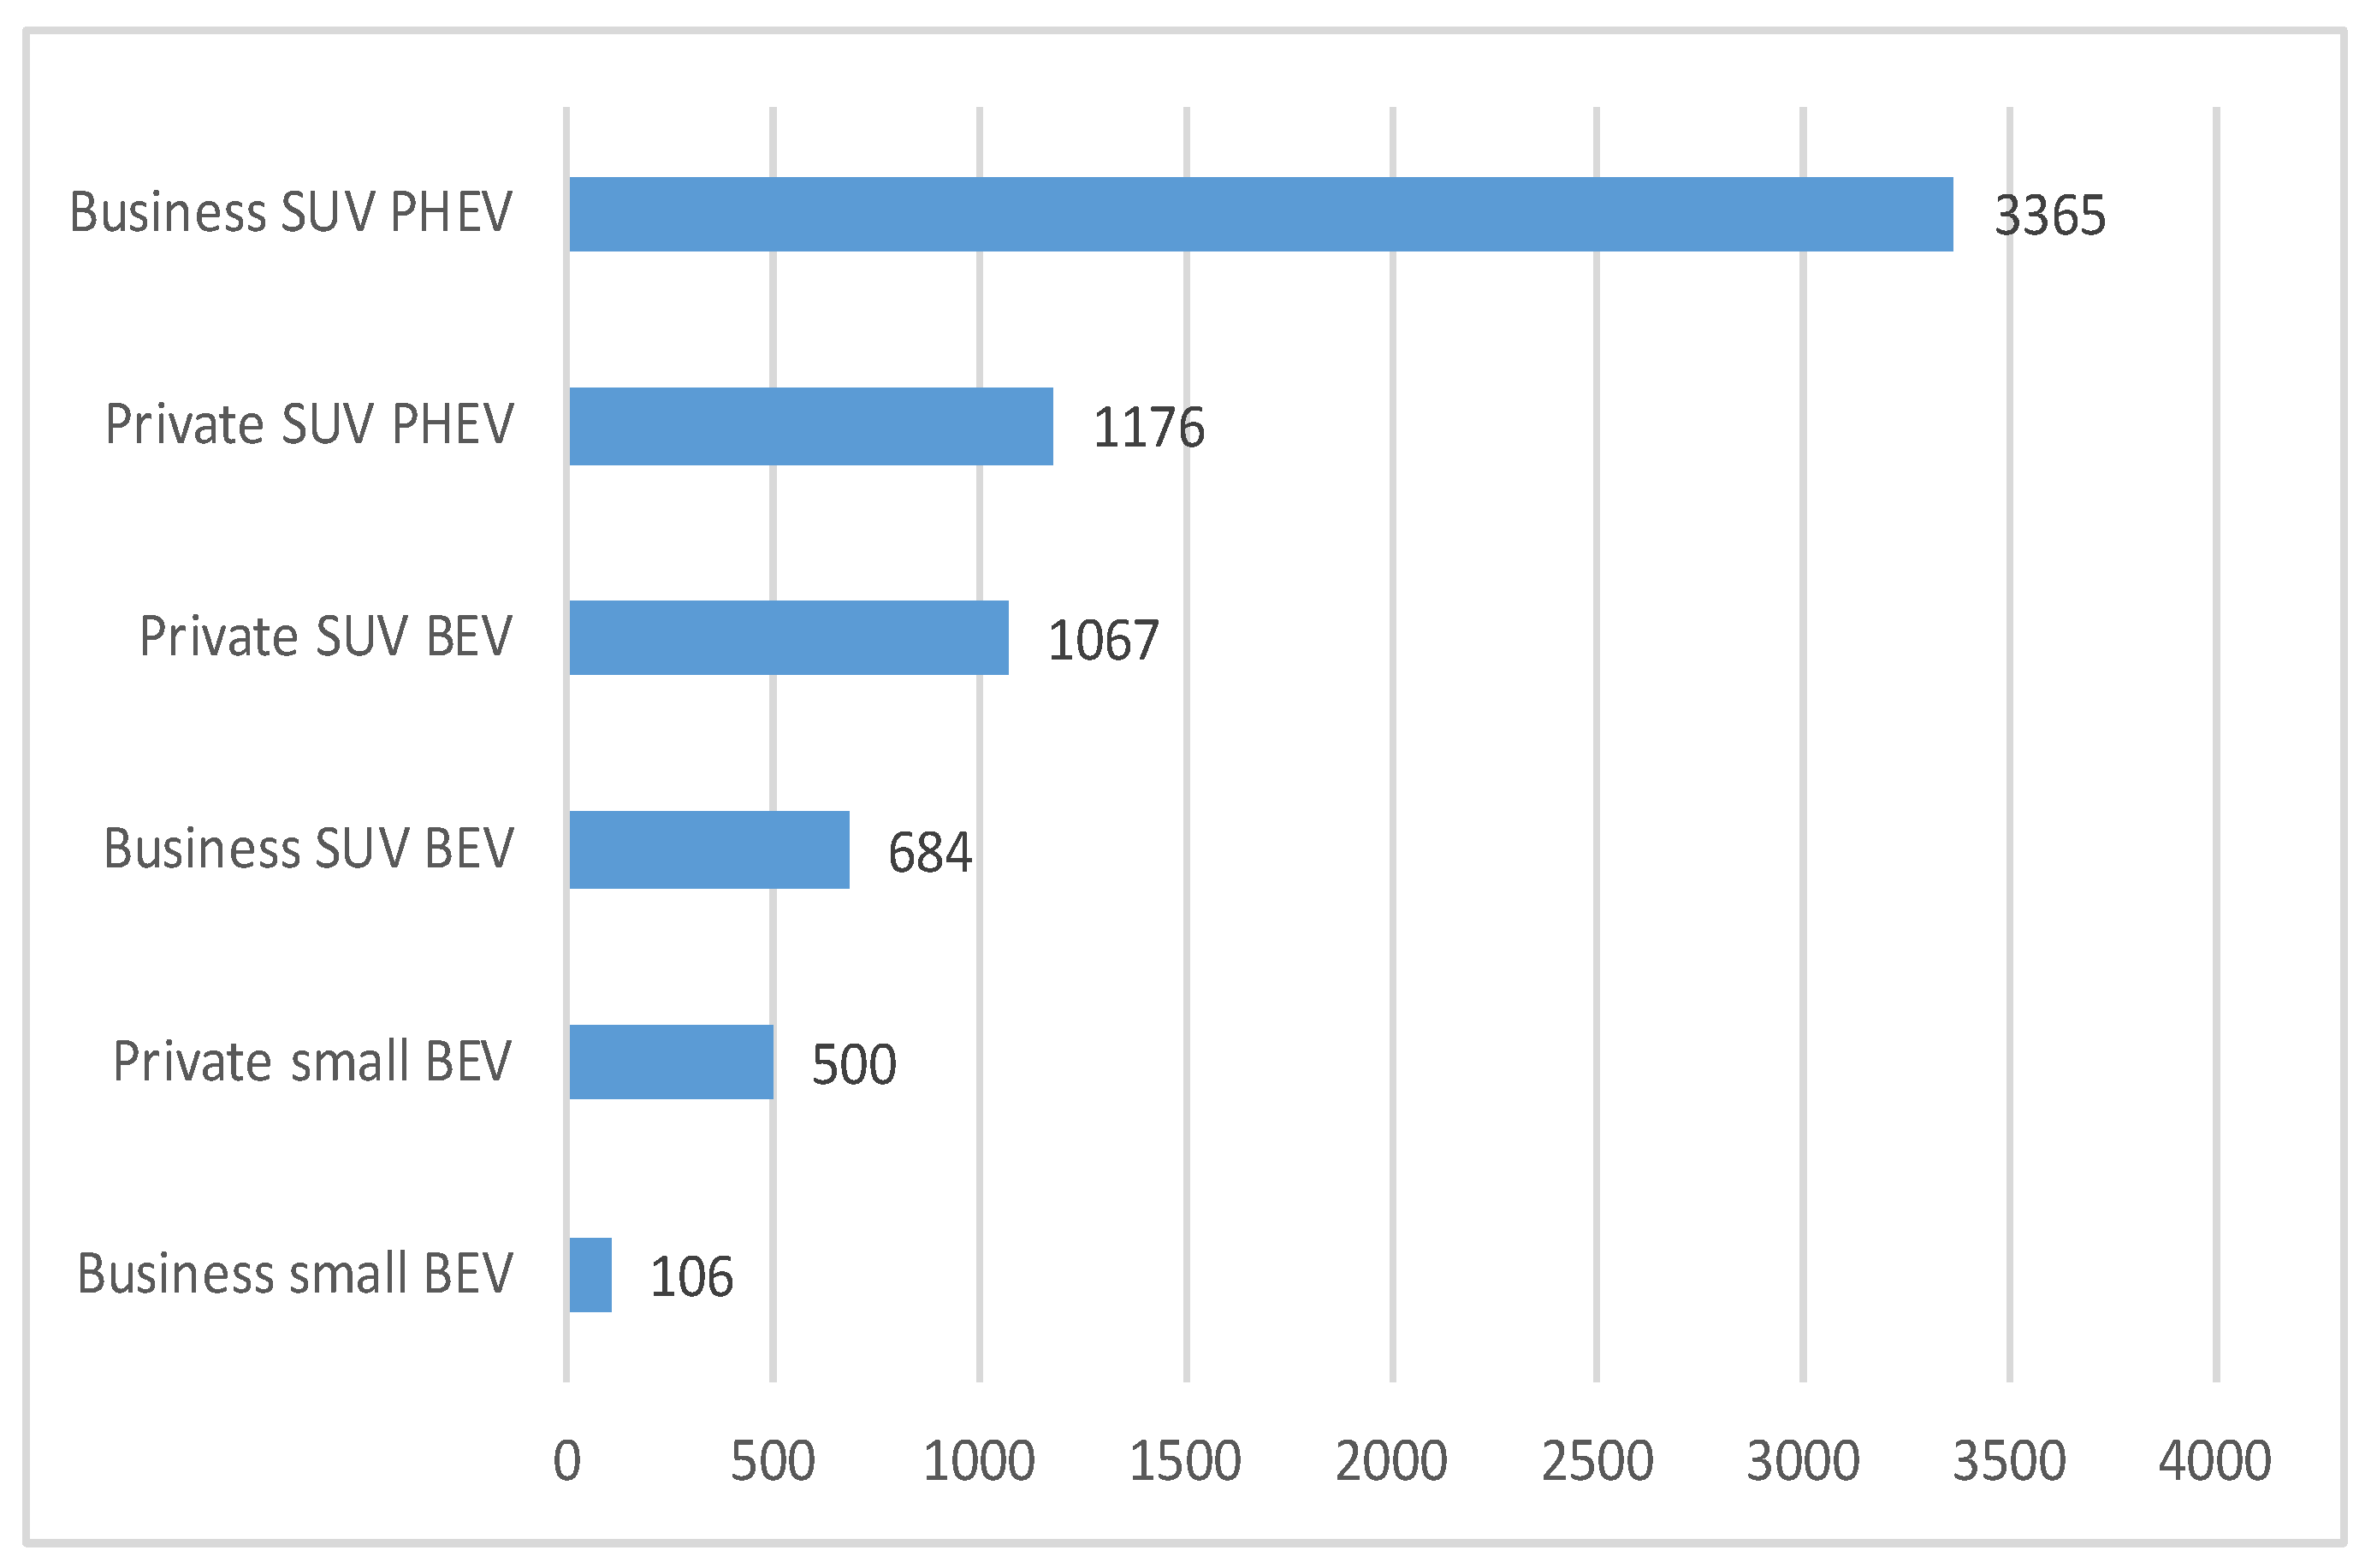
De facto incentives for saving 1 ton of CO
2 for business-owned PHEV SUVs stand at a skyrocketing EUR 3.4 thousand, as compared to EUR 684 for BEV SUVs and a mere EUR 106 for small BEVs (
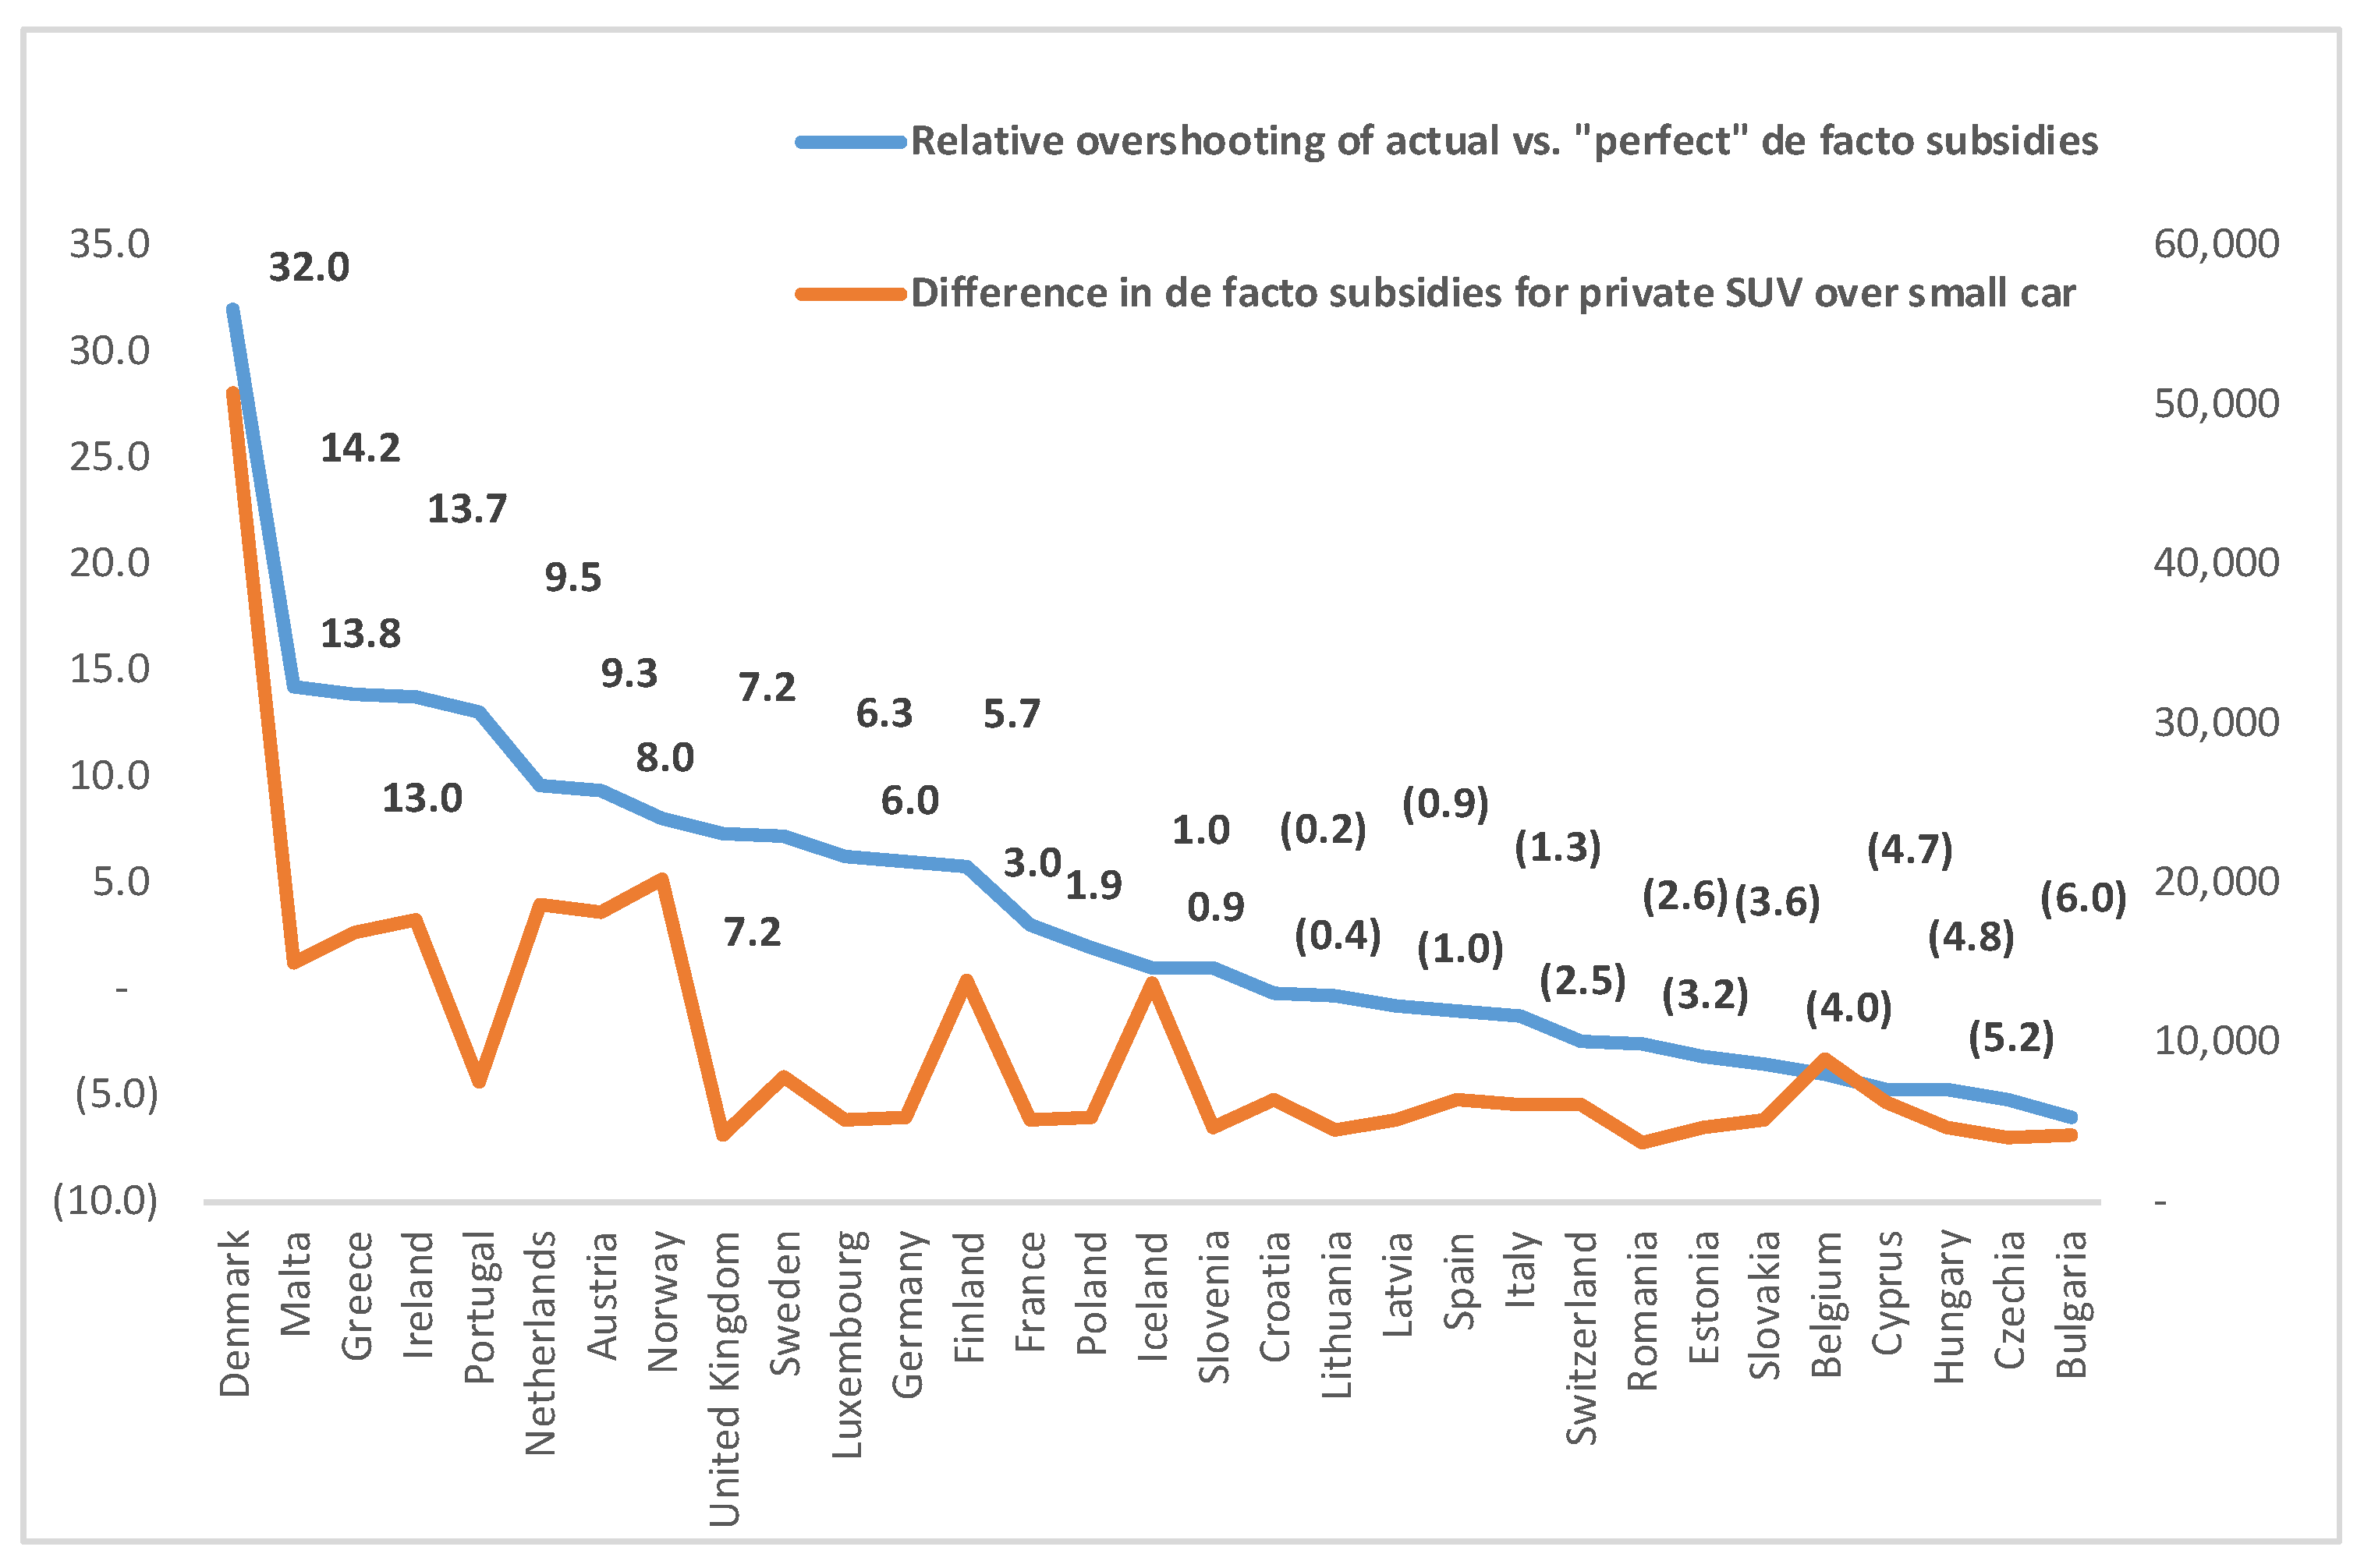
Figure 2). For private ownership, the relations are very similar, while the overshooting of incentives on private ownership for SUVs is even larger than for business ownership, withstanding the difference in savings on emissions due to the assumed lower mileage of privately owned vehicles (
Figure 3). For saving a ton of CO
2 emissions over a 4-year period by a privately owned BEV SUV, more than EUR 1000 of de facto subsidies are spent, while for a small private BEV, it is less than half of that. Adding in the gain on fuel costs, the total incentive to buy a private BEV SUV is 3.1 times higher than to buy a small BEV.
It is evident (
Figure 3) that 11 countries have extreme overshooting of the applied de facto subsidies for buying EVs as compared to petrol-powered vehicles, by more than five times. On the other side of the scale, 14 countries provide de facto subsidies that are less than ideal, as calculated using the presented model and the applied assumptions. Countries that are closest to the ideal level of de facto subsidies for BEVs are Iceland and Slovenia, while Croatia and Lithuania are not far from that level.
However, Iceland has a much less socially oriented system, with a high ratio of de facto subsidies for buying and operating an SUV over a small BEV. Countries that stand out regarding the “social component” from their counterparts with a similar value of the overshooting indicator are Portugal, the United Kingdom, and Romania, while the latter has the lowest ratio of fiscal stimulus to buy and operate SUV BEVs over small BEVs.
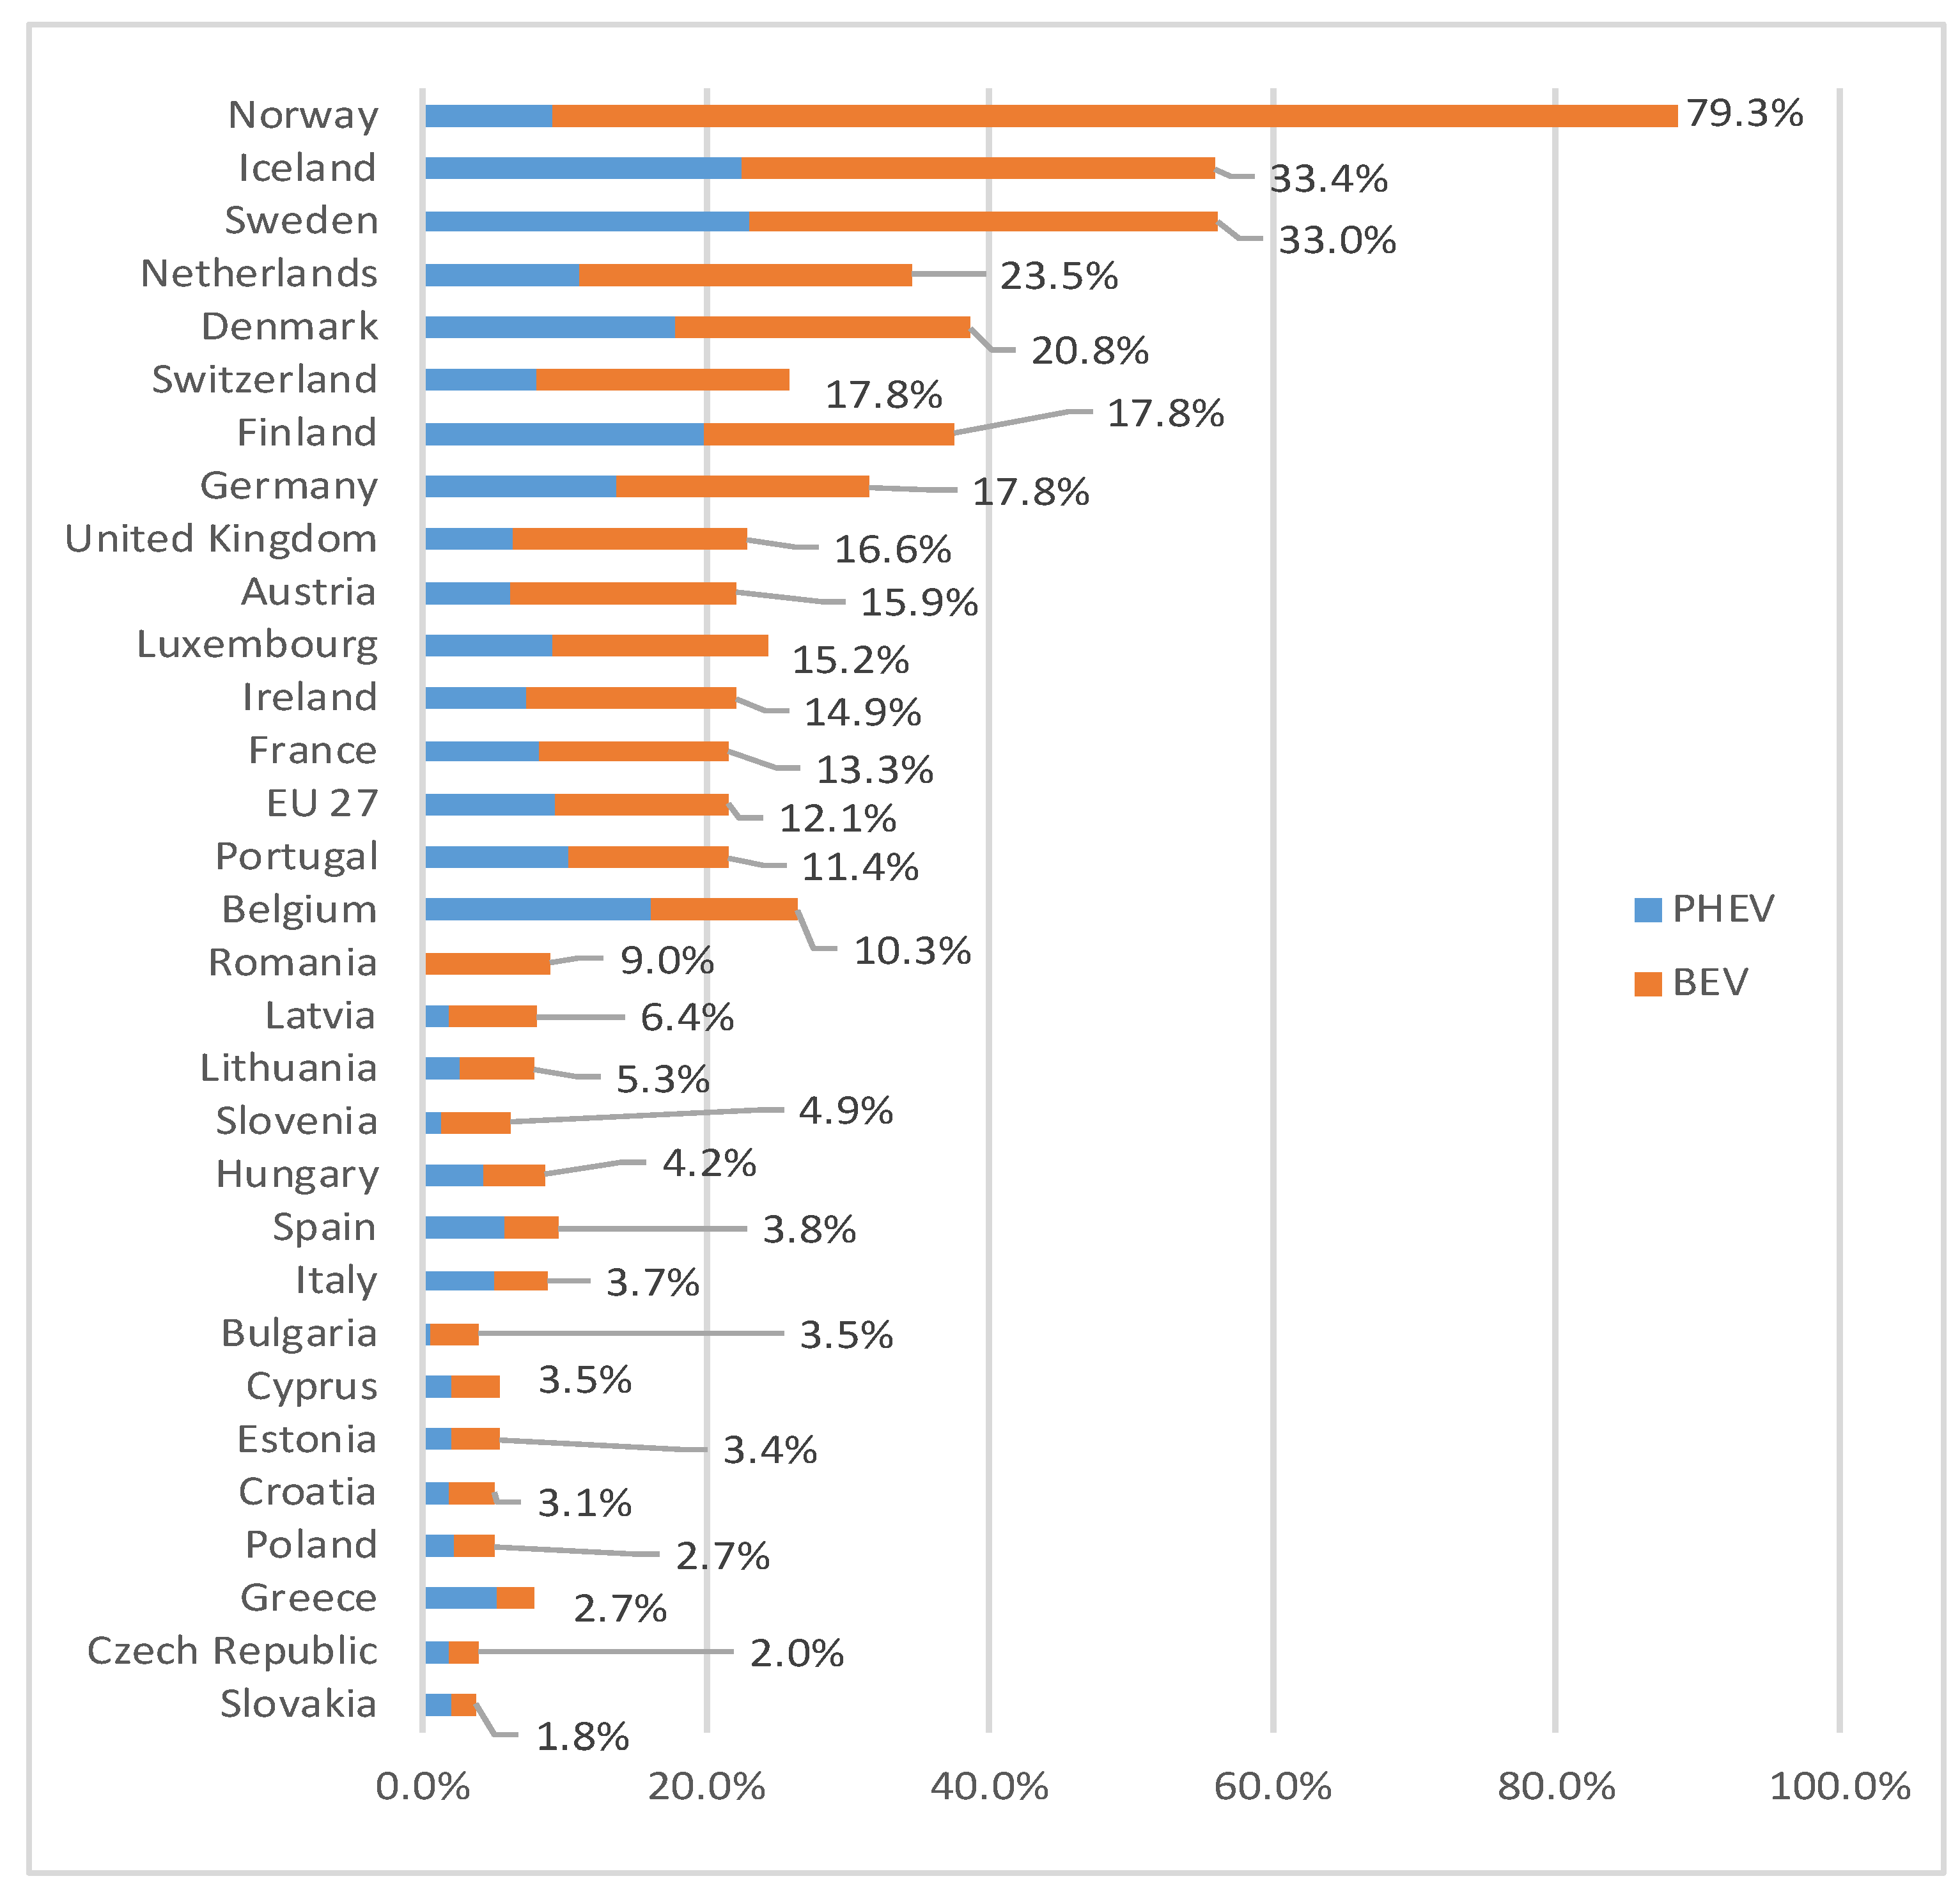
The mentioned design of active measures to buy cheaper EVs may lay behind the success of Romania in achieving a healthy share of 9% of BEV in total sales of passenger cars in 2022 (
Figure 4), by far the best among the countries of southeast Europe, in spite of subsidies that are well below the “ideal” level. On the other hand, Iceland, which perfectly matched the ideal level of de facto subsidies, has gained the second position in the list of the most successful countries by the share of EVs in total sales of new passenger vehicles, whereby the rather high ratio of subsidies for electricity powered SUVs to small cars was not a barrier to the success, which is understandable having in mind that it is a wealthy country.
Iceland, Sweden, Norway, Switzerland, Finland, and the Netherlands placed high above the average relative success (shares of BEVs in total sales per unit of de facto subsidies for BEVs over similar ICE vehicles). On the other hand, Poland, Greece, and Denmark underperformed the most regarding the same. It is interesting to note that seven countries had negative de facto subsidies for the purchase of BEVs, i.e., these were more taxed than the similar ICE vehicles, while a further six countries had very low incentives (below EUR 2000 per vehicle), and all but two of these countries also had very low sales of BEVs.
However, there are other factors that influence the structure of vehicle sales, apart from the tax incentives, and the relationship is not straightforward. The results of the panel data regression with five selected independent variables in simple regression, as well as three multiple regression trials with pairs of variables that are not strongly correlated, are presented in
Table 4. The sample size was 62, which included data for 31 countries and two years (2021 and 2022). The Hausman test with the null hypothesis that individual characteristics are correlated with the explanatory variables was used, and the probability > chi
2 above 0.005 suggested the use of random effects model. Applied Breusch–Pagan Lagrange Multiplier test indicated
p-values less than 0.05, so the random effects are significant; hence, the use of the random effects model is appropriate. Variance Inflation Factor (VIF) test values were low, meaning there was no problem with multicollinearity between the pairs of independent variables.
p-Values were below the 0.05 threshold for all but one regression, while they were sightly above that value for the SH variable in the multiple regression with the TPD variable, so this regression was not taken into account, despite the fact that regression with robust standard errors had satisfactory results. The robust standard error test was performed to conclude that the random effect model is robust to heteroscedasticity for all regressions.
The coefficients of determination are presented as R2 between (variance between separate panel units), R2 within (variance within the panel units), and R2 overall, as the weighted average of these two. According to the performed panel data regression, explanatory power is very weak for three variables in simple regression (SH, DFS, and TPD), indicating that de facto subsidies (DFS) as well as that variable combined with savings on fuel into a total price difference (TPD) cannot explain the variance in the share of BEVs in total sales of passenger cars in 2021 and 2022 in the countries under review. The gain of fuel (GOF) variable itself in simple regression has a low R2, which also stands for the DFS and TPD variables when combined with the share of population living in towns and suburbs (SH).
The dependent variable may be best explained by the single indicator of relative wealth by countries, measured by relative final consumption expenditure per capita with a moderate R2 = 0.634. Apart from that, multiple regression on the impact of savings in fuel costs (GOF) and share of population living in houses in towns and suburbs (SH) had a value of determination coefficient very close to moderate (R2 = 0.452), indicating that the difference in electricity price over petrol is a noteworthy driving force for buying BEVs, especially in countries with a higher share of the population living in town and suburb houses that may provide the opportunity to more easily charge EVs at home. This finding was tested for robustness by omitting six evident outliers, i.e., three countries (Greece, Iceland, and Norway), and the reiterated regression without these outliers returned moderate R-squared values (0.626 within, 0.577 between, and 0.579 overall). The same procedure of omitting the mentioned outliers also resulted in increased overall R-squared value using the DFS variable, but the overall R-squared value remained low (R2 = 0.376). For the simple regression using final consumption expenditure as predictor, robustness was not tested as the scatter plot did not show evident outliers.
4. Discussion
One of the controversial issues with the fiscal incentives for electricity-powered cars is whether they are actually needed and, if so, what the optimal level would be.
Breetz and Salon (
2018) concluded that state incentives were necessary for BEVs to be cost-competitive due to the higher purchase price and rapid depreciation that outweigh fuel savings. However, by calculating total costs of ownership for three car sizes in the UK,
Santos and Rembalski (
2021) found that some electric cars were close to cost parity with ICE cars, and government intervention may not be necessary and only be needed if a goal is to speed up the process, while PHEVs shall not be subsidised at all due to their high real-world emissions and price close to the price of the BEVs.
Li and Wang (
2023) stated that subsidies are necessary while price parity over ICE vehicles is not enough due to consumers’ anxiety about EV range and battery durability. The authors also stated that the optimal level of subsidies for EVs to maximize social welfare will be based on money spent on subsidies in relation to consumer welfare and manufacturer profit, as well as overall environmental benefits for society.
Starting from the idea of constructing an “ideal” system of subsidies whereby exactly the same amount of total (passive and active) subsidies per 1 ton of CO
2 is saved over a similar ICE vehicle, it is possible to propose a hypothetical model with the (arbitrary) amount of EUR 1000 of total fiscal incentives allocated for 1 ton of saved CO
2 over 4 years. Subtracting from that the passive component (gain on fuel price and difference in value loss), it is easy to calculate the needed amount of active de facto implicit subsidies for each category of vehicles (
Figure 5).
Data indicate that, with the basic assumptions used and the set prices of gasoline and electricity, on average, countries under review may abandon de facto subsidies over similar petrol-powered vehicles for the category denoted in our model as SUVs, both for BEVs and PHEVs, regardless of ownership (business or private), and still the total benefit from owning and operating these vehicles over similar petrol ones will remain substantial. On the other hand, small vehicles will be much more subsidised should the countries under review apply the same ratio of overall price advantage to petrol vehicles over the savings in emissions. Data presented with the above simulation indicate that average “ideal” subsidies per vehicle amount to only EUR 1.2 thousand, compared to the real-world figure of EUR 5.5 thousand, meaning public spending on subsidies for BEVs and PHEVs in the countries under review was 4.5 times larger than it likely should be.
Lévay et al. (
2017) estimated total costs of ownership (TCO) for BEVs compared to ICE vehicles in France, Germany, Hungary, Italy, Norway, Poland, the Netherlands, and the United Kingdom and concluded that fiscal incentives for BEVs are necessary, while their descriptive analysis indicated links between fiscal incentives and electric vehicle market share.
Wittich (
2021) concluded that very generous purchase subsidies up to EUR 9000 resulted in sales of electric vehicles increasing by more than 200% in 2020, although there may be other underlying factors. Subsidies were found to have a statistically significant positive impact on the number of new EV registrations in the US (
Wee et al. 2018), and 1000 USD of subsidies may increase BEV sales by 5–11%. However, several studies for the United States (
Liu and Santos 2015), Norway (
Olson 2015), and China (
Zhao et al. 2015) argued that subsidies are not economically efficient due to high costs and the low money equivalent of the CO
2 saved, as a result of environmental policies of CO
2 valuation carried out by most governments. The results of the presented research go in line with the findings of
Transport & Environment (
2022), which concluded that there is a weak positive correlation between the tax differential for BEVs and their sales. In a multi-country analysis,
Yao et al. (
2020) evaluated the impact of financial and non-financial incentives on electric vehicle uptake, concluding that the importance of subsidies is very limited and that public policies should focus on affordable public charging networks. The usage costs of an electric vehicle depend to a great extent on the charging mode of the user, with home charging being the cheapest, while the use of public charging points is more expensive. Apart from that, charging is more difficult when renting a property, and lower-income households may have a limited possibility of upgrading the home network for charging.
Transport & Environment (
2022) found that the average EV driver charges 60% at home, 15% at work, and 25% at a public charging station, while
Corchero et al. (
2015) concluded that 71% of the charges are done at home or at work. Urbanization rate (
Shafiei et al. 2018) was also found to be more important than subsidies, while the KfW study for Germany found strong relations between a high household income and living in houses and in rural regions (
KfW 2021). Based on an EU-wide survey analysis,
Gezelius and Mortazavi (
2022) concluded that there is a significantly positive correlation between having solar panels and purchasing BEVs due to the opportunity for charging at lower costs. Findings of the presented study substantiate these findings, while a moderate value of the determination coefficient (R
2 = 0.452 for the total sample and R
2 = 0.579 for the reduced sample) indicates that a higher difference in electricity price over petrol, combined with a higher share of the population living in suburban houses (that may indicate the opportunity to more easily charge EVs at home), is a strong impetus for buying BEVs.
The presented study also came to the conclusion that in Europe, more expensive cars (SUVs) are much more subsidised than small cars, meaning there is little to no social component within the tax system, while EV uptake is much more evident in wealthier countries. Other scholars have also challenged the addition of subsidies, as they were destined for high-income households that would buy EVs even without subsidies (
DeShazo 2019;
Wells 2012). According to
JATO Dynamics (
2022), while in the period 2015–2022 the average price of electric cars in China fell from EUR 66.8 to 31.8 thousand, the price in Europe increased from EUR 48.9 to 55.8 thousand. Consequently, in China, the average prices of BEVs are lower than those of ICE vehicles by 33%, while in Europe, BEVs are on average 27% more expensive than gasoline-powered cars. This is due both to the poorly designed system of subsidies in Europe (as indicated by the research presented in our study) and the discrepancy of the supply and demand for small BEVs in Europe.
JATO Dynamics (
2022) also indicated that only 7% of supply (vehicles offered) in Europe was in the price range up to EUR 30,000; the share of this price range in total demand for EVs was as high as 35%. The European market is traditionally dominated by small cars, which made up 43% of sales (regardless of the engine) in 2021. There were neither public policies to stimulate nor the European automotive industry’s ability to produce affordable entry-level vehicles to meet the demand of the less wealthy European population, which is by now not included in the transition towards electricity-powered transport, nor to bring about mass production and uptake of vehicles for local and urban use, where their environmental impact would be of the utmost importance. Currently, a small BEV in Europe costs approximately EUR 10 thousand more than a similar ICE powered car, and if nothing changes, the share of electric vehicles sold in the European markets and produced in China may soon further increase from the level of 20% as recorded in 2022. A coordinated action is urgently needed in designing a system of taxes and incentives to stimulate European production and sales of affordable BEVs, otherwise, neither environmental goals to reduce greenhouse gas emissions will be met, nor the competitiveness of the European industries will be sustained.
A possible solution to the problem that costly government expenditures are destined to purchase grants for wealthier households was suggested by
DeShazo et al. (
2017) in the way that grants shall be used only for smaller and cheaper cars and with a higher amount for lower-income households. However, the presented research indicated that this is not the case in any of the countries under review, with an extremely high difference in favour of expensive cars in several countries.
Goetzel and Hasanuzzaman (
2022) stressed the importance of reducing the purchase cost of used and small EVs to enable lower-income households to access their purchases, while most of the BEVs and PHEVs are luxury vehicles that typically go to affluent households (
Bauer et al. 2021).
Apart from that, there are also a number of possible effects not captured in this research, starting with consumers’ behaviour and attitudes towards subsidies, especially if these subsidies are not constant but occasionally changing. Few studies included education, which is positively correlated with BEV ownership (
Fevang et al. 2021). There may also be an apparent effect of the “invisible hand” still pronouncing the ICE technology outdated and inappropriate, i.e., to be banned in the near future. This mechanism is evident through local rules on low-emission zones (LEZs), aimed at reducing air pollution from traffic. A recent review (
Transport & Environment 2019) found that LEZ rules had strong impact reductions in NOx emissions. LEZs have also had an impact on consumers’ decisions when purchasing new vehicles to buy vehicles compliant with future regulations (
Pouponneau et al. 2020) while also reducing motorised traffic altogether. The LEZ in the Belgian city of Ghent, together with scrappage incentives, resulted in the number of cars owned by the residents being reduced by as much as 10% within two years (
Azdad et al. 2022). However,
Peters et al. (
2021) indicated that the mechanism is limited in less wealthy countries, as LEZ in Madrid resulted only in decreases in the share of diesel-powered vehicle registrations, with an insignificant impact on the registration of BEVs. Some European cities like Amsterdam, Brussels, London, and Paris have already enacted rules to introduce zero-emission zones with access restricted to BEVs, which will also serve as a strong stimulus for buying such vehicles not only by residents but also for those that regularly visit these cities. As we approach the announced “D day” of the ban on the purchase of all new passenger vehicles other than BEVs, most likely the mentioned effects will become even more evident.
5. Conclusions
The presented research identified that incentives for the purchase and ownership of vehicles in the 31 European countries under review in 2021 and 2022 were not aligned with the impact on CO2 emissions by categories of vehicles and ownership as well as with financial savings on fuel. Hence, it is a challenge for the European countries to redesign their fiscal systems to become more effective in maximizing the effects of the reduction of emissions from vehicles per unit value of tax incentives. Additionally, on average, incentives were larger for more expensive vehicles, while negligible for small vehicles, for which they are mostly needed due to the high price gap between BEVs and ICE vehicles in this category. As a consequence, active measures, i.e., de facto subsidies, have only a limited impact on the sales of electricity powered vehicles, while the most important factor behind the share of BEVs in total sales of new passenger cars is relative wealth by county, according to the presented research and the findings of similar studies. Therefore, tax systems towards the purchase and use of vehicles will be modified to be more beneficial towards a less wealthy population that is not able to acquire electric vehicles otherwise, i.e., to provide relatively more incentives to buy simple and small cars.
The research also concluded that passive stimulus for buying BEVs (gain on fuel cost) is rather important, especially if combined with an indicator of the share of the population living in houses in towns and suburbs providing charging of EVs at a lower price. The presented approach may serve as a framework for optimization while each country has different prices of energy, yearly mileage of vehicles, and structure of demand by ownership and categories, so each country will calculate its own “ideal” incentives in order to stimulate the transition towards low-emission vehicles. Additionally, it is advisable to integrate all policies aimed at reducing the health risks of pollution in the most populated areas. The European Union as a whole will more actively design and monitor the process of stimulating the green transition of its automotive industry value chain in order not to direct tax incentives towards short term profits but to provide a framework for a long-term increase in competitiveness to retain market share in the dynamically changing, newly emerging green economy, providing for more efficient and environmentally friendly road transport. These findings may be summarised as stylised statements regarding the tested hypotheses in
Table 5.
The presented analysis is subject to the limitations of the methods used, so the readers are advised to be cautious with their interpretation of the results. There is a need for future studies to include other categories of vehicles apart from the basic ones like those in this study. Additionally, a stress impact analysis shall follow that would enable the calculation of effects of changes in prices of fuel and electricity, net prices of vehicles, and fiscal measures, all of which seem to have been dynamically changing within the current volatile economic circumstances.


