Article

Determinants Influencing the Application of Lean Accounting: The Case of Vietnamese Garment Firms

by
Thi Minh Phuong Nguyen
1 and
Thi Hai Chau Ngo
2,*
1
School of Accounting & Auditing, National Economics University, Hanoi 1400, Vietnam
2
Faculty of Economics and Management, Thuy Loi University, Hanoi 1400, Vietnam
*
Author to whom correspondence should be addressed.
J. Risk Financial Manag. 2023, 16(5), 279; https://doi.org/10.3390/jrfm16050279
Submission received: 6 April 2023 / Revised: 15 May 2023 / Accepted: 16 May 2023 / Published: 19 May 2023
(This article belongs to the Section Business and Entrepreneurship)

Abstract

:
The shift towards lean production is gradually replacing traditional mass production, and lean accounting is also being mentioned to evaluate operational efficiency based on the lean philosophy, eliminating waste, and simplifying direct cost aggregation along the value stream to improve productivity, distribution, quality, and service. This study aims to evaluate the impact of various factors on the adoption of lean accounting in Vietnamese garment firms based on data collected from 242 survey questionnaires completed by managers and accountants of Vietnamese garment firms. Through Cronbach’s Alpha test, EFA test, and multiple regression analysis to verify and forecast information, eight determinants affecting the adoption of lean accounting in Vietnamese garment firms are arranged in descending order of influence, including leadership, size, cost of implementation, resources, accounting department, education and training, culture, and competitive pressure. Based on the findings, recommendations are proposed to management businesses and agencies to address shortcomings in the process of applying lean accounting, contributing to making it one of the most effective tools in promoting product development and continuous improvement, enhancing quality and production efficiency.
JEL Classification:
M1; M41

1. Introduction

The term “lean” originated from the Toyota production system and was introduced by Krafcik (1988). Womack et al. (2007) catalyzed the lean revolution. According to Mize et al. (2000), lean is not just a set of rules commonly seen in factory workshops, but a fundamental change in how people in the organization think and evaluate, thereby changing their behavior. Shah and Ward (2003) defined lean as a method to provide the highest value to customers by eliminating waste through process design and human factors. Lean manufacturing aims to eliminate waste in all areas of production, including customer relations, product design, supplier networks, and plant management. Its goal is to combine less human effort, less inventory, less time to develop products, and less space to meet high customer demand while producing top-quality products in the most economical and efficient manner possible (Mize et al. 2000). Today, lean is a global trend applied to all industries and fields. Lean is no longer confined to the production environment but has expanded to include management and accounting environments.
Lean accounting is the emergence of lean, primarily lean production, that has created a need for lean accounting. As a provider of decision-making information, accounting is crucial to the success of the lean transformation process. However, when businesses shift to lean production, accounting based on standard cost, variance analysis, and shared cost allocation, it is no longer suitable and can even hinder lean production (Ramasamy 2005; Ruiz de Arbulo-Lopez and Fortuny-Santos 2010; Rao and Bargerstock 2011; Maskell and Kennedy 2007; Ofileanu and Topor 2014).
Indeed, when businesses implement lean strategies, their needs change. They require information about the financial impact of lean improvements, a better way to understand product costs, new ways to measure effectiveness, elimination of waste from accounting processes and systems, and better decision-making focused on customer value (Maskell et al. 2011). Thus, when businesses shift from mass production to lean production, the accounting system needs to change. Production cannot be sustained without significant changes to the accounting system.
According to Maskell et al. (2011), lean accounting has the following characteristics: lean accounting focuses on managing the business around value streams. All cost and financial decisions are made at the value stream level; the lean accounting method is designed to promote continuous, relentless improvement of the value stream; lean accounting eliminates most waste from the control system by integrating control into operational processes. Eliminating the need for wasteful transactions, reports, and meetings leads to the use of simple, understandable reporting and cost methods; and lean accounting applies the principles of lean strategies to accounting processes themselves.
Lean accounting has two main objectives: (1) eliminating waste in production and accounting while freeing up space and simplifying the process as much as possible so that everyone in the business can understand it, not just the accountants. (2) It also strives to fundamentally change the accounting environment to provide relevant information to both customers and employees to support decision-making, allowing all employees to influence positive changes in the business.
Lean accounting aims to create conditions for the necessary changes in the organization to implement lean thinking (Ofileanu and Topor 2014) and provide a stage for the accounting team to transition from a traditional system to a new high-value advisory role in different areas of the company (Cunningham et al. 2003). Lean accounting does not require traditional management accounting methods, such as standard costing, variance reporting, complex transaction control systems, and untimely and confusing financial reports, but rather applies a value-based approach (Rao and Bargerstock 2011). The tools of lean accounting are not entirely new and include value stream; Kaizen, PDCA, box score, value stream costing, target costing, financial reporting in simple language, visual management, and 5S; sales, operations, and financial planning; etc. (Brosnahan 2008; Maskell and Baggaley 2006; Maskell et al. 2011). Merwe and Thomson (2007) pointed out three main limitations of lean accounting. First, lean accounting considers absorption standard costing adequate, and all other traditional approaches have the same flaws. The second is that blended cost concept error results in poorer decision support because lean accounting refuses to model operations, whereas operational modeling is essential for decision support because understanding existing causal relationships provides insight into the potential outcomes of decision alternatives. Third, lean accounting strongly implies it has the ability to transform traditional financial accounting just as it desires to transform management accounting. However, the authors’ assessment is that the meaningful support of lean accounting in the field of financial accounting is inventory valuation. From there, the authors conclude that lean accounting needs more technical insight and depth into how it supports operational decision-making, strategic planning, and external reporting. Lean accounting also does not support the decision-making process, and business optimization extends beyond the shop floor.
Since 1996, the Vietnamese government has shown special interest in improving productivity and product quality. The national program “Improving productivity and product quality of Vietnam’s goods by 2020” and the subsequent “National program to support businesses in improving productivity and product quality of goods in the period 2021–2030” are major turning points in promoting the application of various improvement systems, models, and tools to enhance productivity and quality nationwide. These programs have attracted the participation of thousands of businesses from various industries with various scales and have achieved significant achievements. Businesses have become familiar with some management systems and improvement tools, including lean management.
The textile and garment industry is one of the most important economic sectors, with export turnover ranking fourth among economic sectors and contributing 5–7% to Vietnam’s GDP (VCBS 2022). Vietnam is also among the top five garment exporters in the world. However, with the characteristics of highly fashionable products, it is necessary to regularly change designs, colors, and materials, and in the context of rapidly increasing production costs, inflationary pressure, constantly rising living costs, the fact that the advantage of cheap labor is decreasing, labor productivity is low. More than ever, Vietnamese garment enterprises are forced to improve management, search and apply technology to increase labor productivity, and maintain good competitiveness to ensure stable and sustainable development. Since the characteristics of operation are mainly processing according to orders, products are produced according to customer requirements; with diverse products, the number of products of each small order, and orders changing constantly, Vietnamese garment enterprises are considered one of the types of businesses that are very suitable for lean production. Therefore, since 2006, lean production has been applied to some garment enterprises, first of all in production activities. Some enterprises have successfully applied lean production, such as Nha Be Garment Corporation. After applying lean production, the working time has been significantly reduced, workers do not have to work overtime, the average income increases by 10%, the wages of workers between lines are more uniform, the backlog in working positions is less, and so industrial hygiene is better and it takes less time to clean. In addition, Garment Corporation 10, after applying lean production, saw labor productivity increase by 52%, the defect rate decrease by 8%, working time decrease by 1 h/day, income increase by 10%, and production costs decrease from 5–10%/year (Le 2015). Thus, the research of lean accounting in textile firms in Vietnam is necessary.
This study is structured as follows. Section 2 reviews the studies of lean accounting and hypothesis development. Section 3 describes the data sample collection and methodology employed in the conduct of the research. Section 4 sets out a discussion of key results while Section 5 shows some key conclusions and implications of the study practice and recommendations. From the synthesis of previous studies in Section 2, we built 8 hypotheses with the research model, used Cronbach’s Alpha (CR) test method and exploratory factor analysis (EFA) for independent and dependent variables with Pearson correlation analysis, Multivariate regression analysis, and a residual analysis with SPSS software to perform testing in Section 3. The results in 
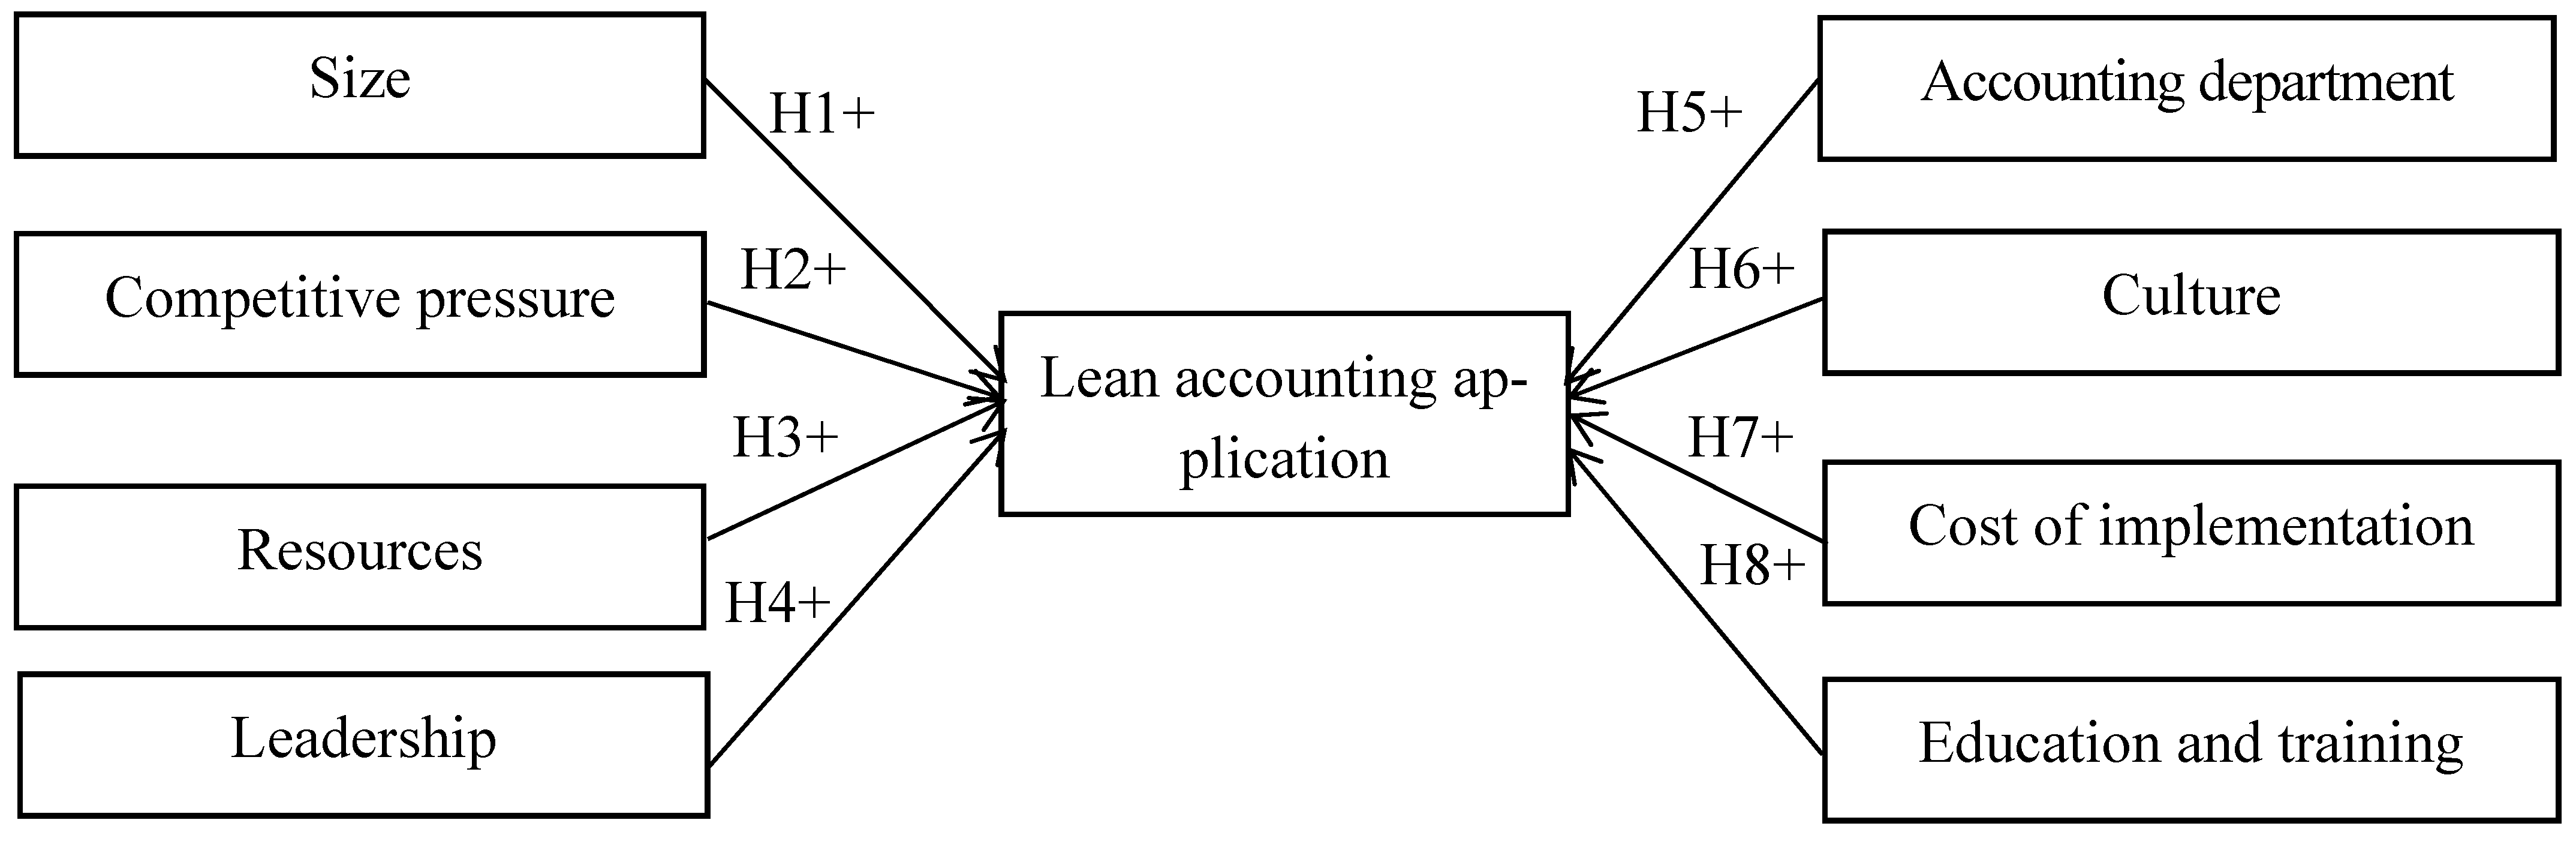
Section 4 show that all 8 factors representing 27 observed variables have a favorable influence on the application of lean accounting in Vietnamese garment enterprises. The level of influence of the factors is different and arranged in descending order as follows: leadership, size, cost of implementation, accounting department, education and training, resources, competitiveness, and competitive pressure. With the above results, Section 5 offers solutions for businesses in general and textile enterprises, in particular to have appropriate and effective strategies to apply lean accounting to ensure business development and sustainability.

2. The Literature Review

Maskell was the first to mention the term lean accounting, stating that “lean accounting aims to provide useful information to those who are making and maintaining lean production” (Maskell 2000). In 2005, Maskell stated that it was the generic term used for changes required in a company’s accounting, control, measurement, and management processes to support lean manufacturing and lean thinking. It supports a lean culture by fostering investment in people, providing appropriate and actionable information, and empowering continuous improvement at every level of the organization (Arora and Soral 2017). Brosnahan (2008) argues that lean accounting is a new accounting method stemming from the growing interest of organizations in embracing the culture of lean thinking. It is applied in organizations implementing lean thinking (Ofileanu and Topor 2014; Pham 2011) to support lean manufacturing and lean thinking (Maskell and Kennedy 2007). Nguyen (2020) argues that lean accounting is the application of lean thinking to all financial and accounting processes and systems of the business.
Achanga et al. (2006), after studying 10 small and medium enterprises based in the East of England, pointed out four main factors affecting the implementation of lean production, including leadership and management, finance, skills and expertise, and the culture of the organization. Leadership and management commitment are the most important factors in determining the success of a lean project. Nguyen et al. (2015), through the study of three lean projects, have divided the important factors determining the successful implementation of lean production in lean manufacturing enterprises in Vietnam. Six aspects of the lean transformation model were presented in the study, including Strategic Initiatives, Process Management, Change Management, Human Resource Management, Situation Management, and External Management. Research has also found that different factors have different effects, but the studies have not evaluated each factor in depth.
Many studies suggest that implementing lean production is not an easy task (Achanga et al. 2006; Pirraglia et al. 2009; Nordin et al. 2010). Grasso (2006) divided the barriers to lean accounting into five categories: cultural, organizational, educational, professional, and personal. According to the author, culture is the biggest barrier. For organizational hurdles, a lean transformation of accounting must begin with the integration of accounting into manufacturing operations and have accountants participate in lean production and Kaizen training to avoid the separation of the accounting department from other departments. Educational barriers are accounting training programs that are oriented towards public accounting, financial reporting, and auditing. The lack of lean accounting references is also a factor of educational barriers. The professional hurdles are the professional accounting certifications that contribute to the direction of the educational process focusing on financial accounting and orientation of financial statements. The personal barrier is that accountants can resist change for fear of the unknown. By way of training and self-selection, some accountants may not like risk and change more than others. Accountants have reasons to be apprehensive about a lean switch. They may be afraid of losing influence or stature. As the final hurdle, accounting can have a bias for complexity and detail. Stenzel (2007) points out five factors that lead to the implementation of lean accounting failure, namely: people (unwillingness or fear of change, fear of losing jobs, fear of failure of individuals, fear of failure of business, fear of loss of reputation); machinery, materials, and methods (enterprise resource planning systems, independent accounting information systems, mandatory non-financial data are not collected); measures; and environment.
In a quantitative study by Darabi et al. (2012), four groups of factors, including cultural, technical, organizational, and economic, are considered barriers to the implementation of lean accounting in factories. Research results have shown that technical factors have the highest obstacles in the implementation of lean accounting in manufacturing companies and the lowest economic factors. Cultural factors include the role of leadership, tactical attitudes, inappropriate reward procedures, resistance of managers, employees, and even customers. The components of the technical barrier in this study include not using lean as a manufacturing strategy, not using general-purpose machinery, not using production systems in a timely manner and without warehouses, and a lack of awareness of lean systems by senior leaders and employees. Meanwhile, McVay et al. (2013) only mentioned two barriers. The first is that most people prefer stability and resist change. They are afraid of the unknown, and they are able to cope with what they are used to, even if they know it may not be their best alternative. The second is a lack of knowledge or training on how to make an accounting transition.
Kumar and Kumar (2014) studied the barriers of lean manufacturing at 47 large and medium-sized manufacturing companies in India. This study looked at companies that are in the process of implementing lean manufacturing or have successfully adopted lean manufacturing systems. The seven main barriers of lean manufacturing deployment include management, resources, knowledge, conflict, employees, finance, and past experience. The results of the study by the average method show the level of resistance of the barriers from low to high as follows: management, knowledge, conflict, finance, employees, resources, and past experience. Salonitis and Tsinopoulos (2016) classified barriers into four groups: financial, related to senior management, related to the workforce, and other barriers. Lodgaard et al. (2016) studied in-depth case studies at a manufacturing company in Norway for two years on barriers to successful lean implementation. Barriers include management, lean organization, lean tools and practices, and knowledge. Research shows that employees at different levels in a company notice different lean barriers. Top managers attribute limited success to barriers associated with the tool and lean practices. Workers mainly point out the challenges related to management. Middle managers acknowledge there are many barriers but mostly emphasize that roles and responsibilities are not defined and that best practice tools have not been selected. Nguyen et al. (2017) focused on identifying critical barriers/difficulties and exploring the source of barriers/difficulties for successful lean implementation at manufacturing companies in Vietnam. The study found seven major barriers to lean implementation success—leaders, employees, workplaces, resources, operational processes, customer relationships, and supplier relationships. Leadership barriers are considered the most important and influential in lean implementation.
From another perspective, Turesky and Connell (2010) studied the reasons for the failure to achieve the sustainability of lean manufacturing at a company in northern New England. The authors proposed a four-stage model affecting lean project sustainability: set-up, preparation, implementation, and sustainability. The factors that affect leaning have been considered in stages, and it is assumed that the factors in each stage interact with each other and should not be considered separately. A study of the implementation of lean manufacturing practices in the textile industry found Shah and Hussain (2016). The authors used survey methods to collect data from several Pakistani textile companies. Study results show that lean manufacturing practices have a significant relationship with scale. Larger organizations have used more lean manufacturing practices than small and medium-sized organizations. In addition, based on the literature review, ten factors hindering the implementation were identified and included in the questionnaire. Statistics have shown that in noncompliant companies, the four main barriers are employee resistance, lack of communication, company culture, and lack of understanding. On the other hand, companies are transitioning to lean production systems where company culture, employee resistance, lack of communication, and a lack of understanding to implement lean production are key factors. For lean companies, a lack of communication is identified as the main barrier to successful implementation of a lean manufacturing system.
Timm (2015) investigated factors that influence the adoption of lean accounting in organizations that use lean manufacturing. To add to the understanding of why lean accounting is or is not implemented by lean manufacturers in the United States, the study examined four independent variables—PEOU-I (individual perceived ease of use), PU-I (individual perceived usefulness), PEOU-O (organization perceived ease of use), and PU-O (organization perceived usefulness) and the dependent variable of BI (behavioral intention) management accountants to adopt lean accounting using value-stream costing. The purpose of this study was to examine whether concern about the complexity of value-stream costing or accountants’ perceptions that value-stream costing may not be useful to their organization or to their required job responsibilities may influence their adoption of value-stream costing. In addition, demographic data offered insights into the current state of lean manufacturing and value-stream costing. Therefore, proponents of the use of value-stream costs have foundational information about management accountants’ perceptions of ease of use and usefulness. For both the individual and the organization, value-stream costs have a positive correlation with the intention of implementing value-stream costs. Additionally, PEOU and PU may predict the intention of implementing value-stream costs.
In 2021, Rehman et al. concluded that those factors include a technology gap, fear of unemployment in workers, current status of employees, fear of not knowing, change in reporting structure, skill gap, lack of appropriate communication, fear of people with machines, social disconnect, out-of-scope exposure, fear of managerial change, increasing factors of accountability, unhealthy behavior, the value of unknown technology, unknown ways to use technology, lack of uniformity in technology, technology related to too many paperwork, technology that creates too many jobs, technology abuse, high technology costs, technology that is a threat to personal freedom, technology that is different from what work processes and procedures have been established, the fear that technology will have a negative impact on teamwork and collaboration, bad experience with technology in the past, lack of leadership/support for innovation, level of comfort, the effect of disruption, time to make changes and adjustments, understanding and ability to perform, budget priorities, difficulty/capacity/training time, resistance to learning new technology, stressful/overloaded work, cost, evidence of value, reliability, lack of clear scope, weak motivation to change, lack of money, skepticism in rank, high workforce turnover, little personal empowerment, use of relationships, insufficient knowledge of leanness and inadequate management skills. Sakataven et al. (2021) reviewed the literature and found fifteen barriers to lean implementation, and by using the outputs of Interpretive Structural Modelling (ISM) and Impact Matrix Cross-Referencing Multiplication (MICMAC) analyses, the study classified 15 barriers into 10 levels, where “Roles and Responsibilities not defined in Lean Implementation” was at level 1 (the lowest impact level). The most important barriers are “Lack of long-term commitment to change and innovation” and “Personal Attitudes” (level 10). Some levels have many barriers. The study suggests that such classification helps organizations understand the motivating power and dependency of each barrier. This is important because motivation will determine the impact of a successful lean implementation. Barriers should also be addressed along with the consideration of other barriers at the same level.
The relationship between lean governance and green accounting is mentioned by authors Kuo and Lin (2020). This study contributes to lean and green management in five ways. First, most of the prior research on green performance has demonstrated how to carry out green operations in a routine job, but few studies have identified the effects of lean management and green operational practices. This paper empirically determines how lean management impacts green operational practices in container terminal operations. Another contribution is that the conceptual framework of this study was formulated based on the literature, and it aims to determine and confirm the effects of lean management, green operational practices, green behavior, and green performance. Third, employees’ green behavior is the key to green performance, and human behavior is also the most difficult factor to control within an organization. The mediating effects of employee green behavior on lean management, green operational practices, and green performance are assessed in this study. Fourth, the relationship between lean management and performance in the context of the manufacturing industry is investigated. Finally, the study results offer useful managerial contributions that can guide terminal operators in establishing an adaptable approach for implementing green practices in container terminals.
Lean accounting or green accounting is a matter of great interest to enterprises in general, in which the successful application of lean accounting in enterprises leads to sustainable development and environmental and social sustainability accounting practice (SAP). In the study of Oyewo et al. (2022), the authors also proposed internal management, business strategy, lean accounting quality, and accounting apparatus structure. The results show that the extent to which Nigerian companies have implemented SAP is moderate. The authors find that the level of SAP implementation is significantly associated with market orientation and business strategy but not with the QIT and structure of accounting department. Another study by Oyewo et al. (2022) suggests that while the implementation level of SAP by companies is generally moderate, internalities/‘pull factors’ such as market orientation and deliberate strategy formulation significantly determine the sophistication level of SAP. The insignificant effect of the externalities/‘push factors’ (i.e., environmental uncertainty, structure of ownership and control, and intensity of competition) on SAP suggests that external pressure on companies to implement sustainability initiatives is weak.
Through the literature review of research works, the study synthesizes factors affecting the application of lean accounting in garment enterprises and builds research models and research hypotheses to survey, analyze, and give results.

3. Methodology

3.1. Hypothesis Development

From the background theories and overview of previous studies on the factors affecting or hindering the application of lean accounting in general enterprises and tailor-made enterprises in particular, we built an initial research model including 8 independent variables. From the research model that is expected to combine with the discussion and agreement with the experts, the authors propose 08 research theories, including:
Hypothesis 1 (H1).
Size has a positive relationship with the application of lean accounting at garment firms.
The size of the enterprise can be determined by many measures, such as revenue, capital, number of employees, etc. (Chenhall 2003). In addition, according to the regulations on determining the size of small and medium-sized enterprises in Article 5 of Decree 80/2021/ND-CO issued on 26 August 2021 of the Government of Vietnam, the size of enterprises is determined according to 3 criteria: the number of employees participating in social insurance annually, the total revenue of the year (determined on the financial statements of the preceding year), and the total capital of the year (determined in the balance sheet shown on the financial statements of the preceding year). The inspection results of Tran (2016) show that the size factor with 3 observed variables (revenue, number of employees, number of departments, and branches) has a positive impact on the ability to apply management accounting in small and medium enterprises in Vietnam.
Hypothesis 2 (H2).
Competitive pressure has a positive relationship with lean accounting application at garment firms.
Competition is something that any business faces, especially in the context of the current market economy and deep integration. In fact, in order to survive and develop, along with the increase in competitive pressure, enterprises also increased the use of more modern methods and tools of management and accounting (Doan 2016). In addition, the study of Ngo (2021), when examining the correlation of competitive pressure factors with 3 observed variables (competitive in selling products and services in the market; competitive in buying materials; competitive in recruiting high-skilled workers), has a positive effect on the use of performance measures of manufacturing firms.
Hypothesis 3 (H3).
Resources have a positive relationship with lean accounting application at garment firms.
Resources are indispensable for performing any activity. This is a factor that can affect the application of lean accounting in Vietnamese garment enterprises. The study by Darabi et al. (2012) used three variables for the resource factor: human resources, financial resources, and time.
Hypothesis 4 (H4).
Leadership has a positive relationship with lean accounting application at garment enterprises.
Leadership has the greatest influence and decisive role in all business operations, so the leadership factor has a great impact on the application of lean accounting. Perceptions of lean accounting, supportive attitudes, or motivational measures can all influence lean accounting adoption (Rehman et al. 2021; Grasso 2006; Stenzel 2007; McVay et al. 2013). The study used five variables to measure leadership factors: commitment to long-term lean practices of leadership, awareness of lean accounting of leadership, attitude in favor of lean accounting adoption, and measures to promote lean accounting adoption of leadership. In addition, the same viewpoint as the research results of Rehman et al. (2021) shows that accounting staff may not want to switch to lean accounting due to fear of losing their jobs, so the proposal to add 1 observation variable is the leader’s commitment to the rights of accounting staff.
Hypothesis 5 (H5).
Accounting department has a positive relationship with the application of lean accounting at garment firms.
Accountants who are directly involved in the process of implementing lean accounting, by applying lean accounting to Vietnamese garment enterprises, are therefore naturally affected by this factor. The barriers belonging to accounting staff have been pointed out by McVay et al. (2013); Stenzel (2007); Grasso (2006); Rehman et al. (2021); Carnes and Hedin (2005), including lack of knowledge, skills, and capacity to implement lean accounting; unwillingness or fear of change; fear of losing jobs; fear of losing influence; fear of not learning new technologies; not understanding the production and business processes of firms; etc. Since then, the experts have agreed that the accounting department affects the application of lean accounting at Vietnamese garment enterprises and identified four observed variables: knowledge, skills, and capacity to implement lean accounting of accounting staff; supportive attitude of accounting staff; the understanding of accounting staff about the production and business processes of firms; and the connection between accounting department and other departments.
Hypothesis 6 (H6).
Culture has a positive relationship with lean accounting application at garment enterprises.
Corporate culture is a factor that needs to go through a long process of formation and development to be able to build. Therefore, it could not be changed easily, and it will take a lot of time to do that. It helps to shape the working environment and habits of people. All activities of enterprises are also affected by many factors from this platform. Many studies have shown that the failure of enterprises to build a lean corporate culture leads to the implementation of lean failure. Corporate culture of command and control and less employee empowerment will be a barrier to lean accounting (Grasso 2006, Rehman et al. 2021). The lean culture with the characteristics of cooperation, continuous improvement, and personal empowerment will also make the accounting department not separate from other departments, thereby making the accountants understand the actual situation of the business and not consider it to be the work of others or unrelated to them. Since then, the study agreed that business culture can affect lean accounting adoption at Vietnamese garment firms and identified three observation variables under this factor: collaboration culture, continuous improvement culture, and employee empowerment culture.
Hypothesis 7 (H7).
Cost of implementation has a positive relationship with the application of lean accounting at garment firms.
To decide whether to apply lean accounting or not, businesses often consider the cost of implementation. This is a factor affecting the application of lean accounting in Vietnamese garment firms. Tran (2016) concluded that low costs have a positive impact on the application of management accounting in small and medium enterprises in Vietnam. Similarly, high costs are considered a barrier for lean accounting at Pakistan garment enterprises (Rehman et al. 2021). The study has identified 3 observed variables of the implementation cost factor (low): facilities costs, accounting staff costs, consultant costs.
Hypothesis 8 (H8).
Education and training have a positive relationship with lean accounting application at garment firms.
Education and training are factors both inside and outside enterprises; education and training directly affect the quality of human resources of enterprises (Carnes and Hedin 2005; Grasso 2006; Rehman et al. 2021). In the context that lean accounting in Vietnam is still a relatively new concept and that little is known about whether lean accounting is taught or guided, it will cause many difficulties to the application of lean accounting in Vietnamese garment firms. The observed variables are: educational institutions, teaching training on lean accounting, enterprises organizing training programs on lean accounting, and guidance documents on lean accounting.
The research model has been designed in Figure 1, as shown below:

3.2. Research Methodology

Based on the literature review and grounded theories, we have gathered the determinants affecting the application of green accounting. We conducted in-depth interviews to redefine factors and find new determinants from 12 experts who are experienced and knowledgeable about lean accounting in garment firms. Then, we tested the factors and models developed from the data collected through studies around the world to determine if they are really appropriate in the current context. Then, we used quantitative research methods and questionnaire surveys to test hypotheses and models about factors affecting the application of lean accounting in Vietnamese garment firms (Appendix A).
The questionnaire survey for the study is divided into three parts: part 1: introduction to the topic, part 2: overview of the firm and respondents, and part 3: questions related to determinants influencing the application of lean accounting in Vietnamese garment firms (Appendix B).
Survey subjects were firm managers, chief accountants, and accountants of garment firms in Vietnam, with 242 questionnaire surveys collected during the period from 03/2022 to 11/2022. The data were collected in two ways: by directly collecting from the company that gave the questionnaire directly to the subjects surveyed and by collecting data from the oRSine design questionnaire on the Google form that sent the questionnaire via email and zalo.
After obtaining data from the questionnaire surveys, the research team eliminated the unsatisfactory questionnaire surveys, then performed data entry for analysis:
Step 1: We tested the scale using Cronbach’s Alpha (CR) to assess the quality of the scales.
Step 2: We performed exploratory factor analysis. This step aimed to reduce the set of observed variables into factors so that they were more meaningful. The article used KMO, Bartlett, and variance testing to determine the representative scale system.
Step 3: We performed linear regression analysis. We used the tests of the regression coefficients, the appropriate level of the model, and the correlation to determine the factors and the level of influence of the factors.
Step 4: We analyzed the residue. We used the Histogram, Normal P-P Plot, and Scatterplot to check if the hypotheses were violated.

4. Results

4.1. Cronbach’s Alpha Test Results of the Scales

The specific results of testing the reliability of Cronbach’s Alpha scales are presented in Table 1 and Table 2.
The test results show that all scales have Cronbach’s Alpha coefficient >0.6 and are quite high; the lowest is 0.770, and the highest is 0.941. In addition, the total variable correlation coefficients are >0.3. Therefore, it can be confirmed that the scales of the study are reliable and can be used to analyze the discovery factor in the next step.

4.2. Exploratory Factor Analysis

EFA factor analysis for independent variables. Processing results from SPSS software for independent variables are as follows:
Table 3 shows that KMO = 0.856 > 0.5, so the factor analysis is appropriate. Sig.&nbsp; (Bartlett’s Test) = 0.000 (sig. < 0.05) shows that the observed variables involved in the EFA analysis are correlated.
Table 4 shows that there are 8 factors extracted based on Eigenvalue 1.148 > 1 or 8 factors that summarize the information of 27 observed variables into EFA in the best way. The total variance of these factors extracted is 70.867% > 50%. Thus, the 8 factors cited explained 70.867% of the data variation of 27 observed variables participating in EFA.
The loading factor of the observed variables in the rotation matrix is >0.5 (Table 5), or these observed variables are all significant contributors to the model.
EFA analysis for the dependent variable. The processing results from the SPSS software for the dependent variable are as follows:
Table 6 shows KMO = 0.937 > 0.5, so the factor analysis is appropriate. Sig.&nbsp; (Bartlett’s Test) = 0.000 (sig. < 0.05) shows that the observed variables involved in the EFA analysis are correlated. Table 7 shows that there is a factor extracted based on Eigenvalue 6.128 > 1. The extracted variance is 68.094% > 50%. Table 8 shows that the loading factor of the observed variables in the rotational matrix is >0.5, or these observational variables are all significant contributors to the model.
From the results of exploratory factor analysis of toxic variables and dependent variables, the research has the groups of factors representing the following variables:
Scale Factor—SZ: SZ1, SZ2, SZ3
Competitive Pressure Factor—CP: CP1, CP2, CP3
Resource Factor—RS: RS1, RS2, RS3
Leadership Factor—LD: LD1, LD2, LD3, LD4, LD5
Factor Accounting Department—AD: AD1, AD2, AD3, AD4
Cultural Factors—CT: CT1, CT2, CT3
Implementation Cost Factor—CO: CO1, CO2, CO3
Education and training factors—ET: ET1, ET2, ET3
Factors Applied Lean Accounting—LA: LA1, LA2, LA3, LA4, LA5 LA6, LA7, LA8, LA9

4.3. Correlation Analysis

Pearson correlation analysis was performed to examine the strong linear correlation between the dependent variable (LA) and the independent variables (SZ, CP, RS, LD, AD, CT, CO, and ET) and the early identification of the multicollinearity phenomenon when the independent variables are also strongly correlated with each other.
Regarding the correlation between dependent variables and independent variables, the Pearson correlation analysis table (Table 9) shows that the correlation coefficients are 1, 0.569, 0.463, 0.554, 0.671, 0.544, 0.480, 0.514, 0.480, or all 8 independent variables in the proposed model are strongly correlated with the dependent variable (Hoang and Chu 2008).
Regarding the correlation between independent variables, Table 9 also shows that all sig. between independent variables are less than 0.05 minus sig. between variables CP and ET. However, the Pearson correlation coefficient between independent variables is less than 0.7. Therefore, it is not yet sufficient to conclude between variables that are likely to occur multicollinearity (Dormann et al. 2013).

4.4. Multivariate Regression Analysis

The processing results from SPSS software are obtained as follows:
Table 10 shows the results of the conformity assessment of the multivariate regression model. R = 0.873 indicates a high degree of correlation. Adjusted R Square correction = 0.754 indicates that the independent variables included in the regression analysis explain 75.4% fluctuations of the dependent variable; the remaining 24.6% is due to variables outside the model and random error. This result also indicates the statistical value of the Durbin–Watson test = 2.19 ≈ 2, which is between 1 and 3, so the result does not violate the first-order self-correlation assumption (Field 2009).
The ANOVA analysis (Table 11) indicates the relevance of the regression equation to the data. The test results show that F = 56.856, sig. = 0.000 < 0.05 and prove that R square is non-zero overall. This means that the linear build regression model is suitable.
Correlation coefficient analysis (Table 12) shows that the value of sig. of all variables is <0.05, or these variables are statistically significant and all affect the dependent variable. All eight theories are accepted. Regression coefficients (B and β) in all 8 independent variables are positive, meaning that all 8 independent variables have a positive effect on the dependent variable.
In addition, VIF variance magnification coefficients of all independent variables in the model were <2, indicating that the data did not violate the multicollinearity assumption or that multicollinearity between independent variables occurred (Hair et al. 2009).

4.5. Analysis of Residuals

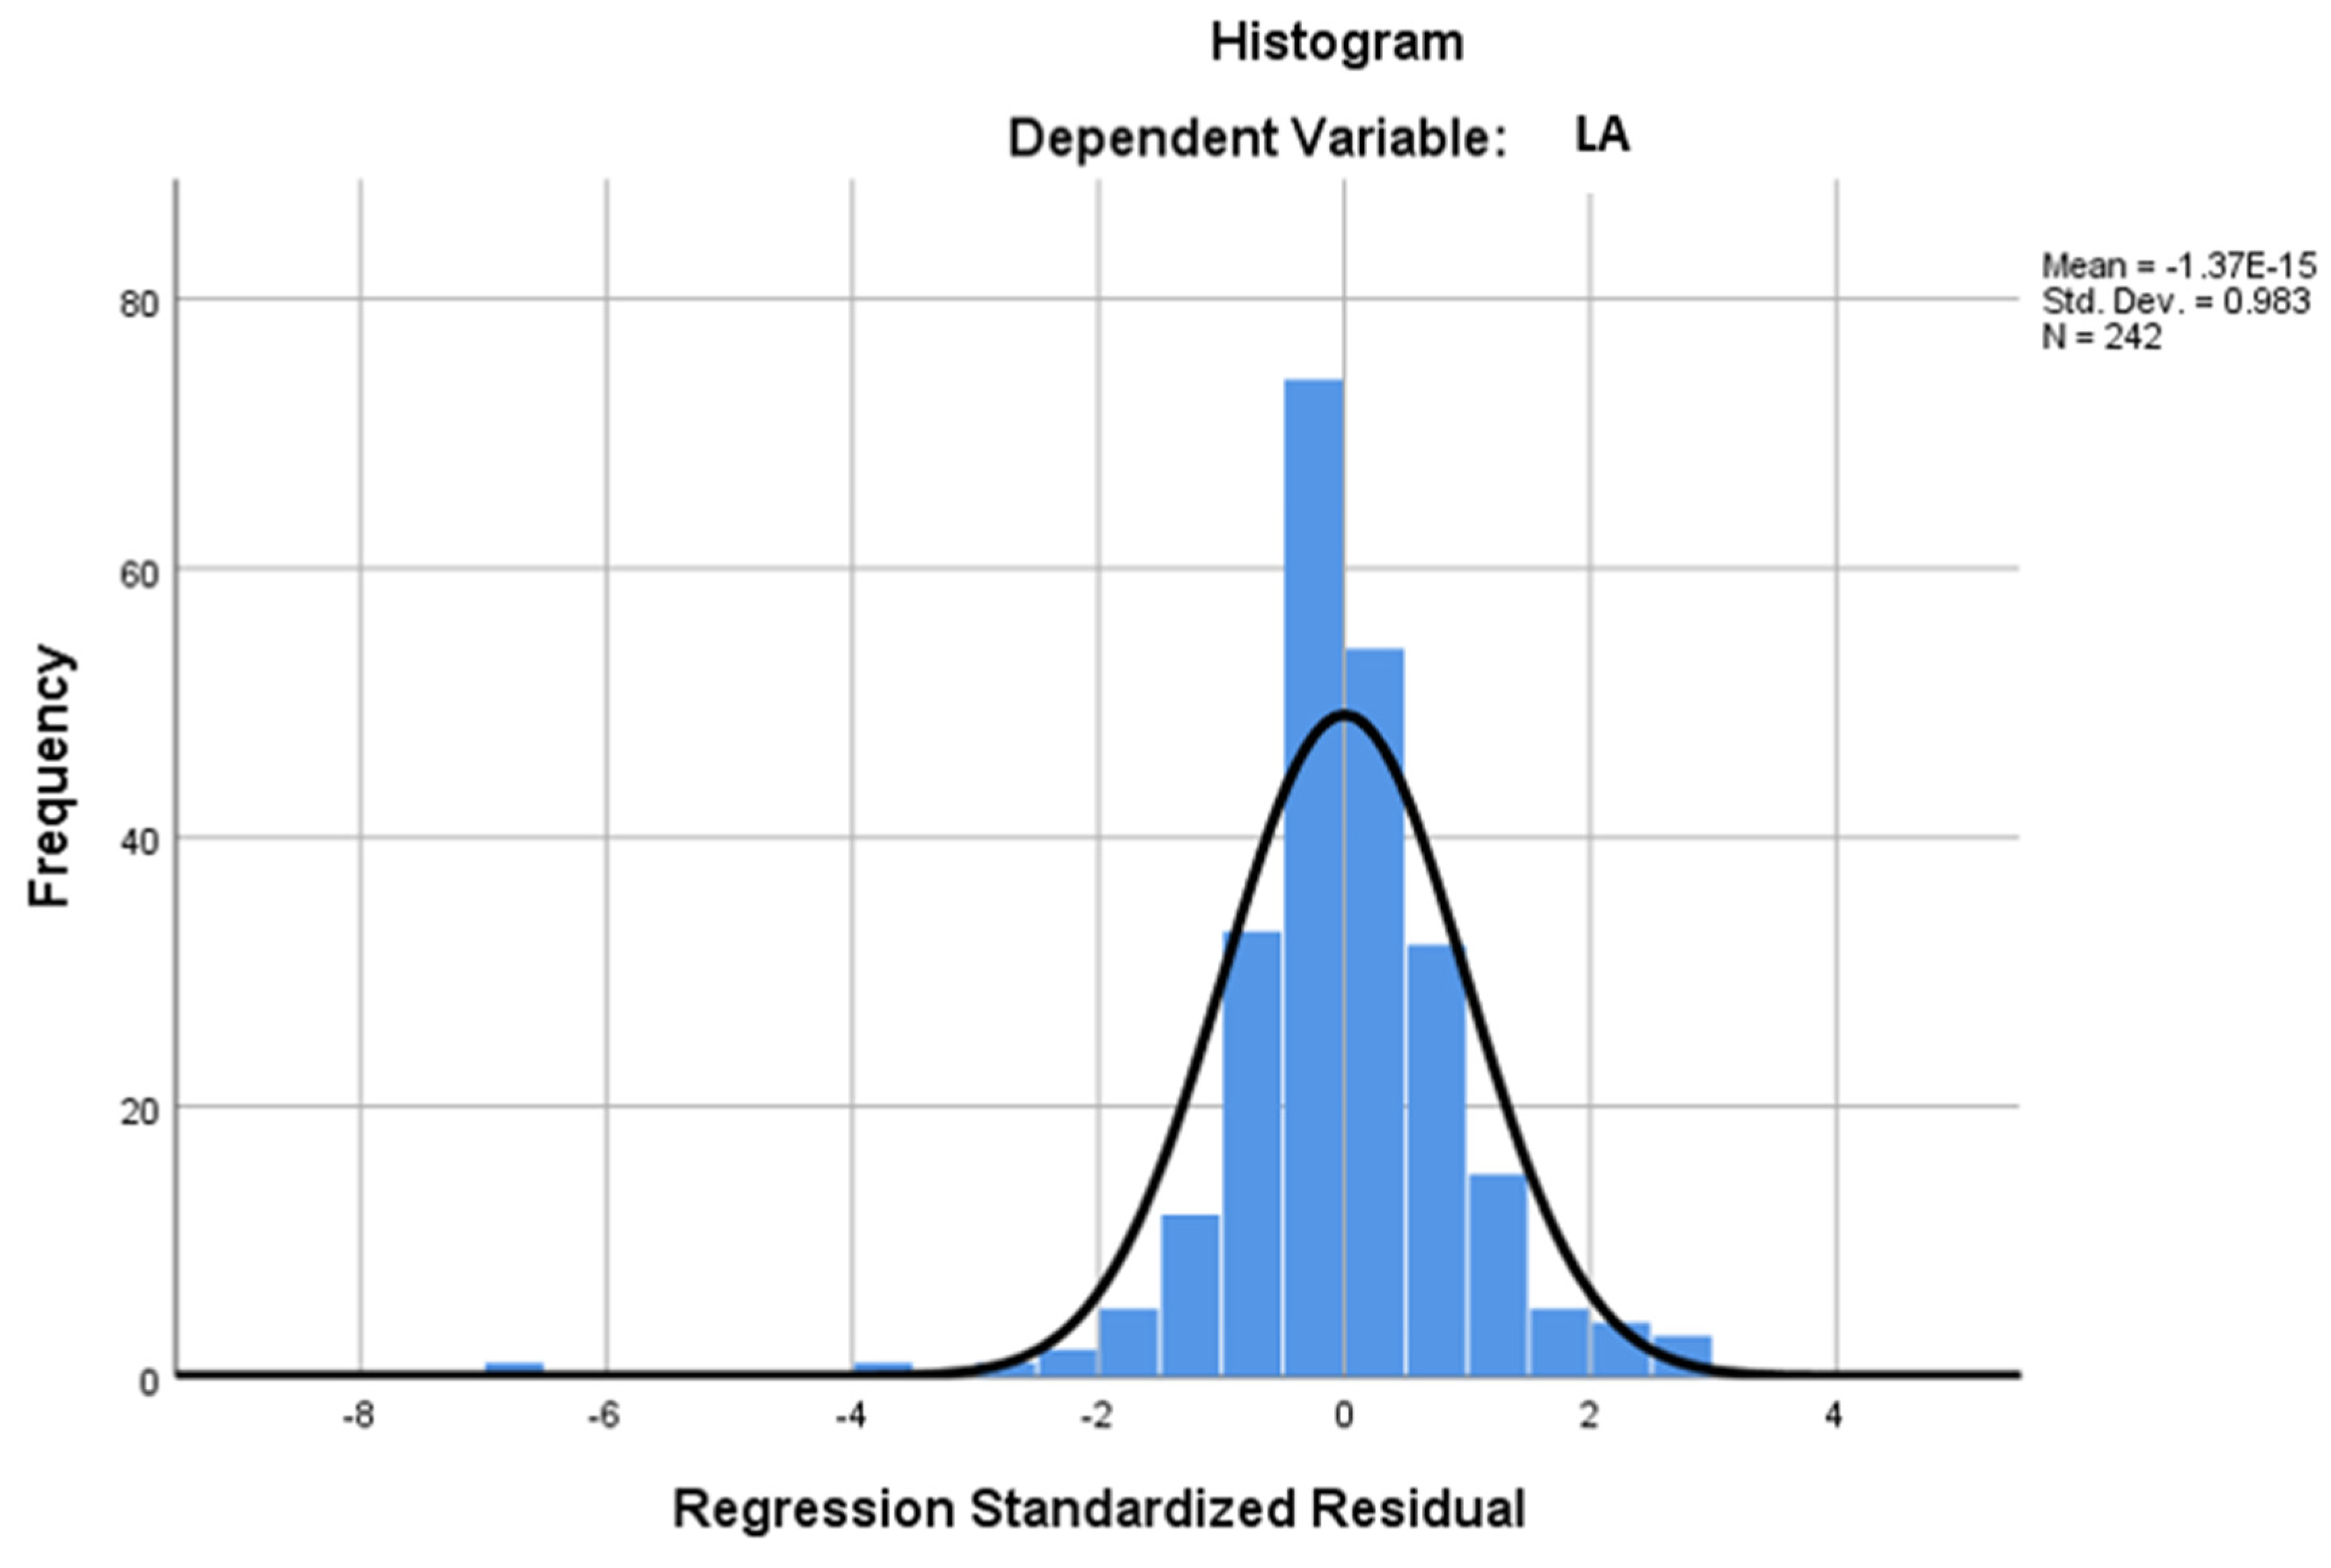
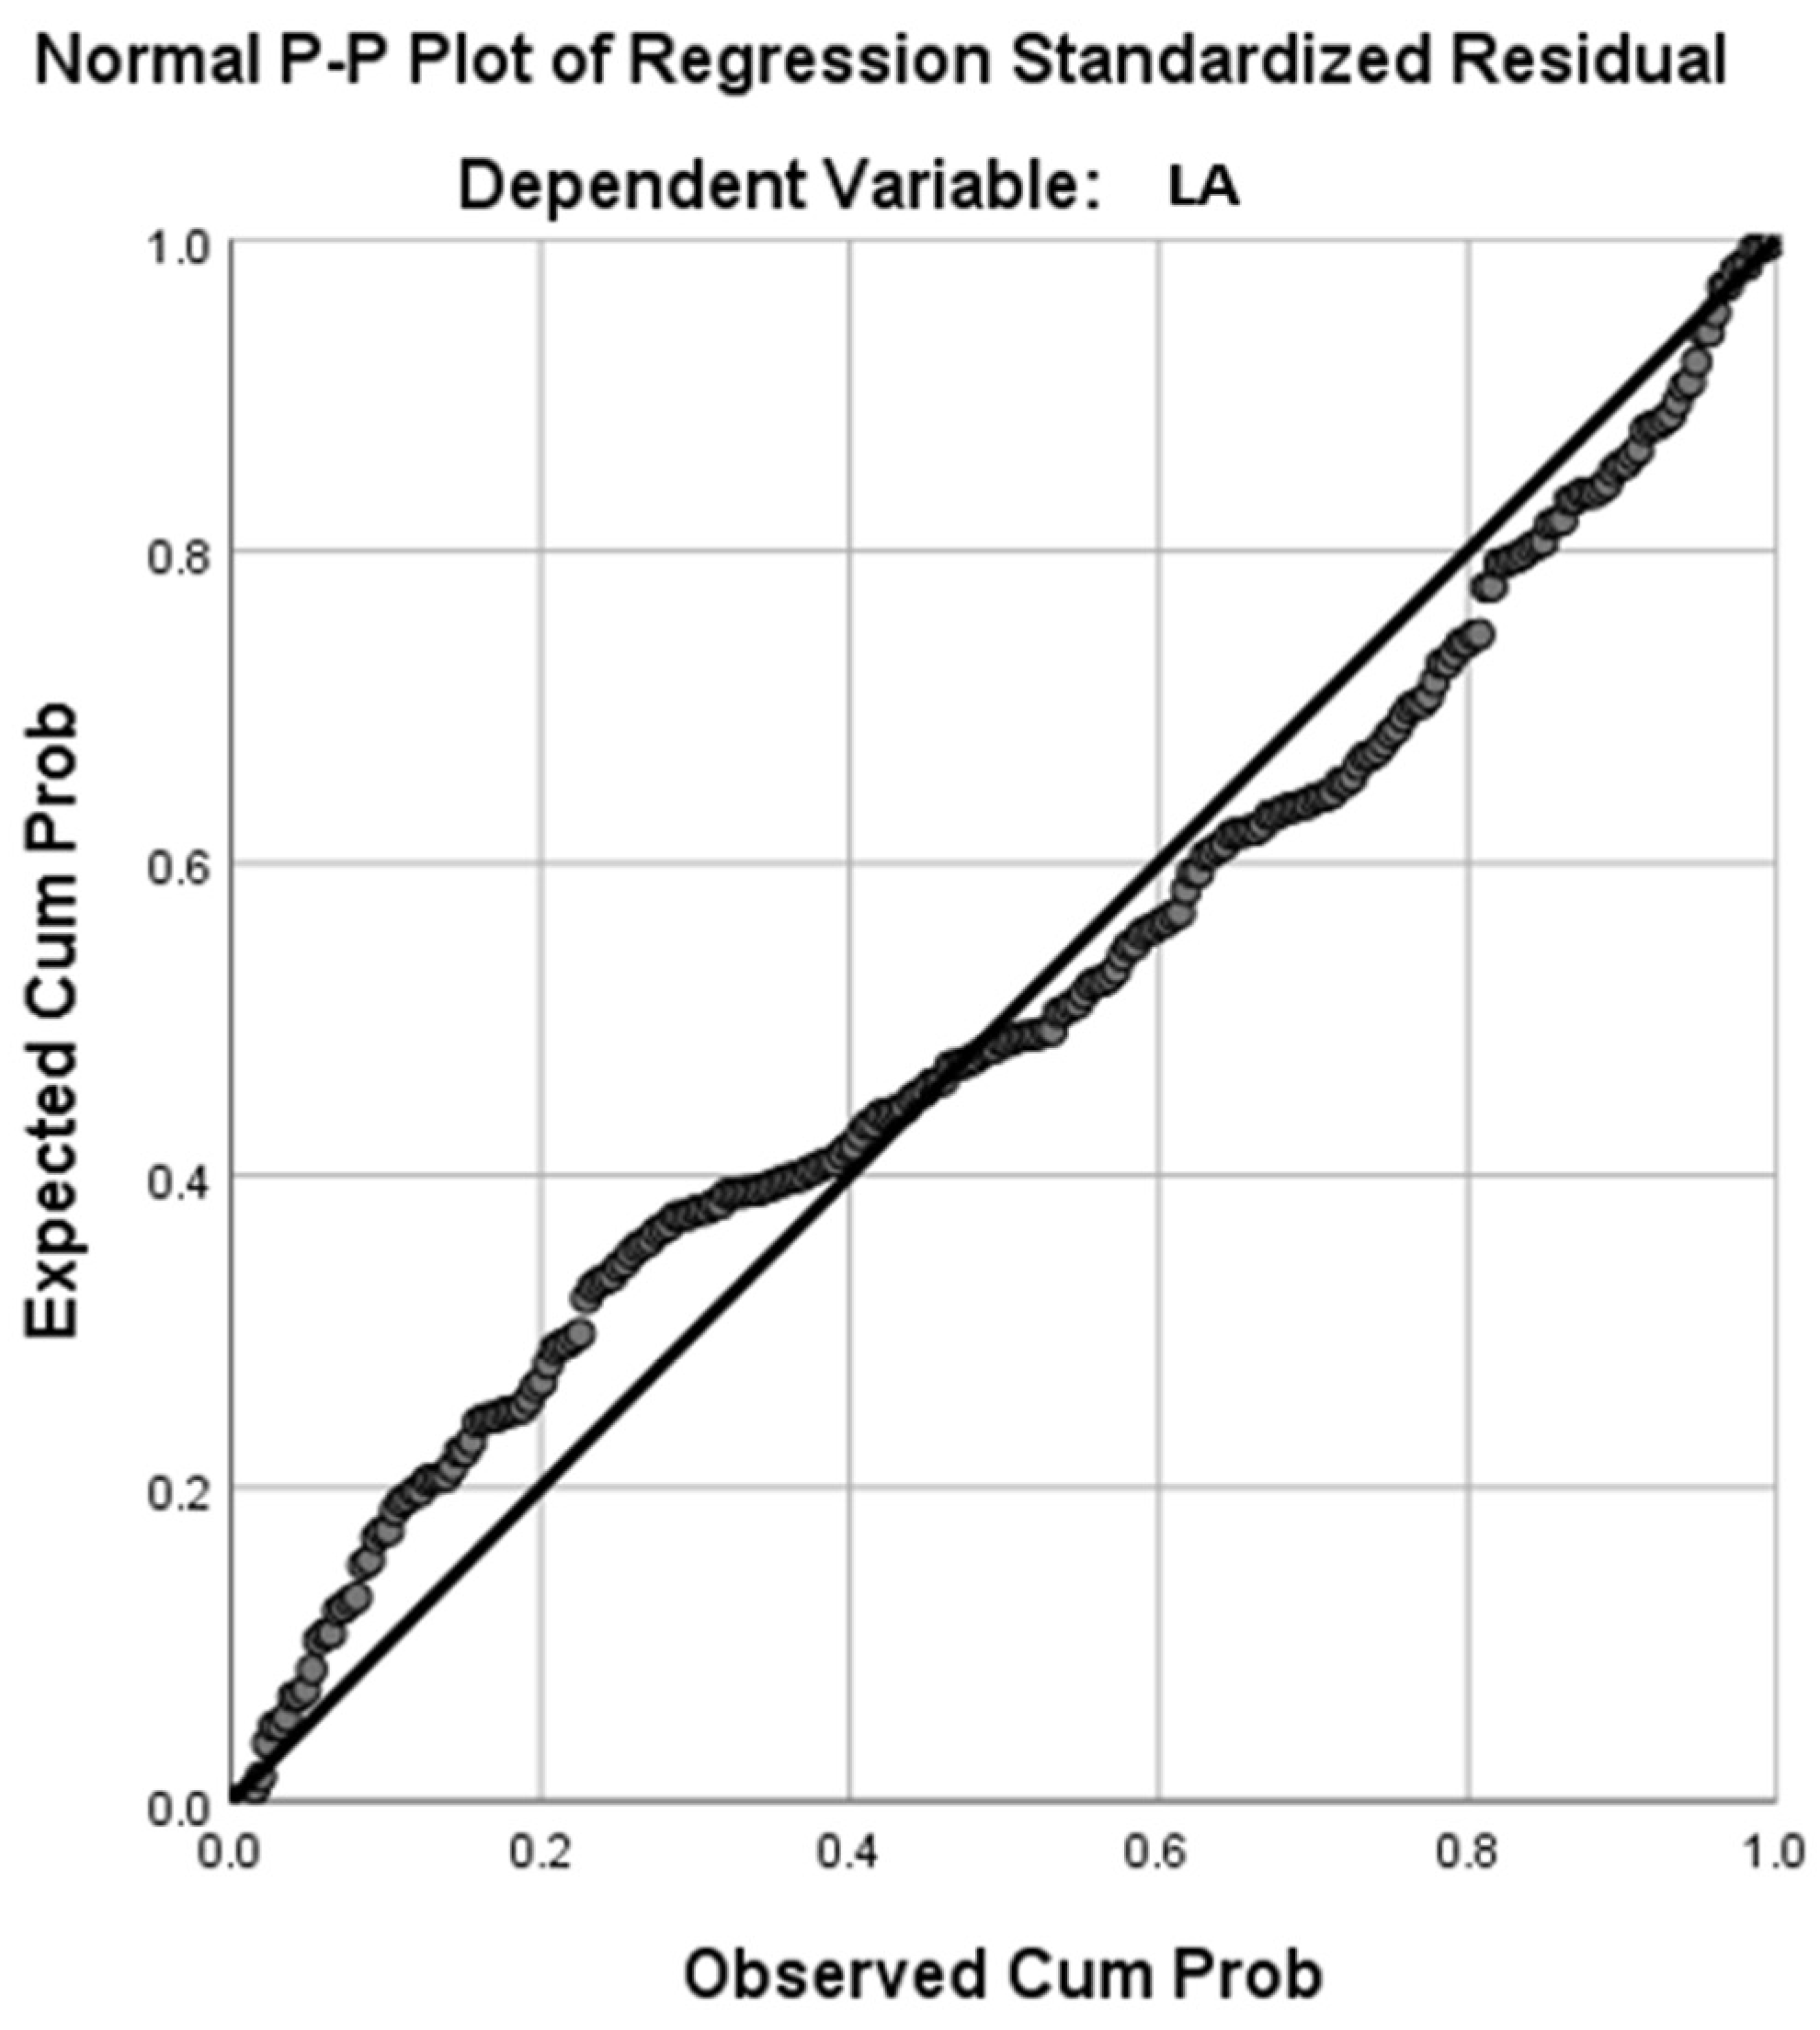
Regarding the test of the standard distribution assumption, looking at Figure 2, it could be seen that the normalized residue is distributed according to the bell curve, or the shape of the standard distribution. In addition, the mean is 1.37 × 10⁻¹⁵ (approximately = 0), and the standard deviation is 0.983 (approximately = 1). In addition, the Normal P-P Plot (Figure 3) shows that the observed values and expected values are all around the diagonal with no major deviations from the diagonal. This shows that the normalized residue approximates the normal distribution. Thus, it is assumed that the standard distribution of the balance is not violated.
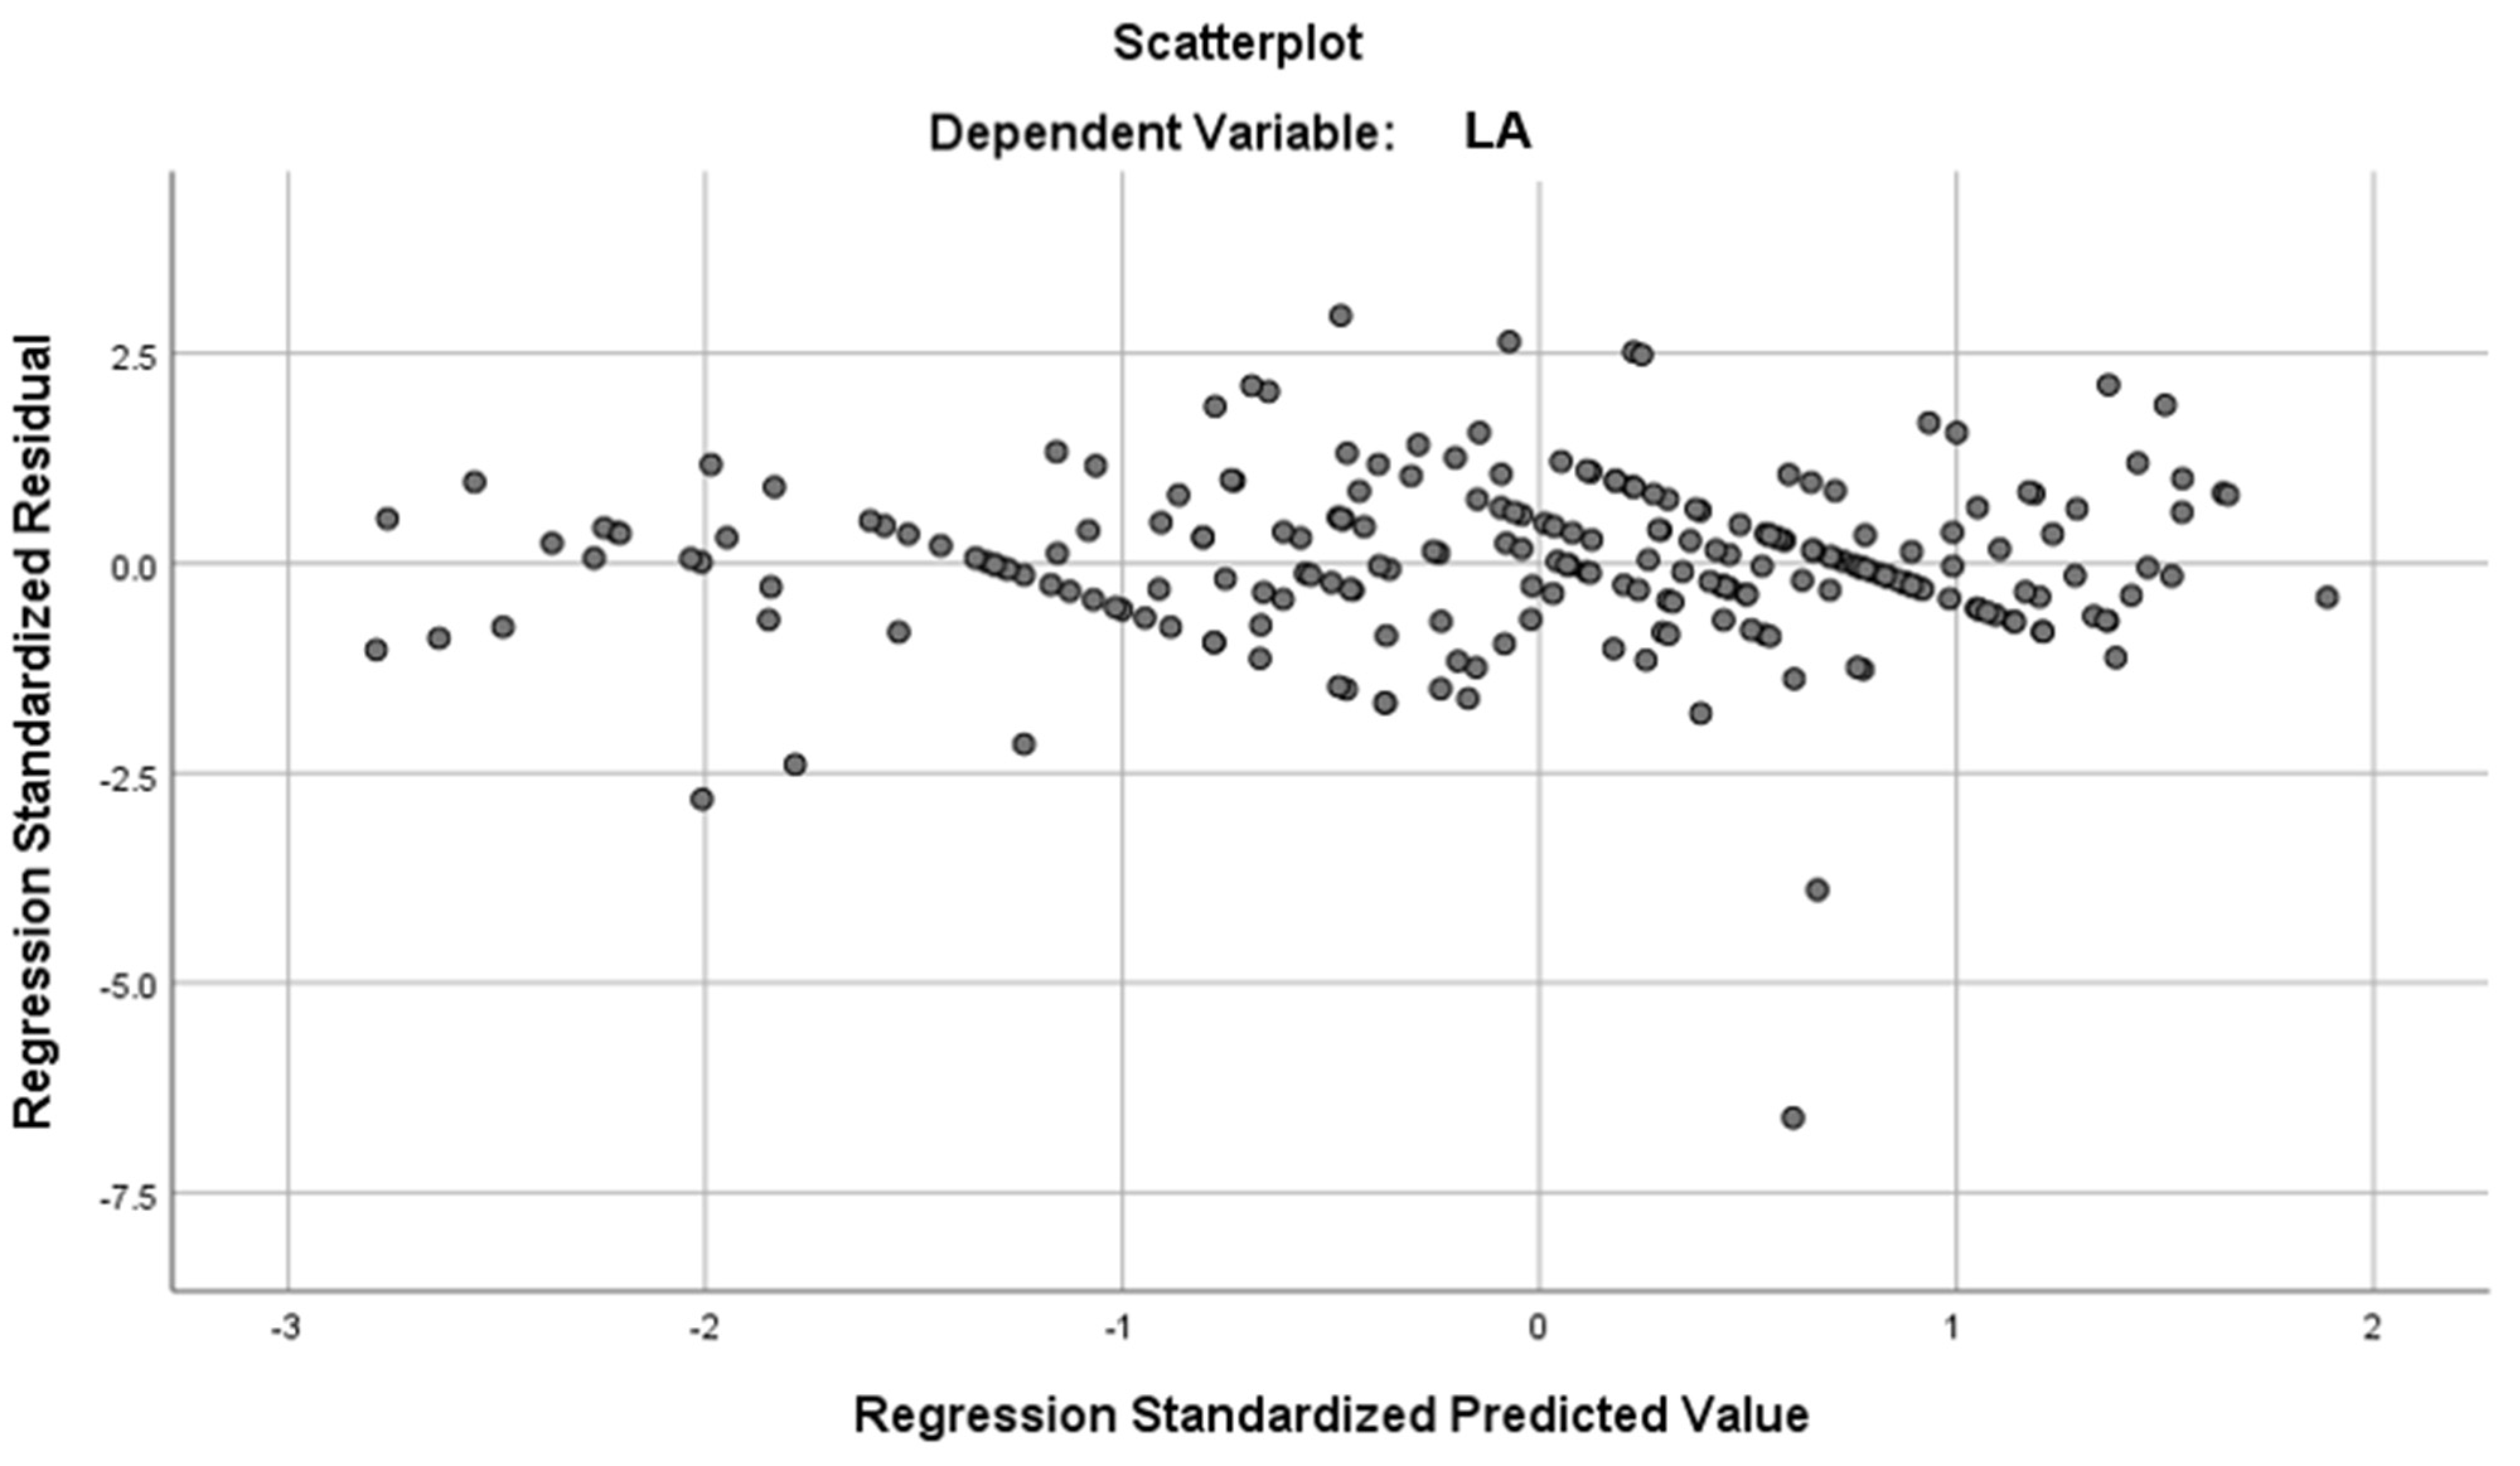
Regarding the test of linear contact and constant variance consumptions, to test these assumptions, the study used the Scatterplot scatter chart. Looking at Figure 4, it could be seen that the data points are concentrated around the zero point and tend to form a straight line. Thus, the assumptions of linear contact and constant variance of residual are not violated.

5. Discussion

The above results show that the scales of the study are reliable to use for exploratory factor analysis, the dependent variables and independent variables are strongly correlated with each other, there is no multicollinearity phenomenon between the dependent variables, the observed variables are meaningful to contribute to the model, and the assumptions in the regression analysis are not violated. All 8 factors representing 27 observed variables have a favorable influence on the application of lean accounting in Vietnamese garment enterprises; the level of influence of the factors is different and is arranged in descending order as follows:

5.1. Leadership Factor

Leadership factor has a positive relationship with lean accounting, which is also the most powerful of the eight factors. In the context that other factors are unchanged, the leadership factor increases by 1 point, and the ability to apply lean accounting increases by 0.293 points. Among the observation variables of the leadership factor, “Measures to promote the application of lean accounting by business leaders” is rated as having the greatest influence, followed by “The attitude of supporting lean accounting of business leaders”, “Commitment to ensuring the rights of accounting staff of business leaders”, and, finally, “Leadership awareness of lean accounting”. This result is consistent with the research of Darabi et al. (2012) and Rehman et al. (2021), which argues that ignorance or disapproval of business leaders will hinder the adoption of lean accounting. This is also consistent with the fact that leadership is the highest level of decision making and has the greatest influence on all activities of the business, so leadership has a great influence on the application of the lean accounting of the business. In addition, this result also explains the link between the fact that Vietnamese garment enterprises have not applied lean accounting with the fact that top managers (often with little accounting expertise) and even senior accountants do not really understand this new type of accounting.

5.2. Size Factor

Size factor has a positive relationship with the application of lean accounting. The larger the firm, the higher the ability to apply lean accounting. In the context that other factors are stable, the size factor increases by 1 point, and the ability to apply lean accounting increases by 0.241 points, in which the observation variable is the most appreciated capital source, followed by the number of employees and, finally, the revenue. This result is compatible with the survey results that show that firms that have used lean accounting are only large and medium-sized. The larger the firm, the higher the management requirements, the stronger the resources, and the higher the ability to apply lean accounting.

5.3. Cost of Implementation Factor

The cost of the implementation factor has a positive relationship with the application of lean accounting. The higher the cost of implementing that lean accounting has, the higher the likelihood of applying lean accounting is. In the context that other factors are unchanged, the cost factor increases by 1 point, and the ability to apply lean accounting increases by 0.192 points. Among the observed variables of this factor, the consultant cost is the highest, followed by accounting staff cost and, finally, facility cost. This result is consistent with the research of Darabi et al. (2012) and Rehman et al. (2021), who argued that a high cost of technology hinders the adoption of lean accounting.

5.4. Accounting Department

The accounting department factor has a positive relationship with the application of lean accounting. In the case that other factors are unchanged, the factor of the accounting department increases by 1 point, and the ability to apply lean accounting increases by 0.186 points. Among the observed variables of this factor, a supportive attitude of the accounting staff is rated as the highest, followed by the accounting staff’s knowledge, skills, and capacity to perform lean accounting and, finally, the understanding of accounting staff about the production and business processes of the firm. This result is consistent with the research of Grasso (2006), Darabi et al. (2012), McVay et al. (2013), and Rehman et al. (2021), who believe that the ignorance, protest, fear of losing a job, etc. of corporate accounting staff will obstruct the application of lean accounting.

5.5. Education and Training Factor

Research results show that the education and training factor has a positive relationship with the application of lean accounting. In the context of other factors unchanged, the factor of education and training increased by 1 point, and the ability to apply lean accounting increased by 0.137 points. In particular, the observation variable “The teaching of lean accounting at educational and training institutions” has the highest influence, followed by “The guidance documents on lean accounting” and, finally, “The training programs on lean accounting of firms”. This result is consistent with that of the research of Carnes and Hedin (2005) and Grasso (2006), who said that a lack of education and training obstructs lean accounting. In Vietnam, the curriculum of schools and institutes at all levels often focuses on teaching financial accounting and traditional management accounting. The same situation occurs with vocational certification training programs of the accounting industry, such as a chief accountant certification, COA, ACCA, CMA, etc. Lean accounting is almost not taught, and if at all, it is just introductory and comparatively brief. This is the main cause leading to the lack of knowledge of lean accounting. Thus, the more education and training programs, as well as guidance documents, on lean accounting, the higher the ability to apply lean accounting.

5.6. Resource Factor

The resource factor has a positive relationship with lean accounting application. Supposing that other factors are unchanged, the resource factor increases by 1 point, and the ability to apply lean accounting increases by 0.120 points, in which the observation variable human resources is evaluated to be the highest, followed by time and, finally, financial resources. This result is related to that of the research of Darabi et al. (2012) and Rehman et al. (2021) stated that the lack of resources hinders the adoption of lean accounting. In other words, the more resources a business devotes to accounting, the higher its ability to apply lean accounting.

5.7. Culture Factor

The cultural factor has a reversible relationship with lean accounting application. In the context that other factors stay the same, the cultural factor increases by 1 point, and the ability to apply lean accounting increases by 0.110 points. In particular, the observation variables CT1, “Collaborative culture”, and CT2, “Continuous improvement culture”, have the highest average (3.335) and the lowest, CT3, or “Employee empowerment culture”, with an average of 3.31. This result is parallel with the research of Grasso (2006) and Rehman et al. (2021), who thought that a lean corporate culture hinders the adoption of lean accounting. This result means that the more you build a lean corporate culture (collaborative, continuous improvement, and employee empowerment), the greater your ability to apply lean accounting is.

5.8. Competitive Pressure Factor

The competitive pressure factor has a positive correlation with lean accounting application. This is the factor with the lowest impact. In the condition that other factors remain unchanged, the competitive pressure factor increases by 1 point, and the ability to apply lean accounting only increases by 0.093 points. In particular, the observation variable CP3, “Competition in selling products”, has the highest average (3.40), followed by CP1, “Competitive in buying materials”, with an average of 2.40 and, finally, CP2, “Competitive in selling products”, with an average of 2.37. Thus, the more competitive the business environment in which firms operate, the higher the ability to apply lean accounting.

6. Conclusions and Recommendations

The research results show that Vietnamese garment enterprises have not applied lean accounting yet, and the level of knowledge of lean accounting is still low. However, a lot of opinions highly appreciate the important role of lean accounting. In order to promote the application of lean accounting in Vietnamese garment enterprises, the study proposes some recommendations and policy implications as follows:
For garment enterprises in Vietnam, enterprises need to have a clear and long-term strategic plan, which is very important for businesses. Because lean accounting is associated with lean practices, the appearance of lean practices has led to the birth of lean accounting. Enterprises often apply food production first and then apply science and technology. Therefore, a clear and long-term strategic plan will be the motivation for enterprises to apply a climate change. In contrast, the application of lean accounting is one of the factors that helps businesses apply lean practices successfully.
In order to create a transformation in accounting, business leaders and accountants must understand the business environment and production processes of enterprises. Understanding will help them overcome barriers of fear, a lacking education system, and the ability to resist cultural change. Enterprises need to have detailed and appropriate training courses and seminars to train leaders and accountants.
When building a lean practice company culture, enterprises need to have a single unified goal of creating value for customers, always have a spirit of cooperation, strive for continuous improvement, and ensure that employees are empowered to decide in a suitable scope. Enterprises are not top-down management but bottom-up management because senior management must unleash the creativity of the workforce.
A communication system also needs to be established. Effective communication allows the faster dissemination of the concepts, benefits, and tools of lean accounting among employees in the enterprise.
Adequate resources for the application of lean accounting should be considered by enterprises. Costs and resources can be specifically planned to bring about appropriate change.
Business leaders talk to accountants about the benefits of new technology and advise and motivate them to minimize fears about the unknown, losing jobs, losing power, and an inability to accept new changes.
For agencies and organizations outside the garment enterprises, while the Ministry of Finance is the highest state management agency in accounting, the Accounting and Auditing Association is the professional organization with the most important role in accounting activities. Therefore, these two units need to be pioneers in the awareness of lean accounting. The Ministry of Finance and the Association of Accountants and Auditors need to coordinate to orient, develop theoretical frameworks, and encourage scholars to study on lean accounting. These units need to organize training courses and seminars, and release materials on lean accounting to improve understanding of information and communication.
The Vietnam Textile and Garment Association holds great importance in the operational orientation of garment enterprises. Therefore, the Association also needs to have a full awareness of the role of lean accounting, as well as research on lean accounting associated with the characteristics of the garment industry to have the right orientations for enterprises.
Educational and training institutions are extremely important in providing accounting knowledge and skills. Therefore, these establishments need to update new accounting knowledge in general as well as lean accounting in particular to keep up with the development of accounting in the world and meet the labor needs of society. Educational and training institutions also need to coordinate with garment enterprises to organize training courses on lean accounting associated with the characteristics of the garment industry for the accounting of these enterprises and provide necessary advice for the application of lean accounting at garment enterprises.
Regarding the limitations of the study, the study was conducted on the basis of the answer sheet of 140 garment enterprises, so the research sample may not be large. No stratified random sampling has been performed to ensure that surveyed enterprises represent Vietnamese garment enterprises in the overall survey. The fact that each garment company answers a survey can help the research results not depend too much on one enterprise, but it can also be skewed if the respondent lacks an understanding of the questionnaire, does not understand the question correctly, and does not provide the correct or leaves it incomplete. We go to study the factors affecting the application of lean accounting, but we have not studied the reasons that the business has not applied lean accounting. This is the limitation of our study: that we have not learned more about why it has not been applied or what the difficulties in applying lean accounting are.
As a suggestion for the future research, from the results and limitations of the study, the next research direction can be implemented, including increasing the number of surveyed enterprises, ensuring the survey for each enterprise has 3 to 5 votes, and choosing randomly stratified samples to increase the reliability of the research results. More independent variables should also be researched to be able to more fully identify the factors affecting the application of lean accounting in Vietnamese garment enterprises. We also need to study the factors affecting the application of lean accounting in enterprises in other fields so that it can be confirmed whether the factors affecting the application of lean accounting depend on the characteristics of the business sector.

Author Contributions

Conceptualization—T.M.P.N. and T.H.C.N.; Methodology—T.M.P.N. and T.H.C.N.; Validation—T.M.P.N. and T.H.C.N.; Writing, Review & Editing—T.M.P.N. and T.H.C.N.; Visualization—T.H.C.N.; Supervision—T.M.P.N. All authors have read and agreed to the published version of the manuscript.

Funding

This research received no external funding.

Data Availability Statement

Data supporting the reported results can be requested from the authors.

Conflicts of Interest

The authors declare that there is no conflict of interest.

Appendix A. Factors Influencing the Application of Lean Accounting and Observed Variables

Factor InfluenceObserved VariablesSource
1. Size (SZ)SZ11.1 Number of employeesTran (2016); Chenhall (2003); Ngo (2021).
SZ21.2 Sources of funds
SZ31.3 Revenue
2. Competitive pressure (CP)CP12.1 Competition in buying materialsTran (2016); Doan (2016); Ngo (2021).
CP22.2 Competition in recruiting workers
CP32.3 Competition in selling products
3. Resources (RS)RS13.1 Human resourcesDarabi et al. (2012).
RS23.2 Financial resources
RS33.3 Time
4. Leadership (LD)LD14.1 Commitment to long-term lean accounting applicationRehman et al. (2021); Grasso (2006); Stenzel (2007); McVay et al. (2013).
LD24.2 Awareness of lean accounting
LD34.3 Attitude in favor of lean accounting
LD44.4 Measures to promote the application of lean accounting
LD54.5 Commitment to ensure benefits for accountants
5. Accounting department (AD)AD15.1 Knowledge, skills and capacity to implement lean accounting of accounting staffMcVay et al. (2013); Stenzel (2007); Grasso (2006); Rehman et al. (2021); Carnes and Hedin (2005).
AD25.2 The understanding of accounting staff about the production and business process
AD35.3 Supportive attitude of accounting staff
AD45.4 The connection between the accounting department and other departments
6. Culture of firms (CT)CT16.1 Collaboration culture Grasso (2006); Rehman et al. (2021)
CT26.2 Continuous improvement culture
CT36.2 Employee empowerment culture
7. Cost of implemention (CO)CO17.1 Facilities costsTran (2016); Rehman et al. (2021); Darabi et al. (2012)
CO27.2 Accounting staff costs
CO37.3 Consultant costs
8. Education and training (ET)ET18.1 Educational institutions, teaching training on lean accountingCarnes and Hedin (2005); Grasso (2006); Rehman et al. (2021).
ET28.2 Firms organizing training programs on lean accounting
ET38.3 Guidance documents on lean accounting

Appendix B. Survey of Factors Affecting the Application of Lean Accounting in Firms

Degree of ConsentStrongly DisagreeDisagreeNormalAgreeStrongly Agree
Measurement Scale
1. Scale firms
1.1 Large number of employees12345
1.2 High revenue12345
1.3 Total capital12345
2. Competitive pressures
2.1 Firms must compete to buy materials12345
2.2 Firms must compete when recruiting workers12345
2.3 Firms must compete when selling products12345
3. Resources of firms
3.1 Firms have enough human resources to apply lean accounting12345
3.2 Firms have sufficient financial resources to apply lean accounting12345
3.3 Firms have enough time to apply lean accounting12345
4. Leadership of firms
4.1 Leaders are committed to long-term lean accounting application12345
4.2 Firm leaders have good awareness of lean accounting12345
4.3 Firm leaders have an attitude in favor of lean accounting12345
4.4 Firm leaders have measures to promote the application of lean accounting
4.5 Leaders are committed to ensure benefits for accountants12345
5. Accounting staff of firms
5.1 Accounting staff with knowledge, skills and competencies to implement lean accounting12345
5.2 Accounting staff who are knowledgeable about the production and business process of firms12345
5.3 The accounting staff has an attitude in favor of lean accounting12345
6. Firms’ culture
6.1 Firms have a culture of cooperation 12345
6.2 Firms have a culture of continuous improvement12345
6.3 Firms have a culture of employee empowerment12345
7. Cost of implementing lean accounting
7.1 Low cost of infrastructure investment12345
7.2 Low cost of accounting staff12345
7.3 Low cost of hiring consultants12345
8. Education and training
8.1 Educational and training institutions that teach lean accounting12345
8.2 Firms organize training programs on lean accounting12345
8.3 Guidelines on lean accounting practice are provided12345
9. Apply lean accounting
9.1 Applying Lean principles to Accounting Processes 12345
9.2 Applying lean accounting to Value Flow Management12345
9.3 Apply lean accounting to calculate product costs12345
9.4 Applying lean accounting to Inventory Management12345
9.5 Applying lean accounting to Capacity Management12345
9.6 Applying lean accounting to Support Decision Making12345
9.7 Apply lean accounting to make estimates and lean accounting plans12345
9.8 Applying lean accounting to Evaluate Performance12345
9.9 Apply lean accounting to make reports12345

References

  1. Achanga, Pius, Esam Shehab, Rajkumar Roy, and Geoff Nelder. 2006. Critical success factors for lean implementation within SMEs. Journal of Manufacturing Technology Management 17: 460–71. [Google Scholar] [CrossRef]
  2. Arora, Vineeta, and G. Soral. 2017. Conceptual issues in lean accounting: A review. IUP Journal of Accounting Research & Audit Practices 16: 54–63. Available online: https://www.proquest.com/docview/1926896917?pq-origsite=gscholar&fromopenview=true (accessed on 9 February 2022).
  3. Brosnahan, Jan P. 2008. Unleash the Power of Lean Accounting. Journal of Accountancy 206: 60–62, 64, 66. [Google Scholar]
  4. Carnes, Kay, and Scott Hedin. 2005. Accounting for Lean Manufacturing: Another Missed Opportunity? Management Accounting Quarterly 7: 28–35. Available online: https://www.proquest.com/scholarly-journals/accounting-lean-manufacturing-another-missed/docview/222802565/se-2 (accessed on 10 February 2022).
  5. Chenhall, Robert H. 2003. Management control systems design within its organizational context: Findings from contingency-based research and directions for the future. Accounting, Organizations and Society 28: 127–68. [Google Scholar] [CrossRef]
  6. Cunningham, Jean E., Orest J. Fiume, and Emily Adams. 2003. Real Numbers: Management Accounting in a Lean Organization. Durham: Managing Times Press. [Google Scholar]
  7. Darabi, Roya, Razieh Moradi, and Usef Toomari. 2012. Barriers to implementation of lean accounting in manufacturing companies. International Journal of Business and Commerce 1: 38–51. Available online: https://www.ijbcnet.com/1-9/IJBC-12-1804.pdf (accessed on 20 February 2022).
  8. Doan, Ngoc Phi Anh. 2016. Factors Affecting the Use and Consequences of Management Accounting Practices in A Transitional Economy: The Case of Vietnam. Journal of Economics and Development 18: 54–73. [Google Scholar] [CrossRef]
  9. Dormann, Carsten F., Jane Elith, Sven Bacher, Carsten Buchmann, Gudrun Carl, Gabriel Carré, Jaime R. García Marquéz, Bernd Gruber, Bruno Lafourcade, Pedro J. Leitão, and et al. 2013. Collinearity: A review of methods to deal with it and a simulation study evaluating their performance. Ecography 36: 27–46. [Google Scholar] [CrossRef]
  10. Field, Andy. 2009. Discovering Statistics Using SPSS, 3rd ed. London: Sage Publications Ltd. Available online: https://www.academia.edu/24632540/Discovering_Statistics_Using_SPSS_Introducing_Statistical_Method_3rd_edition_2 (accessed on 20 January 2022).
  11. Grasso, Lawrence P. 2006. Barriers to lean accounting. Cost Management 20: 6–19. [Google Scholar] [CrossRef]
  12. Hair, W. Black, Jr., B. Babin, and R. Anderson. 2009. Multivariate Data Analysis, 7th ed. Hoboken: Prentice Hall. Available online: https://www.drnishikantjha.com/papersCollection/Multivariate%20Data%20Analysis.pdf (accessed on 20 January 2022).
  13. Hoang, Trong, and Nguyen Mong Ngoc Chu. 2008. Analyze Research Data with SPSS. Ho Chi Minh: Hong Duc Press. [Google Scholar]
  14. Krafcik, John F. 1988. Triumph of the lean production system. Sloan Management Review 30: 41–52. Available online: https://www.proquest.com/docview/224963951?pq-origsite=gscholar&fromopenview=true (accessed on 10 January 2022).
  15. Kumar, Rakesh, and Vikas Kumar. 2014. Barriers in implementation of lean manufacturing system in Indian industry: A survey. International Journal of Latest Trends in Engineering and Technology 4: 243–51. Available online: http://www.ijltet.org/wp-content/uploads/2014/07/33.pdf (accessed on 10 January 2022).
  16. Kuo, Szu-Yu, and Pei-Chun Lin. 2020. Determinants of green performance in container terminal operations: A lean management. Journal of Cleaner Production 275: 123105. [Google Scholar] [CrossRef]
  17. Le, T. K. O. 2015. Proposal to apply lean production—Lean—For the case of Saigon garment joint stock company 2. Journal of Science, Technology & Food 5: 142–52. [Google Scholar]
  18. Lodgaard, Eirin, Jonas A. Ingvaldsen, Inger Gamme, and Silje Aschehoug. 2016. Barriers to Lean Implementation: Perception of Top Managers, Middle Managers and Workers. Procedia CIRP 57: 595–600. [Google Scholar] [CrossRef]
  19. Maskell, Brian H. 2000. Lean accounting for lean manufacturers. Manufacturing Engineering 125: 46–53. Available online: https://www.proquest.com/trade-journals/lean-accounting-manufacturers/docview/219714512/se-2 (accessed on 5 February 2022).
  20. Maskell, Brian H., and Bruce L. Baggaley. 2006. Lean accounting: What’s it all about? Target Magazine 22: 35–43. Available online: https://www.ame.org/sites/default/files/target_articles/06-22-1-Lean_Accounting.pdf (accessed on 10 February 2022).
  21. Maskell, Brian H., and Frances A. Kennedy. 2007. Why do we need lean accounting and how does it work? Journal of Corporate Accounting and Finance 18: 59–73. [Google Scholar] [CrossRef]
  22. Maskell, Brian H., Bruce Baggaley, and Larry Grasso. 2011. Practical Lean Accounting: A Proven System for Measuring and Managing the Lean Enterprise. New York: CRC Press. [Google Scholar]
  23. McVay, Gloria, Frances Kennedy, and Rosemary Fullerton. 2013. Accounting in the Lean Enterprise: Providing Simple, Practical, and Decision-Relevant Information. New York: Taylor & Francis Group. [Google Scholar]
  24. Merwe, A. Van Der, and J. Thomson. 2007. The lowdown on Lean Accounting: Should management accountants get on the bandwagon-or not? Strategic Finance 2: 26–33. [Google Scholar]
  25. Mize, Joe, Deborah Nightingale, Abhinav Taneja, and David Tonaszuck. 2000. Transitioning to a Lean Enterprise: A Guide for Leaders, Volume I, Executive Overview. Available online: https://dspace.mit.edu/handle/1721.1/81896 (accessed on 12 January 2022).
  26. Ngo, T. T. 2021. Factors Affecting the Use of Performance Measures of Vietnamese Manufacturing Enterprises. Ph.D. dissertation, National Economics University, Hanoi, Vietnam. [Google Scholar]
  27. Nguyen, Đạt Minh, Danh Nguyên Nguyen, and Anh Tuấn Le. 2015. Framework of Critical Success Factors for Lean Implementation in Vietnam Manufacturing Enterprises. VNU Journal of Science: Economics and Business 31: 33–41. Available online: https://js.vnu.edu.vn/EAB/article/view/338 (accessed on 10 February 2022).
  28. Nguyen, Đạt Minh, Danh Nguyen Nguyễn, and Anh Tuấn Le. 2017. Factors affecting the application of lean production methods in enterprises in Vietnam. Vietnam Journal of World Economics and Politics 12: 41–48. Available online: https://www.academia.edu/35600430/C%C3%81C_NH%C3%82N_T%E1%BB%90_T%C3%81C_%C4%90%E1%BB%98NG_%C4%90%E1%BA%BEN_VI%E1%BB%86C_%C3%81P_D%E1%BB%A4NG_PH%C6%AF%C6%A0NG_PH%C3%81P_S%E1%BA%A2N_XU%E1%BA%A4T_TINH_G%E1%BB%8CN_TRONG_C%C3%81C_DOANH_NGHI%E1%BB%86P_T%E1%BA%A0I_VI%C3%8AT_NAM (accessed on 9 February 2022).
  29. Nguyen, V. H. 2020. Applying lean accounting in enterprises and some recommendations. Review of Finance 1: 95–98. Available online: https://tapchitaichinh.vn/ap-dung-mo-hinh-ke-toan-tinh-gon-trong-doanh-nghiep-va-mot-so-de-xuat.html (accessed on 9 February 2022).
  30. Nordin, Norani, Baba Md Deros, and Dzuraidah Abd Wahab. 2010. A survey on lean manufacturing implementation in Malaysian automotive industry. International Journal of Innovation, Management and Technology 1: 374–80. [Google Scholar]
  31. Ofileanu, Dimi, and Dan Ioan Topor. 2014. Lean Accounting—An Ingenious Solution for Cost Optimization. The International Journal of Academic Research in Business and Social Sciences 4: 342–52. [Google Scholar] [CrossRef] [PubMed]
  32. Oyewo, Babajide, Vincent Tawiah, and Abdulrasheed Zakari. 2022. Actualising Agenda 2030 through Sustainability Accounting: Evidence from the Nigerian Manufacturing Sector. Environmental Sustainability and Agenda 2030: 105–33. [Google Scholar] [CrossRef]
  33. Pham, Q. H. 2011. Analysis of the Lean Production Process and Accounting Features in the Current Lean Accounting Model. Available online: https://www.sav.gov.vn/SMPT_Publishing_UC/TinTuc/PrintTL.aspx?idb=2&ItemID=1705&l=/noidung/tintuc/Lists/Nghiencuutraodoi (accessed on 10 February 2022).
  34. Pirraglia, Adrian, Daniel Saloni, and Herman Van Dyk. 2009. Status of lean manufacturing implementation on secondary wood industries including residential, cabinet, millwork, and panel markets. BioResources 4: 1341–58. Available online: https://www.researchgate.net/publication/26850232_Status_of_lean_manufacturing_implementation_on_secondary_wood_industries_including_residential_cabinet_millwork_and_panel_markets (accessed on 22 January 2022).
  35. Ramasamy, Karuppuchamy. 2005. A Comparative Analysis of Management Accounting Systems on Lean Implementation. Master’s dissertation, University of Tennessee, Knoxville, TN, USA. Available online: https://trace.tennessee.edu/cgi/viewcontent.cgi?article=3758&context=utk_gradthes (accessed on 10 February 2022).
  36. Rao, Manjunath H. S., and Andrew Bargerstock. 2011. Exploring the role of standard costing in lean manufacturing enterprises: A structuration theory approach. Management Accounting Quarterly 13: 47–60. Available online: https://www.proquest.com/scholarly-journals/exploring-role-standard-costing-lean/docview/2437890723/se-2 (accessed on 10 February 2022).
  37. Rehman, Muhammad Zia, Eiman Malik, Sajjad Ahmad Baig, Hakeem Rehman, and Muhammad Hashim. 2021. Lean accounting awrareness: A qualitative study on lean accounting perception. International Journal of Management 12: 28–42. [Google Scholar] [CrossRef]
  38. Ruiz de Arbulo-Lopez, Patxi Ruiz, and Jordi Fortuny-Santos. 2010. An accounting system to support process improvements: Transition to lean accounting. Journal of Industrial Engineering and Management 3: 576–602. [Google Scholar] [CrossRef]
  39. Sakataven, Raja Surian, Syed Ahmad Helmi, and Muhammad Hisjam. 2021. Lean implementation barriers and their contextual relationship in contract manufacturing machining company. Evergreen Joint Journal of Novel Carbon Resource Sciences & Green Asia Strategy 8: 499–508. [Google Scholar] [CrossRef]
  40. Salonitis, Konstantinos, and Christos Tsinopoulos. 2016. Drivers and Barriers of Lean Implementation in the Greek Manufacturing Sector. Procedia CIRP 57: 189–94. [Google Scholar] [CrossRef]
  41. Shah, Rachna, and Peter T. Ward. 2003. Lean Manufacturing: Context, Practice Bundles, and Performance. Journal of Operations Management 21: 129–49. [Google Scholar] [CrossRef]
  42. Shah, Zahid Abbass, and Hadia Hussain. 2016. An investigation of lean manufacturing implementation in textile sector of Pakistan. Paper presented at 2016 International Conference on Industrial Engineering and Operations Management, Kuala Lumpur, Malaysia, March 8–10; pp. 8–10. Available online: https://scholar.google.com.vn/scholar?q=An+investigation+of+lean+manufacturing+implementation+in+textile+sector+of+Pakistan&hl=en&as_sdt=0&as_vis=1&oi=scholart (accessed on 10 February 2022).
  43. Stenzel, Joe. 2007. Lean Accounting: Best Practices for Sustainalr Intergration. Hoboken: John Wiley and Sons, Inc. [Google Scholar] [CrossRef]
  44. Timm, Patricia Hart. 2015. Perceptions of Value-Stream Costing and the Effect on Lean-Accounting Implementation. Ph.D. dissertation, Walden University, Minneapolis, MN, USA. Available online: https://scholarworks.waldenu.edu/cgi/viewcontent.cgi?article=2371&context=dissertations&httpsredir=1&referer= (accessed on 10 February 2022).
  45. Tran, N. H. 2016. Factors Affecting the Application of Management Accounting in SMEs in Vietnam. Ph.D. dissertation, University of Economics Ho Chi Minh City, Ho Chi Minh City, Vietnam. [Google Scholar]
  46. Turesky, Elizabeth F., and Patrick Connell. 2010. Off the rails: Understanding the derailment of a lean manufacturing initiative. Organization Management Journal 7: 110–32. [Google Scholar] [CrossRef]
  47. VCBS. 2022. Báo Cáo Nhanh Ngành Dệt may 9T. 2022. Truy Cập Tại. Available online: https://vcbs.com.vn/api/v1/ttpt-reports/download-with-token?download_token=49c97ab2-5d23-405a-b068-827d32be7dd7&locale=vi (accessed on 15 November 2022).
  48. Womack, James P., Daniel T. Jones, and Daniel Roos. 2007. The Machine That Changed the World: The Story of Lean Production—Toyota’s Secret Weapon in the Global Car Wars That Is Now Revolutionizing World Industry. New York: Free Press. Available online: https://www.academia.edu/35690909/The_machine_that_changed_the_world (accessed on 10 February 2022).
Figure 1. Research model proposed.
Jrfm 16 00279 g001
Figure 2. Histogram. Source: Data analysis results from SPSS 26.
Jrfm 16 00279 g002
Figure 3. Normal P-P Plot of Regression Standardized Residual. Source: Data analysis results from SPSS 26.
Jrfm 16 00279 g003
Figure 4. Scatterplot scatter chart. Source: Data analysis results from SPSS 26.
Jrfm 16 00279 g004
Table 1. Cronbach’s Alpha Scale Reliability Test Results.
ItemsSZCPRSLDADCTCOETLATotal
Cronbach’s Alpha0.7870.7820.8270.8670.8420.8040.7700.7890.942
Number of inspection observations03030305040303030936
Number of observations accepted03030305040303030936
Number of observations removed00000000000000000000
Source: Data analysis results from SPSS 26.0.
Table 2. Cronbach’s Alpha coefficient.
ItemsScale Mean If Item DeletedScale Variance If Item DeletedCorrected Item-Total CorrelationCronbach’s Alpha If Item Deleted
Scale SZ; Cronbach’s Alpha = 0.787
SZ17.933.1820.6140.726
SZ28.153.0980.5910.748
SZ37.952.6700.6800.651
Scale CP; Cronbach’s Alpha = 0.763
CP15.942.8180.6220.703
CP25.892.6060.6710.647
CP34.873.4810.5840.749
Scale RS; Cronbach’s Alpha = 0.827
RS16.742.3840.6790.768
RS26.852.1960.7020.745
RS36.772.4110.6760.771
Scale LD; Cronbach’s Alpha = 0.867
LD115.808.6660.6900.839
LD216.559.5510.6510.850
LD315.898.5230.7270.830
LD415.868.5530.6610.848
LD515.798.7010.7320.829
Scale AD; Cronbach’s Alpha = 0.842
AD111.555.5270.6770.801
AD212.315.9640.6730.803
AD311.605.5350.6910.794
AD411.545.8100.6710.803
Scale CT; Cronbach’s Alpha = 0.804
CT16.632.5160.6720.711
CT26.662.4240.6600.723
CT36.672.6270.6220.762
Scale CO; Cronbach’s Alpha = 0.770
CO17.322.6590.5930.712
CO26.432.9760.6770.620
CO35.513.1140.5580.741
Scale ET; Cronbach’s Alpha = 0.789
ET17.622.4190.6390.705
ET28.372.7910.6180.729
ET37.632.4920.6380.705
Scale LA; Cronbach’s Alpha = 0.941
LA129.2219.8980.7750.934
LA229.0319.9780.7710.935
LA329.1020.2270.7570.935
LA429.0919.5650.8150.932
LA529.1620.0780.7760.934
LA629.1719.8540.7890.934
LA729.0719.9200.7630.935
LA829.0919.7640.7710.935
LA929.1620.3650.7490.936
Source: Data analysis results from SPSS 26.0.
Table 3. Kaiser-Meyer-Olkin Measure and Bartlett’s Test.
Kaiser-Meyer-Olkin Measure of Sampling Adequacy.0.856
Bartlett’s Test of SphericityApprox. Chi-Square2914.135
df351
Sig.&nbsp;0.000
Source: Data analysis results from SPSS 26.0.
Table 4. Total Variance Explained.
ComponentInitial EigenvaluesExtraction Sums of Squared LoadingsRotation Sums of Squared Loadings
Total% of VarianceCumulative %Total% of VarianceCumulative %Total% of VarianceCumulative %
17.52527.87127.8717.52527.87127.8713.37412.49612.496
23.24212.00939.8803.24212.00939.8802.77710.28622.783
31.7636.53146.4111.7636.53146.4112.2688.40231.184
41.5095.58952.0001.5095.58952.0002.1738.04839.232
51.4005.18657.1861.4005.18657.1862.1467.94847.180
61.2964.80061.9861.2964.80061.9862.1427.93255.112
71.2494.62866.6141.2494.62866.6142.1297.88562.997
81.1484.25370.8671.1484.25370.8672.1257.87070.867
90.6792.51373.381
100.6162.28175.662
110.5862.17077.831
120.5381.99479.826
130.5151.90781.733
140.4951.83383.566
150.4611.70885.274
160.4331.60486.879
170.4221.56388.442
180.4071.50889.951
190.3801.40691.357
200.3591.33092.687
210.3361.24693.932
220.3231.19895.130
230.3151.16796.298
240.2971.09897.396
250.2821.04598.441
260.2300.85299.293
270.1910.707100.000
Extraction Method: Principal Component Analysis.
Source: Data analysis results from SPSS 26.0.
Table 5. Rotated Component Matrix a.
Component
12345678
LD50.819
LD30.789
LD20.749
LD10.718
LD40.708
AD4 0.819
AD3 0.807
AD1 0.754
AD2 0.741
RS1 0.810
RS3 0.780
RS2 0.775
ET1 0.817
ET3 0.787
ET2 0.745
CP2 0.814
CP1 0.788
CP3 0.759
CT1 0.807
CT2 0.800
CT3 0.761
CO2 0.833
CO1 0.755
CO3 0.754
SZ2 0.802
SZ3 0.782
SZ1 0.754
Extraction Method: Principal Component Analysis.
Rotation Method: Varimax with Kaiser Normalization.
Source: Data analysis results from SPSS 26. a. Rotation converged in 7 iterations.
Table 6. KMO and Bartlett’s Test.
Kaiser-Meyer-Olkin Measure of Sampling Adequacy.0.937
Bartlett’s Test of SphericityApprox. Chi-Square1621.535
df36
Sig.&nbsp;0.000
Source: Data analysis results from SPSS 26.0.
Table 7. Total Variance Explained.
ComponentInitial EigenvaluesExtraction Sums of Squared Loadings
Total% of VarianceCumulative %Total% of VarianceCumulative %
16.12868.09468.0946.12868.09468.094
20.5706.32974.423
30.4755.27779.700
40.4384.86684.566
50.3644.04188.607
60.3163.51292.119
70.2793.10495.223
80.2282.53897.761
90.2022.239100.000
Extraction Method: Principal Component Analysis.
Source: Data analysis results from SPSS 26.0.
Table 8. Component Matrix a.
Component
1
LA40.859
LA60.838
LA50.827
LA10.827
LA20.822
LA80.822
LA70.815
LA30.811
LA90.803
Extraction Method: Principal Component Analysis.
Source: Data analysis results from SPSS 26. a. 1 components extracted.
Table 9. Pearson Correlation Analysis.
Correlations
LASZCPRSLDADCTCOET
LAPearson Correlation10.569 **0.463 **0.554 **0.671 **0.544 **0.480 **0.514 **0.480 **
Sig. (2-tailed) 0.0000.0000.0000.0000.0000.0000.0000.000
N242242242242242242242242242
SZPearson Correlation0.569 **10.377 **0.367 **0.485 **0.188 **0.181 **0.164 *0.147 *
Sig. (2-tailed)0.000 0.0000.0000.0000.0030.0050.0110.022
N242242242242242242242242242
CPPearson Correlation0.463 **0.377 **10.397 **0.422 **0.232 **0.193 **0.156 *0.101
Sig. (2-tailed)0.0000.000 0.0000.0000.0000.0030.0150.115
N242242242242242242242242242
RSPearson Correlation0.554 **0.367 **0.397 **10.483 **0.354 **0.225 **0.244 **0.215 **
Sig. (2-tailed)0.0000.0000.000 0.0000.0000.0000.0000.001
N242242242242242242242242242
LDPearson Correlation0.671 **0.485 **0.422 **0.483 **10.298 **0.239 **0.249 **0.254 **
Sig. (2-tailed)0.0000.0000.0000.000 0.0000.0000.0000.000
N242242242242242242242242242
ADPearson Correlation0.544 **0.188 **0.232 **0.354 **0.298 **10.381 **0.349 **0.383 **
Sig. (2-tailed)0.0000.0030.0000.0000.000 0.0000.0000.000
N242242242242242242242242242
CTPearson Correlation0.480 **0.181 **0.193 **0.225 **0.239 **0.381 **10.416 **0.438 **
Sig. (2-tailed)0.0000.0050.0030.0000.0000.000 0.0000.000
N242242242242242242242242242
COPearson Correlation0.514 **0.164 *0.156 *0.244 **0.249 **0.349 **0.416 **10.404 **
Sig. (2-tailed)0.0000.0110.0150.0000.0000.0000.000 0.000
N242242242242242242242242242
ETPearson Correlation0.480 **0.147 *0.1010.215 **0.254 **0.383 **0.438 **0.404 **1
Sig. (2-tailed)0.0000.0220.1150.0010.0000.0000.0000.000
N242242242242242242242242242
Source: Data analysis results from SPSS 26.0. **. Correlation is significant at the 0.01 level (2-tailed). *. Correlation is significant at the 0.05 level (2-tailed).
Table 10. Model Summary b.
ModelRR SquareAdjusted R SquareStd. Error of the EstimateDurbin-Watson
10.873 a0.7620.7540.276102.190
Source: Data analysis results from SPSS 26. a. Predictors: (Constant), ET, CP, SZ, CO, AD, RS, CT, LD. b. Dependent Variable: LA.
Table 11. ANOVA a.
Table 11. ANOVA a.
ModelSum of SquaresdfMean SquareFSig.
1Regression56.85687.10793.2280.000 b
Residual17.7622330.076
Total74.619241
Source: Data analysis results from SPSS 26. a. Dependent Variable: LA. b. Predictors: (Constant), ET, CP, SZ, CO, AD, RS, CT, LD.
Table 12. Coefficients a.
ModelUnstandardized CoefficientsStandardized CoefficientstSig.Collinearity Statistics
BStd. ErrorBetaToleranceVIF
1(Constant)−0.0020.138 −0.0160.987
SZ0.1640.0260.2416.3870.0000.7151.398
CP0.0630.0250.0932.4870.0140.7371.356
RS0.0910.0300.1203.0750.0020.6691.494
LD0.2230.0310.2937.1320.0000.6071.648
AD0.1330.0270.1864.9280.0000.7171.395
CT0.0810.0280.1102.8780.0040.7001.429
CO0.1320.0260.1925.1540.0000.7341.363
ET0.1000.0280.1373.6040.0000.7041.420
Source: Data analysis results from SPSS 26. a. Dependent Variable: LA.
Disclaimer/Publisher’s Note: The statements, opinions and data contained in all publications are solely those of the individual author(s) and contributor(s) and not of MDPI and/or the editor(s). MDPI and/or the editor(s) disclaim responsibility for any injury to people or property resulting from any ideas, methods, instructions or products referred to in the content.

