
Transparency and Disclosure and Financial Distress of Non-Financial Firms in India under Competition: Investors’ Perspective


Abstract
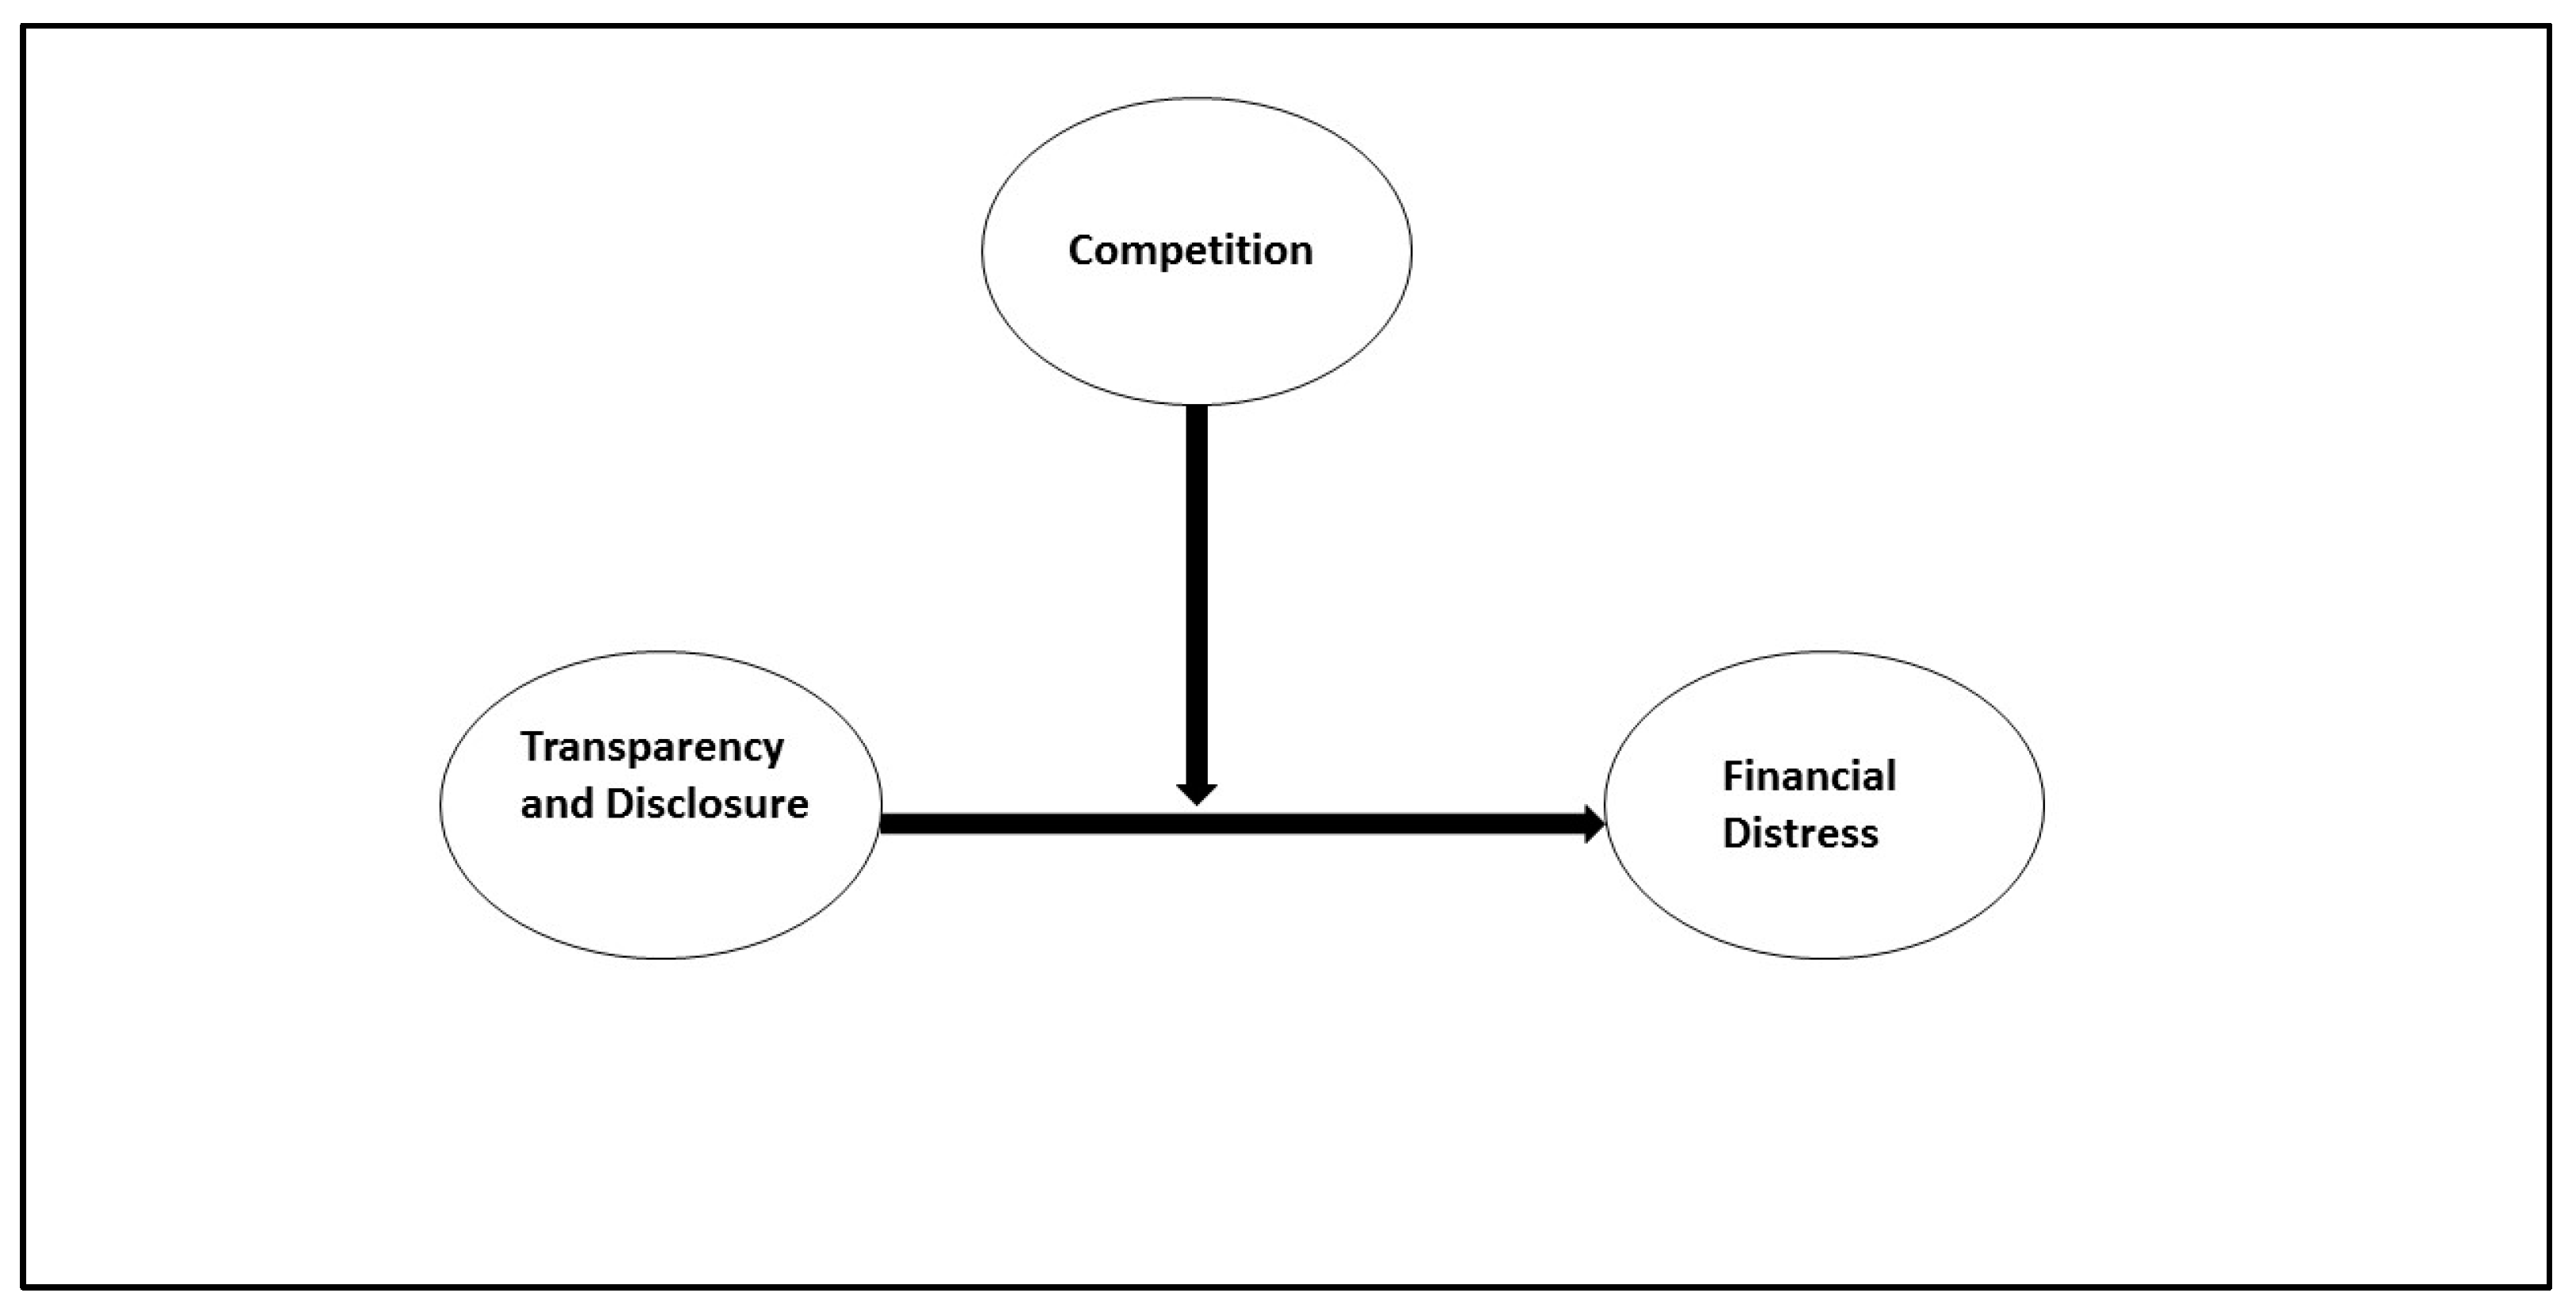
:1. Introduction
- To examine the impact of T&D on the firm’s FD of listed NFFs in India.
- To examine the impact of T&D on a firm’s FD under the influence of competition in NFFs in India.
2. Literature Review
2.1. Financial Reporting and Its Importance
2.2. Corporate Governance and Firms’ Performance
2.3. Transparency and Disclosure and Firm’s Performance
2.4. Hypothesis Development
3. Data and Methodology
3.1. Data
3.2. Methodology
3.3. Variables
4. Results
4.1. Descriptive Statistics and Multicollinearity
4.2. Regression Analysis
4.2.1. Base Models
4.2.2. Nonlinear Models
4.2.3. Interaction Models
4.3. Endogeneity and Robustness Check
5. Discussion
5.1. Hypothesis Discussion
5.2. Results’ Comparison with Previous Findings in the Literature
5.3. Contribution
5.4. Implications
6. Conclusions
Author Contributions
Funding
Data Availability Statement
Conflicts of Interest
Appendix A
Appendix A.1. Financial Distress
- ‘x’ is for multiplication.
- S1 = working capital/total assets.
- S2 = retained earnings/total assets.
- S3 = EBIT/total assets.
- S4 = market value of equity/book value of total liabilities.
- S5 = sales/total assets.
- Z1 > 2.67—safer zone (No risk of FD)
- 1.81 < Z1< 2.67—moderate zone (Prone to FD risk)
- Z1 < 1.81—distressed zone (facing FD)
Appendix A.2. Transparency and Disclosure
- Financial Transparency and Information Disclosure (30 attributes),
- Board & Management Structures & Processes (29 attributes),
- Ownership Structure & Investor Relations (10 attributes) and
- Strategic, Technology, and Internet Disclosures (33 attributes).
Appendix A.3. Lerner Index
References
- Abdullah, Shamsul Nahar. 2006. Board structure and ownership in Malaysia: The case of distressed listed companies. Corporate Governance 6: 582–94. [Google Scholar] [CrossRef]
- Abdul-Qadir, Ahmad B., and Mansur Lubabah Kwanbo. 2012. Corporate governance and financial performance of banks in the post-consolidation era in Nigeria. International Journal of Social Sciences and Humanity Studies 4: 27–36. [Google Scholar]
- Ahmed, Kamran, and John K. Courtis. 1999. Associations between corporate characteristics and disclosure levels in annual reports: A meta-analysis. The British Accounting Review 31: 35–61. [Google Scholar] [CrossRef]
- Akhtaruddin, Mohamed. 2005. Corporate mandatory disclosure practices in Bangladesh. The International Journal of Accounting 40: 399–422. [Google Scholar] [CrossRef]
- Aksu, Mine, and Arman Kosedag. 2006. Transparency and disclosure scores and their determinants in the Istanbul Stock Exchange. Corporate Governance: An International Review 14: 277–96. [Google Scholar] [CrossRef]
- Al-Hadi, Ahmed, Mostafa M. Hasan, Grant Taylor, Mahmud Hossain, and Grant Richardson. 2017. Market risk disclosures and investment efficiency: International evidence from the Gulf Cooperation Council financial firms. Journal of International Financial Management & Accounting 28: 349–93. [Google Scholar]
- Almeida, Hector, and Murillo Campello. 2007. Financial constraints, asset tangibility, and corporate investment. The Review of Financial Studies 20: 1429–60. [Google Scholar] [CrossRef] [Green Version]
- Altman, Edward I. 1968. Financial ratios, discriminant analysis and the prediction of corporate bankruptcy. The Journal of Finance 23: 589–609. [Google Scholar] [CrossRef]
- Amba, Sekhar M. 2014. Corporate governance and firms’ financial performance. Journal of Academic and Business Ethics 8: 1–11. [Google Scholar]
- Armstrong, Anona, and M. Sweeney. 2002. Corporate governance disclosure: Demonstrating corporate social responsibility through social reporting. New Academy Review 1: 33–51. [Google Scholar]
- Arsov, Sasho, and Vesna Bucevska. 2017. Determinants of transparency and disclosure–evidence from post-transition economies. Economic research-Ekonomska istraživanja 30: 745–60. [Google Scholar] [CrossRef] [Green Version]
- Bai, Keke, Farid Ullah, Muhammad Arif, Sahar Erfanian, and Saima Urooge. 2023. Stakeholder-Centered Corporate Governance and Corporate Sustainable Development: Evidence from CSR Practices in the Top Companies by Market Capitalization at Shanghai Stock Exchange of China. Sustainability 15: 2990. [Google Scholar] [CrossRef]
- Balasubramanian, Bala N. 2013. Strengthening corporate governance in India: A review of legislative and regulatory initiatives in 2013–2014. IIM Bangalore Research Paper 447: 1–55. [Google Scholar]
- Ball, Ray, Ashok Robin, and Joanna Shuang Wu. 2003. Incentives versus standards: Properties of accounting income in four East Asian countries. Journal of Accounting and Economics 36: 235–70. [Google Scholar] [CrossRef]
- Baltagi, Badi H., Georges Bresson, and Alain Pirotte. 2003. Fixed effects, random effects or Hausman–Taylor?: A pretest estimator. Economics Letters 79: 361–69. [Google Scholar] [CrossRef]
- Barth, Mary E., Michael B. Clement, George Foster, and Ron Kasznik. 1998. Brand values and capital market valuation. Review of Accounting Studies 3: 41–68. [Google Scholar] [CrossRef]
- Bebchuk, Lucian, Alma Cohen, and Allen Ferrell. 2009. What matters in corporate governance? The Review of Financial Studies 22: 783–827. [Google Scholar] [CrossRef] [Green Version]
- Berger, Philip G., Eli Ofek, and Itzhak Swary. 1996. Investor valuation of the abandonment option. Journal of Financial Economics 42: 259–87. [Google Scholar] [CrossRef] [Green Version]
- Berglöf, Erik, and Anete Pajuste. 2005. What do firms disclose and why? Enforcing corporate governance and transparency in Central and Eastern Europe. Oxford Review of Economic Policy 21: 178–97. [Google Scholar] [CrossRef]
- Bhimavarapu, Venkata Mrudula, Shailesh Rastogi, and Jagjeevan Kanoujiya. 2023. Ownership concentration and its influence on transparency and disclosures of banks in India. Corporate Governance: The International Journal of Business in Society 23: 18–42. [Google Scholar] [CrossRef]
- Black, Bernard S., Hasung Jang, and Woochan Kim. 2006. Does corporate governance predict firms’ market values? Evidence from Korea. The Journal of Law, Economics, and Organization 22: 366–413. [Google Scholar] [CrossRef] [Green Version]
- Botosan, Christine A. 2006. Disclosure and the cost of capital: What do we know? Accounting and Business Research 36: 31–40. [Google Scholar] [CrossRef]
- CBN 2010. Annual Reoprt of Central Bank of Nigeria. Available online: https://www.cbn.gov.ng/Out/2011/publications/reports/rsd/AR2010/Link%20Files/CBN%20Annual%20Report%202010%20.pdf (accessed on 25 May 2022).
- Chau, Gerald K., and Sidney J. Gray. 2002. Ownership structure and corporate voluntary disclosure in Hong Kong and Singapore. The International Journal of Accounting 37: 247–65. [Google Scholar] [CrossRef]
- Cheffins, Brian R. 2013. The History of Corporate Governance. Law Working Paper No. 184/2012. Bruseels, Belgium: European Corporate Governance Institute. [Google Scholar]
- Chi, Wuchun, Chiawen Liu, and Taychang Wang. 2009. What affects accounting conservatism: A corporate governance perspective. Journal of Contemporary Accounting and Economics 5: 47–59. [Google Scholar] [CrossRef]
- Clatworthy, Michael A., and Michael John Jones. 2006. Differential patterns of textual characteristics and company performance in the chairman’s statement. Accounting Auditing & Accountability Journal 19: 493–511. [Google Scholar]
- Daily, Catherine M., and Dan R. Dalton. 1994. Corporate governance and the bankrupt firm: An empirical assessment. Strategic Management Journal 15: 643–54. [Google Scholar] [CrossRef]
- Durnev, Art, and E. Han Kim. 2005. To steal or not to steal: Firm attributes, legal environment, and valuation. The Journal of Finance 60: 1461–93. [Google Scholar] [CrossRef] [Green Version]
- Fama, Eugene F., and Michael C. Jensen. 1983. Separation of ownership and control. The Journal of Law and Economics 26: 301–25. [Google Scholar] [CrossRef]
- Farhi, Emmanuel, Josh Lerner, and Jean Tirole. 2013. Fear of rejection? Tiered certification and transparency. The RAND Journal of Economics 44: 610–31. [Google Scholar] [CrossRef] [Green Version]
- Frost, Carol Ann, Elizabeth A. Gordon, and Grace Pownall. 2005. Transparency, Disclosure, and Emerging Market Companies’ Access to Capital in Global Equity Markets. Working Paper. Available online: http://papers.ssrn.com/sol3/papers.cfm (accessed on 14 October 2013).
- Fung, Benjamin. 2014. The demand and need for transparency and disclosure in corporate governance. Universal Journal of Management 2: 72–80. [Google Scholar] [CrossRef]
- Gompers, Paul, Joy Ishii, and Andrew Metrick. 2003. Corporate governance and equity prices. The Quarterly Journal of Economics 118: 107–56. [Google Scholar] [CrossRef] [Green Version]
- Hail, Luzi. 2002. The impact of voluntary corporate disclosures on the ex-ante cost of capital for Swiss firms. European Accounting Review 11: 741–73. [Google Scholar] [CrossRef]
- Hambrick, Donald C., and Richard A. D’Aveni. 1992. Top team deterioration as part of the downward spiral of large corporate bankruptcies. Management Science 38: 1445–1466. [Google Scholar] [CrossRef]
- Hermalin, Benjamin E., and Michael S. Weisbach. 2012. Information disclosure and corporate governance. The Journal of Finance 67: 195–233. [Google Scholar] [CrossRef] [Green Version]
- Hodgson, Allan, Suntharee Lhaopadchan, and Sitapa Buakes. 2011. How informative is the Thai corporate governance index? A financial approach. International Journal of Accounting and Information Management 19: 53–79. [Google Scholar] [CrossRef]
- Hsiao, Cheng. 2007. Panel data analysis—Advantages and challenges. Test 16: 1–22. [Google Scholar] [CrossRef] [Green Version]
- Huang, Chi-Jui. 2010. Corporate governance, corporate social responsibility and corporate performance. Journal of Management and Organization 16: 641–55. [Google Scholar] [CrossRef]
- Hussin, N., and Radiah Othman. 2012. Code of corporate governance and firm performance. British Journal of Economics, Finance and Management Sciences 6: 1–22. [Google Scholar]
- James-Overheu, Christina, and Julie Cotter. 2009. Corporate governance, sustainability and the assessment of default risk. Asian Journal of Finance and Accounting 1: 34–53. [Google Scholar] [CrossRef] [Green Version]
- Jatiningrum, Citrawati, Fauzi, Bernaditha H. S. Utami, and Aza Azlina Md Kassim. 2023. Mitigate Type II Agency Conflict Through Good Corporate Governance and Disclosure Quality. AKUNTABILITAS 17: 1–16. [Google Scholar] [CrossRef]
- Jensen, Michael C., and William H. Meckling. 1976. Theory of the firm: Managerial behavior, agency costs and ownership structure. Journal of Financial Economics 3: 305–60. [Google Scholar] [CrossRef]
- Judson, Ruth A., and Ann Owen. 1999. Estimating dynamic panel data models: A guide for macroeconomists. Economics Letters 65: 9–15. [Google Scholar] [CrossRef]
- Kanoujiya, Jagjeevan, Kuldeep Singh, and Shailesh Rastogi. 2022. Does promoters’ ownership reduce the firm’s financial distress? Evidence from non-financial firms listed in India. Managerial Finance. ahead-of-print. [Google Scholar] [CrossRef]
- Kaur, Japneet. 2019. Financial Distress and Bank Performance: A Study of Select Indian Banks. International Journal of Financial Management 9: 26–35. [Google Scholar]
- Kumar, Sushil, and Anab Kidwai. 2018. CSR disclosures and transparency among top Indian companies. International Journal of Indian Culture and Business Management 16: 57–70. [Google Scholar] [CrossRef]
- Lai, Shun-Miao, Chih-Liang Liu, and Taychang Wang. 2014. Increased disclosure and investment efficiency. Asia-Pacific Journal of Accounting and Economics 21: 308–27. [Google Scholar] [CrossRef]
- Lang, Mark, Karl V. Lins, and Mark Maffett. 2012. Transparency, liquidity, and valuation: International evidence on when transparency matters most. Journal of Accounting Research 50: 729–74. [Google Scholar] [CrossRef]
- Lerner, Abba P. 1934. The concept of monopoly and the measurement of monopoly power. The Review of Economic Studies 1: 157–75. [Google Scholar] [CrossRef]
- Li, Jing, Richard Pike, and Rosziani Haniffa. 2008. Intellectual capital disclosure and corporate governance structure in UK firms. Accounting and Business Research 38: 137–59. [Google Scholar] [CrossRef] [Green Version]
- Makki, Muhammad Abdul Majid, and Suleman Aziz Lodhi. 2014. Impact of corporate governance on intellectual capital efficiency and financial performance. Pakistan Journal of Commerce and Social Sciences (PJCSS) 8: 305–30. [Google Scholar]
- Mallin, Christina. 2016. Corporate Governance. Oxford: Oxford University Press. [Google Scholar]
- Omran, Mohammed M., Ali Bolbol, and Ayten Fatheldin. 2008. Corporate governance and firm performance in Arab equity markets: Does ownership concentration matter? International Review of Law and Economics 28: 32–45. [Google Scholar] [CrossRef]
- Östberg, Per. 2006. Disclosure, investment and regulation. Journal of Financial Intermediation 15: 285–306. [Google Scholar]
- Parker, Susan, Gary F. Peters, and Howard F. Turetsky. 2002. Corporate governance and corporate failure: A survival analysis. Corporate Governance: The International Journal of Effective Board Performance 2: 4–12. [Google Scholar] [CrossRef]
- Peters, George T., and Karl B. Bagshaw. 2014. Corporate governance mechanisms and financial performance of listed firms in Nigeria: A content analysis. Global Journal of Contemporary Research in Accounting, Auditing and Business Ethics 1: 103–28. [Google Scholar]
- Pradhan, Roli. 2014. Z score estimation for Indian banking sector. International journal of trade, economics and finance 5: 516. [Google Scholar] [CrossRef] [Green Version]
- Praveena, S., and T. Samsai. 2014. Market based financial measures of sugar industry in India. Economic Affairs 59: 635–40. [Google Scholar] [CrossRef]
- Rajagopalan, Nandini, and Yan Zhang. 2009. Recurring failures in corporate governance: A global disease? Business Horizons 52: 545–52. [Google Scholar] [CrossRef]
- Rastogi, Shailesh, and Jagjeevan Kanoujiya. 2022. Does transparency and disclosure (T&D) improve the performance of banks in India? International Journal of Productivity and Performance Management. ahead-of-print. [Google Scholar]
- Ross, Stephen A. 1973. The economic theory of agency: The principal’s problem. The American Economic Review 63: 134–39. [Google Scholar]
- Shahwan, Tamer Mohamed. 2015. The effects of corporate governance on financial performance and financial distress: Evidence from Egypt. Corporate Governance 15: 641–62. [Google Scholar] [CrossRef]
- Sharma, Vivek. 2011. Stock returns and product market competition: Beyond industry concentration. Review of Quantitative Finance and Accounting 37: 283–99. [Google Scholar] [CrossRef]
- Solomon, Jill. 2020. Corporate Governance and Accountability. Hoboken: John Wiley & Sons. [Google Scholar]
- Sun, Yanqi, Cheng Xu, Rui Ding, and Yuanyuan Cao. 2023. Does Innovation in Environmental, Social, and Governance Disclosures Pay Off in China? An Integrated Reporting Perspective. Borsa Istanbul Review. in press. [Google Scholar] [CrossRef]
- Thapar, Meghna, and Arjun Sharma. 2017. Corporate Governance in India: An analysis. Journal of Economic and Social Development 4: 81–87. [Google Scholar]
- Varshney, Pankaj, Vijay Kumar Kaul, and V. K. Vasal. 2015. Corporate Governance Index and Firm Performance: Empirical Evidence from India. LBS Journal of Management & Research 13: 59–75. [Google Scholar]
- Verrecchia, Robert E. 2001. Essays on disclosure. Journal of Accounting and Economics 32: 97–180. [Google Scholar] [CrossRef]
- Wahba, Hayam. 2015. The joint effect of board characteristics on financial performance: Empirical evidence from Egypt. Review of Accounting and Finance 14: 20–40. [Google Scholar] [CrossRef]
- Wallace, R. S. Olesegun, and Kamal Naser. 1995. Firm-specific determinants of the comprehensiveness of mandatory disclosure in the corporate annual reports of firms listed on the stock exchange of Hong Kong. Journal of Accounting and Public Policy 14: 311–68. [Google Scholar] [CrossRef]
- Wang, Zong-Jun, and Xiao-Lan Deng. 2006. Corporate governance and financial distress: Evidence from Chinese listed companies. Chinese Economy 39: 5–27. [Google Scholar] [CrossRef]
- Watson, Anna, Philip Shrives, and Claire Marston. 2002. Voluntary disclosure of accounting ratios in the UK. The British Accounting Review 34: 289–313. [Google Scholar] [CrossRef]
- Wooldridge, Jeffrey M. 2015. Introductory Econometrics: A Modern Approach. Cengage Learning. Available online: https://www.academia.edu/download/43417044/Study_notes_from_textbook.pdf (accessed on 17 March 2022).
- Younas, Noman, Shahab UdDin, Tahira Awan, and Muhammad Yar Khan. 2021. Corporate governance and financial distress: Asian emerging market perspective. Corporate Governance: International Journal of Business in Society 21: 702–15. [Google Scholar] [CrossRef]


| Variable | Type | Symbol | Particular | Reference |
|---|---|---|---|---|
| Financial Distress (Altman Zscore) | DV | Z1 | It is the measure of firm’s FD based on Altman FD model (as discussed in Appendix A.1) | Altman (1968), Shahwan (2015), and Pradhan (2014) |
| Financial Distress (BOS Score) | DV | Z2 | It is another measure of FD having Investors’ Perspective. (Please see Appendix A.1 for detail) | Berger et al. (1996), Al-Hadi et al. (2017) |
| Financial Distress (AC Score) | DV | Z3 | It is an updated version of BOS Score model. (Please see Appendix A.1 for detail) | Almeida and Campello (2007), Al-Hadi et al. (2017) |
| Transparency and disclosure (T&D) | EV | T&D | It is the index generated for quantifying level of Transparency and disclosure. (Please see the detail in Appendix A.2) | Aksu and Kosedag (2006), Kumar and Kidwai (2018) |
| Competition (Lerner Index) | EV | LI | It is the computation of market competitiveness. (Please see the detail in Appendix A.3) | Lerner (1934), Sharma (2011) |
| Operational margin | CV | Opmargin | It signifies the profitability of the firm. It is calculated as dividing operational profit by net income. | Barth et al. (1998) |
| Market Capitalization (mcap) | CV | l_mcap | It represents the firm’s value. The log value of mcap is taken. | Barth et al. (1998) |
| Sales | CV | l_sales | It also shows the firm’s value. The log value of sales is taken. | Barth et al. (1998) |
| Variable | Mean | Max | Min | SD |
|---|---|---|---|---|
| Z1 (Altman Zscore) | 14.098 | 44.941 | −38.898 | 41.302 |
| Z2 (BOS Score) | 0.550 | 24.537 | 0.003 | 2.196 |
| Z3 (AC Score) | 0.588 | 24.545 | 0.025 | 2.193 |
| T&D | 0.595 | 0.779 | 0.310 | 0.095 |
| LI | 0.206 | 0.973 | 0 | 0.134 |
| Opmargin | 0.133 | 0.987 | −0.418 | 0.116 |
| l_mcap | 10.770 | 13.609 | 7.717 | 0.982 |
| l_sales | 9.598 | 13.330 | 5.303 | 1.33 |
| Z1 | Z2 | Z3 | T&D | LI | Opmargin | l_mcap | l_sales | T&D2 | T&D*LI | |
|---|---|---|---|---|---|---|---|---|---|---|
| Z1 | 1 | |||||||||
| Z2 | 0.272 * | 1 | ||||||||
| Z3 | 0.274 * | 0.999 * | 1 | |||||||
| T&D | 0.007 | −0.006 | −0.003 | 1 | ||||||
| LI | 0.021 | 0.097 | 0.098 | 0.042 | 1 | |||||
| Opmargin | 0.196 | −0.053 | −0.052 | −0.035 | 0.381 * | 1 | ||||
| l_mcap | 0.160 * | 0.070 | 0.072 | 0.088 | 0.086 | 0.199 * | 1 | |||
| l_sales | 0.021 | 0.131 * | 0.129 * | 0.167 * | −0.254 * | −0.235 * | 0.549 * | 1 | ||
| T&D2 | 0.002 | −0.014 | −0.011 | 0.994 * | 0.042 | −0.041 | 0.096 | 0.179 * | 1 | |
| T&D*LI | 0.023 | −0.090 | −0.090 | 0.260 | 0.967 | 0.354 | 0.098 | −0.218 * | 0.260 * | 1 |
| Model 1 DV: Z1 (RE) | Model 2 DV: Z2 (RE) | Model 3 DV: Z3 (RE) | ||||
|---|---|---|---|---|---|---|
| Normal | Robust | Normal | Robust | Normal | Robust | |
| T&D (exp_var) | −7.705 | −7.705 | 0.702 | 0.702 | 0.807 | 0.807 |
| LI | −6.298 | −6.298 | −0.516 | −0.516 | −0.539 | −0.539 |
| Opmargin | 0.181 | 0.181 | −0.002 | −0.002 | −0.002 | −0.002 |
| l_sales | −2.521 | −2.521 | 0.114 | 0.114 | 0.101 | 0.101 |
| l_mcap | 5.307 * | 5.307 * | 0.130 | 0.130 | 0.139 | 0.139 |
| Cons. | −16.416 | −16.416 | −2.207 | −2.207 | −2.197 | −2.197 |
| F-test (Model) F-test (Fixed effect) | 11.78 ** 43.44 * | 3.20 16.39 * | 2.48 16.34 * | |||
| BP-test (Random effect) | 610.82 * | 448.73 * | 447.92 * | |||
| Hausman Test | 3.60 | 1.02 | 1.06 | |||
| Wald test for Heteroscedasticity 1 | 1.6 × 10⁸ * | 6.4 × 10⁸ * | 2.0 × 10⁸ * | |||
| Wooldridge Autocorrelation Test 2 AR (1) | 91.068 * | 5.57 × 10⁶ * | 7.39 × 10⁶ * | |||
| 39.071 | 1.966 | 2.1470 | ||||
| 13.049 | 1.083 | 0.7997 | ||||
| rho | 0.899 | 0.767 | 0.8781 | |||
| R-Square | 0.047 | 0.020 | 0.4221 | |||
| Model 4 DV: Z1 | Model 5 DV: Z2 | Model 6 DV: Z3 | |
|---|---|---|---|
| Coeff. | Coeff. | Coeff. | |
| Lag (1) | 0.549 * | 0.004 | 0.026 |
| T&D (exp_var) | −16.365 *** | −1.170 * | −1.057 * |
| LI | −0.481 | −0.046 | −0.031 |
| Opmargin | 0.043 | 0.000 | 0.000. |
| l_sales | −2.569 | −0.046 | −0.049 |
| l_mcap | 2.345 *** | 0.011 | 0.017 |
| Cons. | 11.209 | −2.306 | 1.401 * |
| Sargan-Test Arellano-Bond Test | 5.477 0.317 | 42.90 * 1.01 | 38.08 * 1.00 * |
| Model 7 DV: Z1 (RE) | Model 8 DV: Z2 (RE) | Model 9 DV: Z3 (RE) | ||||
|---|---|---|---|---|---|---|
| Normal | Robust | Normal | Robust | Normal | Robust | |
| T&D2 (exp_var) | −6.392 (0.659) | −6.392 (0.513) | 0.459 (0.678) | 0.459 (0.267) | 0.543 (0.623) | 0.543 (0.189) |
| LI | −6.296 (0.545) | −6.296 (0.233) | −0.507 (0.543) | −0.507 (0.327) | −0.530 (0.525) | −0.530 (0.305) |
| Opmargin | 0.182 (0.143) | 0.182 (0.257) | −0.002 (0.794) | −0.002 (0.367) | −0.002 (0.770) | −0.002 (0.310) |
| l_sales | −2.497 (0.249) | −2.497 (0.282) | 0.118 (0.476) | 0.118 (0.294) | 0.105 (0.526) | 0.105 (0.351) |
| l_mcap | 5.300 * (0.003) | 5.300 * (0.005) | 0.129 (0.351) | 0.129 (0.352) | 0.138 (0.316) | 0.138 (0.317) |
| Cons. | −18.852 (0.482) | −18.852 (0.370) | −1.986 (0.255) | −1.986 (0.389) | −1.943 (0.265) | −1.943 (0.399) |
| F-test (Model) F-test (Fixed effect) | 11.80 ** (0.037) 43.44 * (0.000) | 3.11 (0.683) 16.37 * (0.000) | 3.23 (0.664) 16.32 * (0.000) | |||
| BP-test (Random effect) | 610.83 * (0.000) | 448.20 * (0.000) | 447.40 * (0.000) | |||
| Hausman Test | 3.57 (0.613) | 1.01 (0.961) | 1.05 (0.958) | |||
| Wald test for Heteroscedasticity 1 | 1.3 × 108 * (0.000) | 1.9 × 108 * (0.000) | 2.0 × 109 * (0.000) | |||
| Wooldridge Autocorrelation Test 2 AR (1) | 91.169 * (0.000) | 5.89 × 106 * (0.000) | 7.76 × 106 * (0.000) | |||
| 39.072 | 1.965 | 1.962 | ||||
| 13.049 | 1.084 | 1.084 | ||||
| rho | 0.899 | 0.766 | 0.766 | |||
| R-Square | 0.047 | 0.020 | 0.020 | |||
| Model 10 DV: Z1 | Model 11 DV: Z2 | Model 12 DV: Z3 | |
|---|---|---|---|
| Coeff. | Coeff. | Coeff. | |
| Lag (1) | 0.540 * | 0.001 | 0.021 ** |
| T&D2 (exp_var) | −11.060 | −0.829 * | −0.746 * |
| LI | −0.356 | −0.039 | −0.030 |
| Opmargin | 0.048 | 0.000 | 0.000 |
| l_sales | −2.960 | −0.041 | −0.041 |
| l_mcap | 2.404 *** | 0.013 | 0.020 |
| Cons. | 9.080 | 0.995 * | 0.914 ** |
| Sargan Test Arellano–Bond Test | 5.412 0.338 | 37.36 * 1.01 | 33.31 * 1.00 |
| Model 13 DV: Z1 (RE) | Model 14 DV: Z2 (RE) | Model 15 DV: Z3 (RE) | ||||
|---|---|---|---|---|---|---|
| Normal | Robust | Normal | Robust | Normal | Robust | |
| T&D (exp_var) | −5.414 | −5.414 | 0.871 | 0.871 | 0.983 | 0.983 |
| T&D_LI | −10.772 | −10.772 | −0.828 | −0.828 | −0.861 | −0.861 |
| Opmargin | 0.184 | 0.184 | −0.002 | −0.002 | −0.002 | −0.002 |
| l_sales | −2.553 | −2.553 | 0.113 | 0.113 | 0.100 | 0.100 |
| l_mcap | 5.330 * | 5.330 * | 0.130 | 0.130 | 0.140 | 0.140 |
| Cons. | −17.745 | −17.745 | −2.306 | −2.306 | −2.298 | −2.298 |
| F-test (Model) F-test (FE) | 11.84 ** 43.47 * | 3.21 16.41 * | 3.34 16.36 * | |||
| BP-test (RE) | 611.54 * | 449.30 * | 448.52 * | |||
| Hausman Test | 3.49 | 0.95 | 0.99 | |||
| Wald test for Heteroscedasticity 1 | 2.5 × 10⁸ * | 3.7 × 10⁹ * | 3.0 × 10⁸ * | |||
| Wooldridge Autocorrelation Test 2 AR (1) | 90.993 * | 5.4 × 10⁶ * | 7.4 × 10⁶ * | |||
| 39.094 | 1.968 | 1.965 | ||||
| 13.048 | 1.083 | 1.084 | ||||
| rho | 0.899 | 0.767 | 0.766 | |||
| R-Square | 0.047 | 0.019 | 0.019 | |||
| Model 16 DV: Z1 | Model 17 DV: Z2 | Model 18 DV: Z3 | |
|---|---|---|---|
| Coeff. | Coeff. | Coeff. | |
| Lag (1) | 0.549 * | 0.004 | 0.026 * |
| T&D (exp_var) | −16.125 *** | −1.165 * | −1.066 * |
| T&D_LI | −1.010 | 0.005 | 0.045 |
| Opmargin | 0.043 | 0.000 | 0.000 |
| l_sales | −2.569 | −0.048 | −0.050 |
| l_mcap | 2.399 *** | 0.011 | 0.016 |
| Cons. | 11.023 | 1.511 * | 1.416 * |
| Sargan Test Arellano–Bond Test | 5.439 0.317 | 43.36 * 1.01 | 38.60 * 1.00 |
| T&D | LI | Opmargin | l_mcap | l_sales | T&D2 | T&D_LI | |
|---|---|---|---|---|---|---|---|
| sDurbin Chi-2 | 1.8063 (0.1789) | 0.0222 (0.8688) | 2.5703 (0.1089) | 0.3633 (0.5462) | 5.7976 * (0.0160) | 2.2285 (0.1355) | 0.0041 (0.9488) |
| Wu–Hausman Test | 1.7426 (0.1889) | 0.02601 (0.8722) | 2.4926 (0.1166) | 0.3467 (0.5564) | 5.7489 * (0.0178) | 2.1561 (0.1442) | 0.0039 (0.9501) |
Disclaimer/Publisher’s Note: The statements, opinions and data contained in all publications are solely those of the individual author(s) and contributor(s) and not of MDPI and/or the editor(s). MDPI and/or the editor(s) disclaim responsibility for any injury to people or property resulting from any ideas, methods, instructions or products referred to in the content. |
© 2023 by the authors. Licensee MDPI, Basel, Switzerland. This article is an open access article distributed under the terms and conditions of the Creative Commons Attribution (CC BY) license (https://creativecommons.org/licenses/by/4.0/).
Share and Cite
Kanoujiya, J.; Abraham, R.; Rastogi, S.; Bhimavarapu, V.M. Transparency and Disclosure and Financial Distress of Non-Financial Firms in India under Competition: Investors’ Perspective. J. Risk Financial Manag. 2023, 16, 217. https://doi.org/10.3390/jrfm16040217
Kanoujiya J, Abraham R, Rastogi S, Bhimavarapu VM. Transparency and Disclosure and Financial Distress of Non-Financial Firms in India under Competition: Investors’ Perspective. Journal of Risk and Financial Management. 2023; 16(4):217. https://doi.org/10.3390/jrfm16040217
Chicago/Turabian StyleKanoujiya, Jagjeevan, Rebecca Abraham, Shailesh Rastogi, and Venkata Mrudula Bhimavarapu. 2023. "Transparency and Disclosure and Financial Distress of Non-Financial Firms in India under Competition: Investors’ Perspective" Journal of Risk and Financial Management 16, no. 4: 217. https://doi.org/10.3390/jrfm16040217