Article

The Impact of FASB Staff Position APB 14-1 on Corporate Financing: A Debt Contracting Perspective

1
DeGroote School of Business, McMaster University, Hamilton, ON L8S 4L8, Canada
2
Schulich School of Business, York University, North York, ON M3J 1P3, Canada
3
School of Administrative Studies, York University, Toronto, ON M3J 1P3, Canada
*
Author to whom correspondence should be addressed.
J. Risk Financial Manag. 2023, 16(4), 213; https://doi.org/10.3390/jrfm16040213
Submission received: 16 February 2023 / Revised: 18 March 2023 / Accepted: 23 March 2023 / Published: 27 March 2023
(This article belongs to the Special Issue Advances in Corporate Finance and Financial Management)

Abstract

:
Using a set of hand-collected data, we study the economic consequences of FASB Staff Position APB 14-1, which was adopted in 2008 and intended to increase reported interest expense and decrease reported leverage. First, we document that issuers are more likely to respond to APB 14-1 by reducing the outstanding amount of cash-settled convertible debt when they are more able to bear the cost of repurchase. Second, we explore the debt contracting explanations for issuers’ repurchase decisions. In particular, we focus on the contracting practice for GAAP changes and the inclusion of financial covenants related to interest coverage ratios. We find that issuers are less likely to repurchase the outstanding cash-settled convertibles when their bank loan contracts allow them to request a freeze on GAAP provisions to exclude mandatory GAAP changes in calculating accounting-based covenants. Further, when firms’ bank loan contracts contain financial covenants related to interest coverage ratios, issuers are more likely to repurchase outstanding cash-settled convertibles to avoid technical default due to the higher reported interest expense resulting from requirements under APB 14-1. These empirical results are consistent with the notion that firms do respond to mandatory GAAP changes when they are more able to afford the cost of such responses. Furthermore, debt contracting practices can help explain firms’ decisions to respond to mandatory GAAP changes.
JEL Classifications:
M41; M48; G30

1. Introduction

On 9 May 2008, the Financial Accounting Standards Board (FASB) issued FASB Staff Position APB 14-1, Accounting for Convertible Debt Instruments That May Be Settled in Cash upon Conversion (Including Partial Cash Settlement) (“APB 14-1”). APB 14-1 represents a major change to the old accounting treatment for convertible debt instruments that can be settled wholly or partly in cash. Cash settlement occurs when an issuer can pay out some or all of the conversion value in cash instead of in stock. Cash settlement has become an important component of convertible debt obligations because such obligations have benefitted from favorable accounting treatment resulting in lower interest expense than noncash-settled convertible debt obligations, thereby having less impact on earnings per share. This study examines the effects of changes in accounting standards for cash-settled convertible debt. We study firms’ and financial statement users’ responses to APB 14-1.1
APB 14-1 impacted the financial statements of many issuers of convertible debt securities. Before the FASB issued APB 14-1, convertible debt that could be settled in cash upon conversion (hereafter, “cash-settled convertible debt”) was classified as a liability, and the interest expense was calculated using the proceeds from the issuance and the coupon rate.2 The issuers of such convertible debt enjoyed “a trifecta of advantages: lower interest expense, the flexibility of bond settlement, and favorite earnings-per-share (EPS) treatment”, as posited by Robert Comerford, a partner at Deloitte & Touche and former professional accounting fellow in the Securities and Exchange Commission’s Office of the Chief Accountant (Leone 2008). APB 14-1 changed the recognition and measurement methods as well as the disclosure of cash-settled convertible debt. The fundamental principle of the new reporting requirement, as stated in APB 14-1, is to require an issuer of cash-settled convertible debt to “recognize the same interest cost it would have incurred had it issued a comparable debt instrument without the embedded conversion option.” The separation of liability and equity required by APB 14-1 affects both income statements (higher interest expenses and lower accounting earnings) and balance sheet classifications (lower debt and higher shareholders’ equity). The simultaneous impact on both income statements and balance sheets provides a unique setting in which to examine how firms will respond to such accounting standard changes.
The FASB provides two rationales for issuing APB 14-1 based on the concern that the previous accounting treatment of cash-settled convertible debt did not appropriately reflect the economic effects of these instruments.3 First, the new recognition and measurement methods are consistent with the FASB’s intent to reduce the opportunities for firms “to structure instruments and arrangements to achieve a desired accounting outcome.”4 Such desired accounting outcomes could be lower interest expenses, higher reported earnings, and higher EPS figures. The increase in interest expense takes away one of the most important advantages of cash-settled convertible debt as compared to non-convertible debt: the lower interest expense. Second, under the new APB 14-1, issuers must recognize cash-settled convertible bonds in their balance sheets as liability and equity, and explicitly recognize additional interest expense in their income statements, as compared to footnote disclosure before the change.
In this study, we use a set of hand-collected data to empirically examine two questions that are closely related to the effects of changes in the accounting treatment of cash-settled convertible debt. We conjecture that issuers of cash-settled convertibles will respond to APB 14-1 by repurchasing their outstanding cash-settled convertibles to avoid the negative impact on their reported interest expense. First, we examine how firms’ ability to afford the costs of repurchase will affect their decisions to respond to APB 14-1 in the years right before and after the adoption of APB 14-1. Second, we examine whether the contracting practice for mandatory GAAP changes, as well as financial accounting covenants related to interest coverage ratios, influence the likelihood of cash repurchases of cash-settled convertibles after the adoption of APB 14-1 in 2008.
We first document that during the period from 2005 to 20115, approximately 60% of the first-time repurchase of cash-settled convertible debt occurred in 2008 and 2009. The clustered repurchase in the years immediately before and after the adoption of APB 14-1 suggests that issuers attempted to avoid any negative bifurcation impact on their financial statements. We employed a difference-in-difference research design while controlling for debt issuance level and firm level characteristics in our multivariate probit models. Results suggest that firms that are better able to bear the cost of repurchase are more likely to respond to the accounting changes by repurchasing their outstanding cash-settled convertibles. These firms are larger in size, have lower book-to-market ratios, and have more operating cash flows.
Next, we explore debt contracting incentives that influence issuers’ decisions to repurchase their outstanding cash-settled convertibles. We find that issuers are less likely to engage in cash repurchases of cash-settled convertibles when issuers’ bank loan contracts allow the borrower or the lender to request to “freeze” GAAP provisions immediately before the mandatory changes kick in so that any negative impact of such GAAP changes will be excluded from covenant evaluations. In addition, we find that when issuers’ bank loan contracts contain financial covenants related to interest coverage, they are more likely to repurchase the outstanding cash-settled convertibles to avoid any potential technical defaults due to the increase in reported interest expenses resulting from the adoption of APB 14-1.
Our study adds to the existing literature in the following ways. First, our study contributes to the literature that focuses on the economic consequences of accounting standard changes. Prior studies provide direct evidence that changes in accounting standards have an important impact on managerial decision-making (Bens et al. 2003; Hodder et al. 2006; Marquardt and Wiedman 2007; Bens and Monahan 2008; Choudhary et al. 2009; Choudhary 2011; Levi and Segal 2014). We add to the existing literature by showing firm-level characteristics that affect the managers’ decisions on how to respond to mandatory GAAP changes.
Second, our paper also contributes to the literature on the role of financial accounting information in debt contracting efficiency. The inclusion or exclusion of mandatory GAAP changes has been shown to increase the efficiency of debt contracts, such as lower cost of debt (Beatty et al. 2002; Christensen and Nikolaev 2017). Prior studies also document the relationship between changes in financial reporting and the use of accounting-based financial covenants in debt contracts (Nikolaev 2010; Demerjian 2011; Christensen et al. 2016). Our study extends the prior literature by showing that contracting practices regarding GAAP changes and the use of financial accounting information in debt contracts can provide new and interesting avenues for understanding the economic consequences of mandatory GAAP changes.
The remainder of this study is organized as follows. In the next section, we discuss the background and prior research. We develop the hypotheses in Section 3. Section 4 describes the sample data and research design. Section 5 discusses the results. Section 6 provides additional test results, and Section 7 concludes the study.

2. Background

2.1. FASB Staff Position APB 14-1

Cash-settled convertible debt became popular after the FASB amended EITF 90-19 in 2002 to exclude such securities from the calculation of fully diluted EPS. Since the amendment, the issuers of cash-settled convertible debt have enjoyed lower interest expenses and higher EPS figures than they have with other debt securities. In 2007, the popularity of cash-settled convertible debt attracted the FASB’s attention and prompted it to begin discussing the elimination of the favorable accounting treatment of these debt securities. Later in 2007, the FASB issued Proposed Staff Position No. APB 14-a and invited comments from individuals and organizations. The FASB expected that such changes in the accounting treatment of cash-settled convertible debt would help investors and other users of financial statements to better understand firms’ financial positions. However, many issuers, creditors, and analysts did not seem to appreciate the benefits of APB 14-1 that had been proposed by the FASB. During the public comment period, 46 of the 59 comment letters received from various parties opposed the proposed changes to APB 14-1. Critics expressed concerns that such adjustments would not only reduce the usefulness of financial reporting but also fail to reflect the actual amount, timing, and uncertainty of cash flows.
The proposed bifurcation method for cash-settled convertible bonds also generated considerable coverage in the business press. One article described this new accounting standard for cash-settled convertible bonds as “a splitting headache” (Teach 2014). In that article, an ex-managing partner at Lehman Brothers predicted that because of the significant impact of APB 14-1 on firms’ bottom lines, “cash-settled convertibles will not be issued anymore”.
Nevertheless, on 9 May 2008, the FASB released the final version of APB 14-1, which requires issuers of convertible debt instruments that may be settled in cash upon conversion to divide the proceeds received on issuance into liability and equity components. To implement bifurcation, the carrying amount of the liability component is calculated as the fair value of a similar liability (including any embedded features other than the conversion option) that does not have an associated equity component. The carrying amount of the equity component represented by the embedded conversion option is the difference between the total proceeds received for the convertible debt instrument as a whole and the fair value of the liability component. This allocation results in a discount on the debt component equal to the difference between the total proceeds received and the value of the debt component. This discount is then amortized as an interest expense over the expected life of the convertible debt instrument. A detailed example is presented in Appendix A. APB 14-1 is effective for fiscal years and quarters beginning after 15 December 2008.

2.2. Institutional Background of Convertible Debt Financing

Similar to the general bond market, the convertible bond market is nearly exclusively occupied by institutional investors, who are considered more sophisticated than individual investors. Such investors have access to firms’ public information (e.g., publicly available financial statements) and to their private information (e.g., private research). The SEC requires both public and private issuances of convertible bonds to be disclosed in issuers’ annual or quarterly reports on Forms 10K or 10Q, respectively, and in any interim reports on Form 8K.
Conversion terms, such as conversion price, maturity date, call protection period, and method of payment at settlement, are determined by the issuers prior to the sale of the convertible bonds. Historically, holders of convertible bonds received shares of common stock at the time of the bonds’ conversion or maturity. Since the early 1990s, there have been many innovations in the method of payment upon conversion or maturity.6 The inclusion of the cash settlement feature in the convertible bond contract began immediately in 2002 after the FASB amended EITF 90-19, which allows such convertible bonds to be excluded from the calculation of diluted EPS. Issuers of convertible bonds obtained the right to choose to settle the conversion by paying cash instead of common stock.7 Issuers choose the method of settlement in the financing agreements before the sale of the convertible bond. Thus, a subsequent change of settlement method requires a renegotiation of contracts between the issuer and the investors and can be costly to the issuer.

2.3. Prior Literature

2.3.1. Economic Consequences of Mandatory GAAP Changes

Empirical studies on innovation in convertible bond design find that issuers select particular methods of payment at settlement to achieve certain financial reporting goals (Marquardt and Wiedman 2005; Lewis and Verwijmeren 2011). For example, Marquardt and Wiedman (2005) find that some firms added contingent conditions of conversion to convertible bond contracts to report higher diluted EPS. Prior research has also documented that compared to issuers of equity-settled convertible bonds, issuers of the cash-settled convertible bonds are firms that are less financially constrained, less profitable, and more cash-rich (Graham and Harvey 2001; Lewis and Verwijmeren 2011).
The extant literature on the economic consequences of changes in accounting standards suggests that such changes affect the value relevance of accounting numbers and changes in firms’ economic behavior. For example, accounting standard changes have been shown to be related to firms’ decisions on R&D spending or pension asset allocation to avoid reporting lower accounting earnings (Elliott et al. 1984; Baber et al. 1991; Glaum et al. 2018; Barthelme et al. 2019). Other studies find that firms adjust their financing plans to report higher diluted EPS and lower debt-to-equity ratios or to avoid covenant violations in response to accounting standard changes related to various financial instruments (Marquardt and Wiedman 2005, 2007; Scott et al. 2011; Levi and Segal 2014; Cohen et al. 2019).

2.3.2. Debt Contracting and Financial Accounting Information

Prior studies on the GAAP provisions in debt contracting have documented that the exclusion of both mandatory and voluntary GAAP changes in credit agreements can reduce the cost of debt (Beatty et al. 2002; Christensen and Nikolaev 2017). A more recent study by Darrough and Deng (2019) provide an analytical explanation for the ex post effect of inclusion versus exclusion of mandatory GAAP changes on ex ante firms’ investment decisions. They argue that including GAAP changes in debt contracts does not necessarily improve contract efficiency because firms may rationally distort their ex ante investment decisions, resulting in asset substitution.
The prior literature also provides evidence on the role of accounting-based debt covenants. For example, Chava and Roberts (2008) examine the impact of debt covenant violations on corporate investment and show that capital investment declines significantly following a financial covenant violation (e.g., net worth covenants). Nini et al. (2012) find similar results using capital expenditure covenants included in credit loan agreements. Financial covenants have also been found to have an impact on the speed at which firms adjust their capital structure to their target level (Devos et al. 2017).
Prior studies focused on the effects on equity price when they examined changes in the value relevance of accounting amounts reported before and after changes in accounting standards (e.g., Barth et al. 1996; Aboody et al. 2004; Kraft et al. 2021). Prior studies examined the effects of changes in accounting standards on how credit rating agencies use accounting information when assigning ratings (e.g., Beatty et al. 2002; Kraft 2015a, 2015b).

3. Hypotheses Development

The FASB issued APB 14-1 to mandate that firms bifurcate their cash-settled convertible debt and record the interest expenses using the effective interest rate method. Such requirements increased issuers’ interest expenses and decreased the book value of debt reported on the financial statements starting in 2009, and for any prior years in which cash-settled convertibles were outstanding. Because the bifurcation requirement is not applicable to any amount that is no longer outstanding after the effective date of APB 14-1, issuers can avoid reporting higher interest expenses if they reduce the amount of their outstanding cash-settled convertibles.
There are three ways to reduce the amount of outstanding cash-settled convertible bonds. First, issuers have the option to call back the convertibles with shares of common stock or cash on a set of pre-specified dates at a pre-determined price. However, such calls are only allowed by the financing agreements if the call protection period has expired. Second, issuers can use their own cash to repurchase their cash-settled convertible bonds from the secondary bond market at the market price. Third, issuers can restructure the convertibles to change a cash settlement to a share settlement upon conversion. However, such an amendment may not help issuers avoid bifurcation under APB 14-1.8 In addition, restructuring convertible debt can impose significant costs on firms (Marquardt and Wiedman 2007).
Open market repurchase is a quick solution before the expiration of the call protection period. The average number of years for call protection in our sample is approximately seven years, and more than 97% of the convertible debt issuances in our sample are still within the call protection period during our sample period. As a result, all of the issuers in our sample that wanted to respond to APB 14-1 could only choose to repurchase their outstanding cash-settled convertible bonds from the open market.
Issuers can settle the repurchase in cash, either from cash reserves generated internally or from new external financing (e.g., new issuances of other types of convertible bonds that are not subject to APB 14-1). Each method has its own costs and benefits. Firms that use their cash reserves lose their financial flexibility to fund other investment projects. However, using external financing to fund the repurchase also has costs and benefits. For example, for firms that have debt capacity and access to external capital, issuing new convertible bonds that are not subject to APB 14-1 in exchange for cash-settled convertible bonds allows them to continue reporting lower interest expenses. However, the cost of issuing new convertible debt can be significant. As reported in the Securities Data Company (SDC) database, the average issuing cost (i.e., the difference between the total issuing amount and the total proceeds actually received by the issuers) is $11 million dollars for convertible bonds issued in the U.S. market, which is approximately 3% of the issuing amount.
Given the significant costs of cash repurchase, firms will only engage in such responsive strategies if the negative impact of APB 14-1 (i.e., higher interest expense) is significantly higher than cash repurchase. Issuers of cash-settled convertibles will have to relinquish their financial flexibility if they commit themselves to cash repurchases. Marquardt and Wiedman (2007) predict that larger firms and cash-rich firms are more able to bear the cost of restructuring or redemption of COCO when FASB changed its reporting requirements for COCO in 2003. In addition, prior studies in capital structure suggest that firms with more growth opportunities will use less debt to avoid underinvestment issues (Myers 1977; Hart 1993) Thus, we expect that larger firms and firms with higher cash flows and growth opportunities are more likely to repurchase their outstanding cash-settled convertibles in response to the adoption of APB 14-1. This expectation can be expressed as the following hypotheses (in the alternative form):
 H1a:
Larger firms are more likely to repurchase their outstanding cash-settled convertible debt in response to APB 14-1.
 H1b:
Firms with higher cash flows are more likely to repurchase their outstanding cash-settled convertible debt in response to APB 14-1.
 H1c:
Firms with higher book-to-market ratios are more likely to repurchase their outstanding cash-settled convertible debt in response to APB 14-1.
We next explore the debt contracting incentives that can influence the manager’s decision to respond to APB 14-1. Prior accounting research on debt contracting has studied various contracting practices regarding GAAP changes. For example, Beatty et al. (2002) find that the interest rate charged is significantly lower when mandatory or voluntary accounting changes are excluded from covenant evaluations. Christensen and Nikolaev (2017) document a significant shift from the inclusion of GAAP changes to exclude GAAP changes in credit agreements which can be explained by the frequency and characteristics of GAAP changes. They also identify a new and increasingly popular contracting practice which allows either the borrower or the lender to request a freeze on the GAAP provisions so that any future GAAP changes will be excluded from financial covenant calculations. We expect that firms whose bank loan contracts use such a practice will be less likely to repurchase their cash-settled convertibles because they can always exercise the option to freeze the GAAP to avoid any negative impact on the covenant calculations.
APB 14-1 requires that issuers bifurcate the cash-settled convertibles into liabilities and equity, which will result in higher reported interest expense and lower reported leverage. We expect that firms will be more likely to respond to APB 14-1 by repurchasing outstanding cash-settled convertibles if their bank loan contracts contain interest coverage covenants in order to avoid any technical default due to the higher reported interest expenses. Therefore, we state our second set of hypotheses as follows:
 H2a:
Firms that have the option to freeze GAAP provisions in their debt contracts are less likely to repurchase cash-settled convertibles in response to APB 14-1.
 H2b:
Firms whose debt contracts include interest coverage covenants are more likely to repurchase cash-settled convertibles in response to APB 14-1.

4. Sample Selection and Research Design

4.1. Sample Selection

We collect U.S. convertible debt issuance data from the SDC for the period from 2005 to 2011.9 Following prior studies, we exclude firms from the financial industry (SIC code 6000 to 6999) and the utilities industry (SIC code 4900 to 4999).10 As indicated in Panel A of Table 1, this process generates an initial sample of 511 new issuances of convertible debt from 2005 to 2011, representing 390 unique firms. We then manually search the SEC filings (e.g., 10-Ks, 10-Qs, 8-Ks, and Registration Statements) to collect additional information about the characteristics of these convertible debt issuances.11 We collect the debt covenant data and the credit agreements that are first used in Nini et al. (2012).12 Information about contracting practices regarding GAAP changes is then hand-collected from these credit agreements.
We obtain financial data from Compustat. We eliminate observations in which data that is required for the main tests are missing. As indicated in Panel A of Table 1, this process reduces the number of new cash-settled convertible debt issuances in our sample to 359, representing 279 unique firms. Panel B of Table 1 reports the industry composition of firms issuing convertible debt. Sample firms are distributed across different industries, exhibiting some industry concentration in business services (12.53%), chemicals and allied products (14.48%), and electronic and other electrical equipment (10.86%).

4.2. Research Design

We employed the difference-in-difference (DiD) specifications to examine our two sets of hypotheses. Specifically, we test the repurchase of cash-settled convertibles in the two years of 2008 and 2009 during which clustered repurchases occurred, as compared to other years in our sample period.

4.2.1. Response to APB 14-1 and Ability to Bear the Costs of Repurchases

To test our first set of hypotheses, we run the following probit model in each sub-group of firm characteristics (in particular larger firms, firms with higher cash flows and growth opportunities) proxying for firms’ ability to bear the cost of repurchases:
R e p u r c h a s e i t = γ 0 + γ 1 A P B i t + γ 2 I n t e r e s t I m p a c t i t + γ 3 L e v I m p a c t i t + γ 4 I n t e r e s t I m p a c t i t * A P B i t + γ 5 L e v I m p a c t i t * A P B i t + γ 6 E a r l y R e d e e m i t + γ 7 S i z e i t + γ 8 B M i t + γ 9 R O A i t + γ 10 C a s h i t + γ 11 L E V i t + γ 12 I n t e r e s t C o v e r a g e i t + γ 13 C A P X i t + γ 14 P u b l i c i t + I n d u s t r y F E + Y e a r F E + ε 1
The dependent variable, Repurchase, is an indicator variable that equals one if a sample firm repurchased any amount of its outstanding cash-settled convertible debt during 2008 or 2009, and zero otherwise. Both InterestImpact and LevImpact measure the impacts of continuing to hold cash-settled convertibles after the adoption of APB 14-1. At firms with a greater ability to bear the cost of repurchase, we expect a positive (negative) association between Repurchase and InterestImpact (LevImpact). APB is an indicator variable that equals one if the year is 2008 or 2009, during which the most clustered repurchases occurred, and zero otherwise. We predict a positive association between Repurchase and APB. The coefficients on the interaction terms, InterestImpact*APB and LevImpact*APB, measure the differential effects of APB on the associations between the financial reporting impacts of APB 14-1 and the decision to repurchase cash-settled convertibles. Therefore, γ3 and γ5 are our coefficients of interest and are expected to be positive and negative, respectively. Other control variables are defined in Appendix C.
EarlyRedeem is included to control for the call protection feature of cash-settled convertible debt. It is an indicator variable that equals one if the convertibles are redeemable before the maturity date, and zero otherwise. We expect a positive association between Repurchase and EarlyRedeem.
We include firm characteristics to control for the issuers’ ability to bear the costs of repurchase (Marquardt and Wiedman 2007). We include firm size (Size) in the analyses of firms’ decisions to repurchase. The repurchase may be less costly for large firms. Higher profitability (ROA) can facilitate the cash repurchases in the open market by providing attractive prices to the holders of the cash-settled convertible bonds. Cash is included to control for the level of cash reserves available for convertible debt repurchase. BM is a proxy for growth opportunities. We expect positive associations between Repurchase and these four control variables. We include firms’ interest coverage ratios (InterestCoverage) and leverage ratios (LEV) in Equation (1) because they are directly affected by APB 14-1 in the opposite direction. We predict a negative coefficient on InterestCoverage and a positive coefficient on LEV. CAPX is included to control for firms’ need to raise new capital to fund new investment projects. Finally, it is generally costlier to call and redeem public debt than to call and redeem private debt due to the former’s dispersed ownership. Thus, we expect a negative relationship between Repurchase and Public.

4.2.2. Response to APB 14-1 and Debt Contracting Practices

We next test our second set of hypotheses using the following probit model, as modified based on Equation (1):
R e p u r c h a s e i t = γ 0 + γ 1 A P B i t + γ 2 D D C i t + γ 3 D D C * A P B i t + γ 4 I n t e r e s t I m p a c t i t + γ 5 I n t e r e s t I m p a c t i t * A P B i t + γ 6 I n t e r e s t I m p a c t i t * A P B i t * D D C i t + γ 7 I n t e r e s t I m p a c t i t * D D C i t + γ 8 L e v I m p a c t i t + γ 9 L e v I m p a c t * A P B i t + γ 10 L e v I m p a c t i t * A P B i t * D D C i t + γ 11 L e v I m p a c t i t * D D C i t + γ 12 E a r l y R e d e e m i t + γ 13 S i z e i t + γ 14 B M + γ 15 R O A i t + γ 16 C a s h i t + γ 17 L E V i t + γ 18 I n t e r e s t C o v e r a g e i t + γ 19 C A P X i t + γ 20 P u b l i c i t + I n d u s t r y F E + Y e a r F E + ε 1
The variable DDC represents firms’ debt contracting practices: exclusion of GAAP changes at the request of either borrower or lender (FrozenGAAPonRequest), and the inclusion of an interest coverage covenant (D_Coverage). We follow the methodologies from prior studies (Beatty et al. 2002; Christensen and Nikolaev 2017) and categorize the contract treatment of GAAP changes into four groups: rolling GAAP (RollingGAAP), rolling GAAP for voluntary accounting changes (RollingGAAP_Voluntary), frozen GAAP (FrozenGAAP), and frozen GAAP on request (FrozenGAAPonRequest). Definitions and examples of each contracting practice are provided in Appendix B and Appendix C. We predict that firms whose debt contracts exclude GAAP changes at the request of either the borrower or the lender will be less likely to engage in costly cash repurchase because they can simply exercise the option to freeze the GAAP. In addition, when firms’ debt contracts contain financial covenants for interest coverage ratios, we predict that they are more likely to repurchase outstanding cash-settled convertibles to avoid any technical default on such covenants. Therefore, the coefficient of γ6 is expected to be negative when DDC represents FrozenGAAPonRequest and positive when DDC represents D_Coverage, respectively. We do not have a prediction on the three-way interaction term for LevImpact (γ10) because from the debt contracting perspective, keeping the existing cash-settled convertibles can also reduce leverage ratios after the bifurcation, just to a lesser degree compared to complete repurchase.

5. Empirical Results

5.1. Descriptive Statistics

Table 2 presents the total proceeds received by U.S. public firms in the U.S. market during the sample period, including proceeds from new issuances of cash-settled convertible debt and the sum of cash- and equity-settled convertible debt. Over the seven years from 2005 to 2011, the total proceeds received from issuances of cash-settled convertible debt were $153 billion. This sum represents around 86% of the total proceeds from both cash and equity-settled convertible debt issuances. This suggests that cash-settled convertible debt is an economically important source of financing. However, the number of new issuances of cash-settled convertible debt dropped sharply from 88 issues in 2007 to 39 issues in 2008 and 34 in 2011. Similarly, the total proceeds received from new issuances of cash-settled convertible debt dropped from $40 billion in 2007 to around $14 billion in 2008 and $10 billion in 2011.
Table 3 provides descriptive statistics for issuers of cash-settled convertible debt during the sample period. About 47% of sample firms repurchased their outstanding cash-settled convertibles during the sample period, while 49% of the cash-settled convertibles allow for redemption prior to the maturity date if certain criteria are met (e.g., a stock price target or sales growth target). On average, the bifurcation of cash-settled convertible bonds increases interest expenses by approximately 7% of firm’s earnings each year. At the same time, the level of reduction in leverage is approximately 6% per year. For sample firms with information on debt contracting practices, 55% of them use the practice of excluding GAAP changes at the request of borrower or lender. This is consistent with the findings in Christensen and Nikolaev (2017). Around 11% of the sample firms have bank loan contracts that include an interest coverage covenant.
Table 4 presents the number of firms that initiate their first repurchases of outstanding cash-settled convertible debt in a given year. In our sample, a firm can make multiple repurchases of the same cash-settled convertibles during the sample period. Only first-time repurchases will be counted in Table 4. We observe a sudden jump in the number of firms from 3 in 2007 to 37 in 2008 and 47 in 2009. Thus, during 2008 and 2009, 84 firms initiated the repurchase of their outstanding cash-settled convertible debt. The highly clustered repurchases during these two years suggest that issuers took immediate action in response to the adoption of APB 14-1. Such decisions were most likely made by firms after the evaluation of the impact of APB 14-1 on reported interest expense and leverage ratios.

5.2. Multivariate Tests

5.2.1. Firm’s Ability to Carry Out the Repurchases

Table 5 presents the results of the probit model in Equation (1) in different sub-groups categorized by being above or below the median values for proxies of firms’ ability to carry out the repurchases. The proxies we examine in our paper are firm size, operating cash flow, and book-to-market ratio. Panel A of Table 5 shows that larger firms (i.e., firm size is above the median of sample firms) are more likely to repurchase cash-settled convertibles when the impact on interest expense increases after the adoption of APB 14-1. The coefficient on the interaction term InterestImpact*APB is significantly positive for the above-median group (p-value = 2.37) as compared to the below-median group (p value = −0.12). In Panel B of Table 5, we find that when firms have higher operating cash flows, they are more able to afford the cost of repurchases when impacts of bifurcation on interest expense and leverage ratio are higher. The coefficients on the interaction terms are statistically significant in the predicted direction. Lastly, in Panel C of Table 5, we document that when firms have more investment and growth opportunities, they have greater ability to bear the cost of repurchase when the impact of bifurcation on interest expense is higher.
Firms with higher leverage (LEV) and lower interest coverage ratios (InterestCoverage) are more likely to repurchase. The call protection feature, EarlyRedeem, is positively associated with firms’ decisions to repurchase across the three panels when firms are within the sub-groups of lower ability to bear the cost of repurchase. In addition, whether the cash-settled convertible debt is public, as proxied by Public, is not associated with the likelihood of repurchases of cash-settled convertibles. There is partial evidence that Cash is positively associated with the likelihood of repurchases when firms are larger in size.
Overall, results in Table 5 support our first set of hypotheses that firms are more likely to respond to APB 14-1 when their ability to carry out the cash repurchases is greater.

5.2.2. Debt Contracting Practices and Repurchase of Cash-Settled Convertibles

The empirical results for Equation (2) are presented in Table 6. We report whether debt contracting practices, such as the exclusion of GAAP changes and inclusion of an interest coverage covenant, can provide explanations for firms’ responses to mandatory accounting changes. Panel A of Table 6 shows that the coefficient on the three-way interaction term, InterestImpact* FrozenGAAPonRequest*APB, is significantly negative (p value = −2.06), suggesting when firms’ bank loan contracts exclude mandatory GAAP changes at the request of either the borrower or the lender, they are less likely to respond to APB 14-1 because any impact from the GAAP changes can be excluded from the evaluation of covenant compliance. In Panel B of Table 6, we document that, consistent with our expectation, firms are more likely to repurchase cash-settled convertibles when their bank loan contracts include financial covenants related to interest coverage ratios. Firms do so in order to avoid any technical default due to the higher reported interest expenses resulting from the bifurcation requirement under APB 14-1. Overall, results in Table 6 are consistent with the debt contracting hypothesis of managerial response to mandatory accounting changes (Marquardt and Wiedman 2007). We provide a new angle to understanding the debt contracting effects of accounting information.

6. Sensitivity Analysis

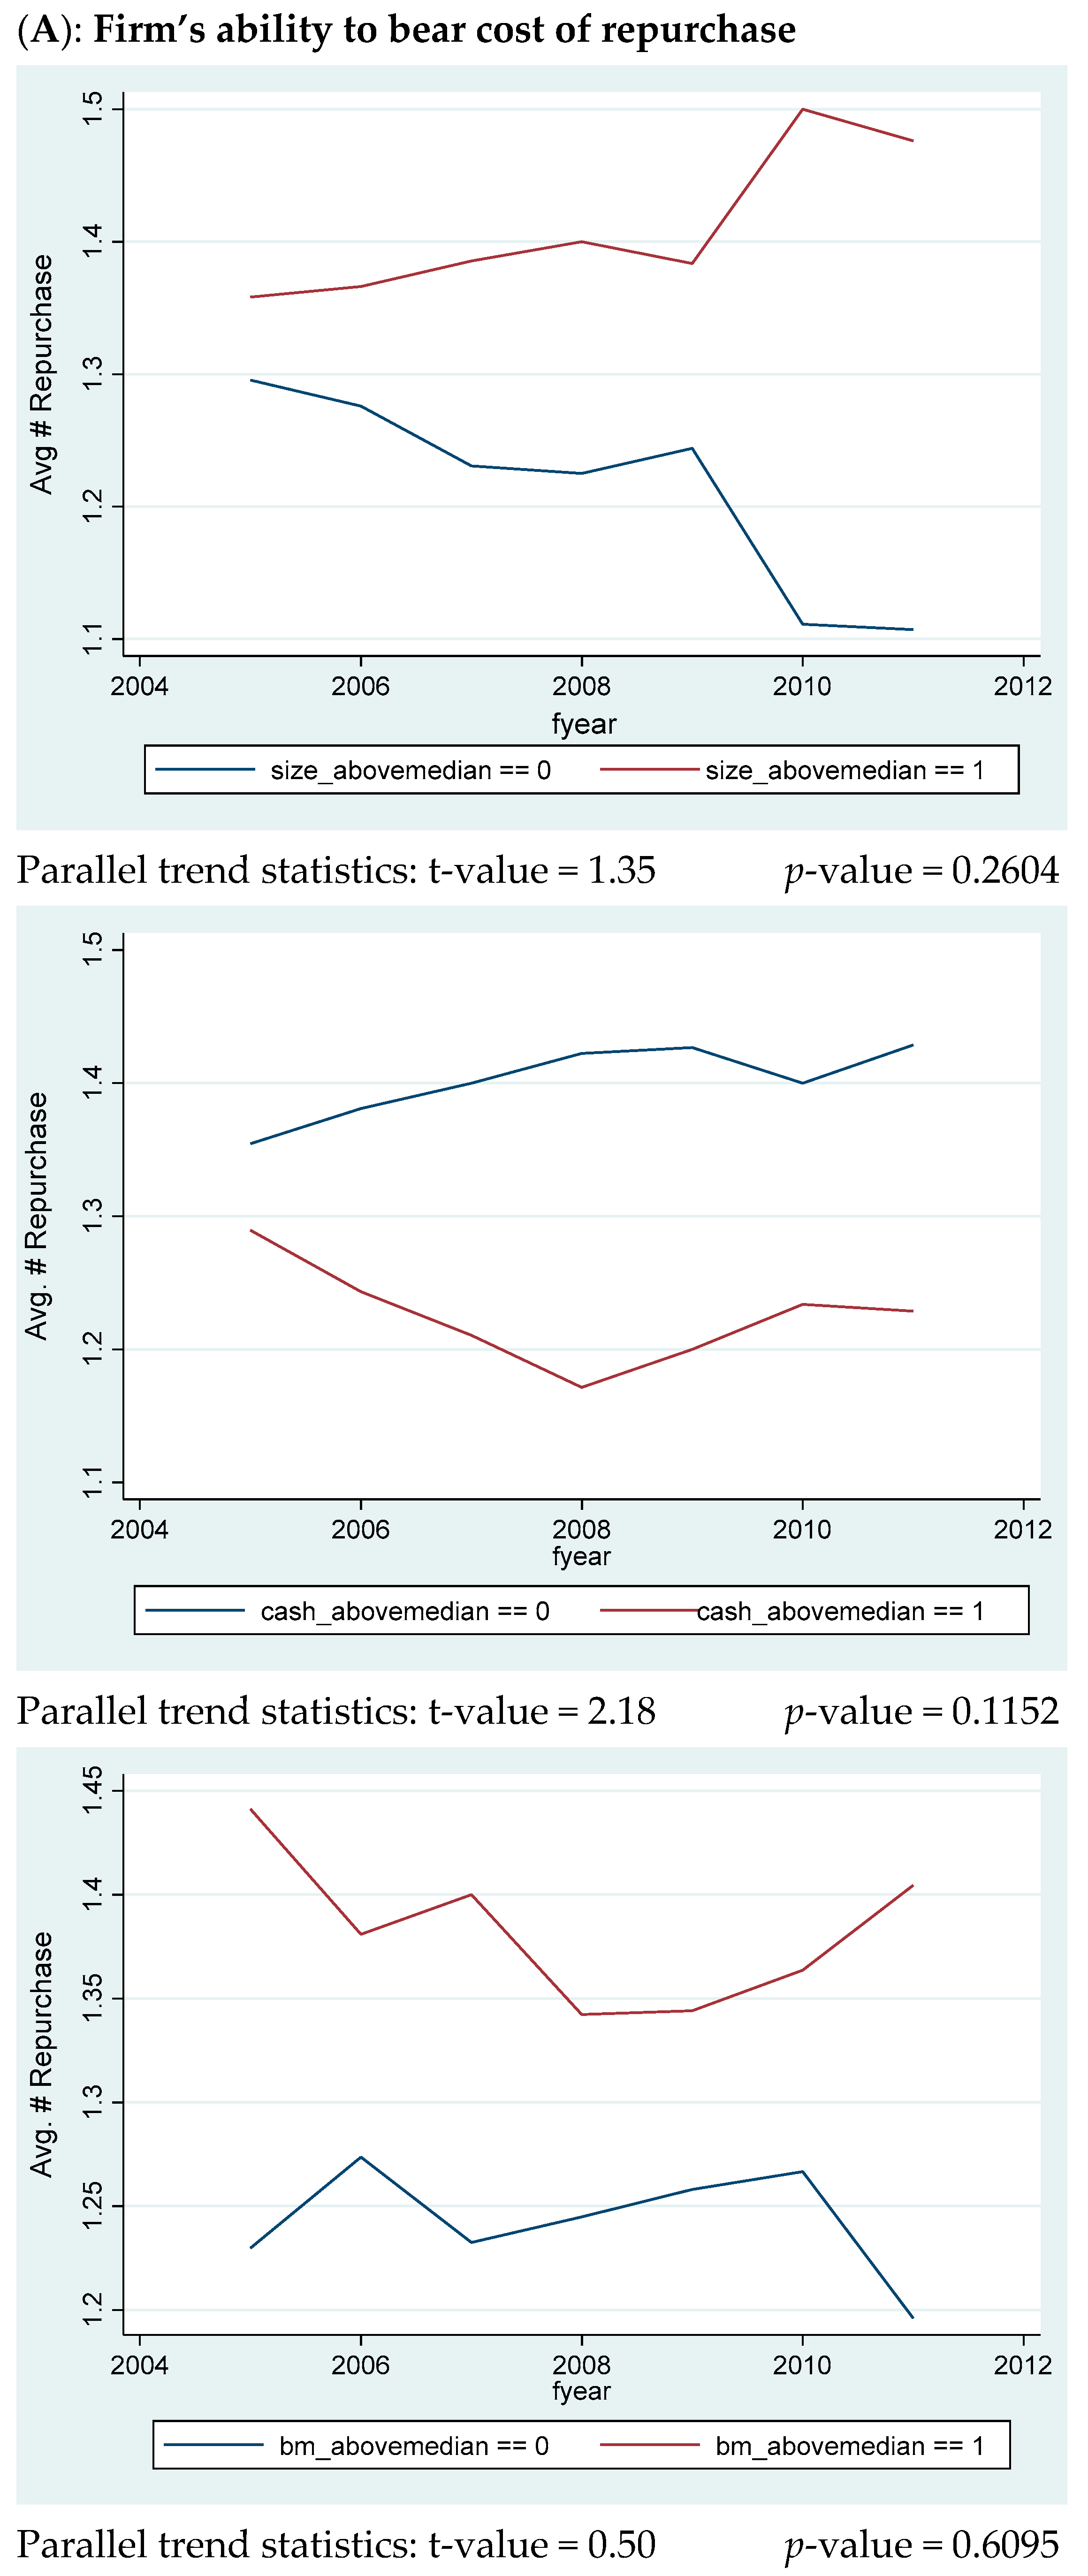
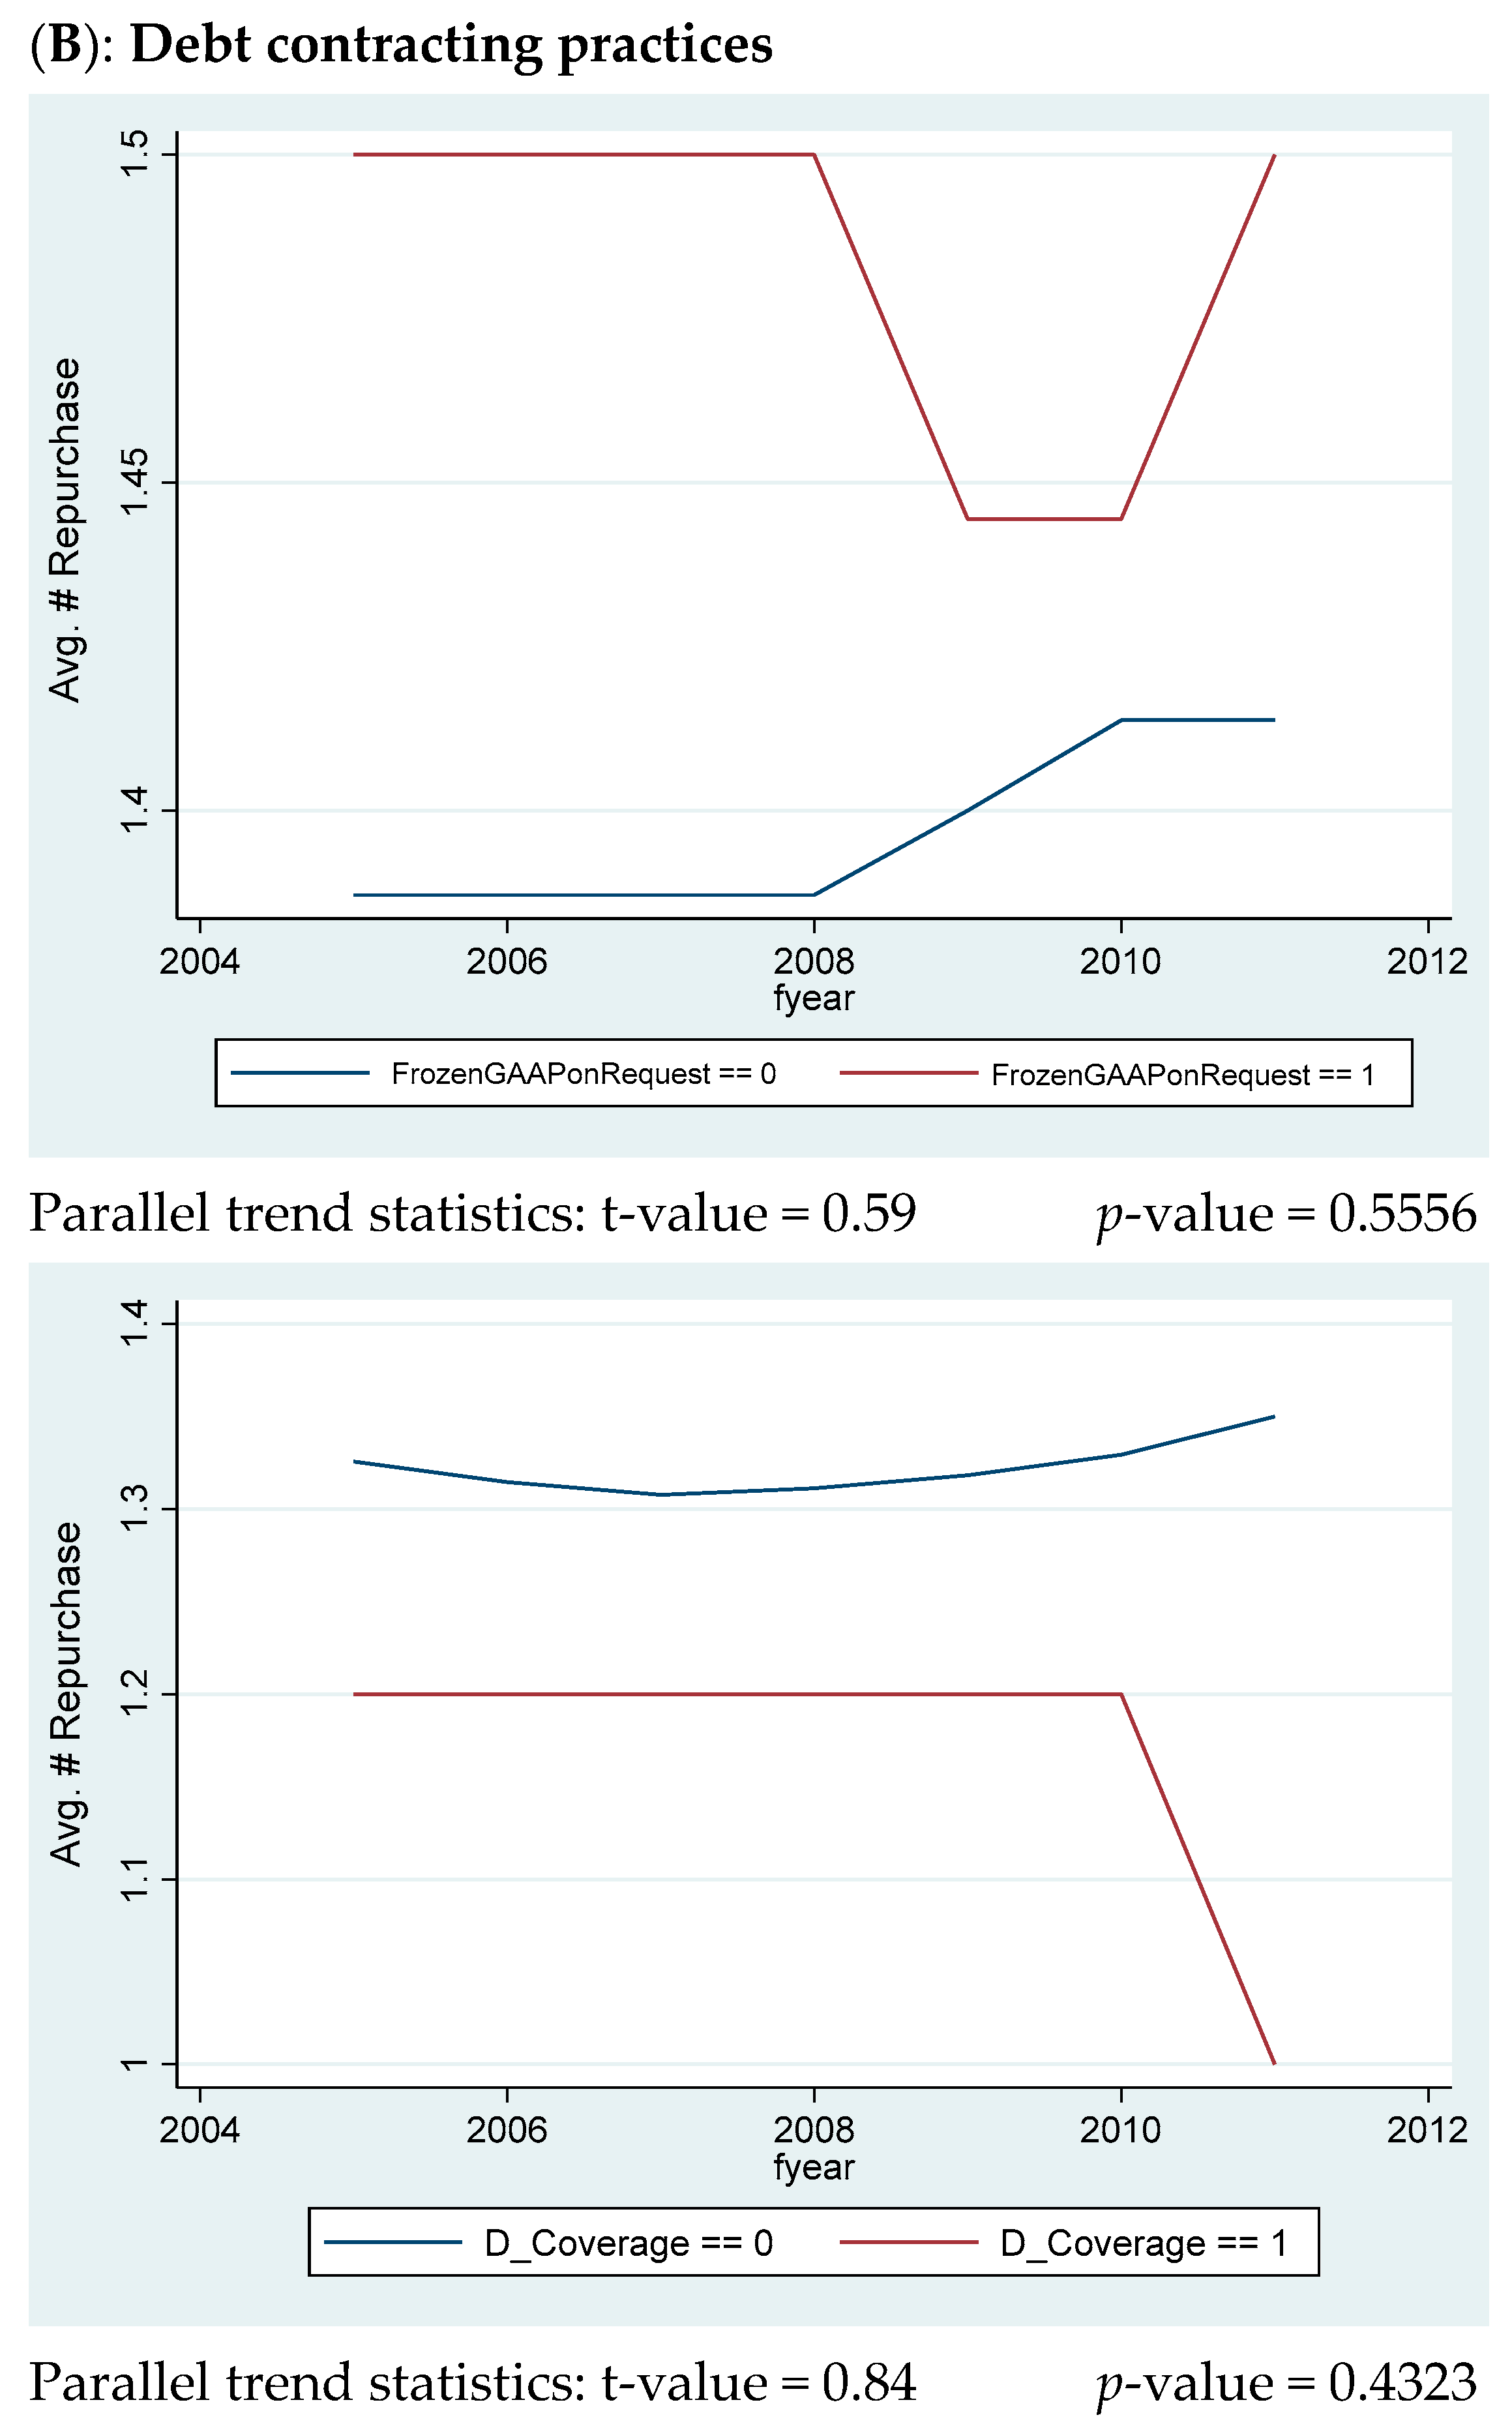
6.1. Parallel Trends Assumption

Our DiD analyses in Section 5.2 indicate that firms that were more able to bear the costs of repurchase were more likely to respond to APB 14-1 in 2008 and 2009. In addition, firms are more likely to respond to APB 14-1 if their debt contracts provide them with an option to exclude mandatory GAAP changes from covenant calculation, and include covenant related to interest coverage ratio. To test the effectiveness of our DiD models, we examine our two sets of hypotheses in the pre-APB 14-1 era to ensure the parallel trend assumption is met (Kausar et al. 2016; Cunningham et al. 2019). In Figure 1, we present the graphs showing the time trends of repurchase activities in the pre- and post-APB 14-1 periods. We observe a significant change in pattern at the time of APB 14-1 adoption in 2008. Under each graph, we present the statistics for parallel trend testing. We observe no significant differences in our dependent variable (Repurchase) in pre-APB 14-1 trends between the treatment and control groups, which supports the parallel trends assumption (i.e., the lowest p-value is 0.1152).

6.2. Firms’ Investment Efficiency and Repurchase Decision

Prior studies showed that during the 2008 financial crisis, corporate capital investment activities (e.g., equity and debt financing) were significantly affected. Bank lending fell by 79% from 2007 to 2008 (Ivashina and Scharfstein 2010). New debt and equity issues also fell significantly in 2008. The difficulty of external borrowing potentially caused firms to give up attractive investment opportunities. Campello et al. (2010) surveyed 392 corporate CFOs and found that both financially constrained and unconstrained firms canceled or postponed attractive investments due to the inability to obtain external financing. Thus, firms were more likely to deviate from the expected level of investment, which affected the efficiency of capital investment. This decrease in investment efficiency is expected to be more severe for firms that were consistently inefficient prior to 2008. The increase in repurchase activities that we observe during our sample period may be related to how efficiently firms make investment decisions.
To examine whether a firm’s past investment behavior affects its decision to repurchase cash-settled convertible bonds, we include a measure of past investment efficiency in both Equations (1) and (2). This measure is constructed following the methodology in Biddle et al. (2009). We estimate a firm-specific model by regressing investment in period t + 1 on the sales growth rate in period t. Next, we use the residuals as a proxy for investment inefficiency in each year, including both over- and under-investment. In our study, we take the absolute value of the residual terms because both over- and under-investment are considered inefficient. Finally, we construct a variable, InvEff, that equals the average of the investment inefficiency measures for each firm from the past eight years. The untabulated results show that the coefficients on InvEff are insignificant. This suggests that past investment efficiency does not affect the results from our main tests.

6.3. Impact of Financial Constraints

During the 2008 financial crisis, firms were credit-constrained because significantly less capital was available in the market. Both private bank loans and public financing fell significantly (Campello et al. 2010; Ivashina and Scharfstein 2010). Small firms and growth firms that typically issued cash-settled convertible bonds were affected more negatively by the credit crunch. The presence of financial constraints may manifest itself in firms’ capital structure decisions. To assess whether financial constraints during the 2008 financial crisis affected a firm’s decision to repurchase cash-settled convertible bonds, in Equations (1) and (2), we include the variable rankFinConst, which is estimated using the methodology of Lamont et al. (2001). This index is higher for firms that are more financially constrained. As firms become more financially constrained, their investment spending and financial flexibility decline. Because firms need cash to repurchase bonds, those that are financially constrained may not be able to do so. We expect financially constrained firms to be less likely to repurchase their outstanding cash-settled convertible bonds because they want to hold cash for precautionary reasons.
We re-estimate Equations (1) and (2) while controlling for firms’ financial flexibility. The untabulated results show that the coefficients on the financial constraint measure, rankFinConst, are not significant except for smaller firms and firms whose debt contracts include an interest coverage covenant (negative p-values of 0.025 and 0.068, respectively). This indicates that at firms that are smaller and constrained by covenant compliance, firms are less likely to repurchase if they do not have extra cash on hand.

7. Conclusions

In this study, we aim to provide empirical evidence on how firm characteristics and debt contracting practices can provide explanations for the impact of APB 14-1 adopted in 2008 on firms’ financing decisions. Using a set of hand-collected data, we form a sample of firms that issued cash-settled convertible debt during the sample period of 2005–2011. First, we find that the firms are more likely to respond to APB 14-1 by repurchasing their outstanding cash-settled convertibles when they are more able to do so. Second, consistent with debt contracting effects, we find that firms are less likely to respond to the impact of APB 14-1 if their debt contracts provide an option to both the borrower and the lender to freeze the GAAP so that any GAAP changes will be excluded from the covenant evaluation. In addition, when debt contracts contain covenants on interest coverage ratios, firms are more likely to respond to APB 14-1 by reducing the number of cash-settled convertibles to avoid reporting a higher interest expense which may cause covenant violations.
Overall, our study adds to the current accounting literature on the economic consequences of accounting standards and the debt contracting role of accounting information. First, we show that firm level characteristics can influence how they respond to mandatory GAAP changes, such as APB 14-1, by changing their financing decisions. Second, we add to the literature on debt contracting effects of mandatory accounting standard changes by showing that different contract practices used in debt contracts can help explain the incentives of managerial decisions to respond to mandatory standard changes.

Author Contributions

Conceptualization, N.L.; methodology, N.L.; software, N.L.; validation, N.L., J.Y.J., K.K.; formal analysis, N.L.; investigation, N.L.; data curation, N.L.; writing—original draft preparation, N.L.; writing—review and editing, J.Y.J., K.K.; supervision, N.L.; project administration, J.Y.J. All authors have read and agreed to the published version of the manuscript.

Funding

This research received no external funding.

Data Availability Statement

Data are available from the public sources cited in the text.

Conflicts of Interest

The authors declare no conflict of interest.

Appendix A. Examples of the Impact of Bifurcation under APB 14-1

Example 1. On 1 January 2007, Company A issues 100,000 convertible notes at their par value of $1000 per note, thus raising $100,000,000. The notes bear interest at a fixed rate of 2% per annum, payable annually in arrears on 31 December, and are scheduled to mature on 31 December 2016. Each $1000 par value note is convertible at any time into the equivalent of 10 shares of Company A’s common stock (that is, representing a stated conversion price of $100 per share). The quoted market price of Company A’s common stock is $70 per share on the date of issuance. Its average stock price is $110 per share in 2007. Upon conversion, Company A elects to settle the principal amount of the debt in cash and the conversion spread in common stock. The notes do not contain embedded prepayment features other than the conversion option. At issuance, the market interest rate for similar debt without a conversion option is 8%. Company A’s tax rate is 40%.
During year 2007, Company A reports net income of $10,000,000 and 20,000,000 weighted average shares outstanding for the accounting period.
In the pre-APB 14-1 era, under APB 14, Company A records total proceeds of $100,000,000 as a liability in 2007. The annual interest expense is $2,000,000. The total reported interest expense over the 10-year life is $20,000,000. The FASB amended EITF 90-19 in January 2002 to allow for the exclusion of the non-cash settled portion of such convertible debt (in this example, it is the principal amount that is settled in cash) from the diluted EPS calculation.
Total liability component: $100,000,000
Total equity component: $0
Reported net income: $10,000,000
Annual interest expense: $2,000,000
Total interest expense over 10-year life: $20,000,000
The basic EPS: 0.5
Adjustment to the numerator: $0
Adjustment to the denominator: 90,909 shares13
Diluted EPS: 0.49714
Example 2. On January 1, 2009, Company A issued convertible bonds with the same terms as in Example 1.
In the post-APB 14-1 period, the fair value of the liability component can be estimated by calculating the present value of Company A’s cash flows using a discount rate of 8%, the market rate for similar notes that have no conversion rights, as shown below:
Present value of the principal$100,000,000 payable in 10 years at the 8% market rate$46,319,349
Present value of interest$2,000,000 payable annually in arrears for 10 years$13,420,163
Total liability component$59,739,512
Total equity component/debt discount ($100,000,000–$59,739,512)$40,260,488
Each year, Company A reports interest expenses of $2,000,000 plus the amortized amount of the total debt discount. For example, at the end of 2009, Company A’s reported interest expense is $4,779,161, which is the sum of $2,000,000 coupon interest plus a $2,779,161 debt discount.15 In this case, ceteris paribus, the net income is decreased by $2,779,161 and becomes $7,220,839 for 2009.
Now let us examine the impact on EPS. During 2009, Company A reports net income of $7,220,839 and 20,000,000 weighted average shares outstanding for the accounting period. According to paragraph 29 of Statement 128 (amended in 2008), the cash-settled portion of this convertible debt (the principal amount that is paid by cash at settlement) is excluded from the fully diluted EPS calculation. Only the conversion spread that is settled in common stock should be converted into additional shares to be issued based upon average stock price during the year and included in the fully diluted EPS calculation (see the provisions of paragraph 29 of Statement 128).
Total liability component: $59,739,512
Total equity component: $40,260,488.
Reported net income: $7,220,839
Interest expense for 2009: $4,779,161
Total interest expense over 10-year life: $40,260,488
The basic EPS: 0.361
Adjustment to the numerator: $0
Adjustment to the denominator: 90,909 shares16
Diluted EPS: 0.35917
Table A1. Summary of impact of APB 14-1.
Pre-APB 14-1:
Example 1
(1 January 2007)
Post-APB 14-1:
Example 2
(1 January 2009)
Impact of APB 14-1 on the Same Convertible Debt if Issued in 2007 vs. 2009
(1)(2)((2)-(1))((2)-(1)) ÷ (1)
Total liability component$100,000,000$59,739,512($40,260,488)−40.26%
Total equity component$0$40,260,488$40,260,488100.00%
Reported net income$10,000,000$7,220,839($2,779,161)−27.79%
Interest expense for 2009$2,000,000$4,779,161$2,779,161138.96%
Total interest expense over 10-year life$20,000,000$40,260,488$20,260,488101.30%
The basic EPS0.50.361(0.139)−27.80%
Adjustment to the numerator$0$0$00.00%
Adjustment to the denominator90,909 shares90,909 shares90,909 shares0%
Diluted EPS0.4970.359(0.138)−27.76%

Appendix B. Variable Definitions

Variable Description
APB=Indicator variable that equals one if repurchase in 2008 or 2009, and zero otherwise.
BM=Book value of equity divided by market value of equity at end of year.
CAPX=Capital expenditure ÷ total assets.
Cash=Cash on hand ÷ total assets.
EarlyRedeem=Indicator variable that equals one if issuer has an option to redeem outstanding convertibles prior to maturity date, and zero otherwise.
InterestImpact=Hypothetical changes in reported interest expense as a result of bifurcation if firms do not repurchase their cash-settled convertibles, scaled by the issuers’ EBIT each year. Under APB 14-1, the equity component of cash-settled convertible will be amortized as debt discount and added to reported interest expense using effective interest method. Please refer to Appendix A for detailed calculations of reported interest expense. Thus, this variable measures the impact of increased interest expense on issuers’ EBIT due to the bifurcation required by APB14-1.
InterestCoverage=Issuers’ EBIT ÷ issuers’ interest expense.
InvEff=Average investment efficiency measures over the past eight years (2000–2007), calculated following Biddle et al. (2009).
LEV=Book value of total liabilities ÷ (book value of total liabilities + market value of equity).
LevImpact=Hypothetical changes in reported leverage ratio as a result of bifurcation if firms do not repurchase their cash-settled convertibles. Please refer to Appendix A for detailed calculations of debt and equity components under APB 14-1. Thus, this variable measures the impact of bifurcation on leverage ratio.
Public=Indicator variable that equals one if the issuance is public, and zero otherwise.
rankFinConst=The tertile ranking of the financial constraint measure calculated using the methodology from Lamont et al. (2001). They regress investments on firm characteristics, including cash flow, Tobin’s Q, leverage, dividends, and cash holdings scaled by the book value of assets, using the sample from Kaplan and Zingales (1997). They then construct a financial constraint index using the coefficients from this regression. This index is calculated as: −1.001909*CashFlow/Assets + 3.139193*LTDebt/Assets − 39.36780*Dividends/Assets − 1.314759*Cash/Assets + 0.2826389*Tobin’s Q. Higher rankings represent more constrained firms.
Repurchase=Indicator variable that equals one if the issuer of cash-settled convertible debt repurchased any amount of its outstanding convertible debt during our sample period, and zero otherwise.
ROA=Issuer’s EBIT ÷ average total assets.
Size=The log of total assets at the end of each fiscal year.

Appendix C. Examples of Contracting Treatment of GAAP Changes

  • Rolling GAAP
All accounting terms not specifically or completely defined herein shall be construed in conformity with GAAP, and all financial data (including financial ratios and other financial calculations) required to be submitted pursuant to this Agreement shall be prepared in conformity with GAAP applied on a consistent basis, as in effect from time to time.
2.
Rolling GAAP for voluntary accounting changes
If GAAP shall change from the basis used in preparing such financial statements, the certificates required to be delivered shall set forth calculations for the adjustments necessary to demonstrate how the company is in compliance with the financial covenants based upon GAAP as in effect on the closing date.
3.
Frozen GAAP
All accounting terms not specifically defined herein shall be construed in accordance with generally accepted accounting principles that are consistent with those applied in the preparation of the financial statements referred to in Section 4.1.
4.
Frozen GAAP on request
If, at any time, any change in GAAP would affect the computation of any financial ratio or requirement set forth in any Loan Document, and either the Borrower or the Required Lenders shall so request, the Administrative Agent, the Lenders, and the Borrower shall negotiate in good faith to amend such ratio or requirement to preserve the original intent thereof in light of such change in GAAP (subject to the approval of the Required Lenders (such approval not to be unreasonably withheld, delayed, or conditioned).

Notes

1
In August 2020, the FASB issued ASU 2020-06, Debt—Debt with Conversion and Other Options (Subtopic 470-20) and Derivatives and Hedging—Contracts in Entity’s Own Equity (Subtopic 815-40): Accounting for Convertible Instruments and Contracts in an Entity’s Own Equity. This guidance removes the bifurcation requirement in ASC 470-20 for issuers of cash-settled convertible debt. Instead, cash-settled convertible debt should be recognized as debt in its entirety, regardless of the likelihood of cash settlement. The guidance in ASU 2020-06 also requires entities to calculate diluted earnings per share (EPS) for convertible instruments by using the if-converted method. In addition, entities must presume share settlement for purposes of calculating diluted EPS when an instrument may be settled in cash or shares. ASU 2020-06 will become effective for public companies starting on 15 December 2021.
2
FASB APB 14—Accounting for Convertible Debt and Debt Issued with Stock Purchase Warrants, March 1969.
3
The FASB amended EITF 90-19 in 2002 to provide accounting guidance related to cash-settled convertible debt instruments. Under amended EITF 90-19, cash-settled convertible debt is accounted for in its entirety as a liability. However, the FASB allows the exclusion of cash-settled convertible debt from the calculation of diluted EPS. As a result, cash-settled convertible debt “has less of a dilutive effect than a convertible debt instrument that requires application of the if-converted method.” (https://dart.deloitte.com/USDART/pdf/9c7ce6b6-3f30-11e6-95db-2337c6a5456e, accessed on 1 February 2021)
4
FASB Preliminary Views—Financial Instruments with Characteristics of Equity, November 2007.
5
The sample selection is explained in Section 4.1.
6
Lewis and Verwijmeren (2011) provide a more detailed discussion of the innovations in convertible security designs.
7
Issuers can select from the following choices if they select a cash settlement feature in their convertible bond design. First, issuers can pay the full conversion value in cash. Second, issuers can pay the sum of the principal and accrued interest in cash and the conversion spread in either cash or common stock. Third, issuers can choose any combination of cash and common stock at conversion or maturity. The second choice is the most popular among the sample firms in this study. All of the issuers of cash-settled convertible bonds in our sample selected the second method.
8
APB 14-1 requires that the modified convertible debt instrument “shall continue to be accounted for separately unless the original instrument is required to be derecognized under Issues 06-6 and 96-19 (i.e., the debt instrument does not contain a substantive conversion feature as of its issuance date)”.
9
The sample period starts in 2005 to avoid any confounding effect of changes in Contingent Convertible (COCO) accounting in 2004. For a detailed discussion of the consequences of such accounting changes, please refer to Marquardt and Wiedman (2007). The sample period ends in 2011 so that we have two balanced subperiods surrounding 2008.
10
Regulated industries such as utilities and financial industries may issue and repurchase cash-settled convertibles to meet capital requirements rather than benefitting from the financial reporting incentives examined in this study.
11
We hand-collect the following information from issuers’ public filings. First, we collect the details of the convertible debt offerings, such as method of settlement and call schedule. Second, we collect repurchase-related information (e.g., year of repurchase, source of funding, and gain or loss from repurchase). Third, we obtain the actual discount rate that issuers use to calculate the present value of the debt component of the convertible bonds. Fourth, we collect information about the impact of APB 14-1 on interest expense and leverage ratios that issuers disclosed beginning in fiscal year 2009. All of this information is used in this study’s empirical tests.
12
Data is available on Amir Sufi’s website (http://faculty.chicagobooth.edu/amir.sufi, accessed on 1 February 2021).
13
The conversion spread at the end of 2007: $110 × 1,000,000 shares − $100,000,000 = $10,000,000. The additional shares that will be issued at the conversion date: $10,000,000 ÷ $110 = 90,909 shares.
14
$10,000,000 ÷ (20,000,000 + 90,909) = 0.497.
15
The debt discount for 2009 is calculated with interest method: 8% × 59,739,512 − 2% × $100,000,000 = $2,779,161.
16
The conversion spread at the end of 2009: $110 × 1,000,000 shares − $100,000,000 = $10,000,000. The additional shares that will be issued at the conversion date: $10,000,000 ÷ $110 = 90,909 shares.
17
$7,220,839 ÷ (20,000,000 + 90,909) = 0.359.

References

  1. Aboody, David, Mary E. Barth, and Ron Kasznik. 2004. SFAS No. 123 Stock-Based Compensation Expense and Equity Market Values. The Accounting Review 79: 251–75. [Google Scholar] [CrossRef]
  2. Baber, William R., Patricia M. Fairfield, and James A. Haggard. 1991. The effect of concern about reported income on discretionary spending decisions: The case of research and development. The Accounting Review 66: 818–29. [Google Scholar]
  3. Barthelme, Christian, Paraskevi V. Kiosse, and Thorsten Sellhorn. 2019. The impact of accounting standards on pension investment decisions. European Accounting Review 28: 1–33. [Google Scholar] [CrossRef]
  4. Barth, Mary E., William H. Beaver, and Wayne R. Landsman. 1996. Value-relevance of banks’ fair value disclosures under SFAS 107. The Accounting Review 71: 513–37. [Google Scholar]
  5. Beatty, Anne, K. Ramesh, and Joseph P. Weber. 2002. The importance of excluding accounting changes from the calculation of debt covenant compliance. Journal of Accounting and Economics 33: 205–27. [Google Scholar] [CrossRef]
  6. Bens, Daniel A., and Steven J. Monahan. 2008. Altering investment decisions to manage financial reporting outcomes: Asset-backed commercial paper conduits and FIN 46. Journal of Accounting Research 46: 1017–55. [Google Scholar] [CrossRef]
  7. Bens, Daniel A., Venky Nagar, Douglas Skinner, and M. H. Franco Wong. 2003. Employee stock options, EPS dilution, and stock repurchases. Journal of Accounting and Economics 36: 51–90. [Google Scholar] [CrossRef]
  8. Biddle, Gary C., Gilles Hilary, and Rodrigo S. Verdi. 2009. How Does Financial Reporting Quality Relate to Investment Efficiency? Journal of Accounting and Economics 48: 112–31. [Google Scholar] [CrossRef]
  9. Campello, Murillo, John R. Graham, and Campbell R. Harvey. 2010. The Real Effects of Financial Constraints: Evidence from a Financial Crisis. Journal of Financial Economics 97: 470–87. [Google Scholar] [CrossRef] [Green Version]
  10. Chava, Sudheer, and Michael R. Roberts. 2008. How does financing impact investment? The role of debt covenants. The Journal of Finance 63: 2085–121. [Google Scholar] [CrossRef]
  11. Choudhary, Preeti. 2011. Evidence on differences between recognition and disclosure: A comparison of inputs to estimate fair values of employee stock options. Journal of Accounting and Economics 51: 77–94. [Google Scholar] [CrossRef]
  12. Choudhary, Preeti, Shivaram Rajgopal, and Mohan Venkatachalam. 2009. Accelerated vesting of stock options in anticipation of SFAS 123R. Journal of Accounting Research 47: 105–46. [Google Scholar] [CrossRef]
  13. Christensen, Hans B., and Valeri V. Nikolaev. 2017. Contracting on GAAP changes: Large sample evidence. Journal of Accounting Research 55: 1021–50. [Google Scholar] [CrossRef]
  14. Christensen, Hans B., Valeri V. Nikolaev, and Regina Wittenberg-Moerman. 2016. Accounting information in financial contracting: The incomplete contract theory perspective. Journal of Accounting Research 54: 397–435. [Google Scholar] [CrossRef]
  15. Cohen, Moshe, Sharon P. Katz, Sunay Mutlu, and Gil Sadka. 2019. Do Debt Covenants Constrain Borrowings Prior to Violation? Evidence from SFAS 160. The Accounting Review 94: 133–56. [Google Scholar] [CrossRef]
  16. Cunningham, Lauren M., Chan Li, Sarah E. Stein, and Nicole S. Wright. 2019. What’s in a name? Initial evidence of U.S. audit partner identification using difference-in-difference analyses. The Accounting Review 94: 139–63. [Google Scholar] [CrossRef]
  17. Darrough, Masako N., and Mingcherng Deng. 2019. The role of accounting information in optimal debt contracts with informed lenders. The Accounting Review 94: 165–200. [Google Scholar] [CrossRef]
  18. Demerjian, Peter R. 2011. Accounting standards and debt covenants: Has the “balance sheet approach” led to a decline in the use of balance sheet covenants? Journal of Accounting and Economics 52: 178–202. [Google Scholar] [CrossRef]
  19. Devos, Erik, Shofiqur Rahman, and Desmond Tsang. 2017. Debt Covenants and the Speed of Capital Structure Adjustment. Journal of Corporate Finance 45: 1–18. [Google Scholar] [CrossRef]
  20. Elliott, John, Gordon Richardson, Thomas Dyckman, and Roland Dukes. 1984. The impact of SFAS No. 2 on firm expenditures on research and development: Replications and extensions. Journal of Accounting Research 22: 85–102. [Google Scholar] [CrossRef]
  21. Glaum, Martin, Tobias Keller, and Donna L. Street. 2018. Discretionary accounting choices: The case of IAS 19 pension accounting. Accounting and Business Research 48: 139–70. [Google Scholar] [CrossRef]
  22. Graham, John R., and Campbell R. Harvey. 2001. The theory and practice of corporate finance: Evidence from the field. Journal of Financial Economics 60: 187–243. [Google Scholar] [CrossRef]
  23. Hart, Oliver. 1993. Theories of Optimal Capital Structure: A Managerial Discretion Perspective. In The Deal Decade. Edited by Margaret M. Blair. Washington, DC: The Brookings Institution. [Google Scholar]
  24. Hodder, Leslie, William Maydew, Mary Lea McNally, and Connie D. Weaver. 2006. Employee stock option fair-value estimates: Do managerial discretion and incentives explain accuracy? Contemporary Accounting Research 23: 933–75. [Google Scholar] [CrossRef]
  25. Ivashina, Victoria, and David Scharfstein. 2010. Bank lending during the financial crisis of 2008. Journal of Financial Economics 97: 319–38. [Google Scholar] [CrossRef]
  26. Kaplan, Steven N., and Luigi Zingales. 1997. Do Investment–Cash Flow Sensitivities Provide Useful Measures of Financial Constraints? Quarterly Journal of Economics 112: 159–216. [Google Scholar] [CrossRef] [Green Version]
  27. Kausar, Asad, Nemit Shroff, and Hal White. 2016. Real effects of audit choice. Journal of Accounting and Economics 62: 157–81. [Google Scholar] [CrossRef]
  28. Kraft, Pepa. 2015a. Do Rating Agencies Cater?—Evidence from Rating-Based Contracts. Journal of Accounting and Economics 59: 264–83. [Google Scholar] [CrossRef]
  29. Kraft, Pepa. 2015b. Rating Agency Adjustments to GAAP Financial Statements and Their Effect on Ratings and Credit Spreads. The Accounting Review 90: 641–74. [Google Scholar] [CrossRef]
  30. Kraft, Pepa, Wayne R. Landsman, and Zilu Shan. 2021. Effect of Mandatory IFRS Adoption on Accounting-Based Prediction Models for CDS Spreads. European Accounting Review 30: 1–28. [Google Scholar] [CrossRef]
  31. Lamont, Owen, Christopher Polk, and Jesús Saaá-Requejo. 2001. Financial constraints and stock Return. Review of Financial Studies 14: 529–54. [Google Scholar] [CrossRef]
  32. Leone, Marie. 2008. Convertible Bonds’ Goose Is Cooked. CFO.com. August 22. Available online: http://ww2.cfo.com/accounting-tax/2008/08/convertible-bonds-goose-is-cooked/ (accessed on 1 February 2021).
  33. Levi, Shai, and Benjamin Segal. 2014. The impact of debt–equity reporting classifications on firms’ decision to issue hybrid securities. European Accounting Review 24: 801–22. [Google Scholar] [CrossRef]
  34. Lewis, Craig M., and Patrick Verwijmeren. 2011. Convertible security design and contract innovation. Journal of Corporate Finance 17: 809–31. [Google Scholar] [CrossRef]
  35. Marquardt, Carol, and Christine Wiedman. 2005. Earnings management through transaction structuring: Contingent convertible debt and diluted EPS. Journal of Accounting Research 43: 205–43. [Google Scholar] [CrossRef]
  36. Marquardt, Carol, and Christine Wiedman. 2007. Economic consequences of regulation of financial reporting: Diluted EPS and contingent convertible securities. Review of Accounting Studies 12: 487–523. [Google Scholar] [CrossRef]
  37. Myers, Stewart C. 1977. Determinants of Corporate Borrowing. Journal of financial Economics 5: 147–75. [Google Scholar] [CrossRef] [Green Version]
  38. Nikolaev, Valeri. 2010. Debt covenants and accounting conservatism. Journal of Accounting Research 48: 137–76. [Google Scholar] [CrossRef]
  39. Nini, Greg, David C. Smith, and Amir Sufi. 2012. Creditor Control Rights, Corporate Governance, and Firm Value. The Review of Financial Studies 25: 1713–61. [Google Scholar] [CrossRef]
  40. Scott, Thomas W., Christine Wiedman, and Heather A. Wier. 2011. Transaction Structuring and Canadian Convertible Debt. Contemporary Accounting Research 28: 1046–71. [Google Scholar] [CrossRef]
  41. Teach, Edward. 2014. A Splitting Headache? CFO.com. September 14. Available online: http://ww2.cfo.com/accounting-tax/2007/09/a-splitting-headache/ (accessed on 7 May 2014).
Figure 1. Trends in repurchase activities and parallel trends assumption.
Jrfm 16 00213 g001aJrfm 16 00213 g001b
Table 1. Sample selection and industry distribution.
Panel A: Sample Selection
IssuanceFirms
Number of convertible debt issuances 2005–2011 626478
Less: firms from financial and utilities industries −115−79
Total number of unique observations 511390
Less: firms missing Compustat data −34−30
Cash-settled convertible debt 359279
Panel B: Distribution of cash-settled convertible debt issuers by industries
Industry# of Issuances% of Sample# of Issuers% of Sample
Business Services4512.533211.47
Chemicals and Allied Products5214.484014.34
Coal71.9551.79
Communication205.57145.02
Electronic and Other Electrical Equipment3910.86279.68
Engineering, Accounting, and Management Services41.1131.08
Fabricated Products92.5182.87
Food Products51.3951.79
Food Stores20.5620.72
Healthcare102.7982.87
Industrial and Commercial Machinery205.57176.09
Measuring and Control Equipment349.47279.68
Metal Mining82.2351.79
Oil and Gas Extraction205.57155.38
Primary Metal Industries71.9562.15
Air Transportation 82.2372.51
Transportation Equipment123.34103.58
Wholesale Trade-Durable Goods113.0682.87
All Others4612.814014.34
Total359100279100
Panel A shows the sample selection process for the 359 new cash-settled convertible debt issuances from 279 U.S. public firms during the sample period. Panel B reports the industry distribution of the cash-settled convertible debt issuances. Industry classifications are based upon two-digit Compustat SIC codes.
Table 2. Total proceeds and issuances of convertible debt.
Cash-Settled Convertible DebtSum of Cash- and Equity-Settled Convertible DebtProportion of Cash-Settled to Sum of Cash- and Equity-Settled Convertible Debt
Issue YearTotal Proceeds ($billions)No. of IssuanceTotal Proceeds ($billions)No. of IssuanceTotal Proceeds (%)No. of Issuance (%)
200514.84815.745594.0387.27
200645.487646.598597.6289.41
200740.058846.5610986.0280.73
200813.783916.375284.1875.00
200916.484023.947268.8455.56
201012.653416.675475.8862.96
201110.143413.355075.9668.00
Total153.38359179.2247785.5875.26
This table reports the total proceeds received from new issuances of cash-settled convertible debt and sum of cash- and equity-settled convertible debt by U.S. public firms during the sample period. Data source: Securities Data Company (SDC).
Table 3. Descriptive statistics.
Variable NMeanS.D.0.25Median0.75Max
Variable of interests
APB 23120.290.450011
Repurchase23120.470.500011
InterestImpact (%)16340.070.170.010.020.051.33
LevImpact 23120.060.120.010.030.061.32
Control variables
EarlyRedeem23120.490.500011
Size 23127.521.436.667.448.3311.05
BM 23120.520.580.240.430.743.79
ROA 23120.040.150.010.070.110.35
Cash 22810.140.140.040.10.20.72
LEV 23120.40.230.220.370.560.96
InterestCoverage221515.3272.670.693.488.52531.22
CAPX 23090.060.080.020.030.070.46
Public 23120.310.460011
Debt contracting variables
RollingGAAP7470.270.440011
RollingGAAP_Voluntary7470.040.190001
FrozenGAAP7470.140.350001
FrozenGAAPonRequest7470.550.500111
D_Coverage 13950.110.31610001
This table provides descriptive statistics for cash-settled convertible debt samples used for our main tests. The variables are defined in Appendix B.
Table 4. First repurchases by year.
First-Time Repurchase YearCash-Settled% of Total
200500
200632%
200732%
20083725%
20094732%
20102618%
20113121%
Total147100%
This table presents the number of first-time repurchases by issuers of their outstanding cash-settled convertible debt during the sample period. If a firm repurchased the same cash-settled convertible debt in multiple years, only the first repurchase is included in this table.
Table 5. Firm’s ability to bear the cost of repurchase and repurchase decision.
Panel A: Size Partitions
VariablePredicted SignAbove MedianBelow Median
(1)(2)
APB+−0.46990.6180 ***
(−1.59)(2.62)
InterestImpactit+0.45600.0210
(0.67)(0.06)
LevImpactit−1.6601−2.0725 **
(−0.42)(−2.05)
InterestImpact*APB+4.1947 **−0.0500
(2.37)(−0.12)
LevImpact*APB−1.81150.0932
(−1.16)(0.18)
EarlyRedeemit+0.23280.4764 **
(0.98)(2.08)
Sizeit+−0.0602−0.2848 *
(−0.43)(−1.66)
BMit+−0.07280.0229
(−0.52)(0.19)
ROAit+−0.69010.8648
(−0.53)(1.41)
Cashit+1.8800 *−0.6818
(1.84)(−1.12)
LEVit+1.1767 *−0.1086
(1.65)(−0.22)
InterestCoverageit−0.0023−0.0020
(−1.14)(−1.26)
CAPXit+0.9737−1.3185
(0.42)(−0.90)
Publicit−0.3189−0.3810
(−1.25)(−1.30)
H0: (above − below) = 0
IntImpact*APB χ2 = 5.41, p value = 0.020
LevImpact*APB χ2 = 1.20, p value = 0.273
Industry fixed effect YesYes
Year fixed effect YesYes
# of obs 758627
Pseudo-R2 0.1680.153
Panel B: Operating Cash Flow Partitions
VariablePredicted SignAbove MedianBelow Median
(1)(2)
APB+−0.28760.5928 ***
(−1.03)(2.75)
InterestImpactit+0.2747−0.0147
(0.40)(−0.04)
LevImpactit0.6066−1.7754 *
(0.24)(−1.78)
InterestImpact*APB+2.3280 *0.1234
(1.29)(0.29)
LevImpact*APB−3.3583 ***−0.3239
(−2.34)(−0.68)
EarlyRedeemit+0.28300.4197 **
(1.30)(1.98)
Sizeit+−0.1794−0.2130 *
(−1.63)(−1.73)
BMit+−0.18620.1236
(−0.99)(1.30)
ROAit+−0.21450.5438
(−0.19)(0.90)
Cashit+0.4580−0.6508
(0.51)(−1.13)
LEVit+0.99580.0712
(1.41)(0.17)
InterestCoverageit−0.0018−0.0038 *
(−1.16)(−1.67)
CAPXit+0.3399−1.3040
(0.15)(−1.11)
Publicit−0.2704−0.3431
(−1.15)(−1.39)
H0: (above − below) = 0
IntImpact*APB χ2 = 1.33, p value = 0.249
LevImpact*APB χ2 = 3.75, p value = 0.052
Industry fixed effect YesYes
Year fixed effect YesYes
# of obs 783663
Pseudo-R2 0.1580.132
Panel C: Book-to-Market Ratio Partitions
VariablePredicted SignAbove MedianBelow Median
(1)(2)
APB+−0.42030.1318
(−1.18)(0.48)
InterestImpactit+−0.73700.5366
(−1.28)(1.44)
LevImpactit−1.3167−0.4121
(−1.38)(−0.37)
InterestImpact*APB+1.0726 *−0.2256
(1.54)(−0.43)
LevImpact*APB−0.5815−0.3676
(−0.91)(−0.29)
EarlyRedeemit+0.09290.5514 ***
(0.44)(2.64)
Sizeit+−0.1973 *−0.1439
(−1.83)(−1.55)
BMit+−0.07360.4574 **
(−0.46)(1.97)
ROAit+−0.44250.6070
(−0.49)(1.01)
Cashit+−0.33960.1488
(−0.36)(0.28)
LEVit+0.46081.1621 **
(0.68)(2.09)
InterestCoverageit−0.0029 *−0.0022
(−1.89)(−1.37)
CAPXit+−1.3691−0.4528
(−0.75)(−0.32)
Publicit−0.1866−0.3693
(−0.86)(−1.59)
H0: (above − below) = 0
IntImpact*APB χ2 = 2.05, p value = 0.152
LevImpact*APB χ2 = 0.02, p value = 0.884
Industry fixed effect YesYes
Year fixed effect YesYes
# of obs 712727
Pseudo-R2 0.1220.143
This table reports the analyses of issuers’ decisions to repurchase part or all of their outstanding cash-settled convertibles and their ability to bear the cost of repurchases during our sample period. Equation (1) is estimated at issuance-year level. Industry fixed effects are included for each model but not tabulated. We estimate each of the models cross-sectionally for each year and cluster the standard errors at the firm level. Coefficient t-statistics are in parentheses. ***, **, and * denote significance at the 1%, 5%, and 10% (one-sided for interaction terms, two-sided for others) levels, respectively. The variables are defined in Appendix B.
Table 6. Debt contracting practices and repurchase decisions.
Panel A: GAAP Terms
VariablePredicted SignFrozenGAAPonRequest
APB+−0.1621
(−0.28)
FrozenGAAPonRequest−0.4043
(−0.87)
FrozenGAAPonRequest*APB−0.4662 **
(−1.97)
InterestImpactit+−0.7281
(−0.30)
InterestImpact*APB+11.0411 **
(2.13)
InterestImpact*FrozenGAAPonRequest*APB−11.2136 **
(−2.06)
InterestImpact*FrozenGAAPonRequest+2.9167
(1.08)
LevImpactit−0.4690
(−0.05)
LevImpact*APB−19.4080 **
(−2.26)
LevImpact*FrozenGAAPonRequest*APB+20.0697 **
(2.32)
LevImpact*FrozenGAAPonRequest+−4.4599
(−0.47)
EarlyRedeemit+0.7745 **
(2.25)
Sizeit+−0.2394
(−1.50)
BMit−0.0119
(−0.05)
ROAit+3.4093 **
(2.01)
Cashit+1.7894
(1.03)
LEVit1.8920 *
(1.91)
InterestCoverageit+−0.0003
(−0.04)
CAPXit+2.3701
(0.84)
Publicit0.5959 *
(1.77)
Industry fixed effect Yes
Year fixed effect Yes
# of obs 399
Pseudo-R2 0.258
Panel B: Interest Coverage Covenant
VariablePredicted SignInterest Coverage Covenant
APB+0.3002
(1.49)
InterestImpactit+0.6678
(1.05)
D_Coverage+0.1020
(0.21)
D_Coverage*APB+−0.3165
(−0.46)
InterestImpact*APB+−1.0229
(−0.53)
InterestImpactt*D_Coverage+−0.4207
(−0.94)
InterestImpact*D_Coverage*APB+6.4554 **
(2.41)
LevImpactit1.1106
(0.70)
LevImpact*APB−0.5670
(−0.77)
LevImpact*D_Coverage?−2.0633
(−0.14)
LevImpact*D_Coverage*APB?3.4016
(0.20)
EarlyRedeemit+0.5215 **
(2.31)
Sizeit+−0.3223 ***
(−3.18)
BMit 0.1643
(0.97)
ROAit+1.5799 **
(2.44)
Cashit+−0.7643
(−1.29)
LEVit0.2877
(0.52)
InterestCoverageit+−0.0017
(−1.56)
CAPXit+−3.6539 **
(−2.12)
Publicit0.1331
(0.53)
Industry fixed effect Yes
Year fixed effect Yes
# of obs 873
Pseudo-R2 0.156
This table reports the analyses of issuers’ decisions to repurchase part or all of their outstanding cash-settled convertibles and their debt contracting practices during our sample period. Equation (2) is estimated at issuance-year level. Industry fixed effects are included for each model but not tabulated. We estimate each of the models cross-sectionally for each year and cluster the standard errors at the firm level. Coefficient t-statistics are in parentheses. ***, **, and * denote significance at the 1%, 5%, and 10% (one-sided for interaction terms, two-sided for others) levels, respectively. The variables are defined in Appendix B.
Disclaimer/Publisher’s Note: The statements, opinions and data contained in all publications are solely those of the individual author(s) and contributor(s) and not of MDPI and/or the editor(s). MDPI and/or the editor(s) disclaim responsibility for any injury to people or property resulting from any ideas, methods, instructions or products referred to in the content.

