
Carbon Tax and Tourism Employment: Is There An Interplay?


Institute of Macroeconomic Analysis and Development, Gregorciceva ulica 27, SI-1000 Ljubljana, Slovenia
J. Risk Financial Manag. 2023, 16(3), 193; https://doi.org/10.3390/jrfm16030193
Submission received: 21 February 2023
/
Revised: 9 March 2023
/
Accepted: 10 March 2023
/
Published: 13 March 2023
(This article belongs to the Special Issue Economic and Econometric Analysis of Tourism and Hospitality Industry)
Abstract
:The impact of the climate change response on the labour market is an important question for policymakers, while the net positive effect of green policies on the labour market is seen as one of the arguments in favour of a green transition. This is particularly important for the tourism labour market, which was severely hit by the COVID-19 pandemic. This study examined the effect of carbon taxes on tourism employment for European countries that have levied a carbon tax over the past thirty years. A macroeconomic panel data regression model ex-post study was applied by contrasting the obtained results via a robustness check. The estimation results indicate a slightly positive and significant association between the carbon tax and tourism employment, which was additionally tested by considering revenue recycling, early adopters of the carbon tax, and a higher carbon tax compared to countries with a lower carbon tax. We cannot conclude that these factors matter for tourism employment, proving the robustness of the results. Revenue-neutral carbon taxation, policies to address the skills gap, push and pull incentives, and active labour market policies to facilitate the quick re-integration of jobseekers into employment are viewed as pivotal to ensure a smoother transition toward a sustainable tourism labour market.
1. Introduction
Tourism is considered the largest service industry in the world, accounting for more than 10% of global GDP. Prior to the COVID-19 pandemic, tourism accounted for 334 million jobs worldwide, while in 2020, employment in this sector fell to 272 million jobs worldwide as a result of the pandemic and subsequent interventions. Travel restrictions led to a collapse in international tourism arrivals, which in Europe fell by 70% from 746 million in 2019 to 221 million in 2020. Tourism was severely hit by the COVID-19 pandemic, with many jobs lost, while at the same time, greenhouse gas emissions (GHG) fell by an estimated 7% (ILO 2022a). Tourism is characterised by high incidence of informality, weak regulation, poor working conditions, and talent management. In the absence of policies and regulation, tourism can lead to the overuse of resources, environmental degradation, and social disruption in local areas. Re-establishing the position of tourism calls for a sustainable transformation of tourism (UNWTO 2020). Tourism not only contributes to climate change, but is also vulnerable to it.
In light of the Paris Agreement to keep the global temperature increase well below 2 °C, a comprehensive policy package was introduced to reduce global carbon emissions to zero by 2050. The policy package includes, among others, carbon taxation, which today is seen as the most prominent climate change mitigation policy to effectively and efficiently reduce carbon emissions, and has been found to generate significant fiscal revenue. The carbon tax is a specific form of environmental tax that introduces price signals and is commonly expressed as a price per tonne of carbon dioxide equivalent (CO2e) (Gurtu et al. 2022). In relation to tourism, carbon pricing puts a price on GHG and reaches it through reducing energy demand because of higher prices, switching from more to less carbon-intensive fuels, but on the other hand, challenges new responses of producer and consumer patterns, often resulting in innovative sustainable tourism consumption and production (International Finance Corporation 2017).
Climate change and green economic transformation also require changes in employment. Green economic transformation and green growth policies impact the labour market and economic sectors. Some of the main channels of the impact of green growth policies have been identified (Chateau et al. 2018). First, changes in the production modes and technology taking into account the use of more resource-efficient capital with a shift away from sources of environmental damage, while changes in the labour market largely depend on the degree of complementarity between new capital and labour. Second, changes in demand patterns led by changes in relative prices of clean versus polluting goods, which may lead to shifts in production across sectors, while the net impact on the labour market depends on the employment changes in the positively and negatively affected sectors. Furthermore, changes in aggregate income and economic conditions where the effects are associated with stimulus from broad policy packages and changes in taxation, while the net labour market impact depends on the scale of the increase in public investments compared to the increase in taxes. Finally, changes in trade and competitiveness could lead to a decline in employment in the commodity producing sectors.
The impact of carbon tax on employment is an important question for policymakers and was the focus of this paper. This is of particular relevance for the tourism labour market, which itself is an important generator of jobs. Tourism is still under pressure due to the consequences of the COVID-19 pandemic and post-pandemic recovery. Moreover, tourism is facing challenges in the current conjuncture of re-thinking tourism in line with green and digital transformation. The aim of this paper was therefore to research whether carbon taxes affect tourism employment. A novel feature of this paper is the use of an ex-post study to research the effects of carbon taxes on tourism employment, which is a rare approach in the economic literature examining the effects of carbon taxes on macroeconomic performance (Köppl and Schratzenstaller 2022). The results of ex-post studies are generally more reliable than those of ex-ante studies, which usually rely on a variety of assumptions to formulate specific simulation scenarios (OECD 1999). Ex-post studies are useful in determining if a policy intervention has reached its objectives, which in turn can provide valuable information to improve the design and implementation of future policy interventions. This may lead to a better decision-making process, testing the effectiveness of different measures, an increased knowledge of the likely effects of policy interventions as well as evidence and transparency of the actual impacts (OECD 2016). Furthermore, the study was based on macroeconomic panel data focusing on European countries that, according to the World Bank Group Carbon Pricing Dashboard, have levied a carbon tax over the past thirty years. Additionally, this paper addressed the robustness check of results with respect to revenue recycling considering the double dividend hypothesis, the effect of early adopters of carbon tax as well as the effect of a higher carbon tax compared to countries with a lower carbon tax. Last but not least, the paper adds to the relatively thin literature in the field of research on tourism employment and carbon tax policy.
2. Literature Review
The empirical effects of carbon taxes studied in the literature include various impact dimensions such as environmental effectiveness, macroeconomic effects, impacts on competitiveness and innovation, distributional implications, and public acceptance (Köppl and Schratzenstaller 2022). On the other hand, not many studies to date have researched the impacts of carbon taxes on tourism, as also argued in Zhang (2021).
The effects of carbon tax on Australian tourism was studied by Dwyer et al. (2013), where the authors used a dynamic, multi-sectoral, multi-regional computable general equilibrium model of the Australian economy. The simulation results indicate that under a carbon tax, most tourism industries experienced at least a small reduction in their employment relative to the baseline values in 2020, but there were also some that experienced an increase in employment. The largest increase in employment was seen in the rail transport industry. A mild economic contraction of an Australian carbon tax was found in a study by (Meng and Pham 2017). The authors used an environmentally extended social accounting matrix and computable general equilibrium model. In their study, Meng et al. (2021) simulated the short-run effects of the Emissions Trading Scheme (ETS) on the Chinese tourism industry and found that the adverse impact on tourism was weaker in comparison to the energy sectors.
Zhang and Zhang (2020) examined the impact of the carbon tax on output, employment, production price, and demand on the Chinese tourism industry by using the dynamic computable general equilibrium model. The authors found that the carbon tax had various and significant impacts on the aforementioned economic variables and on different tourism sectors. They also concluded that the carbon tax had the greatest impact on tourism demand and the smallest on the tourism production price. In addition, the impact of tourism on low-carbon performance was diversified and nonlinear (Zhang and Zhang 2021).
Impulse responses of the tourism economy to productivity shocks and carbon intensity target shocks in terms of output, employment, and consumption with the use of a multi-sector dynamic stochastic general equilibrium model were studied by Zhang (2022). The results showed that carbon intensity target shocks had a negative impact on the tourism aggregate economy, while the reduction in carbon intensity target offset the positive effects of productivity shocks and increased the negative carbon impacts. Furthermore, different carbon intensity targets produce various volatilities and the persistence of exogenous shocks (e.g., Gricar et al. 2022).
Tourism is seen as a vast industry with huge economic impact (e.g., employment), but on the other hand negatively impacts the environment. According to Lenzen et al. (2018), prior to the COVID-19 pandemic, tourism and travel were responsible for almost one tenth of GHG emissions. Aside from transport, which largely contributes to tourism emissions, a noticeable share of emissions has been related to the consumption of goods and services. This in turn indicates that circular economy practices have an influence in lowering the GHG emissions of tourism activities, and provide unprecedented employment opportunities with a necessary focus on skills enhancement (Sorin and Sivarajah 2021; Han 2021; Moropoulou et al. 2021; Nocca et al. 2023).
There has been much discussion in the scientific literature about economic taxation and tourism. Kristjánsdóttir (2021) studied the impact of higher value added tax on tourism demand in Europe. The study, which was based on the World Bank data and value added tax data from the trade association of hotels, restaurants and cafes, did not find that the tax affected the inflow of tourists to Europe. Additionally, the data did not reveal any differences when comparing mature tourism markets and tourism growth markets. Additionally, overtourism and the question of its impact on local areas considering the integration of tourism policies with the environmental, tax, socio-economic, and energy policies to be followed have been explored (Nepal and Nepal 2021; Oklevik et al. 2019), and Chan et al. (2019) also highlighted the importance of tax system efficiency enhanced by the quality of democracy and transparency.
Revenue-neutral carbon taxation improves the public acceptance of environmental taxes, taking into account that taxes are generally not popular government measures. Discussed in the context of the double dividend hypothesis consisting of imposing environmental tax while reducing other pre-existing taxes such as taxes on labour, taxes on capital, or taxes on consumption, the hypothesis is gaining momentum. Freire-González (2018) concluded in an extensive study that environmental tax reached the environmental goals and, on the other hand, revenue recycling proved the double dividend hypothesis in most of the simulations analysed. Freire-González and Ho (2019) developed a dynamic computable general equilibrium model to test the double dividend hypothesis and simulated three levels of carbon taxes, and for each level of carbon tax, four revenue recycling scenarios were inspected. The authors concluded that in each case, the revenue recycling to cut pre-existing taxes could improve the economy and reduce carbon emissions.
3. Methodology
3.1. Data
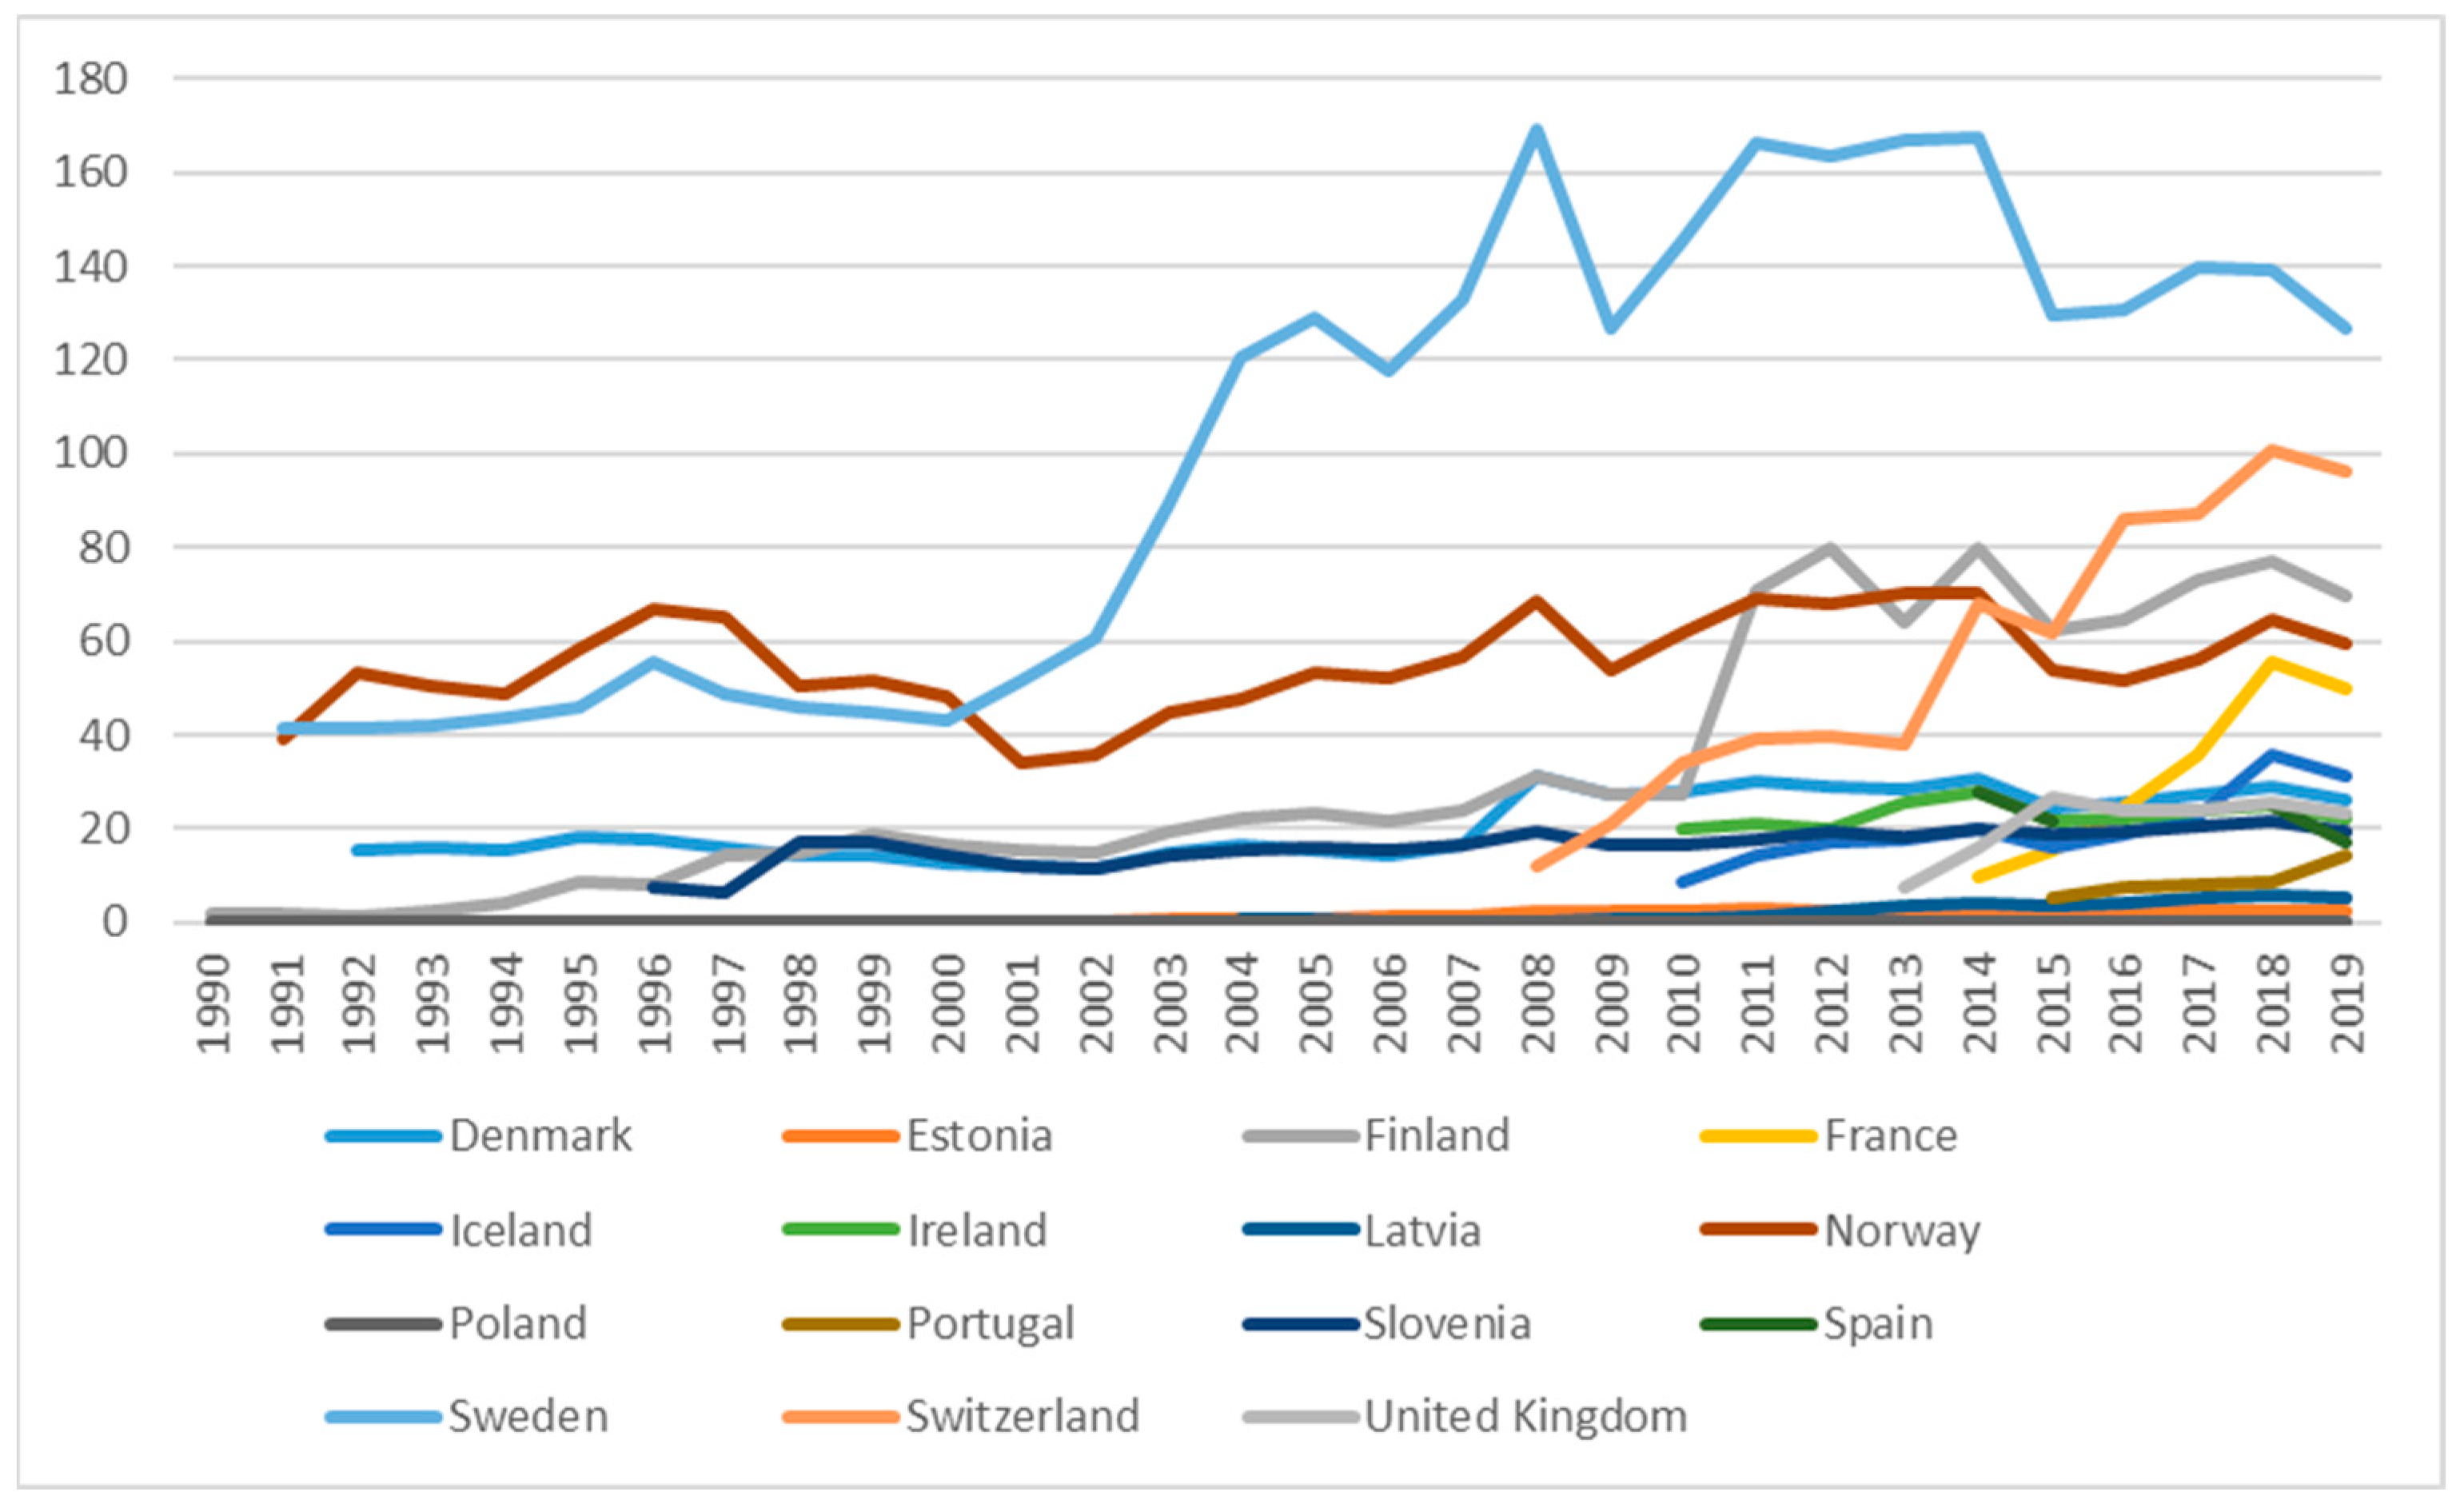
To research whether carbon taxes affect tourism employment, we obtained the macroeconomic panel data. The main data sources for this research were Eurostat (2022) and The World Bank (2022a, 2022b, 2022c) for the period 1990–2019. We focused on European countries that, according to the World Bank Group Carbon Pricing Dashboard, have levied a carbon tax over the past thirty years (see Figure 1). Among them, the early adopters of a carbon tax were the Scandinavian countries, led by Finland in 1990. The Finnish carbon tax applies to CO2 emissions mainly from the industry, transport, and building sectors, with some exemptions for industry. The carbon tax price rate in 2022 was USD 85.10 per tonne of CO2 equivalent, while the government carbon tax revenues in 2021 were USD 1547.28 million. Poland also introduced a carbon tax in 1990, with a carbon tax price rate of USD 0.08 per tonne of CO2 equivalent in 2022, which was the lowest carbon tax price rate among the sample countries. The Polish carbon tax applies to GHG emissions from all sectors with some exemptions for certain entities. Government revenues from the carbon tax amounted to USD 1.15 million in 2021. Portugal was the last country in the observed sample of the European countries to introduce a carbon tax in 2015, with the carbon tax price rate of USD 26.44 USD per tonne of CO2 equivalent in 2022. Portugal’s carbon tax applies to GHG emissions mainly from the industry, building, and transport sectors, with some exemptions for these and other sectors. In 2021, Portugal generated USD 331.12 million in government revenue from the carbon tax. The average carbon tax price rate in the period 1990–2019 was the highest in Sweden (USD 100.85/tCO2e) and the lowest in Poland (USD 0.07/tCO2e). Together, the European countries included in the sample covered 0.92% of global GHG emissions in 2022, with the highest share of the jurisdiction’s GHG emissions in Norway (63%) and the lowest in Spain (1.87%). Based on data provided by Metcalf and Stock (2020), we also included information on revenue recycling. Countries can use carbon tax revenues to reduce other more distortionary taxes (e.g., labour taxes), which can be one of the factors affecting the macroeconomic performance. Table 1 summarizes information about the carbon taxes across the European countries included in our sample.
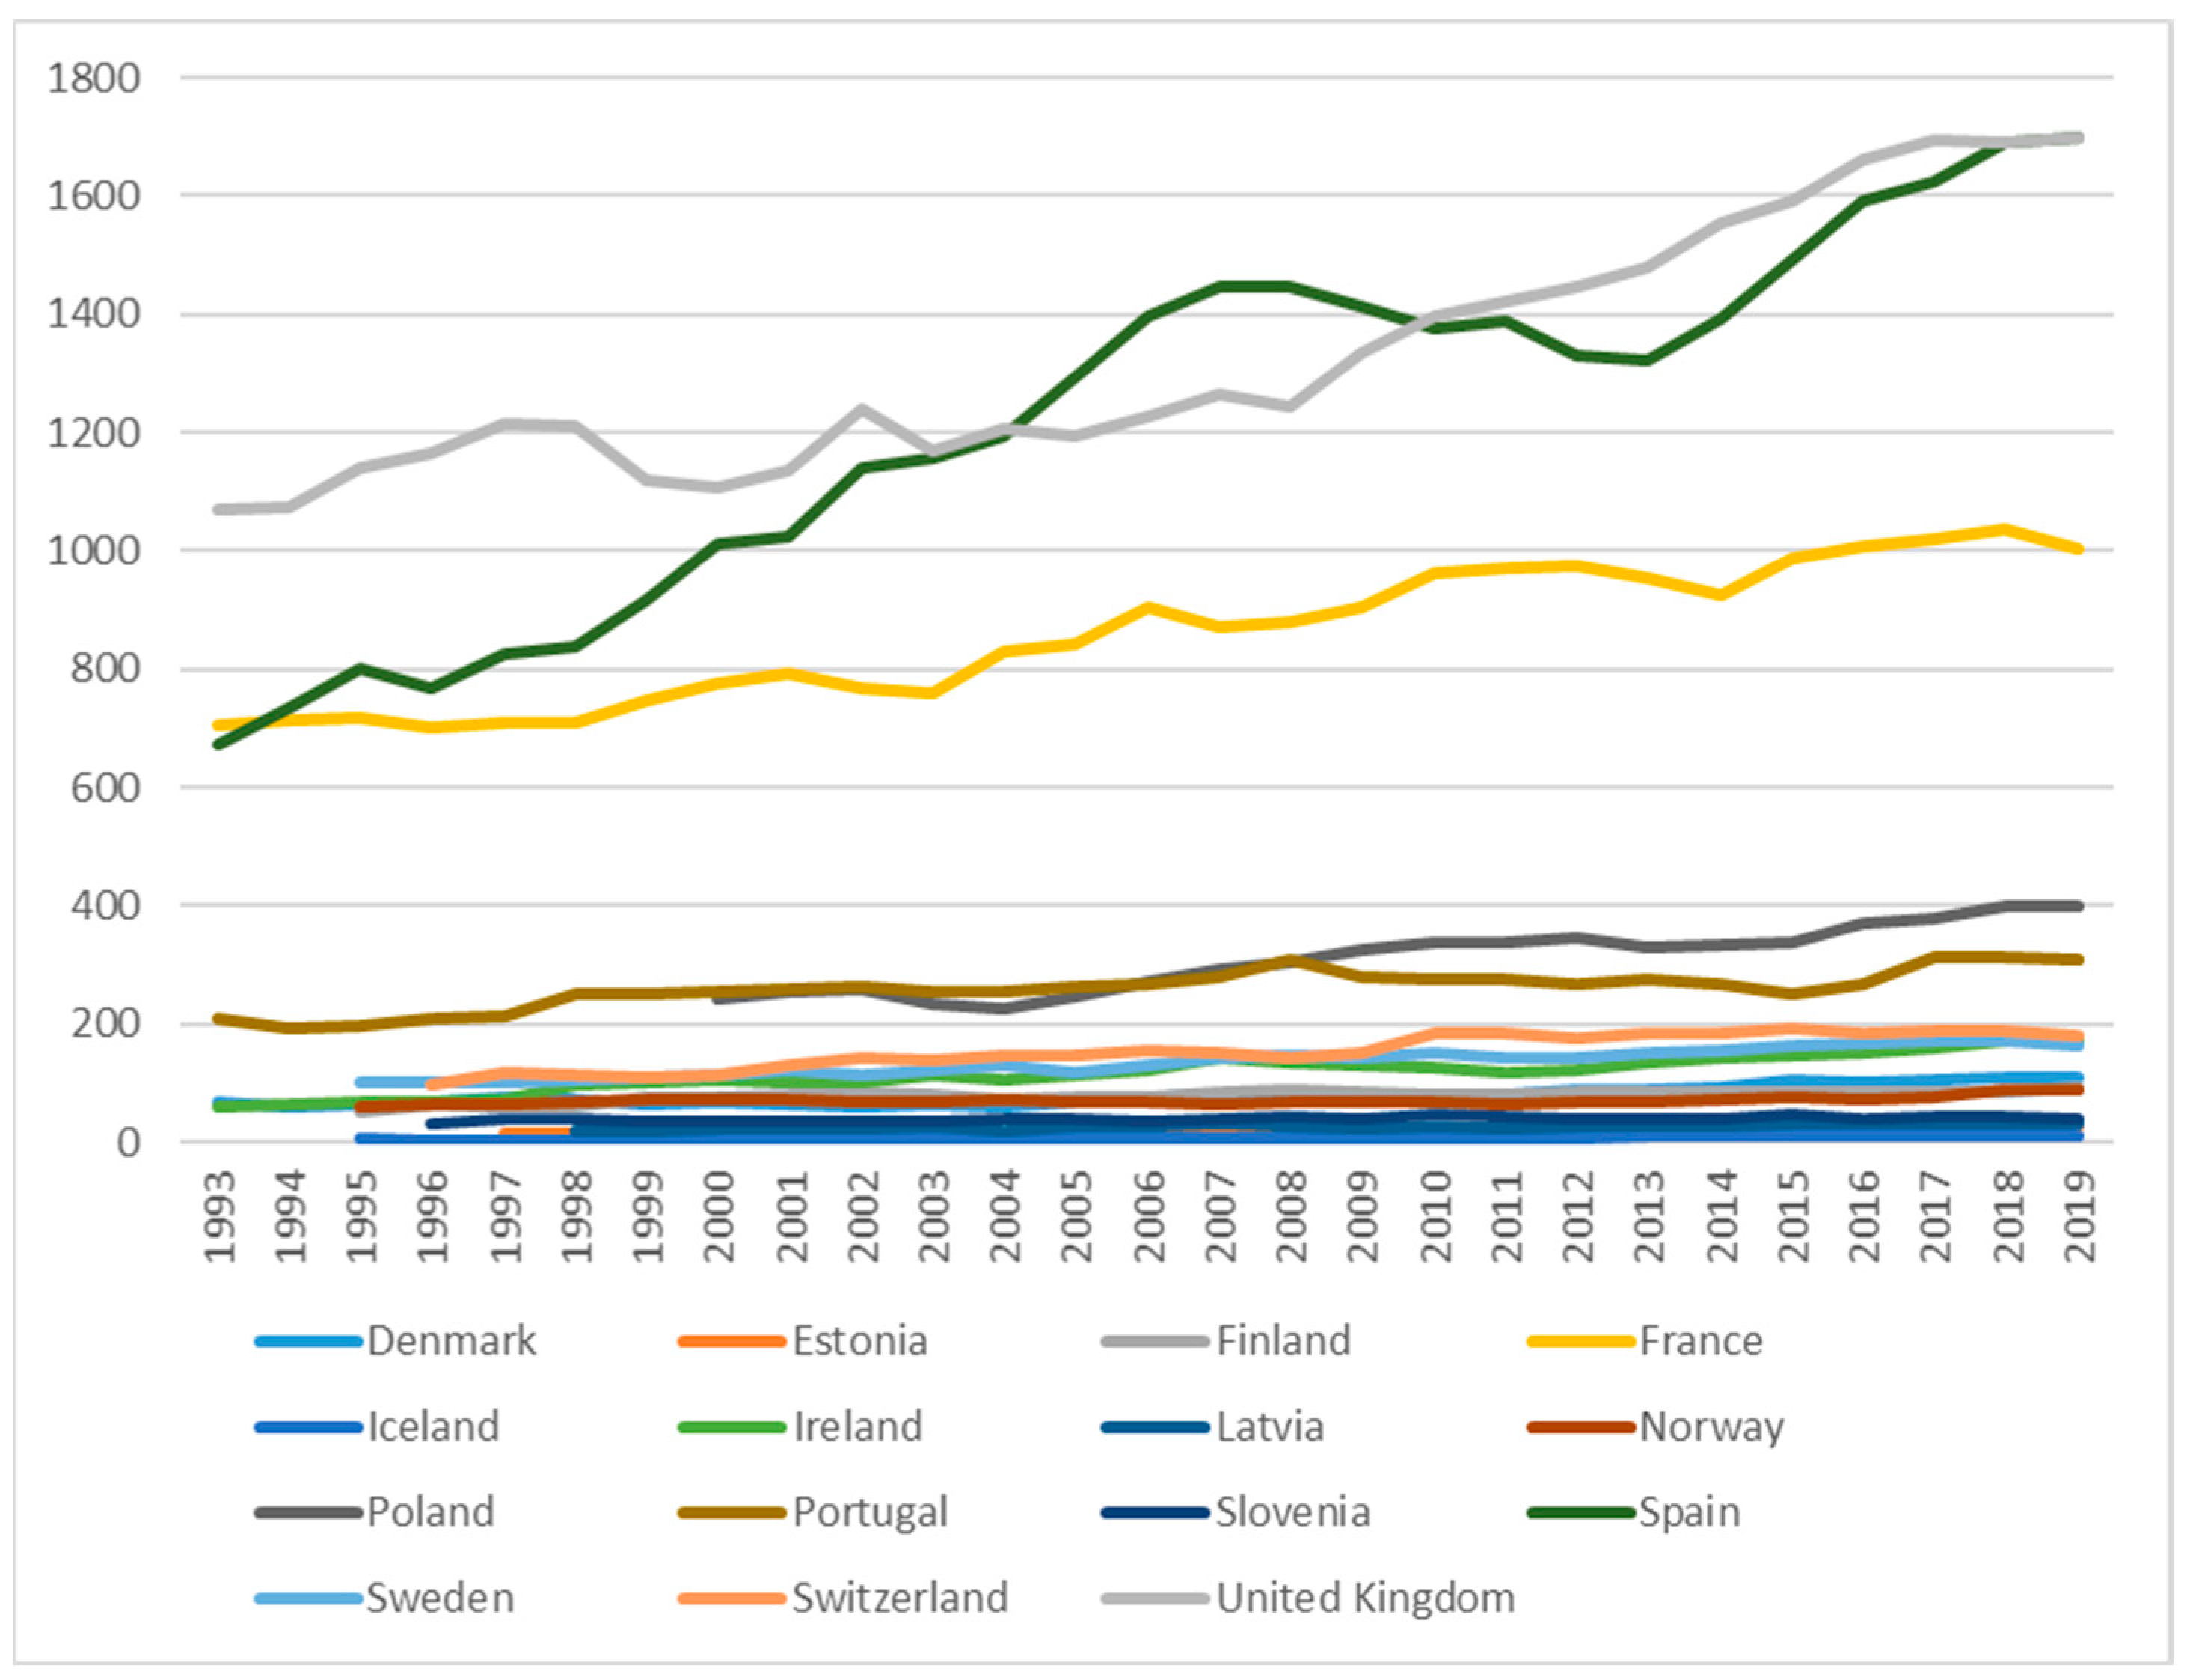
On the other hand, tourism employment data came from the Eurostat database. For the purpose of this research and the availability of data by economic activity, tourism employment focused on section accommodation and food service. The tourism employment variable is treated as a dependent variable of the panel data regression models (see Figure 2).
Based on the theoretical foundations, aside from the impact of carbon taxes (CARB_TAX) on tourism employment (TOUR_EMPL), other control variables were included to test the effect of carbon taxes, namely, the employment rate (EMPL_RATE), the share of informal economy (INF_ECO), the percentage of working age population with tertiary education (EDU_TERT) according to the International Standard Classification of Education, the long-term unemployment rate (LT_UN), the gross domestic product per capita (GDP_PC), international tourism arrivals (TOUR_ARR) and international tourism expenditures (TOUR_EXP). Detailed explanations of the variables included in the research and data sources are presented in Table 2.
The economic expectations for the parameters of the independent variables are as follows: as the carbon tax increases, tourism employment is expected to remain neutral/decrease/increase; therefore, the economic expectation is not clear: . As the employment rate increases, tourism employment is expected to increase; therefore, the economic expectation is positive: . As the informal economy increases, tourism employment is expected to decrease; therefore, the economic expectation is negative: . As tertiary education increases, tourism employment is expected to increase; therefore, the economic expectation is positive: . As long-term unemployment increases, tourism employment is expected to decrease; therefore, the economic expectation is negative: . As the gross domestic product per capita increases, tourism employment is expected to increase; therefore, the economic expectation is positive: . As tourism arrivals increase, tourism employment is expected to increase; therefore, the economic expectation is positive: . As tourism expenditures increase, tourism employment is expected to increase; therefore, the economic expectation is positive: . Descriptive statistics of the macroeconomic panel data variables included in the specification are presented in Table 3.
3.2. Methods
We applied the panel data approach to research whether carbon taxes affect tourism employment. We obtained a macroeconomic panel dataset, which contains both the cross-section dimension and the time series/period dimension, enabling a large number of data points, hence improving the efficiency of the econometric estimates. Our panel was unbalanced due to missing data. Specification of the regression function was as follows:
where Ψ and Π are vectors of the regression coefficients measuring the association of tourism employment (TOUR_EMPLit) with the explanatory variable (CARB_TAXit) and control variables (EMPL_RATEit, INF_ECOit, EDU_TERTit, LT_UNit, GDP_PCit, TOUR_ARRit, TOUR_EXPit), respectfully. Appropriateness of the fixed effects and random effects models were further considered. Baltagi (2001) argued that the fixed effects models have an appropriate specification when focusing on a specific set of cross-sectional units, while random effects models are more appropriate when n cross-sectional units are drawn from a large population. As we did not have a specific set of n cross-sectional units and the European countries were selected based on their implementation of the carbon tax, we found the random effects models to be adequate. All regressions included both country and year fixed effects. Inclusion of country fixed effects addressed the possibility of a significant difference across countries with a higher mean gross domestic product per capita, which might reflect those more likely to implement and increase the carbon tax. On the other hand, year fixed effects address common macroeconomic movements as European countries might follow common changes in carbon taxes that might have common economic influences as well as address special events (e.g., global economic and financial crisis). The inclusion of year fixed effects could reduce the standard errors (e.g., Metcalf and Stock 2020). To control the panel regression models for heteroscedasticity and autocorrelation, we applied robust standard errors. The functional relationship has the following form:
4. Results
In this section, we present the estimation results of the panel data regressions researching whether carbon taxes affect tourism employment (see Table 4).
The F-test for all models in Table 4 showed that the null hypothesis for all of the coefficients in the model that were jointly zero should be rejected (p-value = 0.000) for all models reported in Table 4. The estimation results of the panel data regression model for the total sample of the 15 European countries that implemented a carbon tax over the period 1990–2019 indicated a slight positive and significant association between the carbon tax and tourism employment, suggesting that a higher carbon tax increases tourism employment. This might be explained by the response of the tourism sector towards innovative sustainable production and consumption, which in turn generate new employment opportunities supported by policy measures to incentivise businesses and industry to shift from linear economy approaches towards a sustainable circular economy (Camilleri 2021; Azmi et al. 2023).
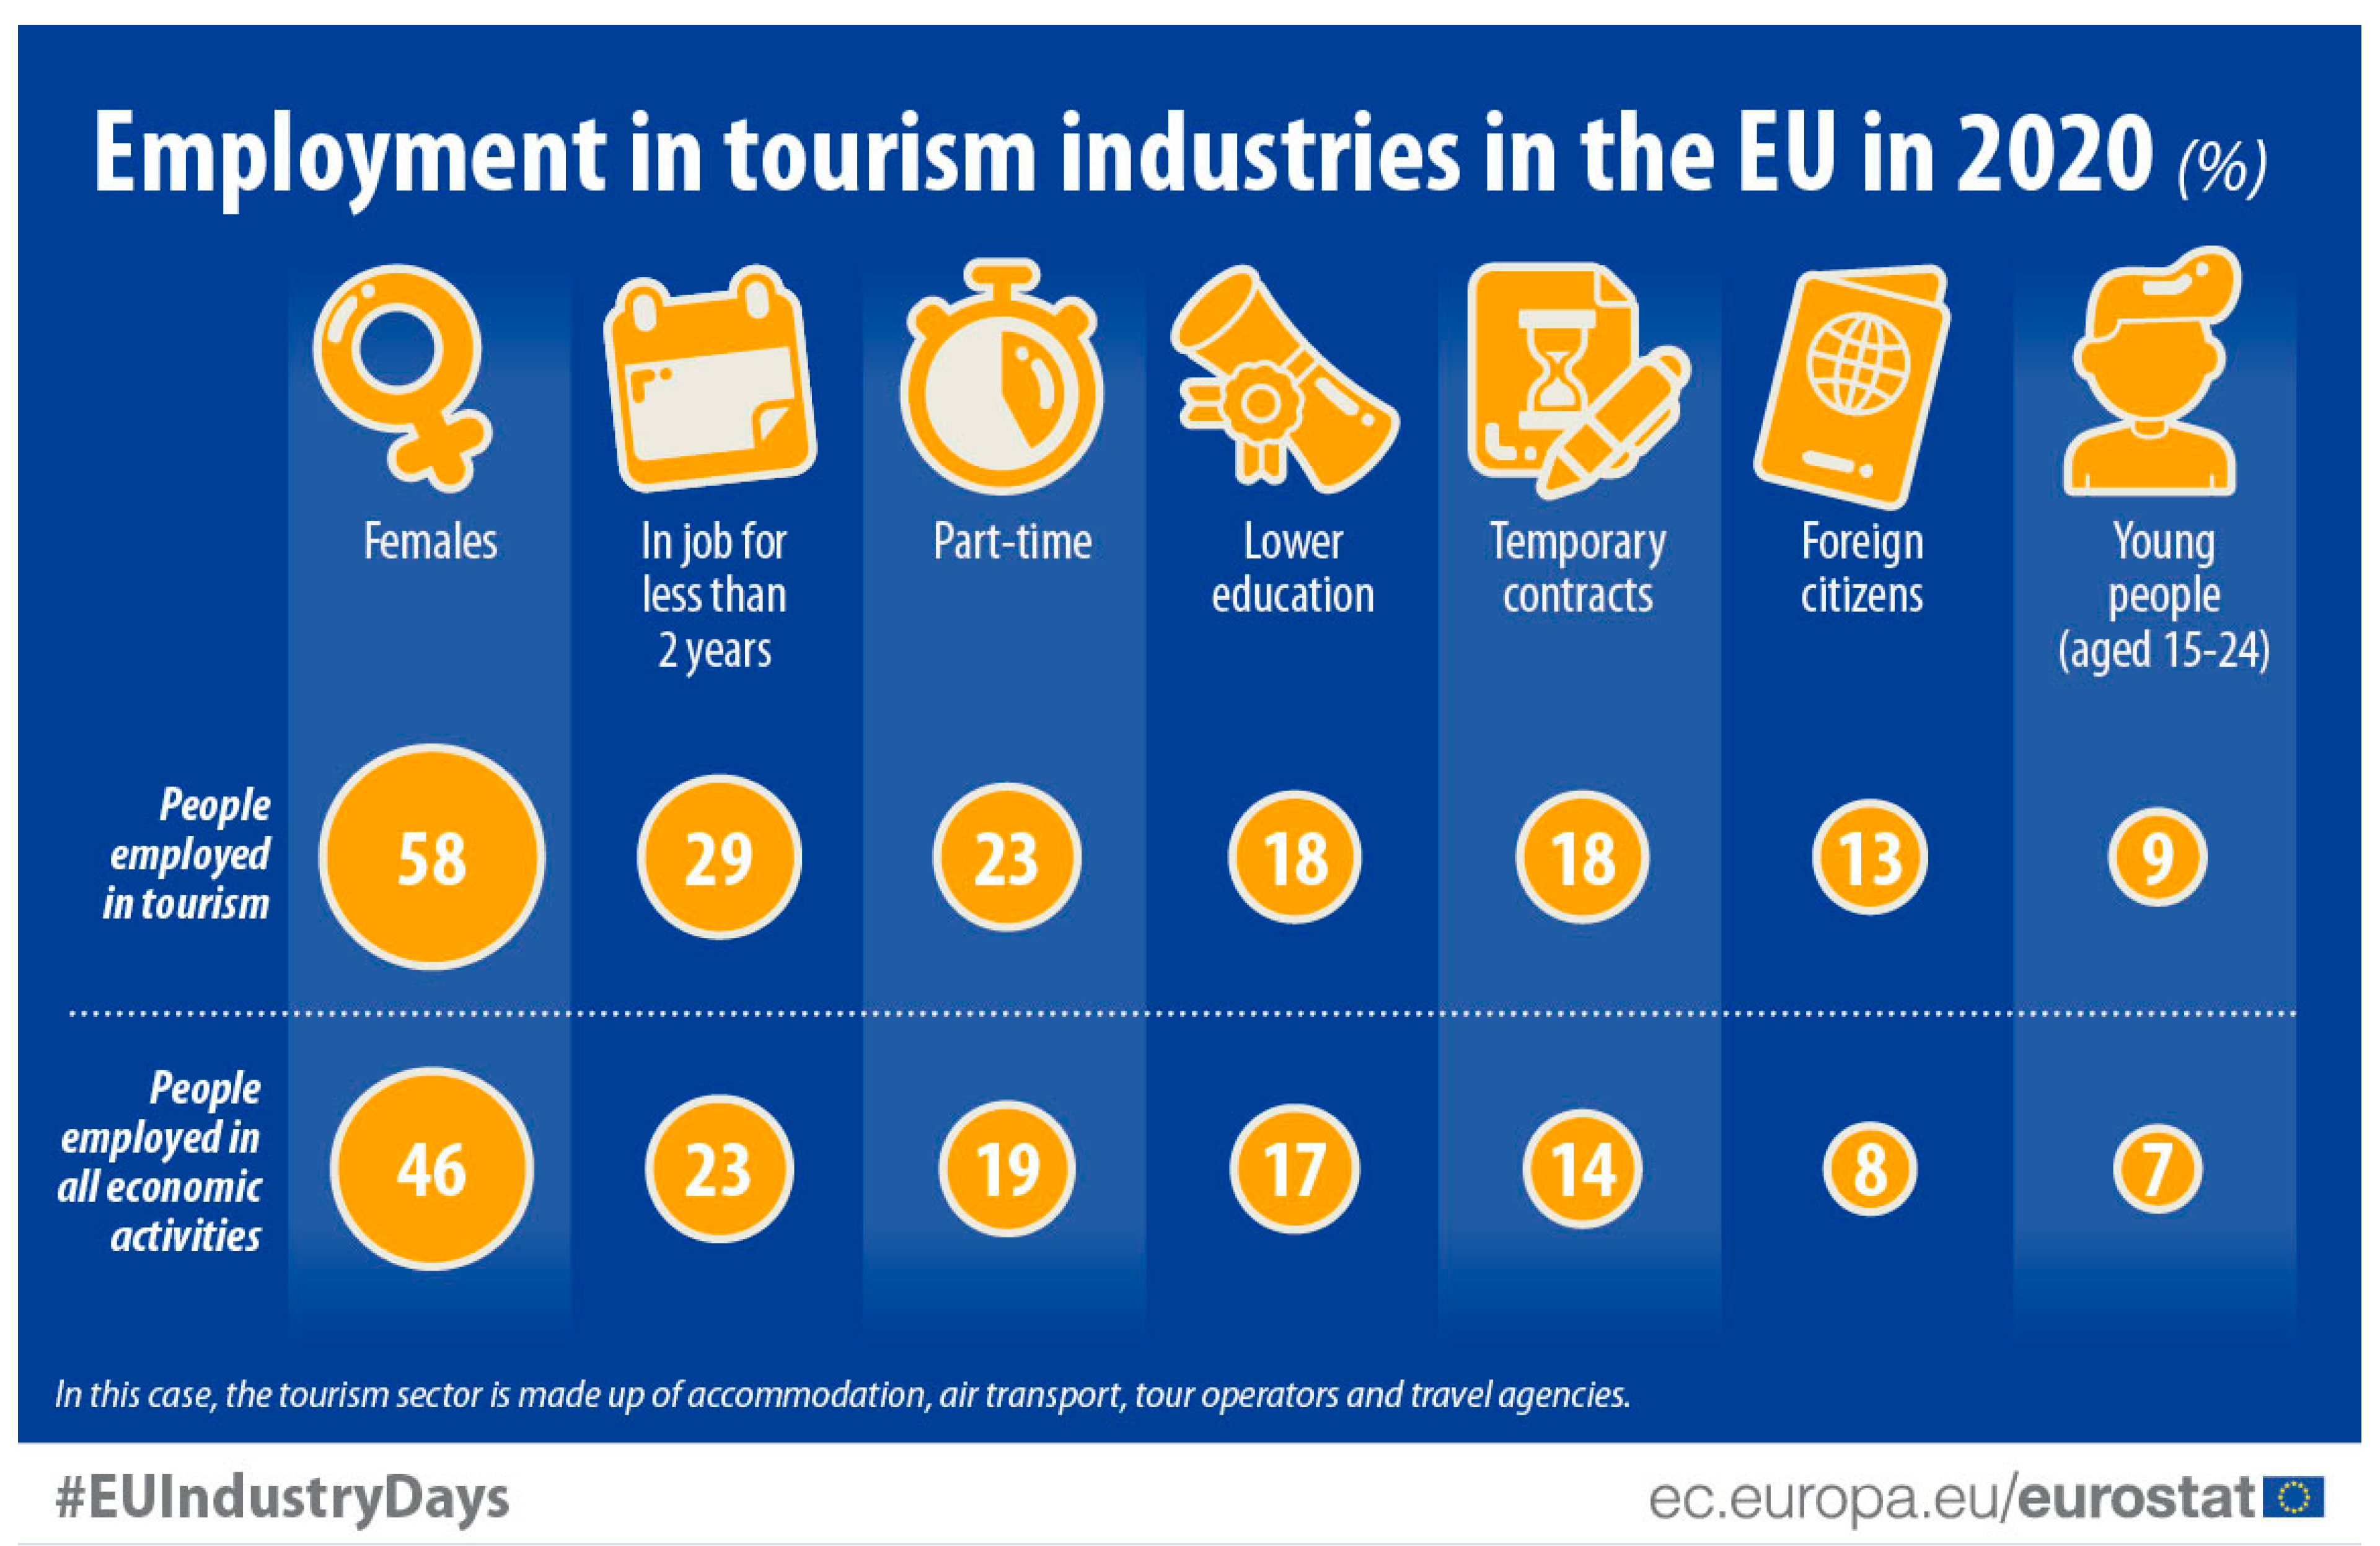
To control for a functioning and labour market situation in tourism employment, the employment rate, long-term unemployment rate, tourism arrivals and tourism expenditures were included in the model. The latter proved not to be significant, while the former proved to be significant, with a surprising negative sign in the employment rate. This might reflect higher flexibility in the tourism labour market with temporary contracts and a predominantly young labour force, which is more exposed to fluctuations. The data reported by Eurostat (see Figure 3) support this. Greater tourism arrivals indicate greater tourism employment, while a higher long-term unemployment rate indicates lower tourism employment. A tertiary educated labour force was significantly positively related to tourism employment. A surprisingly negative and significant effect was seen in the gross domestic product per capita, which might be associated with the confirmed presence of an informal economy in the tourism sector where labour market relations are not in favour of the employees nor the economy as a whole due to the non-transparent and not officially reported payment from tourism employers to their employees.
The finding of a slightly positive effect of carbon taxes on tourism employment is intriguing and raises the question of whether this positive effect may be due to the use of government revenues from a carbon tax in order to improve the overall efficiency of the tax system (so-called double dividend hypothesis). Furthermore, countries that were early adopters of a carbon tax might have a different response than countries with less experience with a carbon tax. Additionally, the impact might be larger in countries with a higher carbon tax compared to countries with a lower carbon tax. We performed a robustness check of whether any of these factors were drivers in the overall positive effect on tourism employment. We named these factors as follows: recycling, early adopters, and high carbon tax (see Table 4). The recycling factor considers the double dividend hypothesis from using revenues arising from carbon taxes to decrease more distortive taxes (e.g., labour tax). The information about revenue recycling intentions was collected from Metcalf and Stock (2020). Countries with revenue recycling intentions within our sample of European countries were Denmark, Portugal, Finland, Sweden, Norway, and Switzerland. The early adopter factor considered whether our results were driven by the Scandinavian countries who were the first to implement carbon taxes (Denmark in 1992, Finland in 1990, Norway in 1991 and Sweden in 1991). Finally, we checked the robustness of our results by the factor of high carbon tax, which included countries whose average carbon tax price rate over the period 1990–2019 was at least USD 30 per tonne of CO2 equivalent. Such countries were France, Finland, Sweden, Norway, and Switzerland. Within these factors, we constructed two additional samples: one sample being constructed as the total sample without a certain factor sample and the other sample as the sample including only the certain aforementioned factor sample. In such a manner, we additionally performed six panel data regression models with the results presented in Table 4. We can see that the results were somewhat similar across the different factors and models considered. When comparing these results with the total sample results, we found that dropping a certain factor sample (recycling, early adopters or high carbon tax) from the total sample increased the estimates, whereas comparing the total sample results with the results obtained by estimating a certain factor sample only lowered the estimation results and standard errors. Therefore, we cannot conclude that these factors matter for tourism employment, which prove the robustness of the results.
5. Discussion and Implications
The OECD (2017) argues that green growth policies can achieve job creation in a number of green economic sectors, which replace sectors that emit more GHG and through an economic transition toward more labour intensive service sectors, which tourism is as a service industry (International Finance Corporation 2017). In comparison to the overall labour market movements and given the extent of predictions, the rates of labour reallocation do not seem to be out of line with historical experience. According to the projections, the labour reallocation will be small, especially for medium- and high-skilled workers.
A successful transition towards green growth implies that the employment effects of green policies can create new opportunities for workers following the proper management and implementation of green policies as well as the functioning and preparedness of the labour market towards transition.
According to the International Finance Corporation (2017), tourism is often an innovator of sustainable production and consumption, which triggers the multiplier effect on local areas and creates new employment opportunities. Circular business models in the tourism sector seem to be necessary step forward in order to improve the environmental performance, and at the same time, gain cost savings and contribute to the creation of new jobs (Zorpas et al. 2021; Manniche et al. 2021; Zhang et al. 2022). In this perspective, new opportunities are seen, for example, in the sustainable preparation and consumption of food, forest bathing, fisheries-based ecotourism, and geotourism. At the European Union level, a new Green Deal Industrial Plan introduced by the European Commission (2023) sets the framework for a transition towards a green, sustainable and circular economy, and boosts investment into innovation and clean technology. Due to labour shortages and a lack of suitable skills considerable up-skilling and re-skilling of the workforce is required to meet the needs of the labour market.
Tourism has the potential to reach and benefit a large number of people. One such group is young people. According to the ILO (2022b), it is estimated that approximately 42 million young people are expected to enter the labour market by 2030. The tourism sector offers attractive opportunities to young people, taking into account travel, different cultures, and the use of language skills and as such also addresses sustainable economic growth, preventing youth unemployment. On the other hand, a study by WTTC (2019) revealed that the share of youth employment in tourism in the observed period decreased, especially in the Mediterranean countries, and was related to different unemployment rates and the contribution of tourism to GDP. The former implies that older workers compete with younger workers for jobs, while the latter implies lower shares of youth employment in tourism if the contribution of tourism to GDP is higher. This suggests that jobs in tourism might be seen as long-term careers with permanent contracts, crowding-out young workers who are generally subject to fluctuations and greater labour market flexibility, and are to a greater extent faced with informal economic practices.
To mitigate the transition risks for the labour force, supportive measures such as revenue recycling from environmental taxes, skills development and active labour market policies will be of critical importance to accompany the environmental policies. Denmark introduced such supportive measures within its ambitious green vision to become one of the most climate-friendly countries in the world, and is considered as a prototype for other countries (Batini et al. 2020).
Using government revenue from environmental tax reform to reduce labour taxes, mitigate undesirable distributional consequences, fund education and training programmes, and offer specifically targeted programmes for regions with a high share of employment in carbon intensive industries will improve the public acceptance of environmental taxes, leading to revenue-neutral carbon taxation. Furthermore, revenue neutrality minimizes the natural regressivity of carbon taxes, while lower payroll taxes can stimulate employment. This implication is of special importance for tourism, where informal economic practices are widespread, and consequently, the whole economy is losing output.
A pivotal element for a successful transition to a green economy is a skills policy. Environmentally sustainable behaviour and environmental awareness should be promoted at all levels of the education system. In order to meet the labour market needs and avoid potential skill mismatches, a regular assessment of the employment trends and the identification of specific skill needs is required, boosting cooperation between universities, training centres, local and national governments, and industry representatives. A smoother transition to a green economy would also enable sector specific training programmes such as training on waste management, organic farming, energy efficiency, ecotourism planning as well as the creation of scholarship programmes related to energy and a greener economy. In addition, employers should be encouraged to offer training by, in return, benefiting from lower social security contributions.
6. Conclusions
This paper explored the existing carbon pricing scheme, namely, the carbon tax, which is similar to excise taxes, is easy to collect and administrate, and provides price certainty. Tourism itself is the largest service industry in the world and is an important generator of jobs, which contributes to climate change and is also vulnerable to climate change. The effect of a carbon tax on tourism employment was examined in this paper using macroeconomic panel data for the European countries that, according to the World Bank Group Carbon Pricing Dashboard, have levied a carbon tax over the past thirty years. The variable of interest carbon tax is statistically significant and slightly positive, suggesting that higher carbon tax increases tourism employment. A robustness check was additionally performed whether the results were driven by the so-called double dividend hypothesis, the effect of early adopters of a carbon tax, and the effect of a higher carbon tax. None of these factors were proven to be of relevance for tourism employment, showing the robustness of the results. The findings of this research enable evidence-based policy decisions, encourage discussion on climate change mitigation measures with respect to tourism employment as well as increase the awareness that a just transition should be people-centred and inclusive.
Tourism faces a rebuilding process that provides opportunities to make tourism sustainable. This requires an integrated holistic approach to address environmental challenges and support a green transition in order to promote the creation of new jobs. Government revenues from the carbon tax can be recycled via reducing other more distortionary taxes such as labour taxes to fund education and training programs, mitigate undesirable distributional consequences, and lower payroll taxes, which in turn can stimulate employment. Revenue-neutral carbon taxation, policies to address the skills gap, push and pull incentives, active labour market policies to facilitate quick re-integration of jobseekers into employment are viewed as pivotal to ensure a smoother transition towards a sustainable tourism labour market. However, this research was limited by the timeframe and countries included as well as the availability of data at lower aggregate sectorial tourism levels. A more comprehensive dataset modelling the causal tax effect and inclusion of other key macroeconomic variables may be seen as a direction for future research.
Funding
This research received no external funding.
Data Availability Statement
The data is in the public domain, and the relevant sources are cited in the text.
Conflicts of Interest
The author declares no conflict of interest.
References
- Azmi, Ezwani, Rosniza Aznie Che Rose, Azahan Awang, and Azlan Abas. 2023. Innovative and Competitive: A Systematic Literature Review on New Tourism Destinations and Products for Tourism Supply. Sustainability 15: 1187. [Google Scholar] [CrossRef]
- Baltagi, Badi Hani. 2001. Econometric Analysis of Panel Data. Chichester: Wiley. [Google Scholar]
- Batini, Nicoletta, Ian Parry, and Philippe Wingender. 2020. Climate Mitigation Policy in Denmark: A Prototype for Other Countries. Washington, DC: International Monetary Fund. [Google Scholar]
- Camilleri, Mark Anthony. 2021. Sustainable Production and Consumption of Food. Mise-en-Place Circular Economy Policies and Waste Management Practices in Tourism Cities. Sustainability 13: 9986. [Google Scholar] [CrossRef]
- Chan, Sok-Gee, Zulkufly Ramly, and Mohd Zaini Abd Karim. 2019. Government Spending Efficiency on Economic Growth: Roles of Value-added Tax. Global Economic Review 46: 162–88. [Google Scholar] [CrossRef]
- Chateau, Jean, Ruben Bibas, and Elisa Lanzi. 2018. Impacts of Green Growth Policies on Labour Markets and Wage Income Distribution: A General Equilibrium Application to Climate and Energy Policies. OECD Environment Working Papers, No. 137. Paris: OECD Publishing. [Google Scholar] [CrossRef]
- Dwyer, Larry, Peter Forsyth, Ray Spurr, and Serajul Hoque. 2013. Economic Impacts of a Carbon Tax on the Australian Tourism Industry. Journal of Travel Research 52: 143–55. [Google Scholar] [CrossRef]
- Elgin, Ceyhun, M. Ayhan Kose, Franziska Ohnsorge, and Shu Yu. 2021. Understanding Informality. CERP Discussion Paper 16497. London: Centre for Economic Policy Research. [Google Scholar]
- EC (European Commission). 2023. A Green Deal Industrial Plan for the Net-Zero Age. Brussels: European Commission. [Google Scholar]
- Eurostat. 2022. Eurostat Database. Available online: https://ec.europa.eu/eurostat/web/main/data/database (accessed on 17 December 2022).
- Freire-González, Jaume. 2018. Environmental Taxation and the Double Dividend Hypothesis in CGE Modelling Literature: A Critical Review. Journal of Policy Modeling 40: 194–223. [Google Scholar] [CrossRef]
- Freire-González, Jaume, and Mun S. Ho. 2019. Carbon taxes and the double dividend hypothesis in a recursive-dynamic CGE model for Spain. Economic Systems Research 31: 267–84. [Google Scholar] [CrossRef] [Green Version]
- Gricar, Sergej, Stefan Bojnec, and Tea Baldigara. 2022. GHG Emissions and Economic Growth in the European Union, Norway, and Iceland: A Validated Time-Series Approach Based on a Small Number of Observations. Journal of Risk and Financial Management 15: 518. [Google Scholar] [CrossRef]
- Gurtu, Apoorva, Vidhisha Vyas, and Amulya Gurtu. 2022. Emissions Reduction Policies and Their Effects on Economy. Journal of Risk and Financial Management 15: 404. [Google Scholar] [CrossRef]
- Han, Heesup. 2021. Consumer behavior and environmental sustainability in tourism and hospitality: A review of theories, concepts, and latest research. Journal of Sustainable Tourism 29: 1021–42. [Google Scholar] [CrossRef]
- ILO (International Labour Organization). 2022a. The Future of Work in the Tourism Sector: Sustainable and Safe Recovery and Decent Work in the Context of the COVID-19 Pandemic. Report for the Technical Meeting on COVID-19 and Sustainable Recovery in the Tourism Sector. Geneva: ILO. [Google Scholar]
- ILO (International Labour Organization). 2022b. Global Employment Trends for Youth 2022. Investing in Transforming Futures for Young People. Geneva: ILO. [Google Scholar]
- International Finance Corporation. 2017. Twenty Reasons Sustainable Tourism Counts for Development. Tourism for Development Knowledge Series. Washington, DC: The World Bank. [Google Scholar]
- Köppl, Angela, and Margit Schratzenstaller. 2022. Carbon taxation: A review of the empirical literature. Journal of Economic Surveys, 1–36, Ahead-of_Print. [Google Scholar] [CrossRef]
- Kristjánsdóttir, Helga. 2021. Tax on tourism in Europe: Does higher value-added tax (VAT) impact tourism demand in Europe? Current Issues in Tourism 24: 738–41. [Google Scholar] [CrossRef]
- Lenzen, Manfred, Ya-Yen Sun, Futu Faturay, Yuan-Peng Ting, Arne Geschke, and Arunima Malik. 2018. The carbon footprint of global tourism. Nature Climate Change 8: 522–28. [Google Scholar] [CrossRef]
- Manniche, Jesper, Karin Topsoe Larsen, and Rikke Brandt Broegaard. 2021. The circular economy in tourism: Transition perspectives for business and research. Scandinavian Journal of Hospitality and Tourism 21: 247–64. [Google Scholar] [CrossRef]
- Meng, Samuel, and Tien Pham. 2017. The impact of the Australian carbon tax on the tourism industry. Tourism Economics 23: 506–22. [Google Scholar] [CrossRef]
- Meng, Samuel, Tien Pham, Larry Dwyer, and Bligh Grant. 2021. Carbon Price Impacts on the Chinese Tourism Industry. Journal of Travel Research 60: 370–83. [Google Scholar] [CrossRef]
- Metcalf, Gilbert E., and James H. Stock. 2020. The Macroeconomic Impact of Europe’s Carbon Taxes. NBER Working Paper 27488. Cambridge, MA: National Bureau of Economic Research. [Google Scholar]
- Moropoulou, Antonia, Kyriakos Lampropoulos, and Anastasia Vythoulka. 2021. The Riverside Roads of Culture as a Tool for the Development of Aitoloakarnania. Heritage 4: 3823–47. [Google Scholar] [CrossRef]
- Nepal, Rabindra, and Sanjay Kumar Nepal. 2021. Managing overtourism through economic taxation: Policy lessons from five countries. Tourism Geographies 23: 1094–115. [Google Scholar] [CrossRef]
- Nocca, Francesca, Martina Bosone, Pasquale De Toro, and Luigi Fusco Girard. 2023. Towards the Human Circular Tourism: Recommendations, Actions, and Multidimensional Indicators for the Tourist Category. Sustainability 15: 1845. [Google Scholar] [CrossRef]
- OECD (Organisation for Economic Cooperation and Development). 1999. Economic Instruments for Pollution Control and Natural Resources Management in OECD Countries. A Survey. Paris: OECD Publishing. [Google Scholar]
- OECD (Organisation for Economic Cooperation and Development). 2016. Reference Guide on Ex-Post Evaluation of Competition Agencies’ Enforcement Decisions. Paris: OECD Publishing. [Google Scholar]
- OECD (Organisation for Economic Cooperation and Development). 2017. Employment Implications of Green Growth: Linking Jobs, Growth, and Green Policies. Paris: OECD Publishing. [Google Scholar]
- Oklevik, Ove, Stefan Gössling, C. Michael Hall, Jens Kristian Steen Jacobsen, Ivar Petter Grøtte, and Scott McCabe. 2019. Overtourism, optimisation, and destination performance indicators: A case study of activities in Fjord Norway. Journal of Sustainable Tourism 27: 1804–24. [Google Scholar] [CrossRef] [Green Version]
- Sorin, Fabrice, and Uthayasankar Sivarajah. 2021. Exploring Circular economy in the hospitality industry: Empirical evidence from Scandinavian hotel operators. Scandinavian Journal of Hospitality and Tourism 21: 265–85. [Google Scholar] [CrossRef]
- UNWTO (United Nations World Tourism Organization). 2020. Global Guidelines to Restart Tourism. Madrid: UNWTO. [Google Scholar]
- WB (The World Bank). 2022a. Carbon Pricing Dashboard. Available online: https://carbonpricingdashboard.worldbank.org/ (accessed on 17 December 2022).
- WB (The World Bank). 2022b. World Development Indicators. Available online: https://databank.worldbank.org/source/world-development-indicators (accessed on 17 December 2022).
- WB (The World Bank). 2022c. National Accounts Data. Available online: https://data.worldbank.org/ (accessed on 17 December 2022).
- WTTC (World Travel and Tourism Council). 2019. Generating Jobs for Youth. London: WTTC. [Google Scholar]
- Zhang, Jiekuan. 2021. Impacts of the emissions policies on tourism: An important but neglected aspect of sustainable tourism. Journal of Hospitality and Tourism Management 47: 453–61. [Google Scholar] [CrossRef]
- Zhang, Jiekuan. 2022. Tourism economic dynamics under carbon intensity target policy. Journal of Environmental Planning and Management 65: 2145–71. [Google Scholar] [CrossRef]
- Zhang, Jiekuan, and Yan Zhang. 2020. Chinese tourism economic change under carbon tax scenarios. Current Issues in Tourism 23: 836–51. [Google Scholar] [CrossRef]
- Zhang, Jiekuan, and Yan Zhang. 2021. Tourism and low-carbon performance: An fsQCA approach. Asia Pacific Journal of Tourism Research 26: 626–39. [Google Scholar] [CrossRef]
- Zhang, Qingyu, Amandeep Dhir, and Puneet Kaur. 2022. Circular economy and the food sector: A systematic literature review. Sustainable Production and Consumption 32: 655–68. [Google Scholar] [CrossRef]
- Zorpas, Antonis A., Jose Navarro-Pedreño, Iraklis Panagiotakis, and Dimitris Dermatas. 2021. Steps forward to adopt a circular economy strategy by the tourism industry. Waste Management & Research 39: 889–91. [Google Scholar] [CrossRef]
Figure 1.
Time trend of the carbon tax price rates in the sample of European countries since their implementation.
Figure 1.
Time trend of the carbon tax price rates in the sample of European countries since their implementation.

Figure 2.
Time trend of tourism employment in the sample of European countries.

Figure 3.
Eurostat infographics on the EU tourism labour market in 2020. Source: Eurostat for EU Industry Days 2021. https://ec.europa.eu/eurostat/web/products-eurostat-news/-/edn-20220208-2, accessed on 9 January 2023.
Figure 3.
Eurostat infographics on the EU tourism labour market in 2020. Source: Eurostat for EU Industry Days 2021. https://ec.europa.eu/eurostat/web/products-eurostat-news/-/edn-20220208-2, accessed on 9 January 2023.


Table 1.
Summary information about the carbon taxes across the sample of European countries.
| Country | Year of Implementation | Carbon Tax Price Rate in 2022 (USD/tCO2e) | Carbon Tax Revenue in 2021 (Millions USD) | Revenue Recycling | Average Carbon Tax Price Rate in the Period 1990–2019 (USD/tCO2e) | Share of Global GHG Emissions Covered in 2022 | Share of Jurisdiction’s GHG Emissions in 2022 |
|---|---|---|---|---|---|---|---|
| Denmark | 1992 | 26.62 | 467.83 | Yes | 20.67 | 0.03% | 35.00% |
| Estonia | 2000 | 2.21 | 1.89 | No | 1.79 | 0.00% | 5.61% |
| Finland | 1990 | 85.10 | 1547.28 | Yes | 32.03 | 0.05% | 36.00% |
| France | 2014 | 49.29 | 8399.52 | No | 31.87 | 0.31% | 35.00% |
| Iceland | 2010 | 34.25 | 48.10 | No | 20.13 | 0.01% | 55.00% |
| Ireland | 2010 | 45.31 | 541.55 | No | 22.94 | 0.05% | 40.00% |
| Latvia | 2004 | 16.58 | 6.69 | No | 2.36 | 0.00% | 3.00% |
| Norway | 1991 | 87.61 | 1715.89 | Yes | 55.26 | 0.09% | 63.00% |
| Poland | 1990 | 0.08 | 1.15 | No | 0.07 | 0.03% | 3.75% |
| Portugal | 2015 | 26.44 | 331.12 | Yes | 8.76 | 0.05% | 36.00% |
| Slovenia | 1996 | 19.12 | 145.19 | No | 16.30 | 0.02% | 51.93% |
| Spain | 2014 | 16.58 | 77.36 | No | 22.68 | 0.01% | 1.87% |
| Sweden | 1991 | 129.89 | 2267.03 | No | 100.85 | 0.05% | 40.00% |
| Switzerland | 2008 | 129.86 | 1261.77 | Yes | 57.03 | 0.03% | 33.00% |
| UK | 2013 | 23.65 | 689.90 | No | 20.95 | 0.19% | 21.00% |
Source: (The World Bank 2022a).
Table 2.
Variable description and data source.
| Variable Name | Variable Description | Data Source |
|---|---|---|
| TOUR_EMPL | Employed persons aged 15 to 64 in the tourism sector focused on section accommodation and food service activities of the statistical classification of economic activities in the European Community (NACE Rev. 1.1, Rev. 2) in thousands. | Eurostat (2022) [lfsa_egana], [lfsa_egan2] |
| CARB_TAX | Explicit tax that is directly associated with the level of CO2 emissions from fossil fuel combustion expressed as a specific price in USD per tonne of CO2 equivalent. | The World Bank (2022a) Carbon Pricing Dashboard |
| EMPL_RATE | Employment rate of persons aged 15 to 64 as a percentage of the total population in the same age group. | Eurostat (2022) [lfsa_ergan] |
| INF_ECO | Multiple indicators multiple causes model-based (MIMIC) estimates of the informal output (% of official GDP). | Elgin et al. (2021) |
| EDU_TERT | The percentage of working-age population aged 15 to 64 with tertiary education (levels 5–8) who are in the labour force. | Eurostat (2022) [edat_lfse] |
| LT_UN | Long-term unemployment rate of the population aged 15 to 74 as a percentage of population in the labour force. | Eurostat (2022) [une_ltu_a] |
| GDP_PC | Gross domestic product per capita in current prices in USD and the current PPPs. | The World Bank (2022c) National accounts data |
| TOUR_ARR | International tourism arrivals are the number of tourists who travel to a country other than that in which they usually reside, and outside their usual environment, for a period not exceeding 12 months and whose main purpose in visiting is other than an activity remunerated from within the country visited. Data are in millions. | The World Bank (2022b) World Development Indicators |
| TOUR_EXP | International tourism expenditures of international outbound visitors in other countries including payments to foreign carriers for international transport. Data are in current USD in millions. | The World Bank (2022b) World Development Indicators |
Source: Authors’ compilation.
Table 3.
Descriptive statistics.
| Variable Name | Obs. | Mean | Std. dev. | Min | Max |
|---|---|---|---|---|---|
| TOUR_EMPL | 375 | 329.349 | 453.065 | 3.8 | 1700.5 |
| CARB_TAX | 260 | 31.2358 | 36.5365 | 0.0362 | 168.8257 |
| EMPL_RATE | 366 | 68.7666 | 7.7403 | 46.8 | 87.1 |
| INF_ECO | 390 | 20.2966 | 6.1499 | 8.0653 | 34.2334 |
| EDU_TERT | 375 | 24.9488 | 7.7576 | 7.000 | 40.7 |
| LT_UN | 282 | 3.1797 | 2.6353 | 0.3 | 13.0 |
| GDP_PC | 437 | 30,992.16 | 14,955.77 | 5517.944 | 89,846.27 |
| TOUR_ARR | 355 | 28.3669 | 47.4520 | 0.211 | 217.877 |
| TOUR_EXP | 286 | 9490.563 | 12,010.84 | 62 | 59,751 |
Source: Authors’ calculations.
Table 4.
Estimation results.
| Dependent Variable: TOUR_EMPL | |||||||
|---|---|---|---|---|---|---|---|
| Sample | Total Sample | Recycling | Early Adopters | High Carbon Tax | |||
| Variable Name | Total | Total—without | Only Recycling | Total—without | Only Early Adopters | Total—without | Only High Carbon Tax |
| CARB_TAX | 0.2138 ** (0.0903) | 1.9707 *** (0.4403) | 0.1667 *** (0.0607) | 0.4899 * (0.2628) | 0.1840 ** (0.0588) | 0.5377 (0.8161) | 0.3216 ** (0.1382) |
| EMPL_RATE | −6.8935 *** (1.1578) | 0.7988 (2.9009) | −7.1975 *** (1.4181) | −3.4967 (2.8931) | −5.4832 *** (1.2793) | −2.3778 (1.7749) | −14.5105 ** (4.4328) |
| INF_ECO | −16.2410 *** (4.0227) | 5.2562 (7.3194) | −20.0139 *** (4.4524) | −5.4141 (7.4516) | −15.1118 *** (4.0535) | −9.3907 * (5.4705) | −35.0053 ** (14.8609) |
| EDU_TERT | 2.5923 *** (0.9362) | 9.2353 *** (2.1338) | 0.5504 (1.0316) | 6.0355 ** (2.2185) | 1.5966 * (0.8603) | 2.7846 ** (1.1040) | 0.5072 (2.5623) |
| LT_UN | −13.9833 *** (1.5541) | −14.2887 *** (2.9524) | −15.5476 *** (3.2220) | −16.2140 *** (3.1112) | −2.1865 (4.2218) | −8.1114 ** (3.1010) | −35.0938 ** (16.2792) |
| GDP_PC | −0.0011 *** (0.0003) | −0.0011 ** (0.0005) | −0.0016 ** (0.0005) | −0.0015 ** (0.0005) | −0.0007 (0.0005) | −0.0004 (0.0005) | −0.0004 (0.0011) |
| TOUR_ARR | 0.6924 ** (0.3361) | 0.0735 (0.4543) | 1.4963 (0.9546) | 0.1983 (0.4931) | 2.3777 ** (0.8682) | 0.3838 (0.3740) | −0.0840 (3.7998) |
| TOUR_EXP | −0.0001 (0.0007) | −0.0028 * (0.0014) | 0.0008 (0.0007) | −0.0023 (0.0015) | −0.0007 (0.00007) | 0.0087 ** (0.0029) | −0.0009 (0.0023) |
| Obs | 144 | 68 | 76 | 81 | 63 | 83 | 61 |
| R2 | 0.996 | 0.998 | 0.993 | 0.997 | 0.974 | 0.993 | 0.999 |
Notes: *** Significance level at 1%, ** Significance level at 5%, * Significance level at 10%. Robust standard errors in parentheses. Source: Authors’ calculations.
Disclaimer/Publisher’s Note: The statements, opinions and data contained in all publications are solely those of the individual author(s) and contributor(s) and not of MDPI and/or the editor(s). MDPI and/or the editor(s) disclaim responsibility for any injury to people or property resulting from any ideas, methods, instructions or products referred to in the content. |
© 2023 by the author. Licensee MDPI, Basel, Switzerland. This article is an open access article distributed under the terms and conditions of the Creative Commons Attribution (CC BY) license (https://creativecommons.org/licenses/by/4.0/).
Share and Cite
MDPI and ACS Style
Rotar, L.J. Carbon Tax and Tourism Employment: Is There An Interplay? J. Risk Financial Manag. 2023, 16, 193. https://doi.org/10.3390/jrfm16030193
AMA Style
Rotar LJ. Carbon Tax and Tourism Employment: Is There An Interplay? Journal of Risk and Financial Management. 2023; 16(3):193. https://doi.org/10.3390/jrfm16030193
Chicago/Turabian StyleRotar, Laura Juznik. 2023. "Carbon Tax and Tourism Employment: Is There An Interplay?" Journal of Risk and Financial Management 16, no. 3: 193. https://doi.org/10.3390/jrfm16030193