1. Introduction
The growing global concern for climate change has resulted in a dynamic shift of investors’ sentiments towards environmentally friendly types of investments. This is explained by the significant growth in green markets within their short lifespan. Green investments are mainly financial avenues used to mobilise and channel funds towards those investments, which directly or indirectly benefit the environment and protect the climate, thus, they are a go-to type of investment by ethical investors (
Arif et al. 2021;
Hung 2021a,
2021b). The growth in this market is further accounted for by the need for investors to diversify their portfolio to minimise risks while maximising returns (
Tiwari et al. 2020;
Arif et al. 2021;
Hung 2021b;
Ferrer et al. 2021).
The findings of the study are beneficial to diverse stakeholders in financial markets, particularly to the investors and portfolio managers. It will aid them in making informed decisions regarding diversification and optimization of portfolio structure and risk hedging effectiveness. Findings of this research also reflect some guidelines for policymakers for managing financial market instability during the period of economic downturn. The contributions of this study can be observed from the following. First, it is shown from the literature review that past studies have explained the connectedness between green bonds and other financial markets using varied methods like Wavelets, Copulas, the vector auto-regression (VAR) model of
Diebold and Yilmaz (
2012,
2014) and their combinations. However, these methods fail to capture the higher and lesser tails.
This study describes the conditional connectedness among green bonds and other financial markets, namely the S&P US 10-Year Treasury Bond Index, S&P US Aggregate Bond Index, S&P 500 Bond Index, S&P 500 Financial Index, S&P 500 Energy Index and S&P 500 Composite for the period spanning from 9 March 2018 to 10 March using QVAR within the framework of
Ando et al. (
2018). The significance of this approach is on its ability to remove cross-sectional correlation of the residual, thus allowing for equation-by-equation estimation while utilizing existing quantile regression. The rationale behind using QVAR is that it captures the spillover effects and its direction during the switching between bearish and bullish market trends. Furthermore, we have also employed the Total Spillover Index (TSI) to measure the magnitude of spillover in the mean and medium as well as the upper and lower tails.
Moreover, we also provided estimates of portfolio weights to analyze portfolio diversification and hedging effectiveness useful for decision making by various participants in the financial markets. The results reveal that connectedness of green bonds with other financial market increased immensely during the period of the COVID-19 pandemic. Moreover, the connectedness is high at medium as compared to tails. The connectedness of green bonds with the composite index and energy index was found to be weak.
The presentation of the study is as follows: the review of literature is presented next, followed by the study methodology. Findings are presented followed by a discussion of the findings. The conclusion and policy recommendations provide the ending of the study.
2. Literature Review
A wide range of literature on the relationship between different markets around the world exist. For example, in the study of
Chatziantoniou et al. (
2021), the investigation was on the relationship between 1-year interest rate swaps and the US Dollar, Japanese Yen and Great Britain Pound. The study accounted for international financial markets connectedness only during an event of substantial changes in the interest rate. Using the quantile connectedness approach and daily price from the seven leading cryptocurrencies from 8 August 2015 to 31 December 2020,
Bouri et al. (
2021) showed a higher connectedness in both the right and left tails and accounted for the strengthening in the interconnectedness between the cryptocurrencies during both positive and negative market shocks. On the other hand, while examining the connectedness between the energy and non-energy commodity markets,
Khalfaoui et al. (
2021) observed a low significance dependence between the two markets.
Furthermore, the emergence of the green market in 2007 has resulted in emerging literature related to its connectedness with some other investments in the market. It includes the study of
Hung (
2021b), who explored the time-varying interdependence between green bonds and other conventional assets, such as the Standard and Poor (S&P) 500, Clean Energy Index, Goldman Sachs Commodity Index and Commodity Index and 10-year US bond. A relatively low dependence between the market was observed thus revealing the transmitters and receivers of innovation return in the market. Using the spillover model developed by
Diebold and Yilmaz (
2012),
Arif et al. (
2021) explores the dynamic connectedness between the conventional and green type of equity, fixed income and energy investments and observed pronounced connectedness in these markets during the short run and it was observed to be affected by the changes in global events.
Similarly, mixed results are observed when examining the causal association between green bonds and other conventional assets such as commodities, financial assets and environmental assets in the studies of
Hung (
2021a),
Lee et al. (
2021),
Liu et al. (
2021),
Hammoudeh et al. (
2020),
Park et al. (
2020),
Tolliver et al. (
2020),
Reboredo and Ugolini (
2020),
Nguyen et al. (
2020) and
Reboredo (
2018). In the study by
Hung (
2021a), a bidirectional relationship between green bonds and the S&P 500 and the Bitcoin market while a unidirectional one with the price of CO
2 emission allowance was observed. A bidirectional causal relationship between green bonds and the oil process was also observed by
Lee et al. (
2021).
Liu et al. (
2021) and
Park et al. (
2020) found a dynamic positive average and tail dependence between green bonds, clean energy and the stock market. In the studies by
Hammoudeh et al. (
2020) and
Reboredo and Ugolini (
2020), a causal relationship between green bonds and the 10-year Treasury bond index was observed.
A weak relationship between the green bond market coupled with both corporate and treasury bonds with the stock and energy commodity markets was observed by
Reboredo (
2018). On the other hand, the study by
Ferrer et al. (
2021) observed a strong interconnectedness between green bonds, treasury and corporate bonds; however, a shorter time horizon interconnectedness between the global green bond market and conventional financial and energy markets was observed. In examining the frequency of interconnectedness and cross-quantile dependence between green bonds and green equity markets,
Pham (
2021) observed a varying connection during the short-term, medium-term and long-term investment horizons.
In some studies, a time-varying relationship was observed where a strong interconnectedness was observed during the short-run and weak-to-no relationship during the long run, leading to an impending debate on the ability of the relationship to strive during extreme market conditions. Studies such as that of
Bouri et al. (
2020),
Chatziantoniou et al. (
2020),
Yahya et al. (
2020) and
Saeed et al. (
2020) have supported these claims. In the study by
Bouri et al. (
2020), the interconnectedness across various assets including gold, crude oil, bonds, currencies and world equities during the COVID-19 pandemic showed a dramatic structure and pattern change. Their findings are supported by that of
Adekoya and Oliyide (
2020), who observed a strong interference by infectious diseases based on equity market volatility and the growth rate of US COVID-19 reported cases on the connectedness across different markets. Similarly,
Chatziantoniou et al. (
2020) observed connectedness in international financial markets during tranquil times is subdued to the minimum level or even negligible values as in the case of the interconnectedness between G7 currencies and the US Dollar. In analysing the conditional dependence between non-ferrous and clean metals,
Yahya et al. (
2020) observed an asymmetric and time-varying dependence, which significantly increased with an increase in lags and an increased during bearish market conditions. Furthermore,
Saeed et al. (
2020) showed that return connectedness between clean energy stocks, green bonds, Energy ETF and crude oils markets vary during the period of extreme positive and negative returns, reflecting the asymmetric properties.
The most recent studies have applied the vector autoregressive model (VAR model) to measure the directional spillover effect between green bonds and other financial markets. It categories the connectedness of the number of frequency bands. For instance,
Reboredo and Ugolini (
2020) explored the interdependency structure between green bonds and other financial assets, namely conventional bonds, stocks and the currency market from October 2014 to June 2019 using the VAR model. Similarly,
Reboredo and Ugolini (
2020), applied VAR and found that the green bonds market had emerged as a net transmitted of shocks to other financial markets. Later,
Ferrer et al. (
2021) applied an analysis of the data collected for the period starting from October 2014 to December 2019.
The aforementioned literature explains the significance of green bonds, their hedging properties and connectedness with other financial markets. However, our paper is different from previous papers in two ways. Firstly, to the best of our knowledge, until now, no study has explained the connectedness between green bonds and other financial markets using quantile vector autoregression (QVAR). Furthermore, we include a significantly higher number of indices in financial markets. We have also pinnacled the hedging and diversification properties of green bonds.
3. Methodology
Referring to the operations in
Ando et al. (
2018), we implement the quantile-based time-varying connectedness framework to investigate the quantile transmission mechanism among green bond stocks and financial market indices. Suppose that we have an infinite moving-average represented QVAR (
p) as:
Here, the quantile is
. Following the usual specification of
Koop et al. (
1996) and
Pesaran and Shin (
1998), we define the
-step-ahead generalized forecast error variance decomposition (GFEVD) as one variable attributable to shocks of others, which can be specified as:
Here, the spillover of the
jth variable to the variance of the forecast error of the variable
i at horizon
H is described by
. The variance matrix of the vector of errors is denoted by Σ, the
jth diagonal element of the Σ matrix is denoted by
σjj and
ei reflects a vector value of 1 for the
ith element and 0 otherwise. Finally, the decomposition matrix of each variance entry is given as follows
Here, we follow
Diebold and Yilmaz (
2012,
2014) to measure the connectedness of variables at the
τth quantile. The formula to measure the connectedness among the variables is estimated using the generalized quantile forecast error variance decomposition (GFEVD). Hence, the total connectedness index (TCI) at quantile
τ is expressed as
The TO
j,t directional connectedness is the movement of index
i from all other indexes at quantile
τ, given as
The
FROMj,t directional connectedness is the movement from index
i to all other indexes at quantile
τ, represented as
Thus, NET connectedness is the sum of Equations (5) and (6), given as
In addition, the total connectedness at quantile
τ is stated as:
Here, is the total impact that a shock in variable has on all other variables; denotes the total impact of all others in the system on variable ; and represents the difference between and . A positive value indicates a net transmitter of shocks to the system, while a negative value suggests a net receiver from other markets in the system. Finally, signifies the total connectedness index.
5. Empirical Discussion
The summary statistics for the daily returns for eight asset classes including statistics related to Jarque-Bera (JB) are given in
Table 2. All mean returns are positive, with the S&P 500 composite scoring the highest mean returns, while green bonds have the lowest mean returns. According to the standard deviations, the most risky S&P 500 composite is staggering, while the least risky is green bonds. The values for kurtosis and skewness are positive, except for the S&P 500 energy index. Returns are distributed normally as shown by the Jarque-Bera (JB) test.
In addition, the price levels and returns of the markets examined are shown in
Figure 1. Prices in all markets plunged at the beginning of 2020 as a result of the financial stress due to outbreak of the Coronavirus pandemic. Among the various financial performance indexes, the price fall in the S&P U.S. treasury bond index, S&P US treasury bond current 10Y index and S&P US aggregate bond index is less as compared to other indices. During late 2020, the market experienced an upward trend. The log return shows a tandem movement during the pre-COVID-19 period. During COVID-19, high volatility was noted for all financial markets.
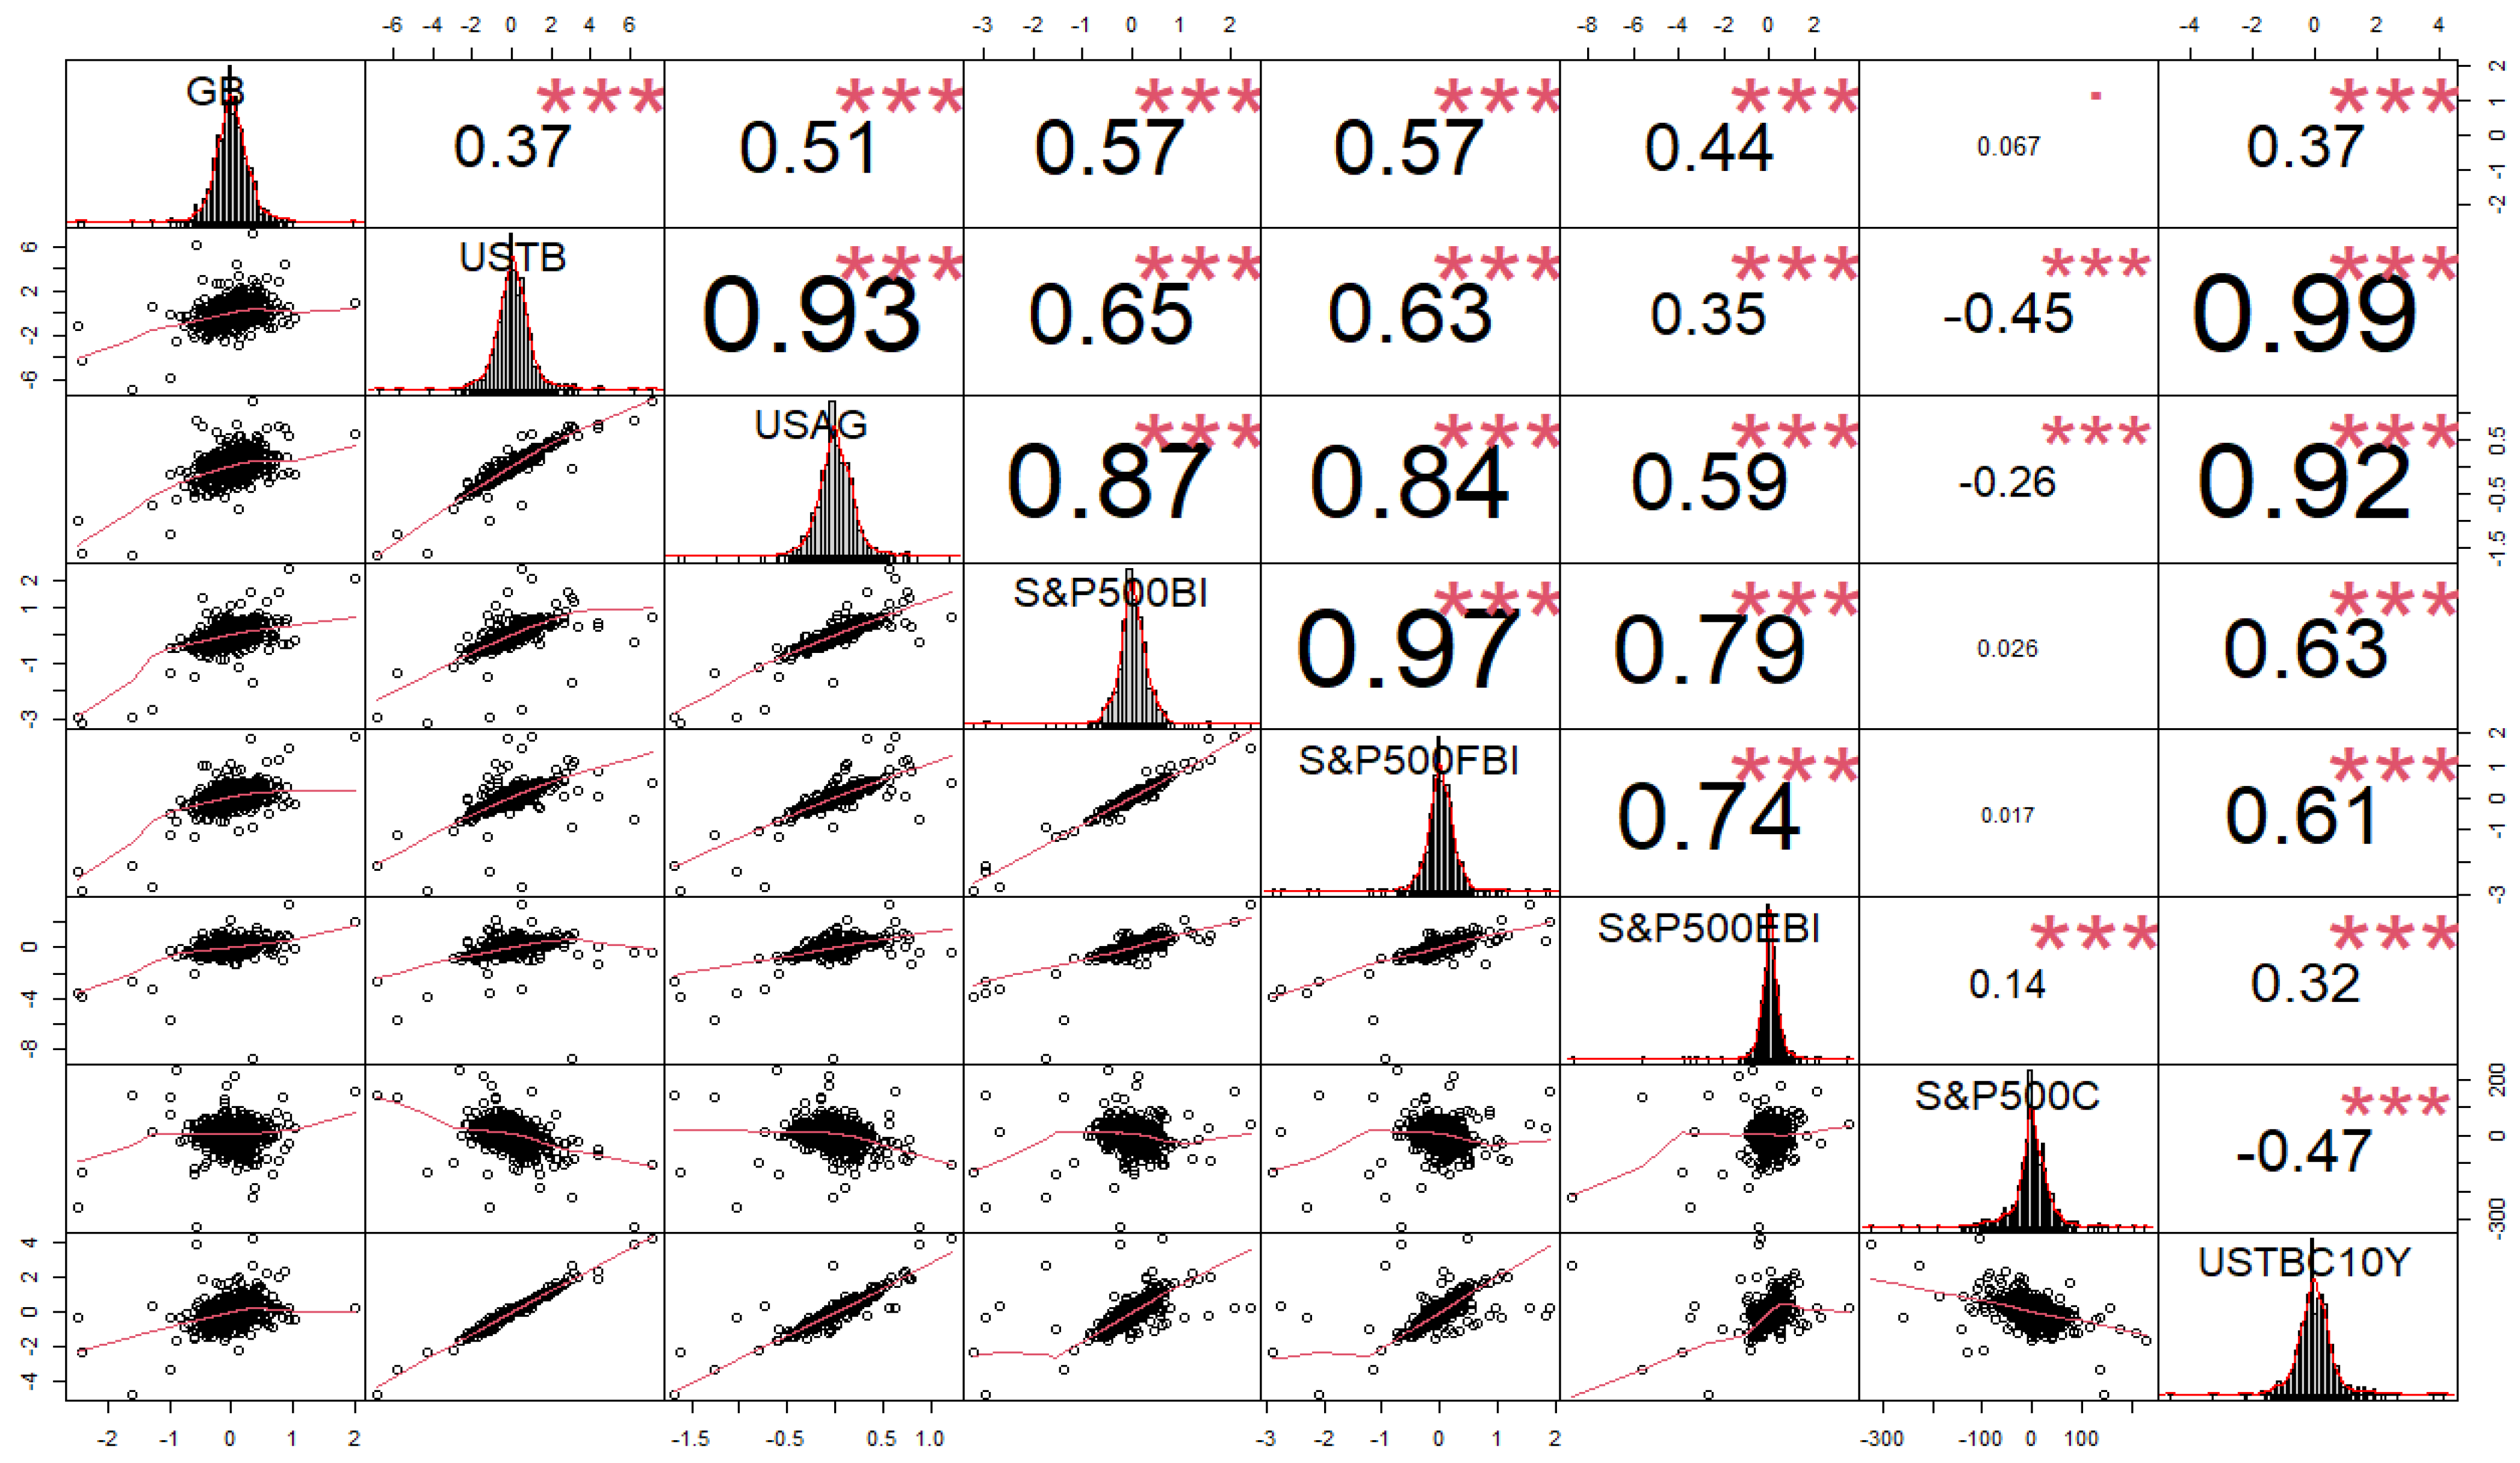
Figure 2 denotes the pairwise correlation coefficient with results showing that green bonds are more strongly correlated with the S&P 500 composite index, while it is weakly correlated with the S&P 500 US treasury bond index. The degree of correlation is highest between the S&P 500 US treasury bond index and the S&P US treasury bond current 10Y index. The S&P 500 composite index and S&P 500 energy index are weakly connected with each other.
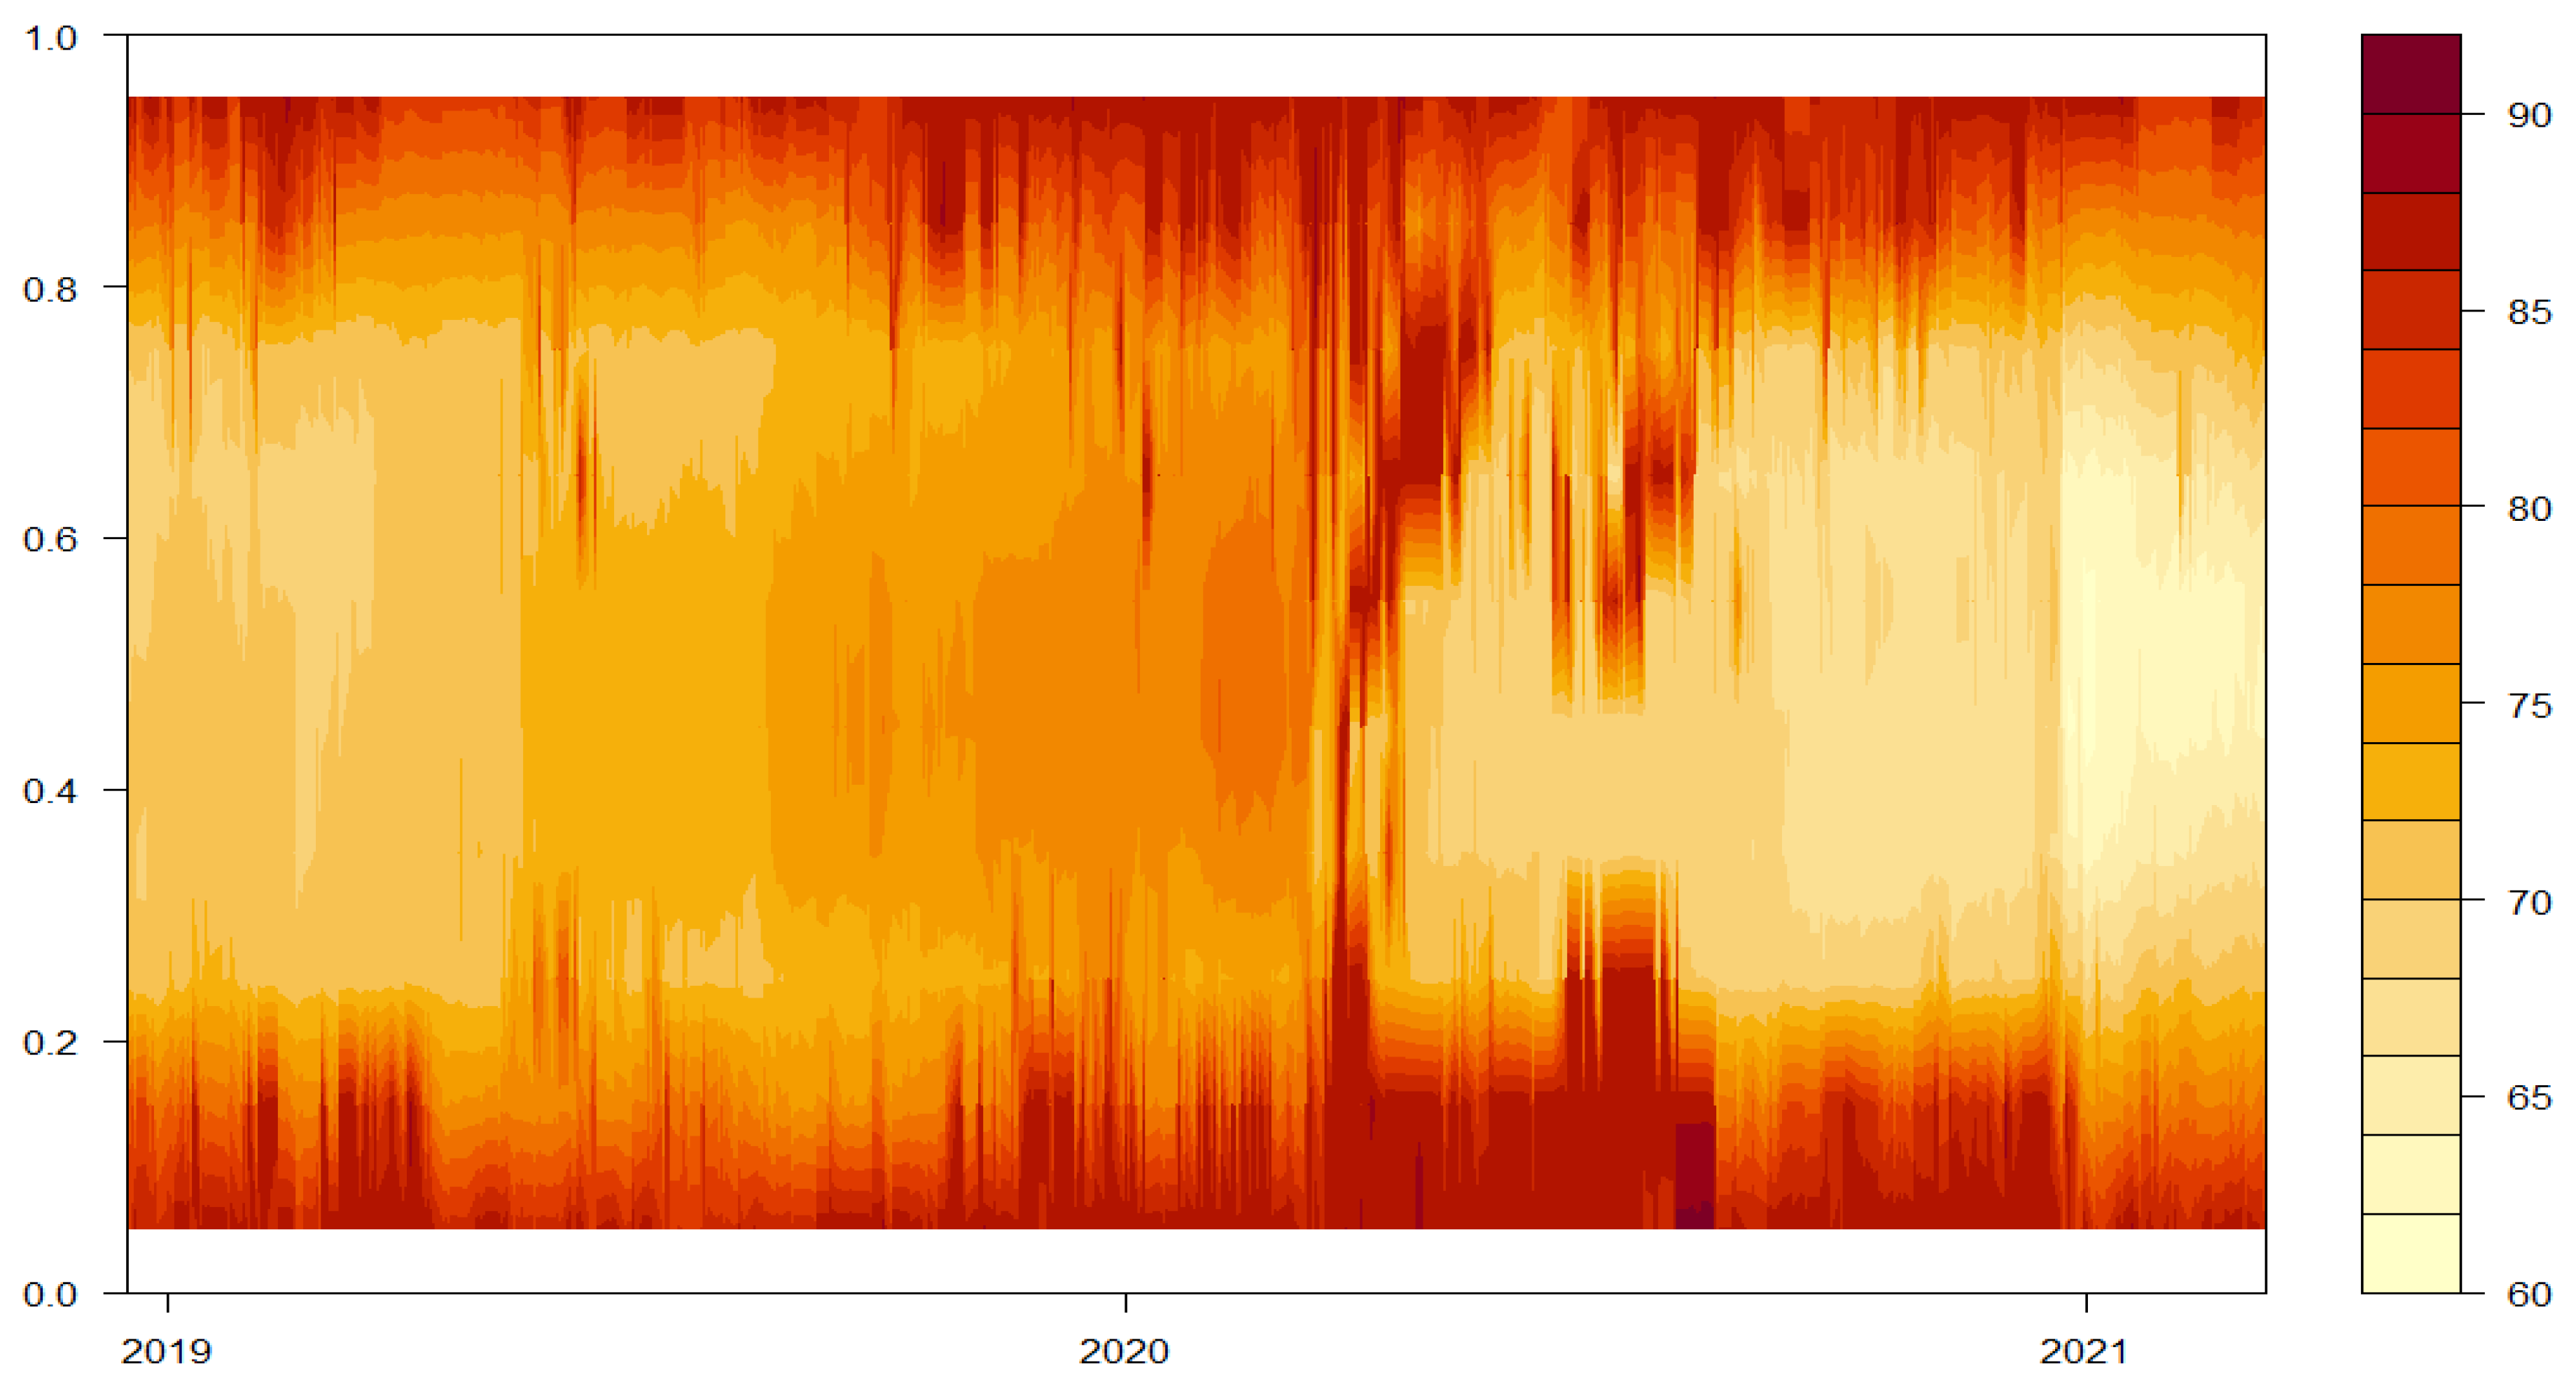
Figure 3 illustrates the results for the Total Connectedness Index. Warmer shades on the plot represent high level of connectedness. Connectedness is very strong for green bonds and changes in other financial assets below the 20% quantile and above the 80% quantile. The effect appears to be symmetric at both the ends. Moreover, this total average spillover for the entire period is represented by the 50% quantile. The connectedness is highest during the year 2020. Moreover, the values are significant at the beginning of our sample and towards the end of 2020. This indicates that connectedness is more prominent during the times of financial crisis.
Sequentially, the paper pinnacles the result on net spillover directions. These are presented in
Figure 4,
Figure 5,
Figure 6,
Figure 7,
Figure 8,
Figure 9,
Figure 10 and
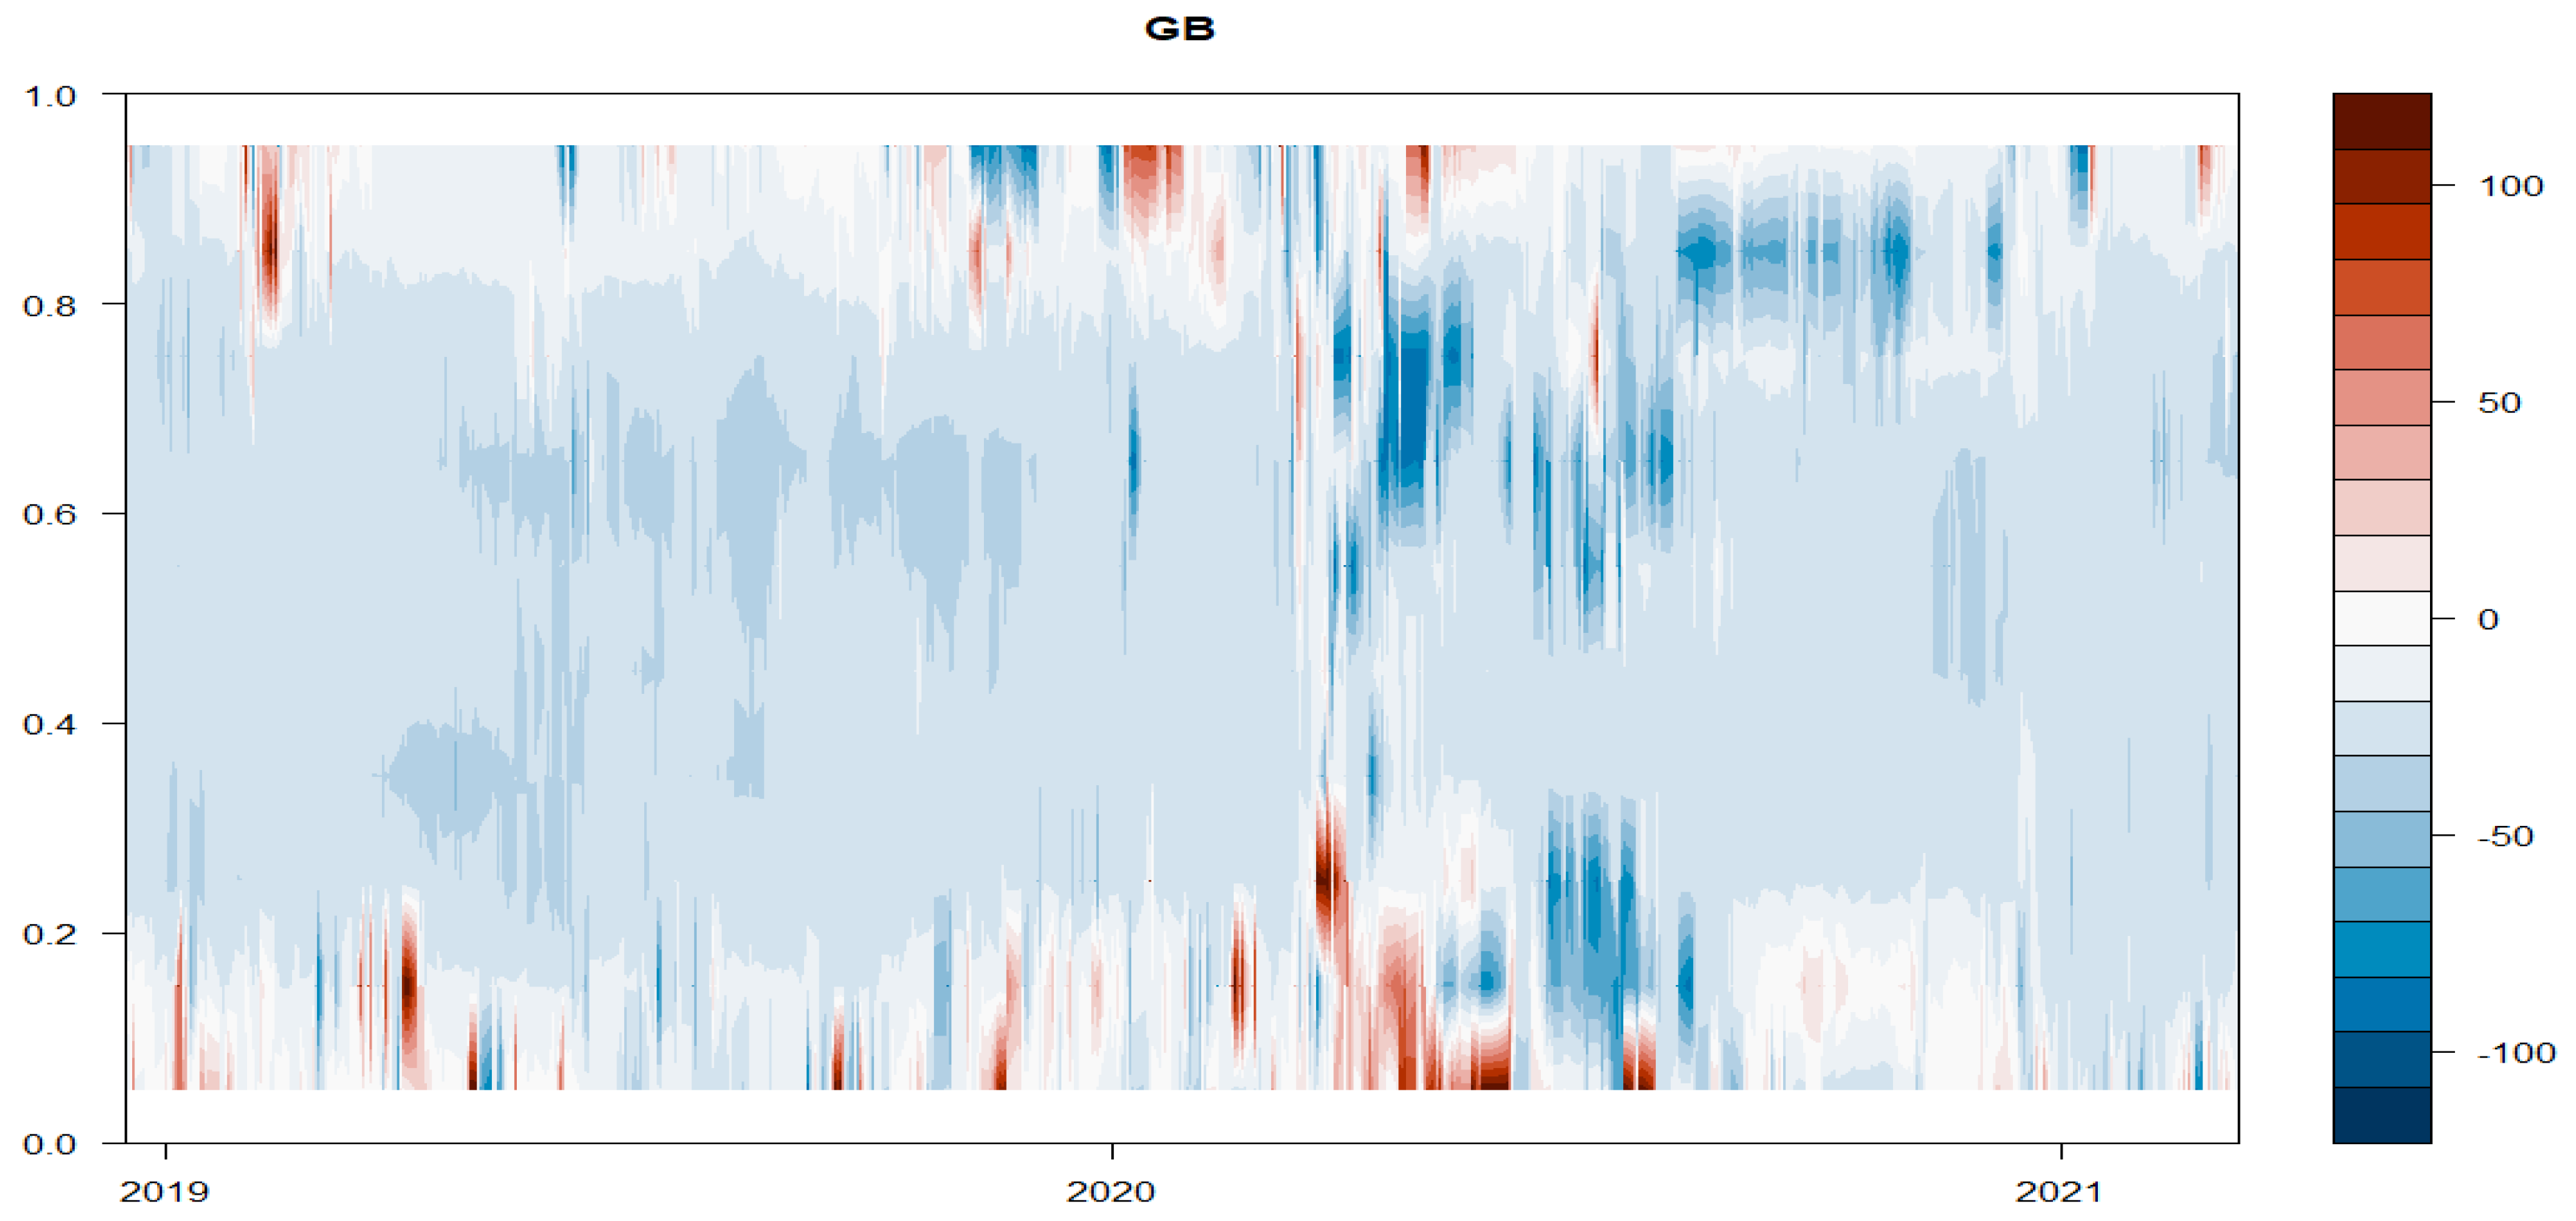
Figure 11. Warmer shades on these plots indicate green bonds to be net transmitters of shocks, while cooler shades imply green bonds to be net receivers of shocks. The COVID-19 pandemic was a glaring period where the connection between green bonds and other financial assets increased spontaneously. These results are similar with those of
Naeem et al. (
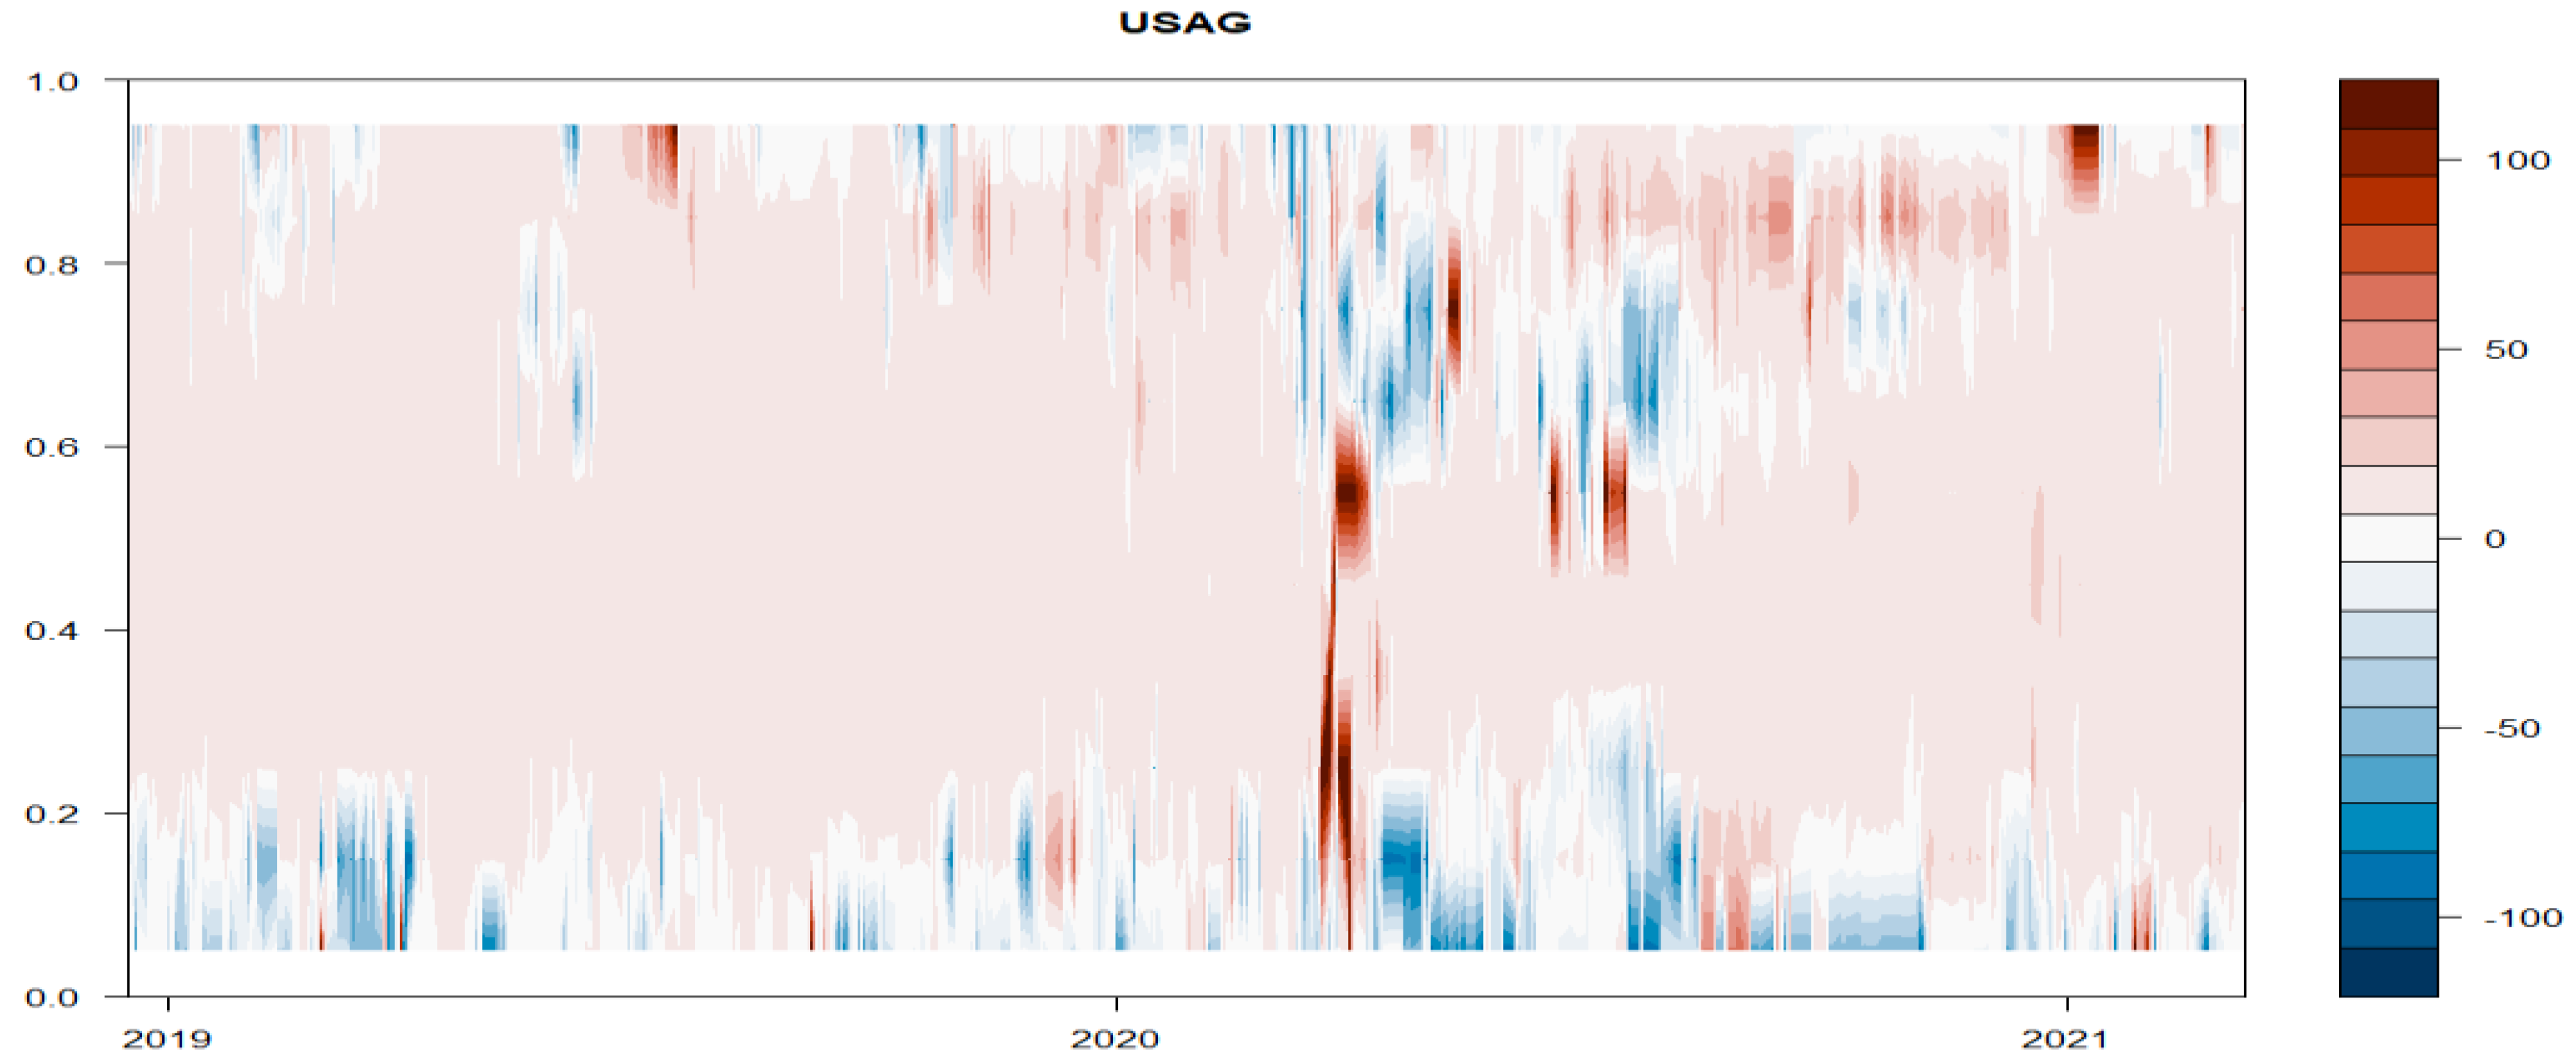
2021a), who urged that the connectedness among green bonds and other financial assets has increased substantially during a period of financial crisis. Finally, towards the end of our sample, the degree of connectedness declines. In
Figure 4, we see that the green bonds market has emerged as a net receiver of shocks. During mid-2020, green bonds have switched to be net transmitters of shocks, and the effect can be mainly seen in the extreme quantile regions, i.e., below the 20% quantile and above the 80% quantile, while green bonds assume a net receiving role from late 2020 to 2021, which is the period post-COVID-19.
In
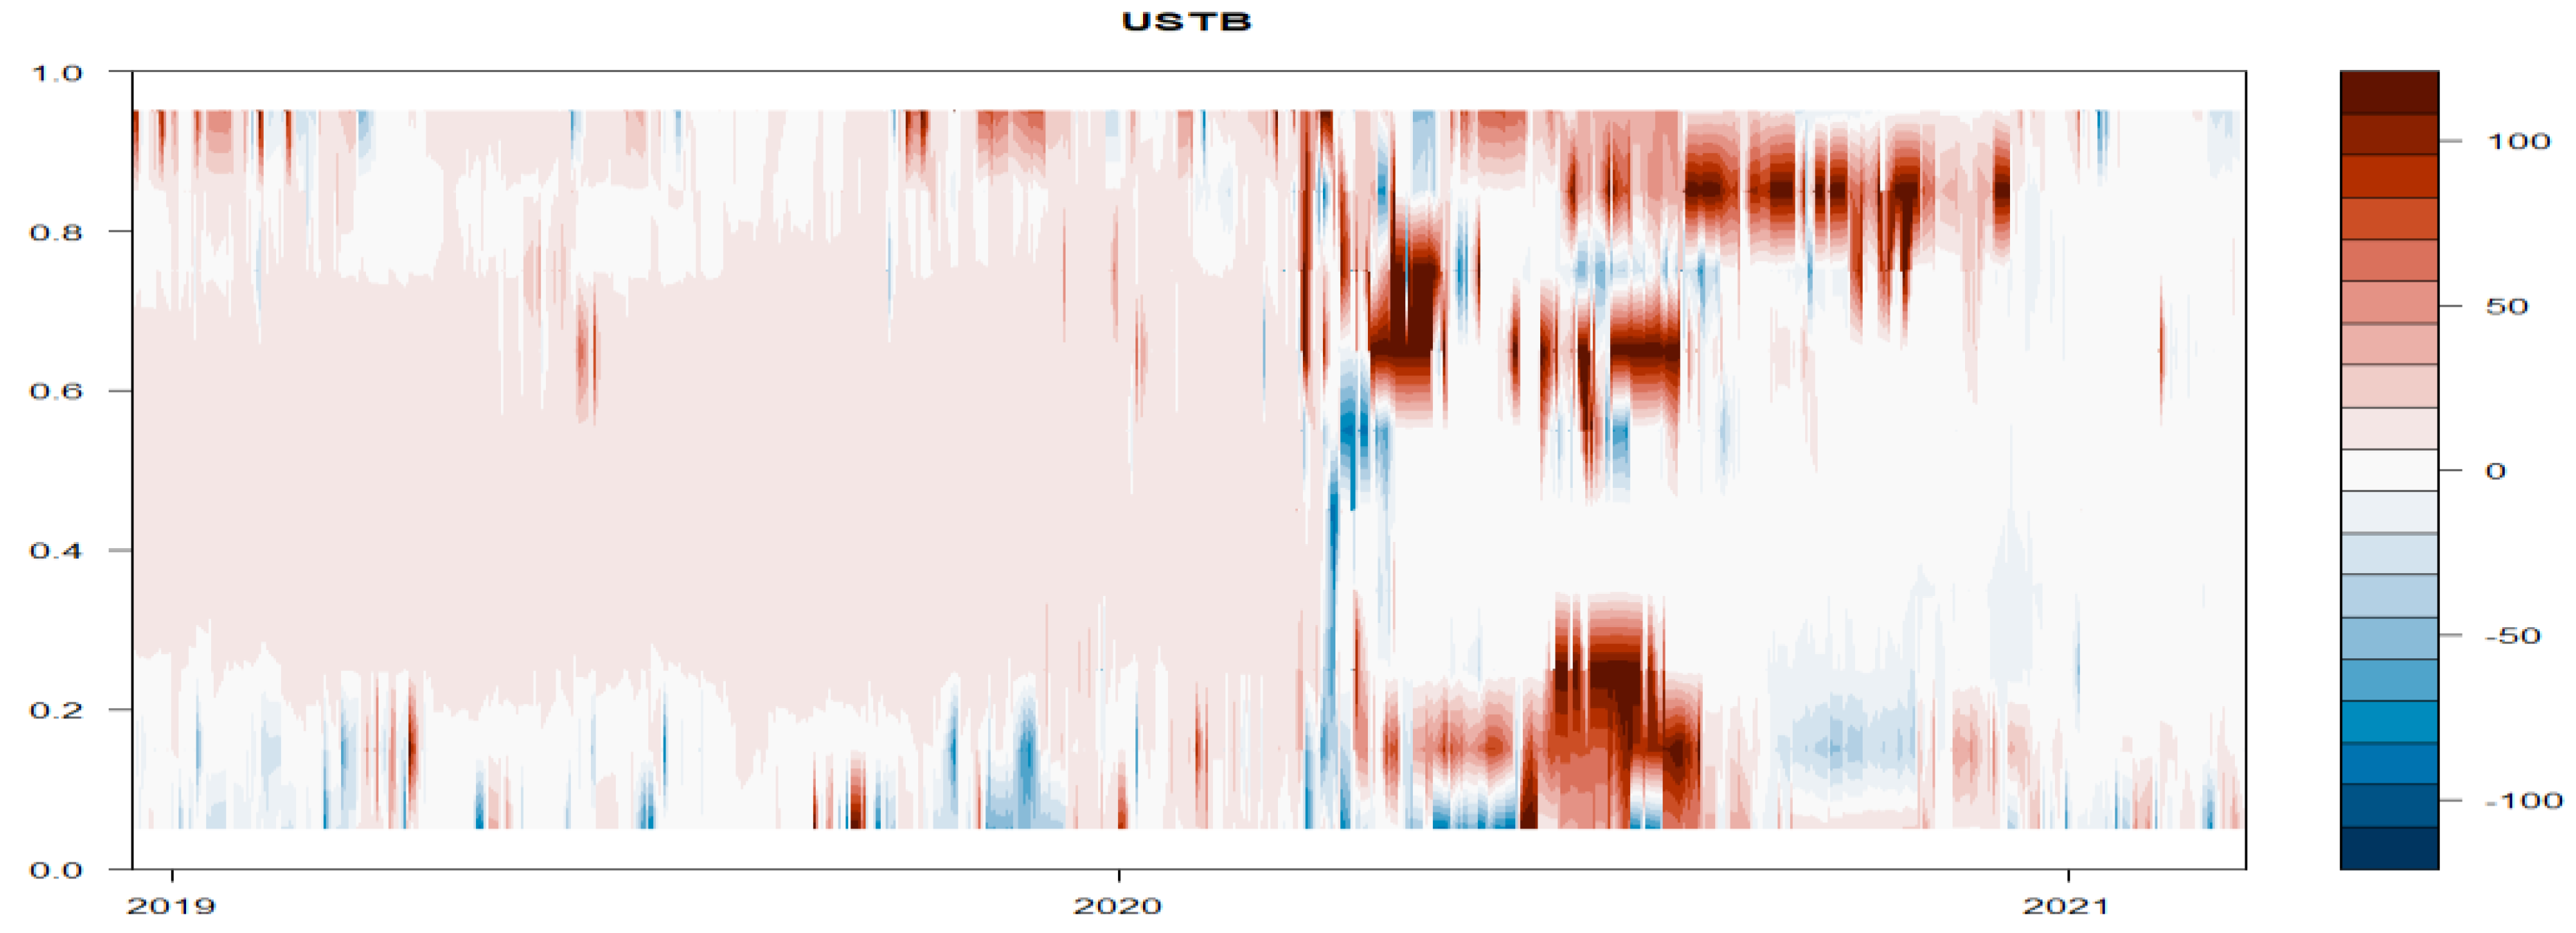
Figure 5, we note that during the pre-COVID 19 period, treasury and conventional bonds steadily transmitted risk to other financial markets. The financial year 2020 was a remarkable period where the magnitude of spillover increased tremendously. Late 2020 and early 2021 witnessed a lesser degree of connectedness of treasury and conventional bonds with other financial assets. This finding is similar to the findings of
Naeem et al. (
2021a), who urged that there exists a moderate spillover effect between green bonds and other bond indices. This may be due the upspringing of returns on stocks and commodities. In
Figure 6, we can observe the aggregate bond index emanated as a net transmitter of risk across other financial markets. The connectedness suddenly increased with the onset of the COVID-19 pandemic and it was highest during mid-2020. However, in the lower extreme quantile (below 20%), the aggregate bond index emerged as net volatility receiver throughout the sample period.
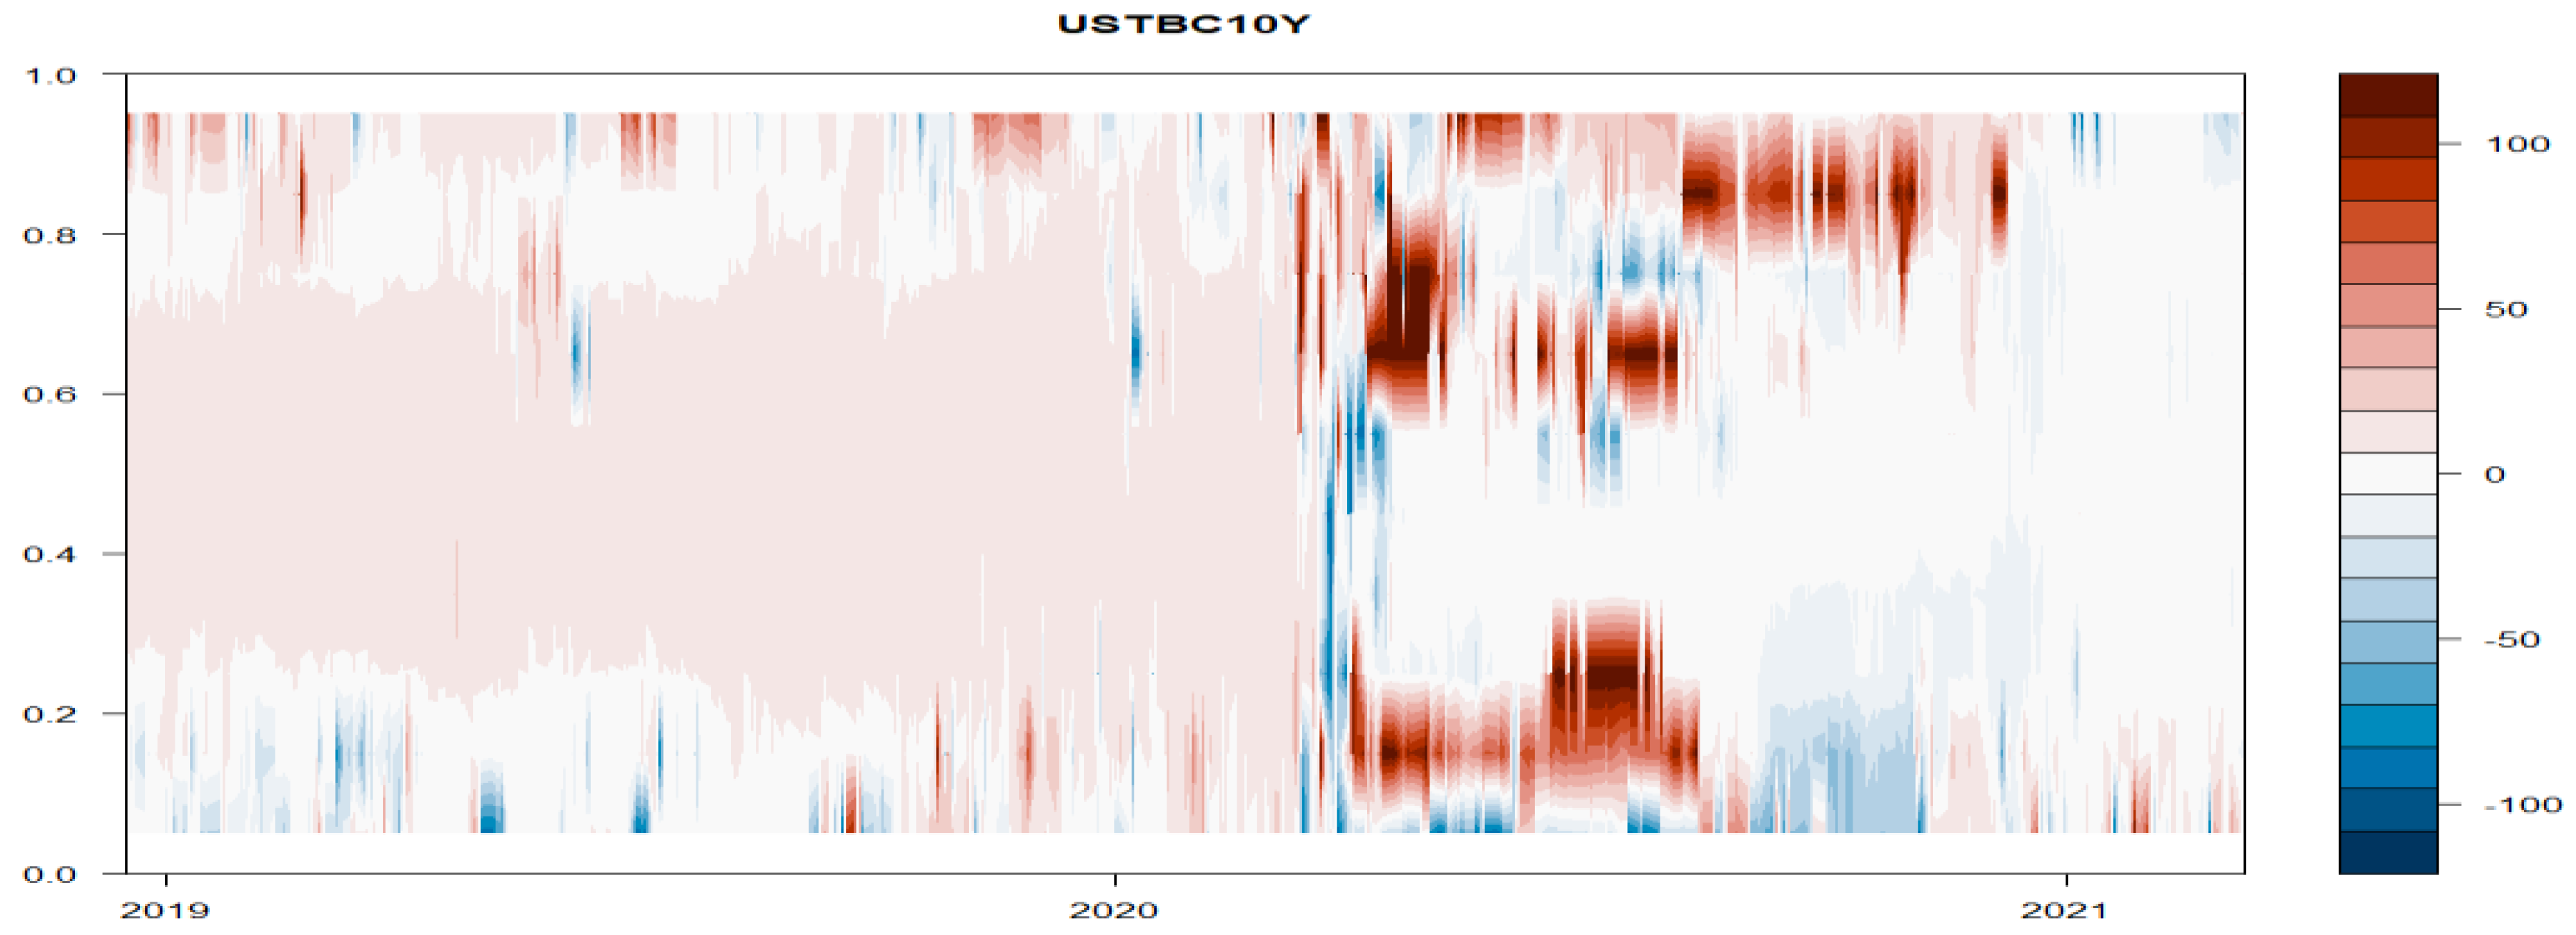
In
Figure 7, we can see that the 10-year treasury bond index has emerged as a net volatility transmitter to other financial markets. The magnitude of spillover tremendously increased in 2020, specifically in lower and upper quantiles. This suggests that green bonds failed to demonstrate their hedging properties during a bearish market when paired with treasury bonds. This finding is similar to the findings of
Pham and Nguyen (
2021). From
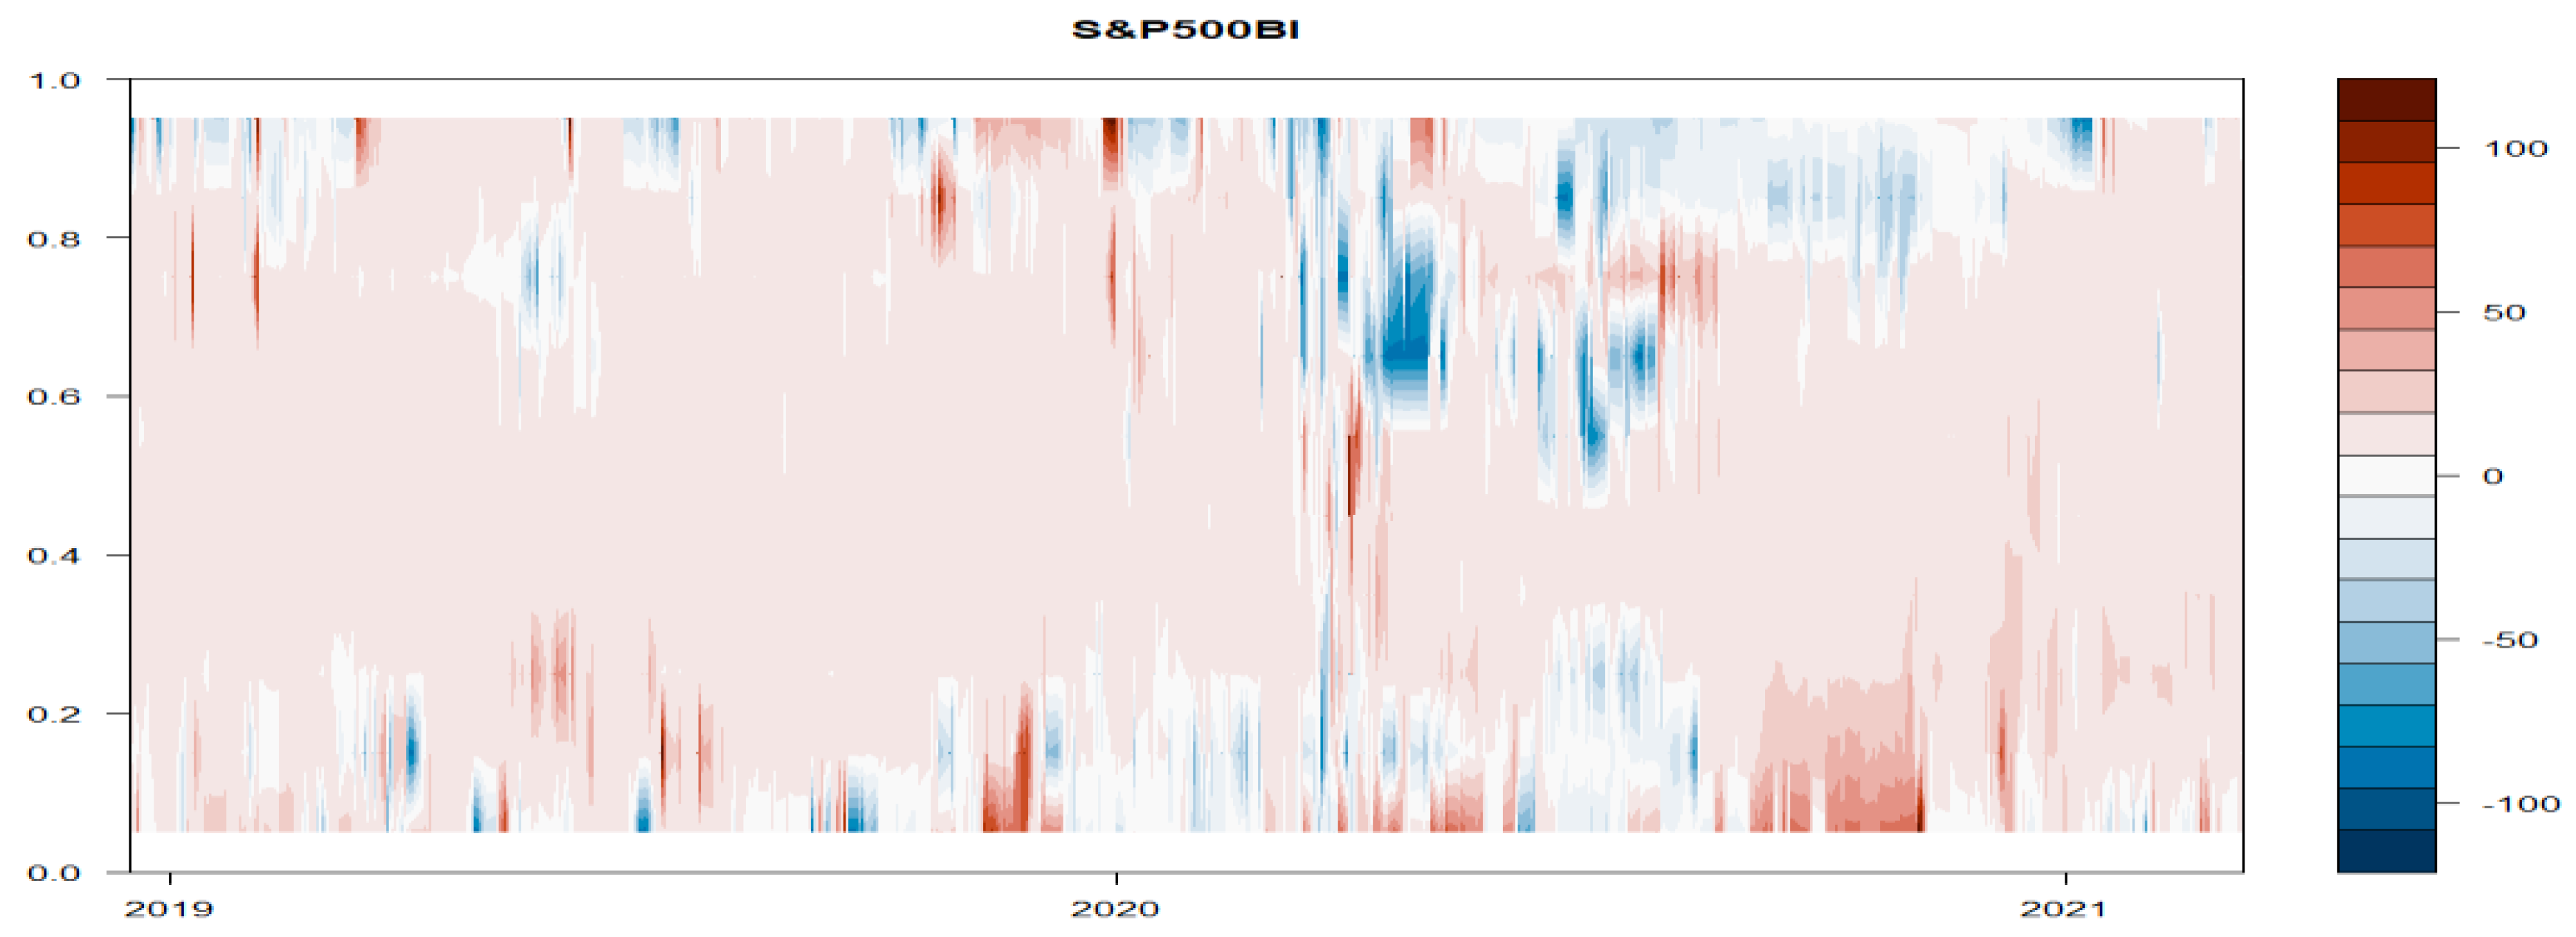
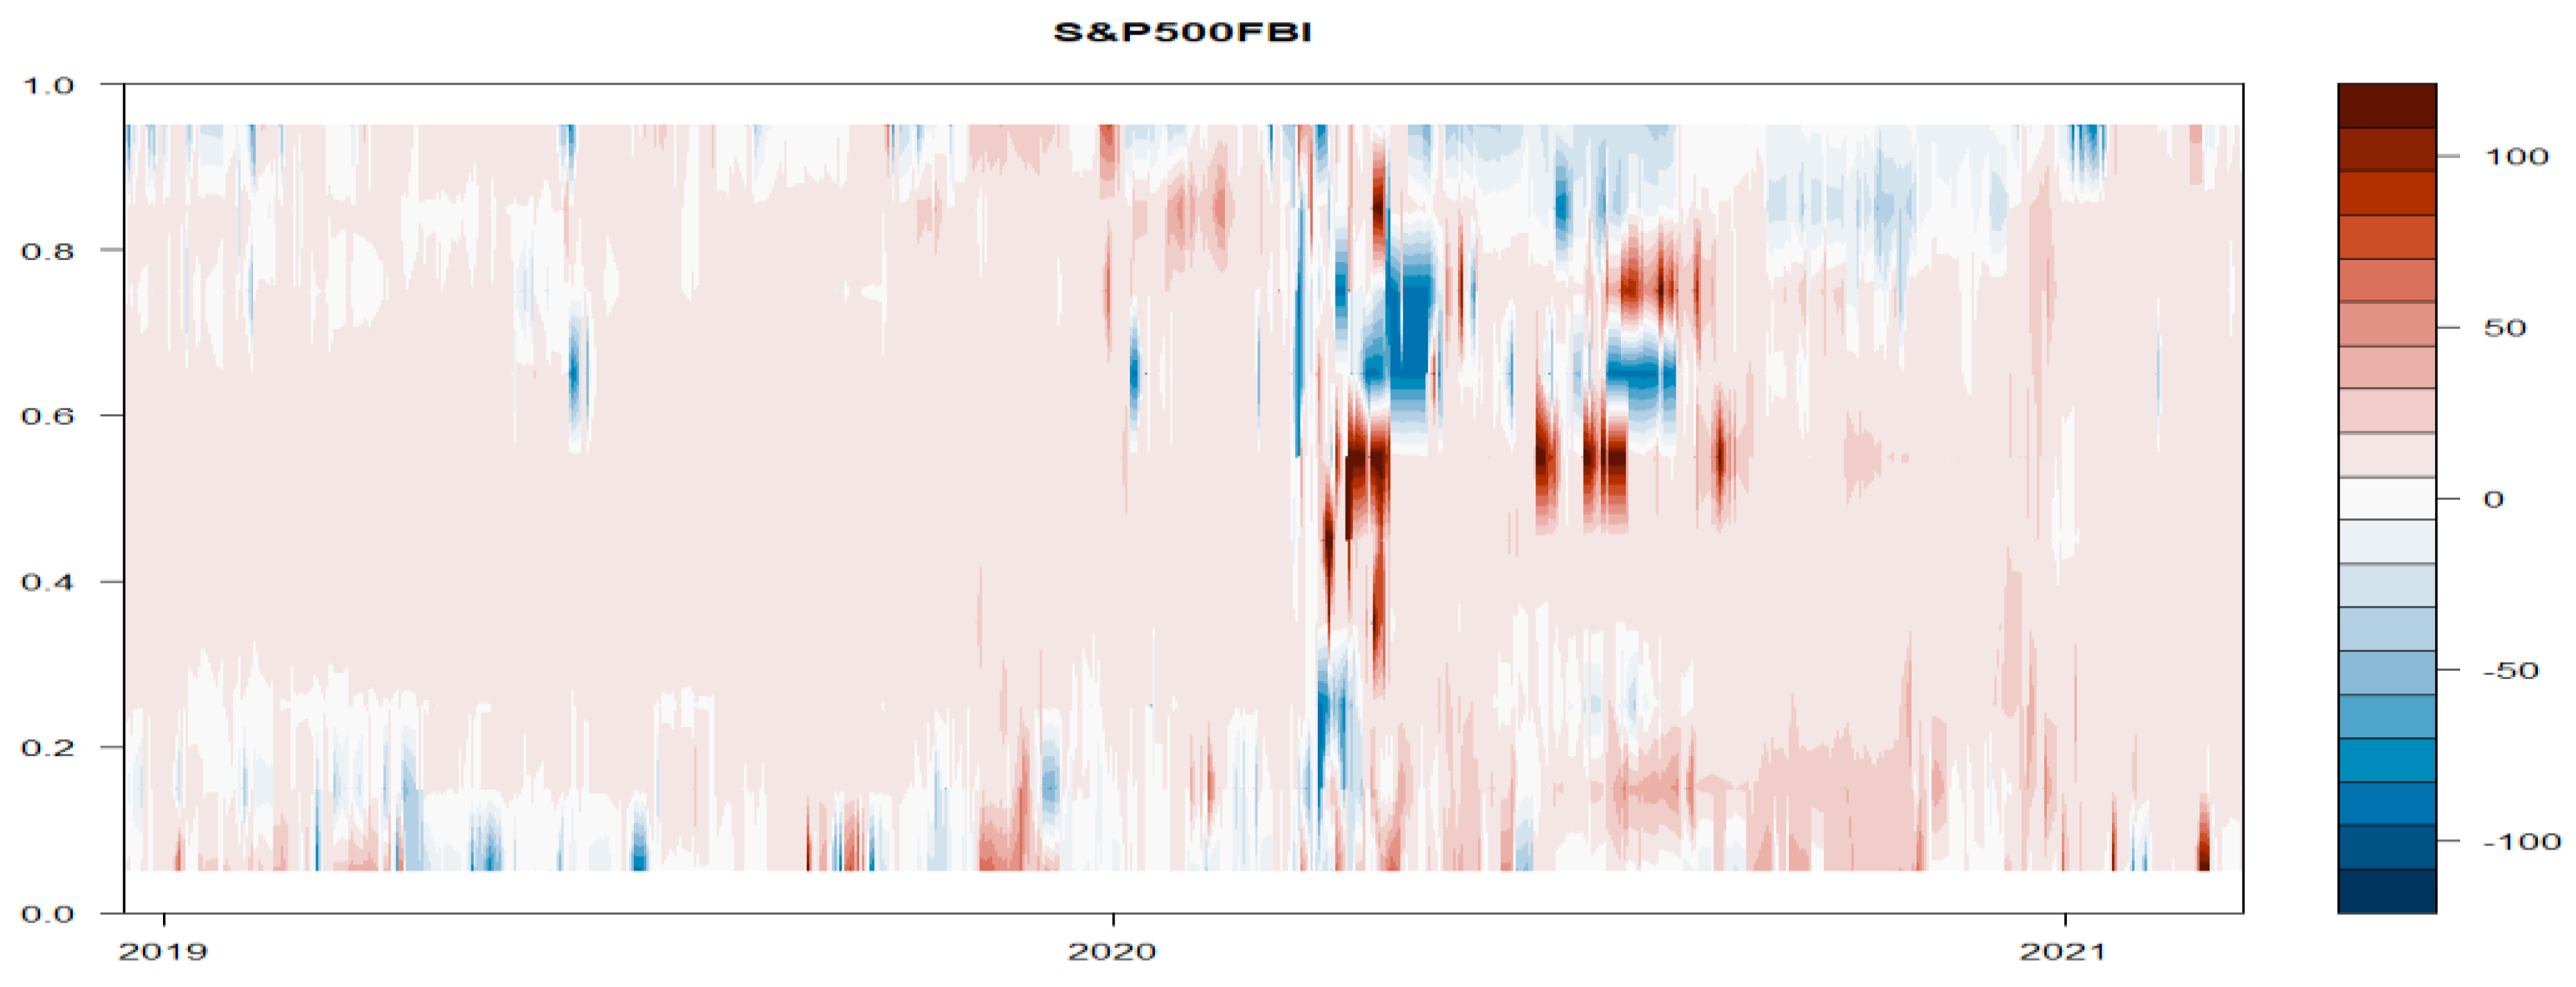
Figure 8, it can observed that the S&P bond index has shifted across time between a net transmitting and a net receiving role. The connectedness is prominent during the pandemic period. During late 2020 and early 2021, the S&P bond index emerged as net volatility receiver, and the effects can be mainly seen in the extreme quantile region. From
Figure 9, it is clear that the S&P 500 financial index emanated as a net transmitter of risk across other financial markets. The connectedness has suddenly increased with the onset of the COVID-19 pandemic and it was highest during mid-2020. However, it has emerged as a net volatility receiver during the pre-COVID 19 period in the extreme lower quantile (below 20%) and post COVID-19 period in the extreme upper quantile (above 80%). In
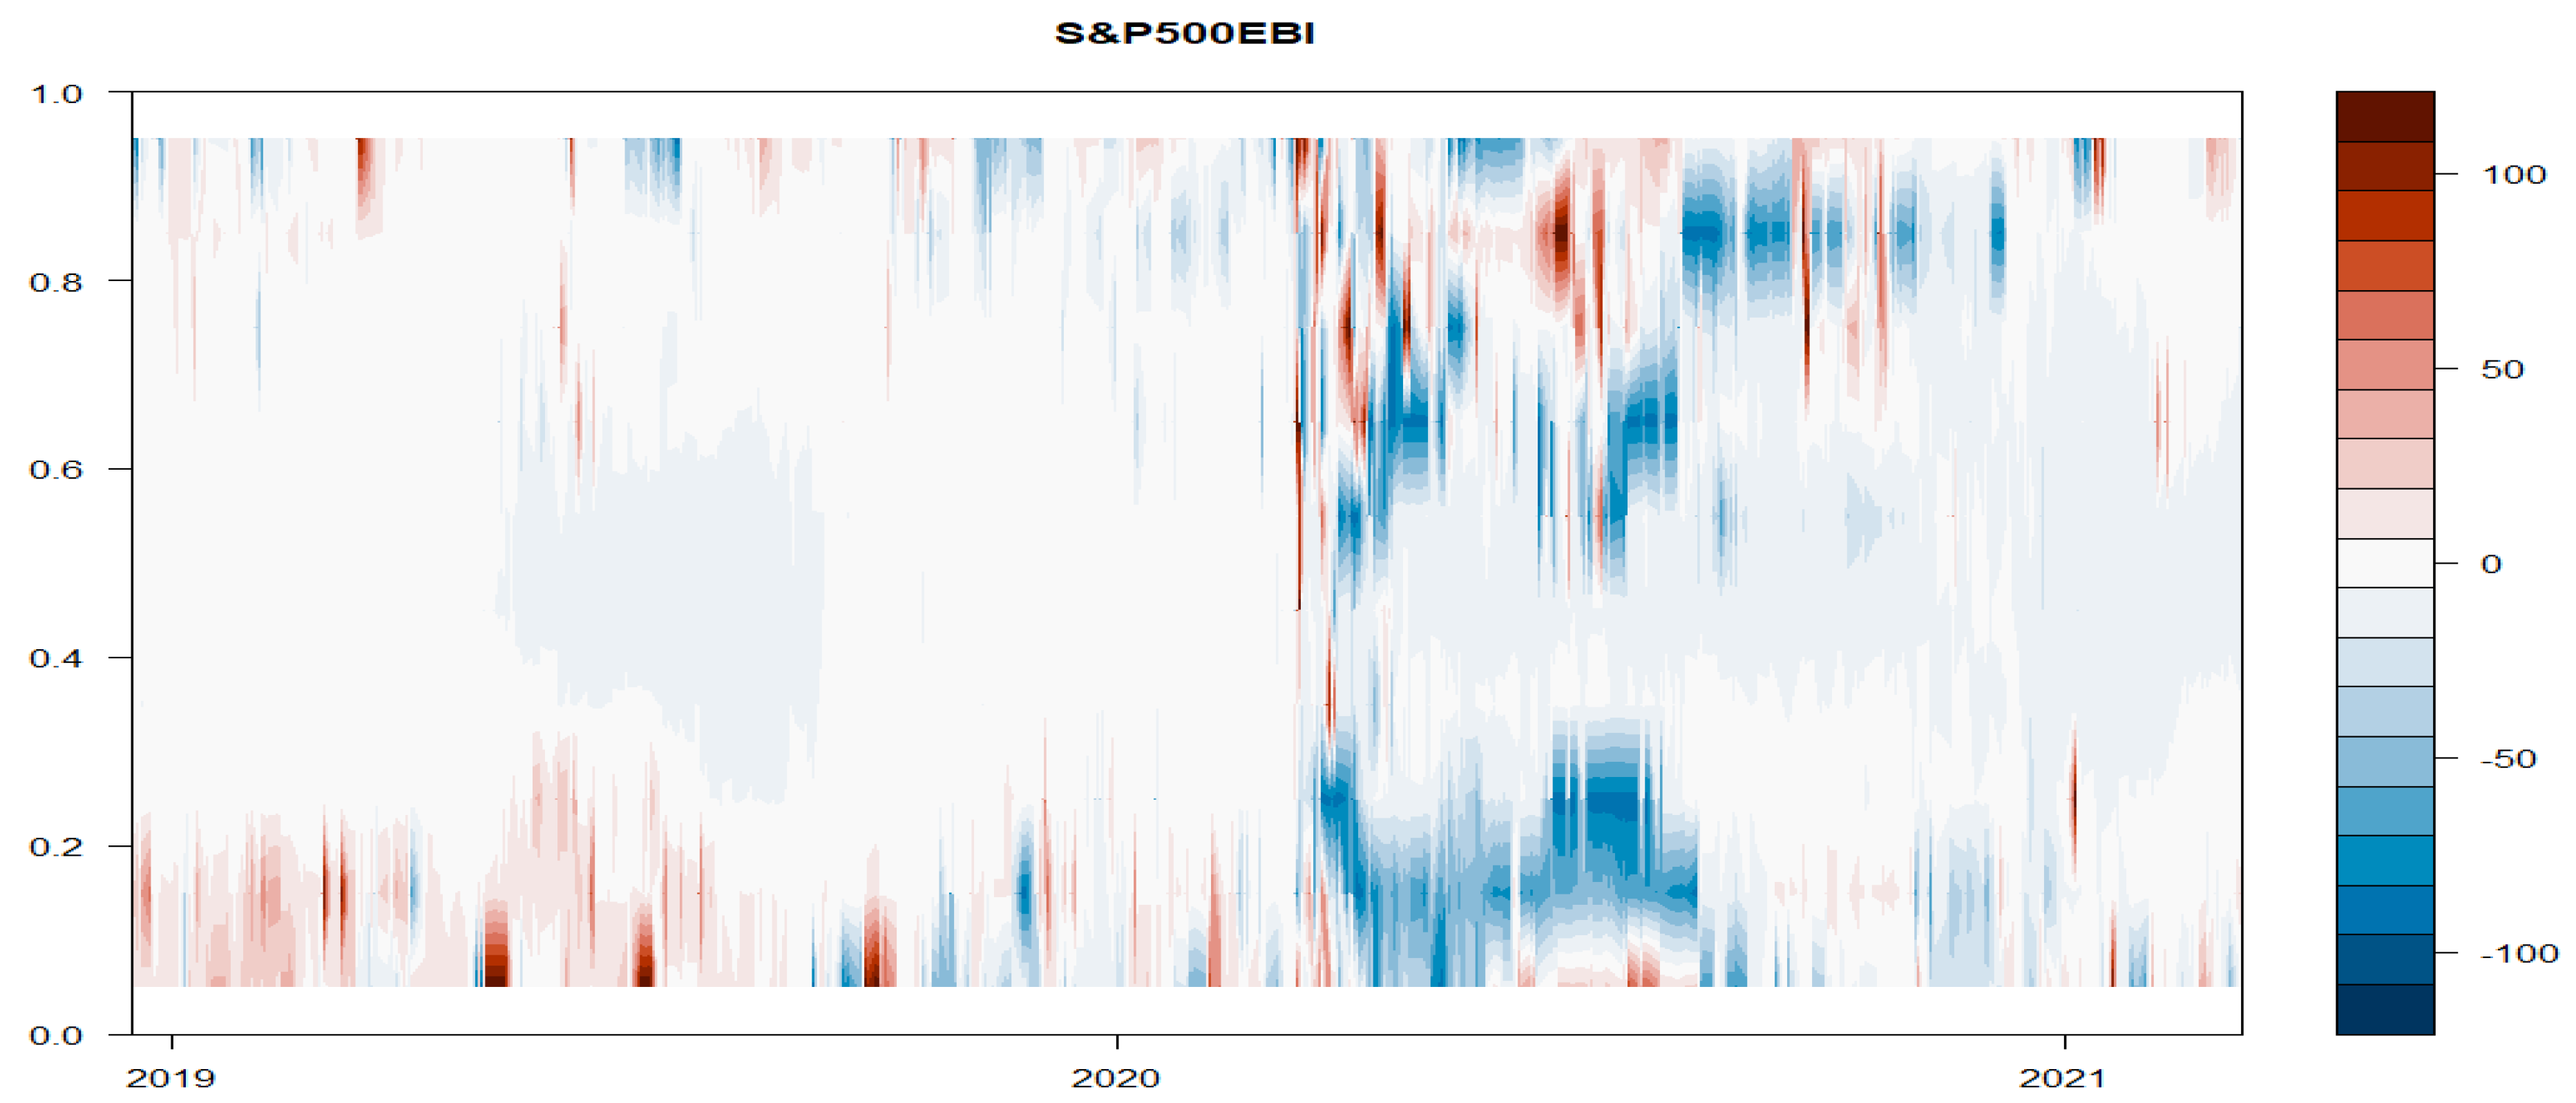
Figure 10, we see that the S&P 500 energy index has emerged as a net receiver of shocks for the entire sample period. However, the S&P 500 energy index was seen as net transmitter of shocks in the extreme lower quantile (below 20%) during the pre-COVID period and post-COVID-19 period in the extreme upper quantile (above 80%). However, this finding is contrary to the finding of
Pham and Nguyen (
2021), who stated the energy index has an insignificant influence on the green bonds market. In
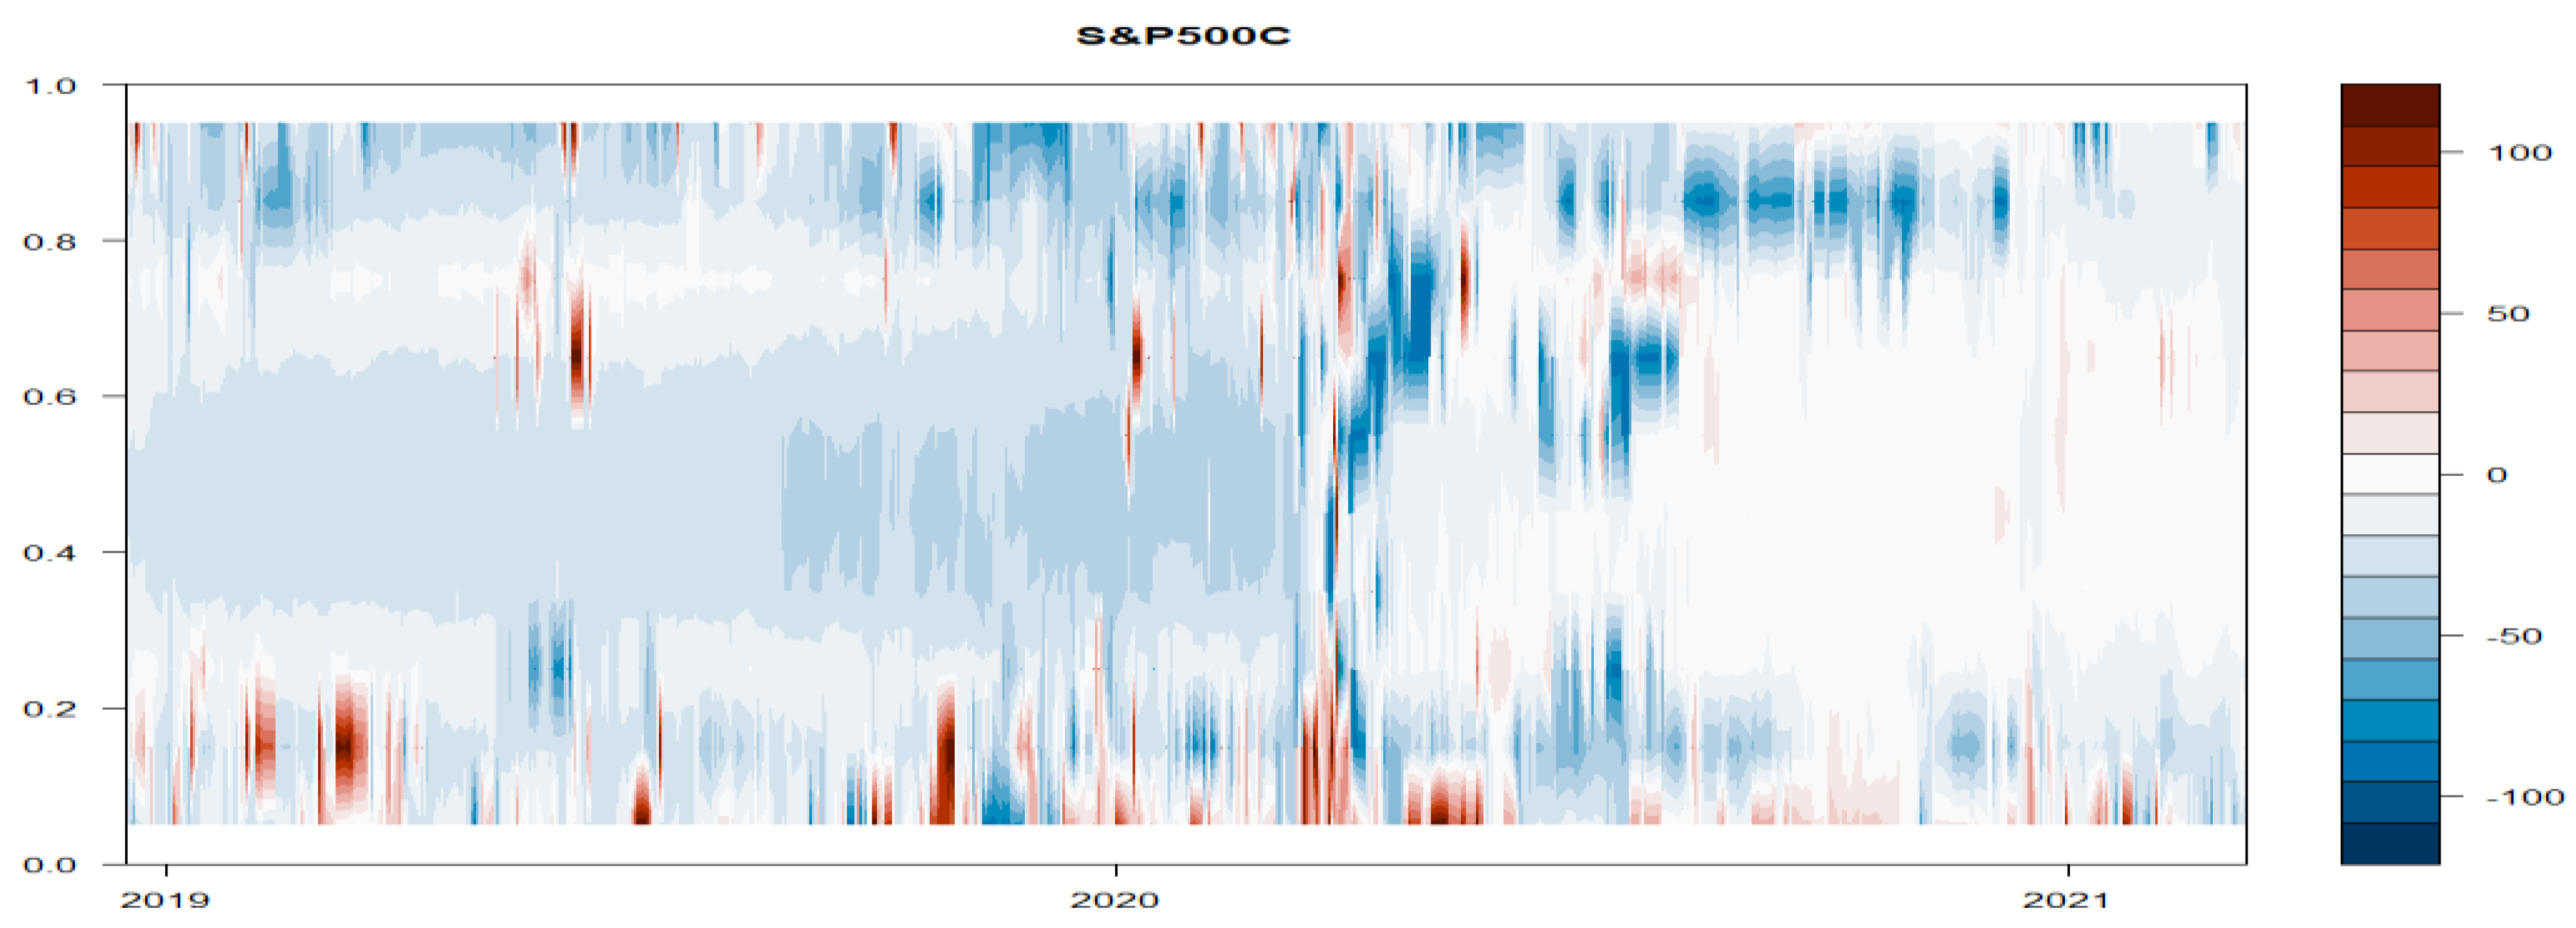
Figure 11, we see that the S&P 500 composite index has emerged as a net receiver of shocks for the entire sample period. However, in the extreme lower quantile (below 20%), the S&P 500 composite index was seen as a net transmitter of shocks throughout the sample period.
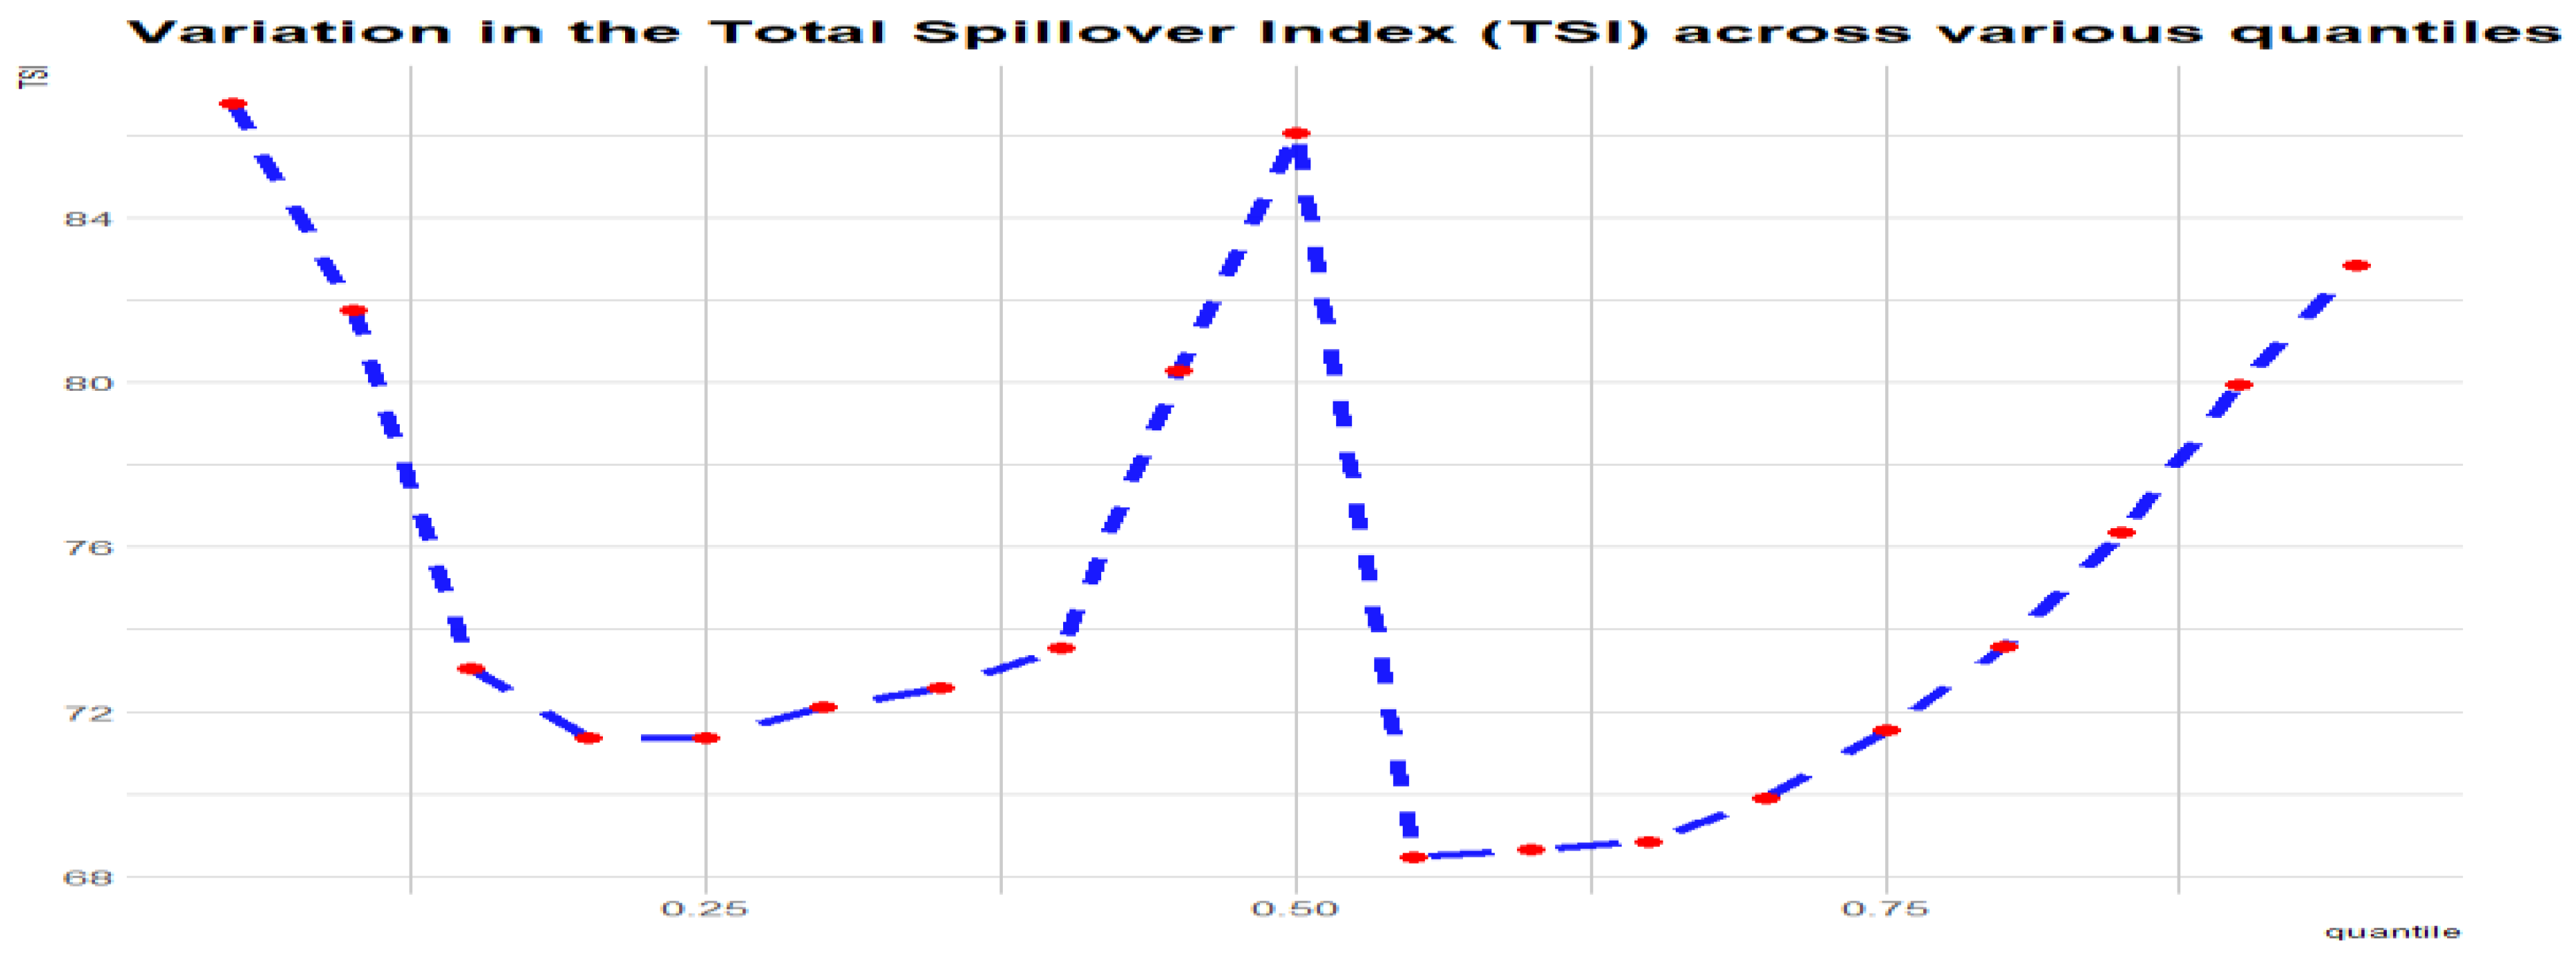
Figure 11 illustrates the total spillover index under different quantiles. We find that the spillover level when affected by extreme events strengthens the mutual connectedness between green bonds and the other asset classes through the spread of risk spillovers. For example, at the 5th, 10th, 90th and 95th percentiles, the TCI reaches 86%, 82%, 76% and 80%, respectively. We observe some form of slight symmetrical pattern regarding variations in the TSI across extreme lower quantiles and extreme upper quantiles. Because the residual covariance matrix does not vary across the quantiles, a similar asymmetric slight pattern observed can be attributed to the similarities in the dynamic parameters of the QVAR approach at quantile (
= a) and quantile (
= 1 − a) and not as a result of a general feature of the results.
5.1. Connectedness Measures at Lower Quantile (below 20%) and Upper Quantile (above 80%)
The estimates of the tail connectedness measures are graphically presented in
Figure 3,
Figure 4,
Figure 5,
Figure 6,
Figure 7,
Figure 8,
Figure 9,
Figure 10 and
Figure 11. The classification of quantile connectedness based on tailed dependency allows us to distinguish between extreme negative shocks and extreme positive shocks. The values of connectedness measures are larger in the mean or middle quantile as compared to the left and right tails. This reflects that the system of connectedness is not much impacted by extreme positive or negative shocks. Furthermore, the contributions to others (net transmitter) and contributions from others (net receiver) are stronger at the lower tail (below 20%) than the upper tail. The linkage between green bonds and other financial markets are stronger during a financial crisis than during normal periods (e.g.,
Naeem et al. 2021a;
Pham and Nguyen 2021).
Figure 12 shows that the TSI graph declines from the lower quantiles to upper quantiles, with its lowest at the middle quantiles. The variation in the TSI across various quantiles (
Figure 12) shows evidence of strong connectedness at the extreme quantiles, suggesting that the intensity of return connectedness rises during the period of stress. This agrees with previous studies on contagions during financial crises (
Nguyen et al. 2020;
Naeem et al. 2021a). However, during a period of financial stress, the connectedness among green bonds and other financial markets intensifies the propagation of risk.
5.2. Time-Varying Analysis
In this section, we will describe the time varying analysis on the basis of the quantile VAR designed to capture the return spillover in the mean and median as well as upper and lower quantiles of the conditional distribution. For this purpose, we have used a fixed window length of 200 days at the conditional mean and the conditional median, which are shown in
Figure 4 and
Figure 11, respectively. Most of the indices seem to follow a similar path and exhibit very large fluctuations ranging between 20% and 80%, with a clear uptrend in the level of spillovers from early 2020 to mid-2020, during the outbreak of the COVID-19 pandemic, which was the cause of the financial crisis. Afterwards, the level of spillover declines gradually at the end of the sample period. The TSI at the lower and upper tails is given in
Figure 12. Contrary to the mean and the median, the TSI fluctuates in both the upper and lower tails, with an apparent spike at the lower tail. Consequently, a rise in TSI at both the upper as well as lower quantiles evidences an increase in spillover during bearish market conditions. The contents of events in extreme market conditions in the lower tail and upper tail can lead to an important proportion of green bonds traders concentrating on events happening in extreme market conditions.
On the basis of the spillover pattern, we have categorized market behavior into three groups. The first group represents net recipients of returns, such as the S&P 500 composite index. The second group reflects the markets which acted as net transmitters of spillovers while at other times they are net recipients of return spillovers, as in the case of the S&P 500 Energy Index. The third group represents net transmitters of returns such as the S&P US Treasury Bond 10YR Index. Further results show that green bonds act a net recipient throughout the sample period. The S&P 500 Bond Index S&P US Treasury Bond 10YR Index assumes a transmitter role, before becoming a receiver of return shocks from the others from early 2020. Interestingly, the S&P US Treasury Bond Index is a net transmitter for most of the sample period. However, during 2020, it shifted to a receiver role, mostly observed at medium quantiles. In addition, it is worth noting the opposite behavior in the transmission and receipt of net spillovers in the S&P 500 Energy Index. The S&P Green Bond Index and S&P 500 Energy are mostly a net transmitter of extreme spillover of shocks in both lower and upper tails, while the S&P 500 Financials Index and S&P 500 Bond Index presumes mostly the receiver role at both tails. The S&P 500 Composite Index is a net transmitter of shocks at the lower tail. The S&P US Aggregate Bond Index presumes a receiver role at the lower tail. The S&P US Treasury Bond Index are S&P US Treasury Bond 10YR Index, and the patterns of net extreme spillovers are mixed. The S&P Green Bond Index and S&P 500 Energy are mostly net transmitters of extreme returns, which could make them a pinnacle for monitoring by investors and policy makers under bearish market conditions, especially if the same past pattern is observed in the future.
The above findings add new insights regarding the connectedness of financial markets during a period of crisis. They show evidence of excess return spillovers at the mean and median as compared to the lower and upper tails. They represent an extension of the mean-based literature on spillovers in the green bonds market (
Nguyen et al. 2020;
Naeem et al. 2021a,
2021b;
Ferrer et al. 2021;
Reboredo and Ugolini 2020), The results generally concord with
Nguyen et al. (
2020) and
Naeem et al. (
2021a), who urged that the connectedness of green bonds with other financial markets has increased substantially during a financial crisis.
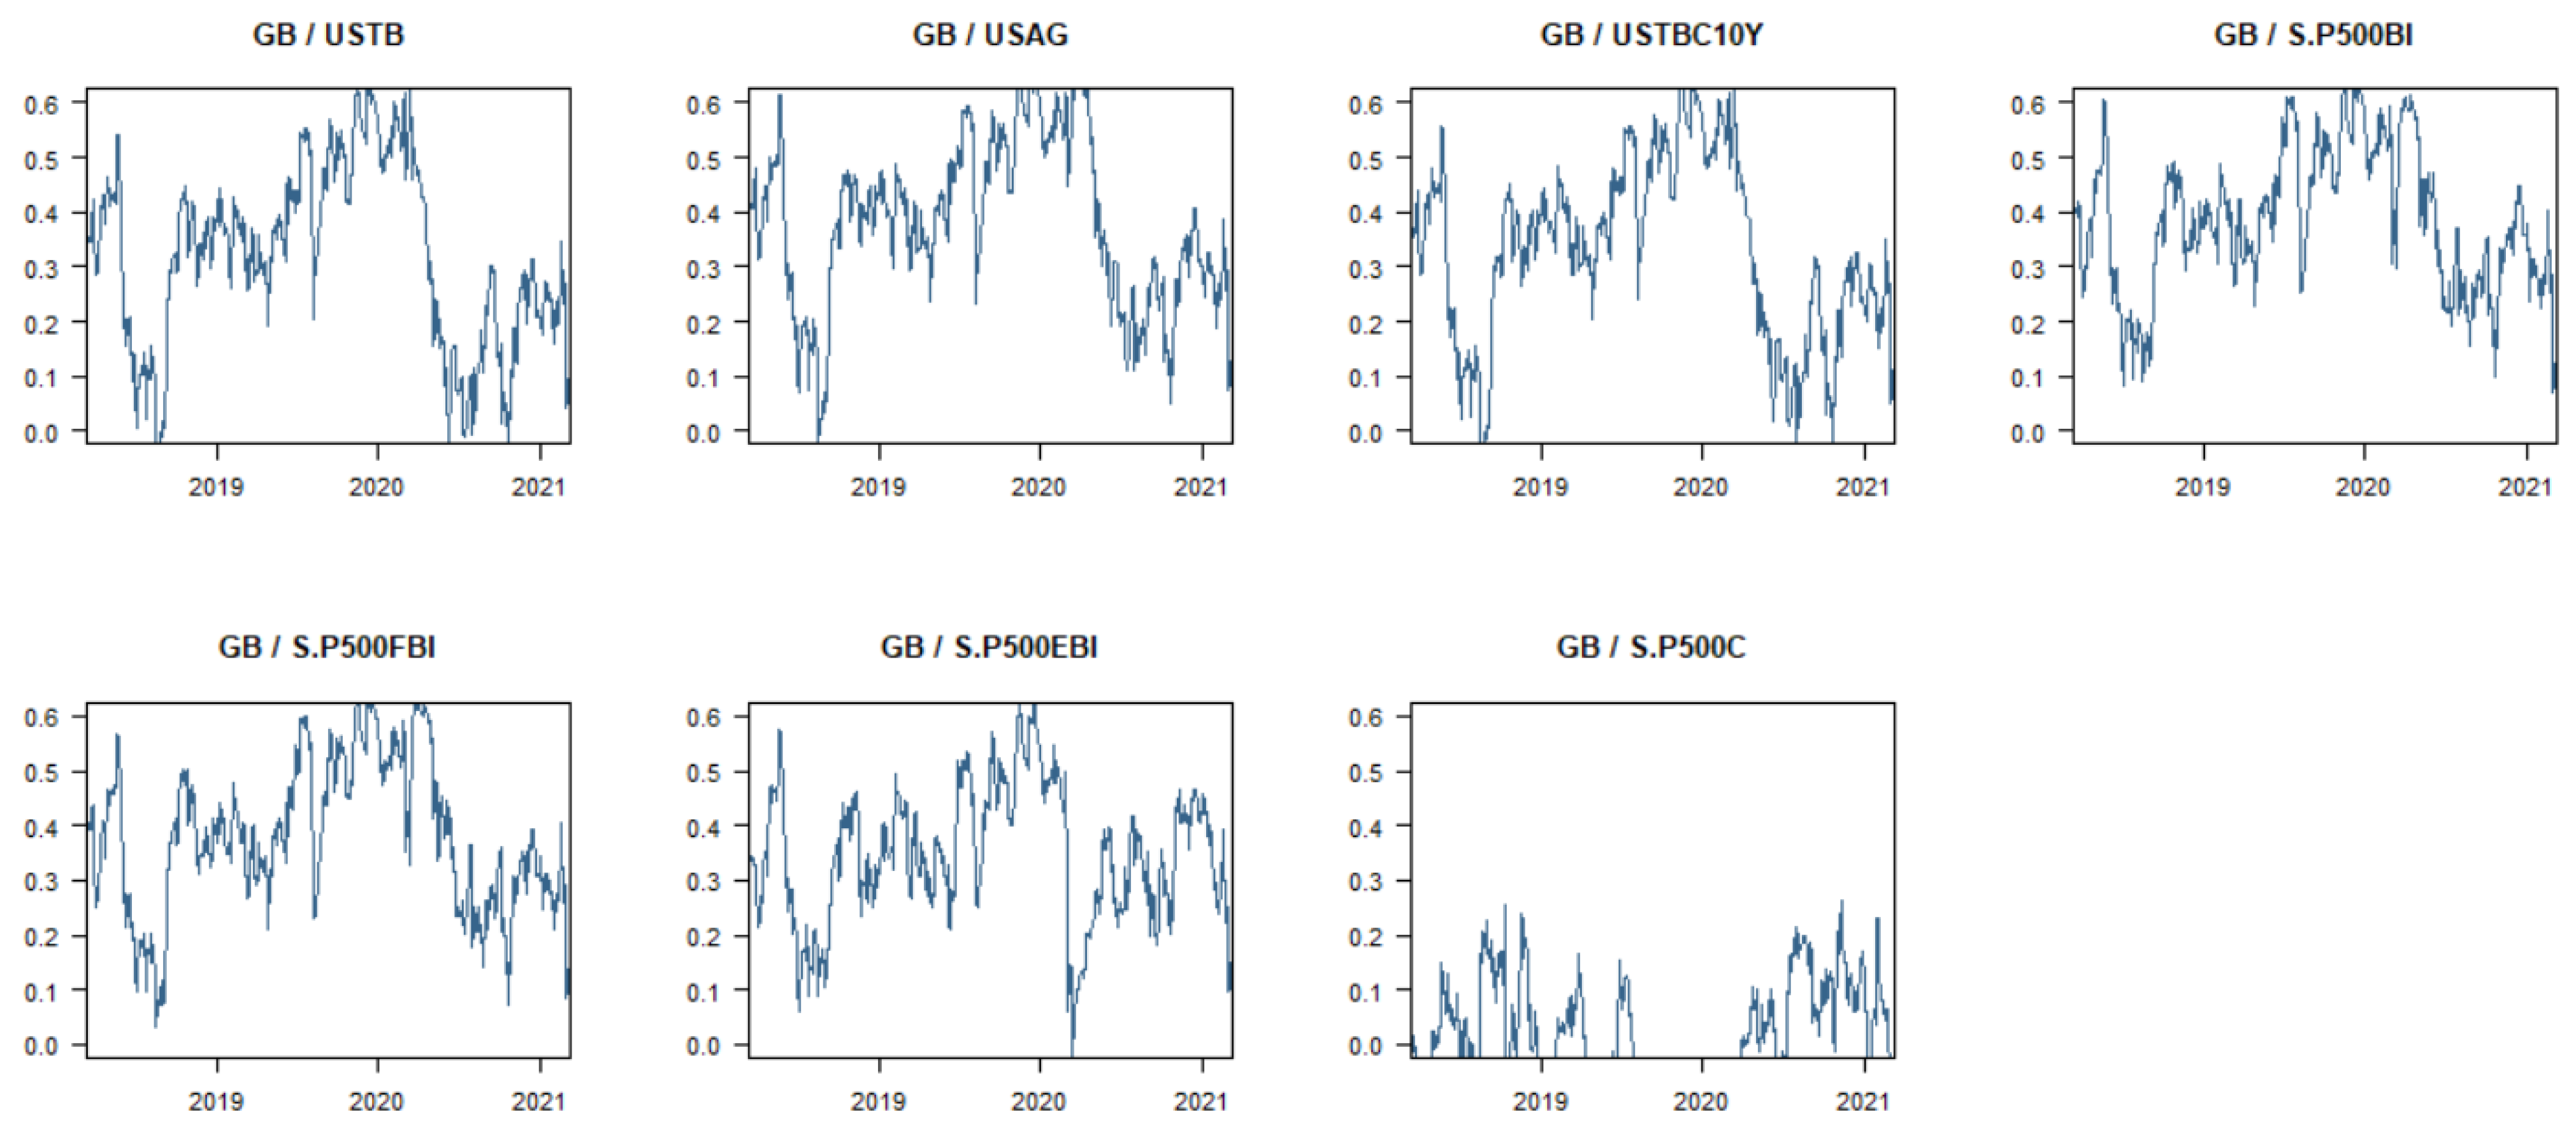
Figure 13 shows the dynamic conditional correlations between green bonds and other financial markets. It is evident that the correlation between green bonds and other financial markets has substantially increased in 2020 during the wide spread of COVID- 19 and again reduced in 2021. The correlation is highest in case of green bonds and the S&P 500 bond index, while it is least in case of green bonds and the S&P 500 composite index.
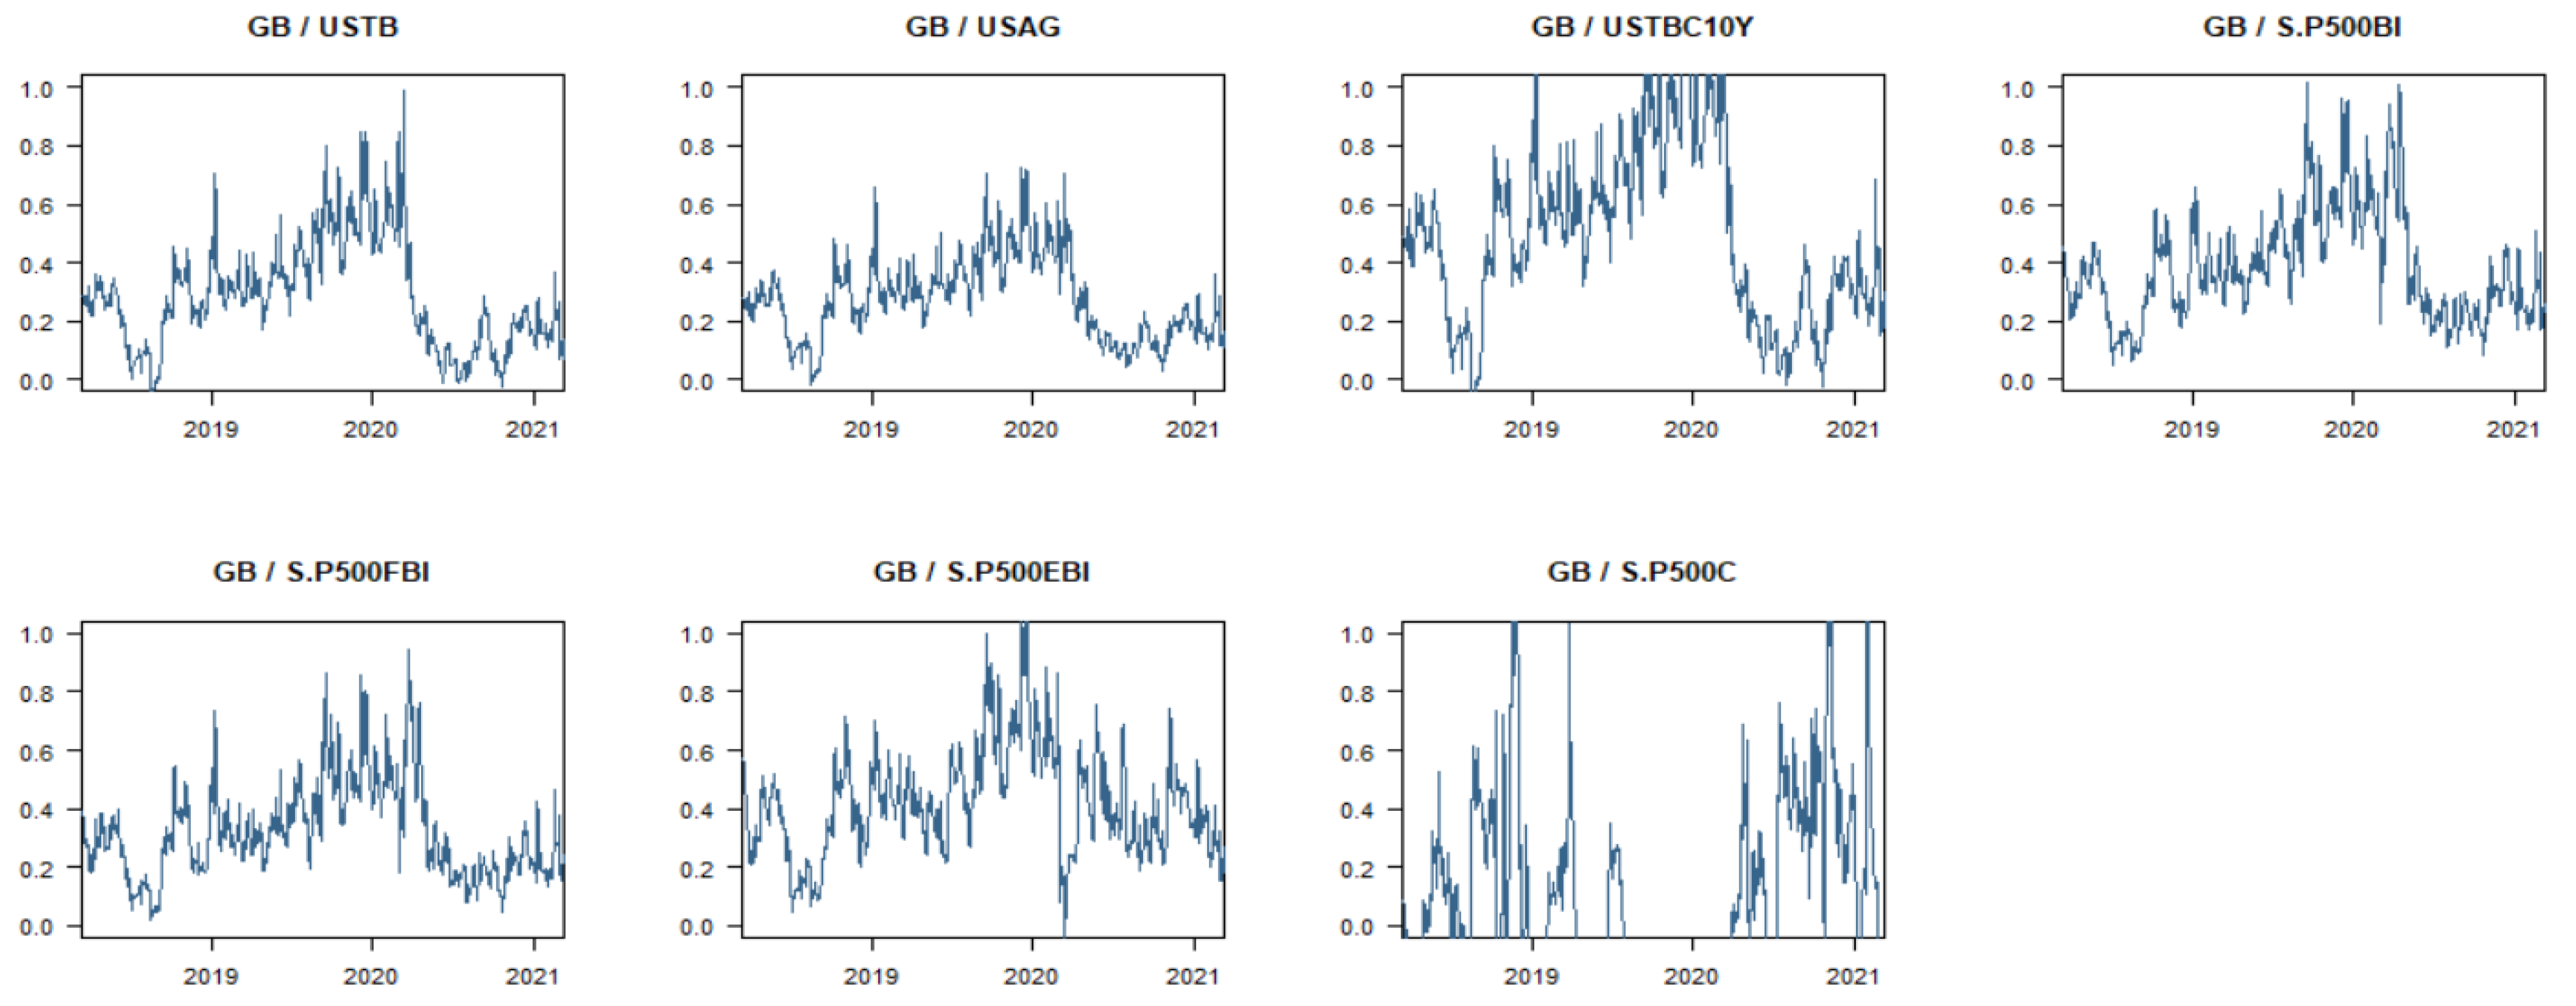
Figure 14 shows the hedging ratio of green bonds with other financial markets for long and short positions. The hedging ratio is high during 2020 due to onset of COVID-19, and in 2021, it has plunged back. Green bonds and US treasury bonds current 10-year index have the highest hedging ratio, thereby indicating the hedging benefits of green bonds against the US treasury bonds’ current 10-year index. The hedging ratio is least in the case of green bonds and the S&P 500 composite index.
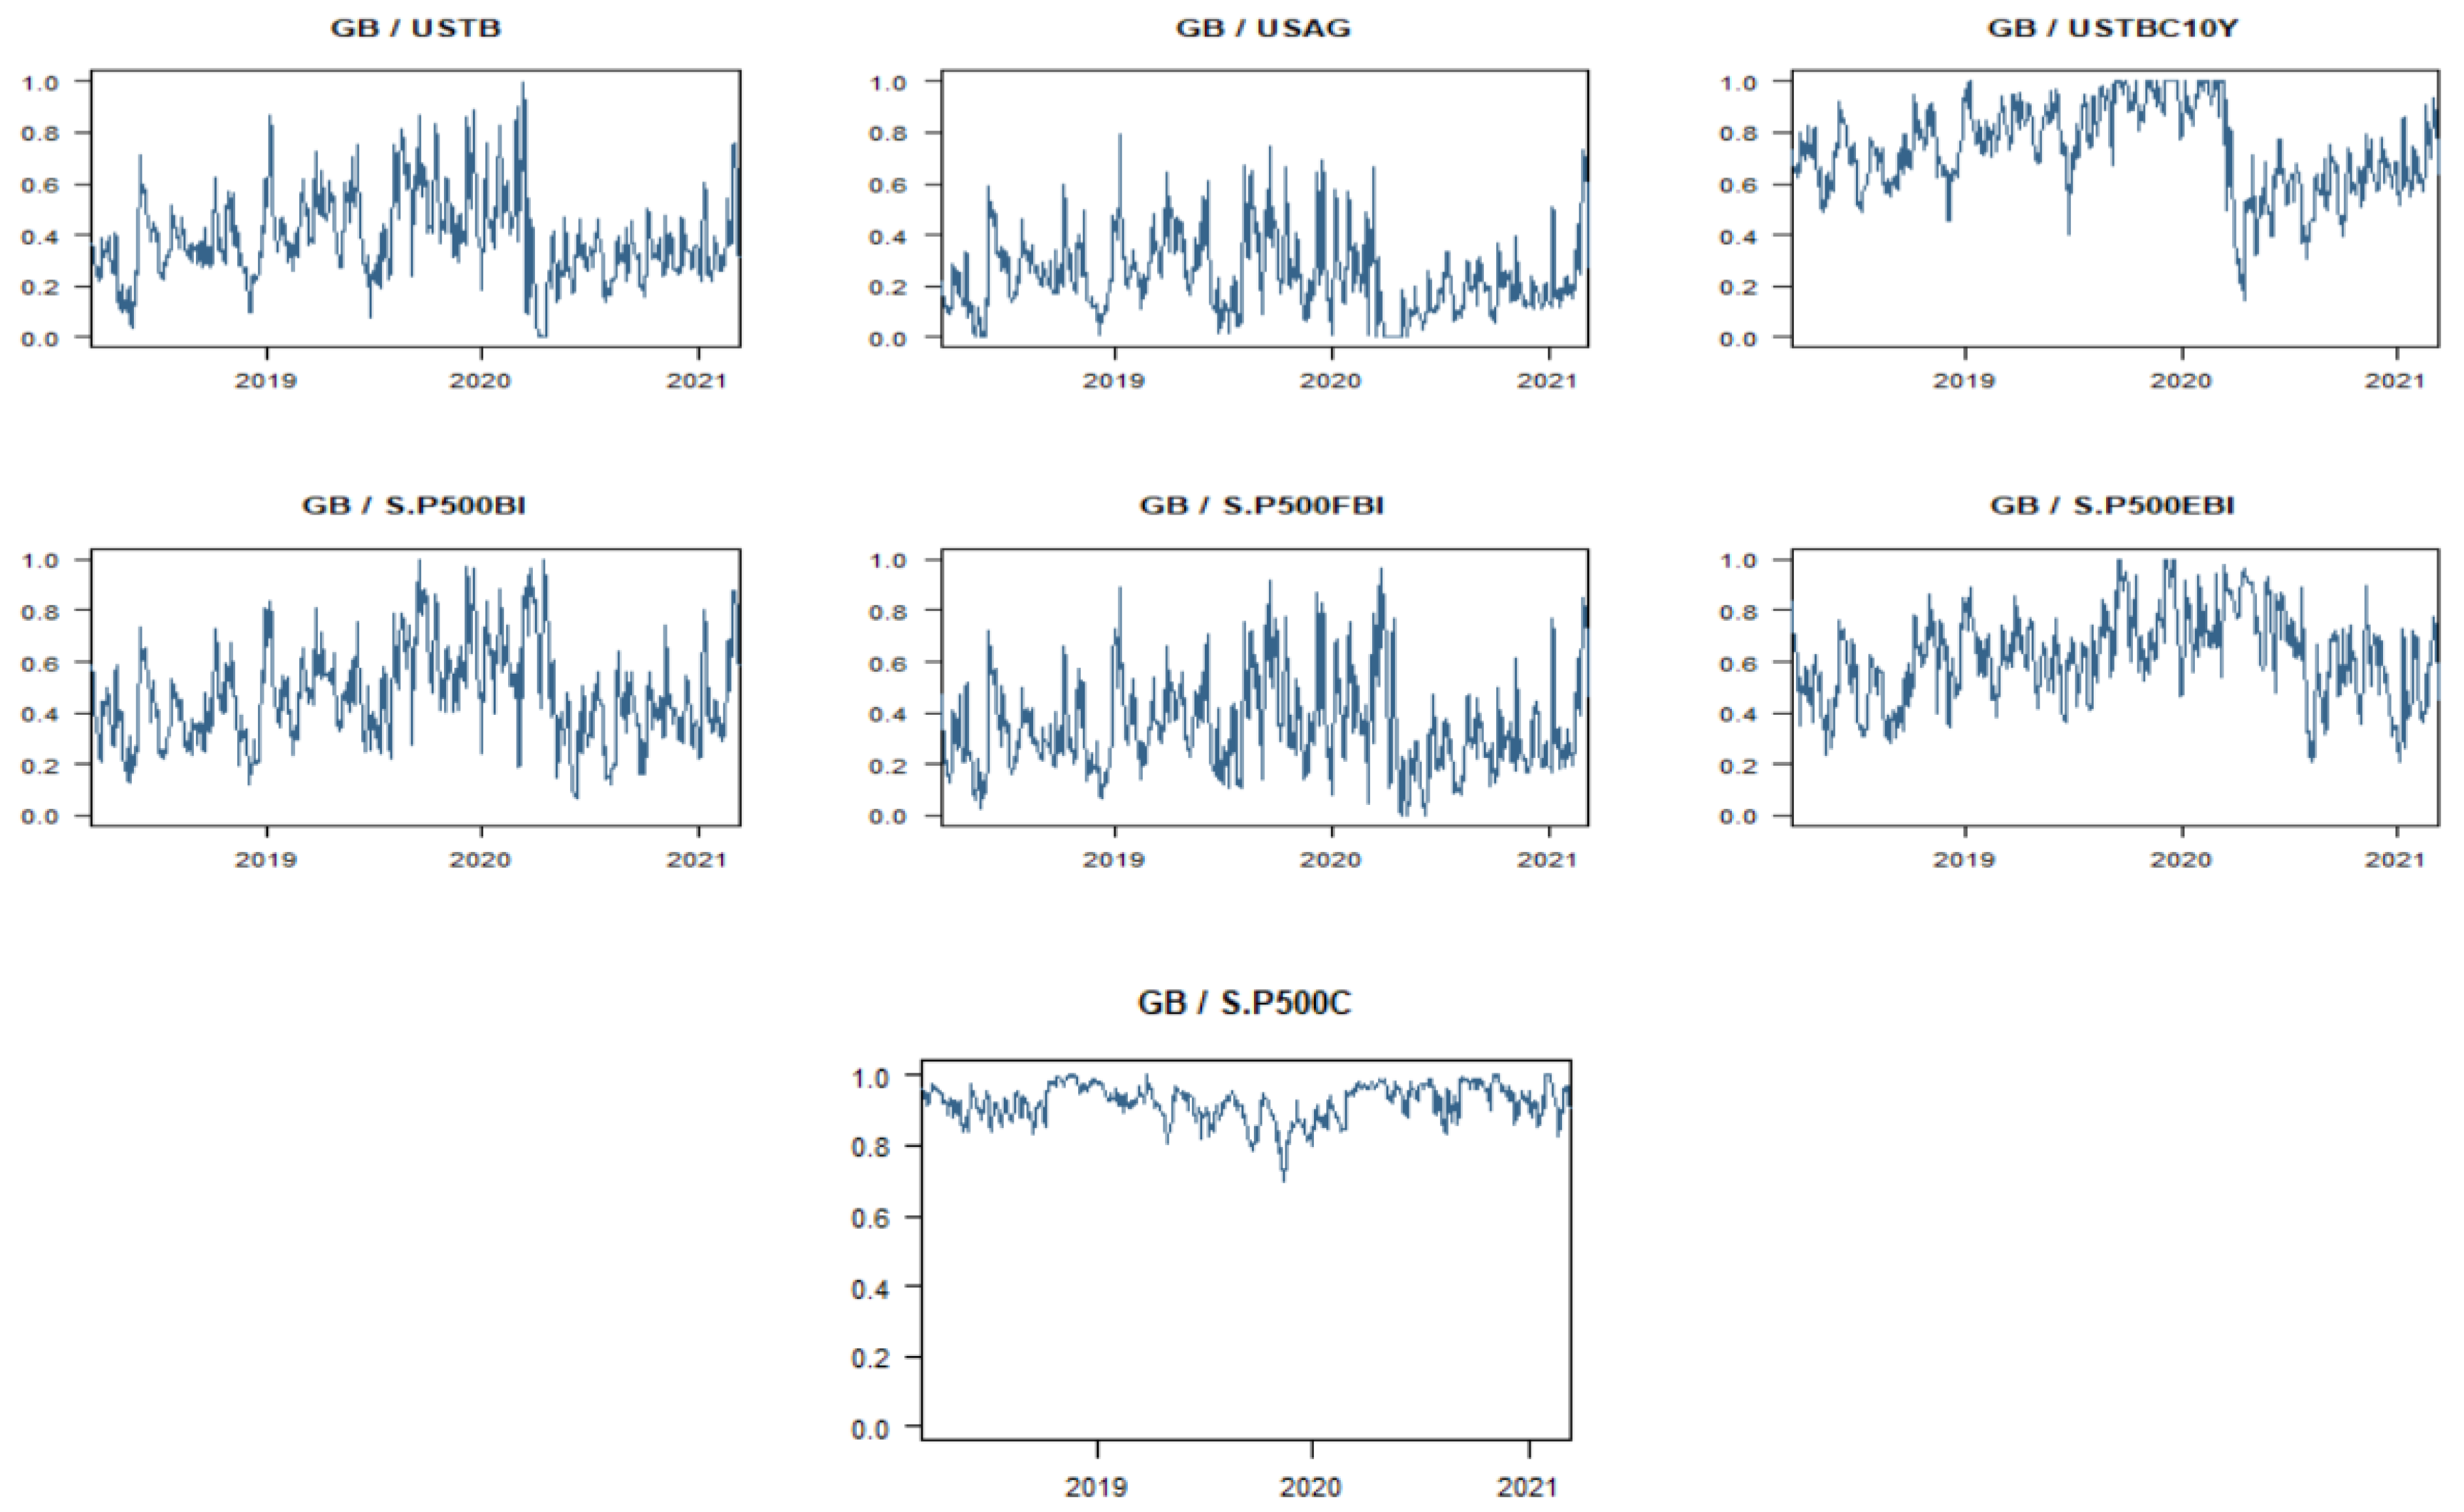
Figure 15 shows the portfolio weights of green bonds with other financial markets. The portfolio weights are highest in the case of green bonds and the S&P 500 composite index and least in case of green bonds and the S&P 500 financial index.
Table 3 gives the description on hedging ratios of green bonds with other financial markets. The mean was highest for the S&P US aggregate bond index, followed by the S&P financial bond index. The hedging ratio is negative for green bonds fused with the S&P 500 composite. According to the standard deviations, the green bonds and S&P 500 composite is the riskiest.
Table 4 provides details on portfolio weighting. According to the mean, the portfolio weighting is the highest for green bonds and the S&P 500 composite, while it is least for green bonds and the S&P US aggregate bond index. According to the standard deviations, the fusion of green bonds and the S&P 500 financial bond index is the riskiest, while the S&P 500 composite index is the least risky.
6. Conclusions
This paper aims to examine the relationship between green asset and other financial markets, especially during the outbreak of COVID-19. Specifically, we use the QVAR approach as the estimation techniques using daily spot prices from 9 March 2018 to 10 March 2021. We use the S&P 500 green bond index as a representative of the global green bond market. For other financial markets, we use spot prices of the S&P U.S. treasury bond index, S&P US aggregate bond index, S&P US treasury bond current 10Y index, S&P 500 bond index, S&P 500 financials index, S&P 500 energy index and S&P 500composite index.
The results Indicates that the degree of connectedness between green bonds and other financial assets intensifies during the period of financial crisis as compared to normal period. The results are aligned with the findings of
Naeem et al. (
2021a,
2021b) and
Pham and Nguyen (
2021). There is also an evidence of excess return spillovers at the mean and median as compared to lower and upper tails, thereby adding to the mean-based literature on spillovers in the green bonds market (
Nguyen et al. 2020;
Naeem et al. 2021a,
2021b;
Ferrer et al. 2021;
Reboredo and Ugolini 2020). Furthermore, we provide evidence that a network of connectedness evaluated at the conditional mean is sufficient enough to reflect the degree of connectedness spillovers associated at the extreme ends. The results also indicate that green bonds are strongly connected with treasury bonds, aggregate bonds and bond index. The reason behind it could be that these markets share a similar pattern in terms of credit risk, coupon rates and maturity. Although they are weakly connected the S&P composite index and energy index, the green bonds market is unaffected by price fluctuation in these markets. Hence, investors can combine these assets in their portfolio for hedging and diversification.
Our findings have several implications. The findings have important implications. From a practical perspective, the results of directional volatility spillover documented in this paper can help market participants with different investment targets to adopt better hedging strategies and portfolio diversification to aid optimal policy measures during volatile market conditions. The paper also aims to promote the participation of investors in green bonds market. Moreover, the issuance of green bonds aids corporate houses to fulfill their social commitments. In addition, the results can succor in predicting the future volatility of green assets. Alternatively, the outcome of the study can be useful for financial institutions to predict future market trends between green assets and other financial markets. To sum up, our research can be of great significance while framing strategies for including green bonds in asset allocation for portfolio performance and hedging risks. From an academic standpoint, an analysis based directional volatility spillover will capture the quantile distribution at extreme quantiles. It captures the way prevailing market conditions can impact the level and intensity of connectedness. In addition, the assumption that market participants and economic agents are homogeneous is not empirically documented. Hence, it is essential that any analysis of the relationship between green bond and other financial markets take into account the premise that economic agents are homogeneous. From the policy perspective, policy makers’ understanding and knowledge of volatility shocks spillover can aid in framing policies to curb financial instability, particularly during the times of financial crisis. It will aid framing policies needed to mitigate the financial impact of the COVID-19 pandemic on the spillover of shocks between green bonds and other financial market. The outcomes of the study can be beneficial for stakeholders to frame decisions related to portfolio allocations. It will also aid in facilitating the optimization of portfolio risk. Finally, it will aid in framing the policy needed to mitigate the financial impact of the COVID-19 pandemic on the spillover of shocks between green bonds and other financial market. It can be beneficial to market participants who mostly to hedge their portfolio risk by fusing green bonds with other financial assets. As the study includes a large number of financial assets, it can aid investors to explore the impingement of these assets on green bonds for portfolios. Future research can make a comparison of the connectedness of green bonds with other financial markets during a financial crisis with a non-crisis period. Studies can also investigate the correlation of green bonds with each sub sector of the financial market. Furthermore, researchers can use dynamics of QVAR switch between different regimes.


 ,
, 


