Article

The Spillover of Inflation among the G7 Countries

1
Department of Economics, Finance and Real Estate, Mitchell College of Business, University of South Alabama, 5811 USA Drive South, Mobile, AL 36688, USA
2
Department of Economics and Finance, Rajagiri Business School, Cochin 682039, KL, India
3
School of Business and Economics, North South University, Dhaka 1229, Bangladesh
4
Graduate School of Economics and Management, Ural Federal University, Mira Str., 19, 620002 Ekaterinburg, Russia
*
Author to whom correspondence should be addressed.
J. Risk Financial Manag. 2021, 14(8), 392; https://doi.org/10.3390/jrfm14080392
Submission received: 30 July 2021 / Revised: 16 August 2021 / Accepted: 16 August 2021 / Published: 21 August 2021
(This article belongs to the Special Issue Applied Financial Econometrics)

Abstract

:
Many global shocks, including the renegotiation of NAFTA, the United States–China trade war, the Brexit, and the COVID-19 pandemic, may have recently influenced the inflation spillover in the G7 countries. The current literature overlooks the influence of these important events on the inflation spillover of the G7 countries. This study fulfills this gap and investigates the nature of inflation spillover in the short, medium, and long term. Using the monthly data from 1956:6 to 2020:12, the study finds that Japan and the United States are the main transmitters of inflation. International trade, purchasing power parity, low-cost technology, and the Abenomics policy were found to be responsible for the inflation spillover. We suggest that the central banks of these countries collaborate to achieve the targeted inflation rate.

1. Introduction

Since the global oil price shock in the mid-1970s, most central banks around the world have set maintaining price stability as their primary objective. The central banks of the G7 economies have established a leading role in this context. For example, Germany, Japan, and the United States have acted seriously to control inflation since the late 1970s (Clarida et al. 1998). Moreover, inflation targets were introduced in Canada and the United Kingdom in the 1990s (Johnson 2002). However, free trade, integrated monetary policies, observed and unobserved global shocks, etc., have contributed to the international spillover of inflation among the G7 countries over time. Therefore, the central banks of the G7 countries have been facing challenges to achieve the targeted inflation rate in recent years. Against this backdrop, this paper investigates the nature and extent of inflation spillover in the G7 countries.
The synchronization of inflation across different countries has attracted the attention of policymakers in recent years. International co-movement of business cycles (Monacelli and Sala 2009; Mumtaz et al. 2011), purchasing power parity (Gefang 2008; Chang et al. 2010), technology spillover (Henriksen et al. 2011), common economic shocks (Neely and Rapach 2011), common monetary policies (Tiwari et al. 2016), etc., are considered to be important factors for international spillover of inflation. Besides the origin of inflation spillover, a good understanding of its nature is also important to predicting future business cycles. Without proper knowledge about the mechanism of inflation spillover, countries may overestimate domestic development (Ciccarelli and Mojon 2010). In this respect, exploring the issue of inflation spillover is a vital topic in the macroeconomic and financial analysis literature. This topic has become more relevant in the current post-COVID-19 era in which G7 countries have adopted standard fiscal (coronavirus relief packages, tax cuts, business grant schemes, etc.) and monetary (decreasing policy interest rates, quantitative easing, etc.) policies that may create high spillover of inflation in this group of countries in the near future.
The G7 countries are the seven wealthiest and most advanced nations in the world. They are the leaders of the global business cycle. As O’Donnell (2015, p. 12) puts it, “The G7 countries are important global trading partners: Approximately one-third of all exports worldwide come from one of the G7 states and 35% of all goods and services imported have a G7 destination.” These seven countries produce almost one-third of the global real production (O’Donnell 2015). So, investigating the nature and extent of inflation spillover of the G7 countries is important to understanding their monetary policies that have an important impact on the global economy. Moreover, investigating the issue of inflation spillover of the G7 countries will provide knowledge about whether the central banks of these countries can independently set up their monetary policies to control inflation. In this respect, the objective of this paper is to examine the spillover of inflation in the G7 countries from 1956 to 2020.
A limited number of studies focused on measuring inflation synchronization among the G7 countries. Notably, Yang et al. (2006) applied a VAR approach for 1973–2003 to investigate the inflation spillover in the G7 countries. The impulse response functions and forecast error variance decomposition analysis of Yang et al. (2006) show the dynamics of inflation spillover over time, but the study overlooked the nature of inflation spillover in different time periods. The incorporation of the time dimension is important because the nature of inflation spillover may vary in the short, medium, and long term. For example, international prices of imported goods may affect domestic inflation only in the short term. Moreover, monetary policy transmission lags may create a co-movement of inflation across countries in the medium term. In addition, the purchasing power theory framework may create inflation spillover in the long term. Therefore, policymakers like to study the nature of inflation spillover in different time periods (terms) to make appropriate policies to control inflation and achieve price stability.
Diebold and Yilmaz (2012) (DY, 2012 hereafter) introduced a special approach of including the time dimension to investigate the volatility of spillovers. They used a generalized version of the variance decomposition methodology to obtain directional connectedness, which is known as the time-domain approach to the spillover process. Later, Barunik and Krehlik (2018) (BK, 2018 hereafter) proposed an extension of the Diebold and Yilmaz (2012) method that estimates the connectedness in the short, medium, and long term. The approach of Barunik and Krehlik (2018) is known as the frequency-domain approach. The time-domain approach of Diebold and Yilmaz (2012) has been used to analyze the co-movement of inflation for the G7 countries (Tiwari et al. 2015) and the co-movement of inflation for some Euro-area countries (Tiwari et al. 2016). Both the time-domain approach of Diebold and Yilmaz (2012) and the frequency-domain approach of Barunik and Krehlik (2018) have been used to analyze the co-movement of inflation for some Euro-area countries (Tiwari et al. 2019).
The frequency-domain spillover approach is better than other competing models because it helps policymakers identify the spillovers of inflation at different time frequencies (different terms). If the major spillover is observed at one frequency (term) and policymakers want to control inflation, they need to concentrate only on those factors that may control the spillover at exactly that frequency (term). Without the frequency-domain spillover approach, policymakers may concentrate on factors that may control inflation in the short and medium term while inflation may need to be controlled in the long term. Therefore, the frequency-domain spillover approach helps the central banks of the G7 countries formulate appropriate policies to target/control inflation in different terms.
The current paper contributes to the literature in three ways. First, this is the only paper that applies the Barunik and Krehlik (2018) methodology to explain inflation spillovers for the G7 countries. Therefore, it explains the differences in inflation dynamics in the short, medium, and long term for the G7 countries, which are important to policymakers. Second, this study covers the time period of 1956–2020. Compared with Tiwari et al. (2015) that covers the time period of 1955–2012, the current study covers eight more years. During these eight years (2013–2020), some important economic and political events occurred in the G7 countries that may have influenced the co-movement of inflation in these countries. For example, the declaration of the renegotiation of NAFTA, the trade war of the United States with China, the Brexit referendum, and the COVID-19 pandemic may have influenced the spillover of inflation in G7 countries. This current paper includes the impact of all these important events to examine the dynamics of inflation spillover. So, the paper provides up-to-date and more sophisticated results compared with Tiwari et al. (2015). Third, the paper highlights the importance of American technology spillover and the Japanese Abenomics policy, among other things, as potential determinants of inflation spillover of the G7 countries. These two factors, as determinants of inflation spillover, remain relatively unexplored in the current literature.
This paper shows that the United States is one of the most prominent net transmitters of inflation to Canada, but not the other way around. The paper also discovers that the United States is a major net transmitter of inflation in the short term. In addition, it is found that Japan is a major net transmitter of inflation in the medium term. Moreover, the paper reveals that Japan and the United States are major net transmitters of inflation to the other G7 countries in the long term. The results also show that the degree of inflation spillover in the G7 countries varies across different terms. The paper concludes that, in this integrated global and financial–economic system, central banks have little independence to control inflation or target a specific inflation rate.
The rest of the paper is organized as follows. Section 2 provides a review of the literature. Section 3 describes the methodology. Section 4 presents the data and motivation for using the Diebold and Yilmaz (2012) and Barunik and Krehlik (2018) approaches. Section 5 presents the estimation results. Section 6 provides the economic explanations of the results. Finally, the last section provides concluding remarks with some policy suggestions.

2. Review of Literature

The concurrent movement of inflation rates across different economies has become an interesting topic in empirical research. Some of the possible factors of inflation spillover and related literature are described below.

2.1. Business Cycle and International Co-Movement

Kose et al. (2003) use a 60-country sample from OECD and non-OECD countries to show that the world business cycle well explains the co-movement of inflation in more developed and stable economies. On the other hand, they find that country-specific cycles better explain the co-movement of inflation in developing economies. According to Bernanke (2007), globalization and trade may affect domestic inflation. He argues that domestic inflation is influenced by the prices of imported goods, competitive pressures of globalization, pressures on resource utilization in foreign economies, etc.
Using a cross-section of data on 948 consumer price index products of France, Germany, the United Kingdom, and the United States, and applying a linear dynamic factor model, Monacelli and Sala (2009) investigate the contribution of international factors to the dynamics of inflation. The authors find that there is a positive and statistically significant relationship between international factors and domestic inflation. Mumtaz et al. (2011) use data on 36 countries, including countries in North and South America, Asia, Europe, and Oceania, over the period of 1860–2000 and find that international co-movements within regions contributed most of the fluctuations in inflation after World War II.

2.2. Common Macroeconomic Shocks

Using quarterly data on Australia, Canada, Germany, Japan, the United Kingdom, and the United States over the period of 1960–2006 and Austria and France from 1970 to 2006, Henriksen et al. (2011) apply a Taylor-rule-based recursive equilibrium model to show that a technology spillover shock may create fluctuations in inflation across countries.
Besides technology shocks, oil price shocks and uncertainty shocks are also important to inflation spillover. A rise in global oil prices (an oil price shock) or a rise in economic policy uncertainty (an uncertainty shock) may affect inflation through the aggregate demand–aggregate supply framework. Through international linkages, this inflation may spill over to other countries (see Wang and Wen (2007)). A recent paper by Istiak and Alam (2019) investigates the response of inflation expectations to oil price and economic policy uncertainty shocks. The paper finds that oil price shocks have a positive effect on inflation expectations and uncertainty shocks have the opposite effect on inflation expectations.
Global factors are also responsible for inflation spillovers. Ciccarelli and Mojon (2010) use quarterly inflation data on 22 OECD countries over the period of 1960–2003 to estimate global inflation. Using an error correction mechanism, the authors find that the effect of global inflation is weaker (stronger) on domestic inflation for countries with a strong (weak) commitment to price stability. Neely and Rapach (2011) use a dynamic latent factor model to decompose the inflation rates of 64 countries into regional, world, and idiosyncratic components. The authors find that 16% and 35% of the annual inflation variability could be explained by the regional and world components, respectively, across countries. The authors conclude that common economic shocks, international trade, similarities in the central bank actions, etc., may produce similar components in inflation rates.
Osorio and Unsal (2013) investigate the inflation dynamics of Asian countries using a global VAR model. The authors argue that, as most of the Asian countries import a large number of goods and services from China, an inflationary shock in China quickly spills over to inflation in other Asian economies through the trade effect. By using a dynamic factor model, Aastveit et al. (2016) explore the degree of variation in domestic variables by global factors. The paper demonstrates that external shocks (regional and world shocks) reflect 50%–70% of the variance in important economic variables, such as GDP, investment, and inflation.

2.3. Market-Driven Forces

Rogoff (2003) argues that globalization, deregulation, and an increased role of private sectors in many countries have increased competition in both labor and product markets. As a result, the price level has decreased in many countries. According to the factor price equalization theory, lower prices and inflation in one country may affect the inflation of its neighbors or trading partners.
By using the post-World War II dataset for 18 OECD countries, Wang and Wen (2007) show that the dynamics of inflation are highly synchronized across the countries. The authors find that the average correlation of inflation in their sample OECD countries is 0.6. The paper predicts that non-monetary shocks may be responsible for the inflation dynamics. Beck et al. (2009) investigate the inflation dynamics in the Euro area by decomposing regional inflation rates into regional and national components. By using a factor model framework, they find that some common features, such as developments in the Euro area, changes in oil prices, monetary policies, and exchange rate movements, explain almost 75% of the variability in the regional inflation.

2.4. Common Monetary Policies and Purchasing Power Parity

Yang et al. (2006) use a VAR model to analyze the inflation spillover among the G7 countries over the period of 1973–2003. They find that the aggressive nature of the federal reserve system to control domestic inflation protected the United States from the inflation of other countries (particularly from Germany and France). They also find that U.S. inflation has a relatively larger influence on the inflation of Canada and the United Kingdom. Using multiple correlations and multiple-cross-correlation-based wavelet analysis, Tiwari et al. (2016) investigate whether the inflation of four main European economies are synchronized. The results indicate that inflation correlations are stronger in the long term. The authors conclude that similar monetary policies may be responsible for the high correlation.
Besides the monetary policy, the theory of purchasing power parity (PPP) also plays a significant role in inflation spillover. In this regard, Gefang (2008) provides strong evidence that PPP holds between the United States and each of the other G7 countries. Moreover, Chang et al. (2010) find that the theory of PPP works for most of the G7 countries. So, PPP is an important factor for inflation spillover in the G7 countries.
Tiwari et al. (2015) use data from January 1955 to June 2012 and wavelet analysis to investigate the coherency and the phase relationship of inflation rates for the G7 countries. Their results indicate that the inflation co-movements vary across different terms for the G7 countries. The paper argues that the PPP theory is responsible for the long-term co-movement of inflation.

3. Methodology

3.1. The Spillover Index Framework of Diebold and Yilmaz

Diebold and Yilmaz (2012) use the forecast error variance decompositions (FEVDs) of a generalized vector autoregressive (VAR) model to form the spillover index. From the n variate processes, x t = ( x t 1 ,   x t , n ) , the structural vector autoregression model, VAR (p), can be formed as
Φ ( L ) x t = ε t ,
where t = 1 , T , Φ ( L ) = h φ h L h is the n × n pth-order lag polynomial. ε t is a white-noise process with the covariance matrix ∑. If the roots of |Φ ( z ) | are situated outside of the unit-circle, the VAR model can be represented as
x t = Ψ ( L ) ε t ,
where ψ ( L ) is the matrix of lag polynomial coefficients. According to Diebold and Yilmaz (2012), the H-step-generalized FEVD is
( β H ) j , k = σ k k 1 h = 0 H ( ( ψ h ) j , k ) 2 h = 0 H ( ψ h ψ h ) j , j ,
where ψh is an n × n matrix of coefficients with lag h and σkk = (∑)kk. (βH)j,k implies the influence of the kth variable on the variance in the forecast error of the element j. The components of the decomposition matrix can be normalized in the following way
( β ˜ H ) j , k = ( β H ) j , k k = 1 n ( β ˜ H ) j , k , when   k = 1 n ( β ˜ H ) j , k = 1   and   j , k = 1 n ( β ˜ H ) j , k = N .
The measure of connectedness is
Y H = 100 × j k ( β ˜ H ) j , k ( β ˜ H ) j , k = 100 ( 1 T r { β ˜ H } ( β ˜ H ) j , k )
where Tr {·} is the trace operator. See Diebold and Yilmaz (2012) for a detailed analysis of forming the connectedness index.

3.2. The Spillover Index Framework of Barunik and Krehlik

The spillover index of Barunik and Krehlik (2018) is based on a frequency response function Ψ ( e i ω ) = h e i ω h ψ h . The function is based on the Fourier transformation of Ψ , with i = 1 . The generalized causation spectrum over frequencies ω = ϵ ( π , π ) can be defined as
( f ( ω ) ) j , k = σ k k 1 | ( Ψ ( e i ω ) Σ ) j , k ) | 2 ( Ψ ( e i ω ) Σ Ψ   ( e + i ω ) ) j , j ,
where Ψ ( e i ω ) is the Fourier transformation of Ψ h. In Equation (4), ( f ( ω ) ) j , k is the portion of the spectrum of the jth variable at frequency ω for the shocks to the kth variable. To obtain a breakdown of the original generalized forecast error variance decomposition to frequencies, ( f ( ω ) ) j , k can be weighted with the frequency share of the variance of the jth variable. In this regard, the weighting function is
Φ j ( ω ) = ( ψ ( e i ω ) Σ ψ ( e + i ω ) ) j , j 1 2 π π π ( ( Ψ ( e i λ ) Σ Ψ ( e + i λ ) ) j , j ) d λ
With the frequency band of d = ( m , n ) |   m , n ( π , π ) , m < n , the FEVD on some frequency band d is
( β d ) j , k = 1 2 π m n Φ j ( ω ) ( f ( ω ) ) j , k d ω .
If the scaled generalized forecast error variance decomposition on the frequency band d is represented as
( β ˜ d ) j , k = ( β d ) j , k k ( β ) j , k ,
the frequency connectedness is
Y d F = 100 ( j k ( β ˜ d ) j , k ( β ˜ ) j , k T r { β ˜ d } ( θ ˜ ) j , k ) .
Additionally, the overall connectedness can be represented as
Y d W = 100 ( 1 T r { β ˜ d } ( β ˜ d ) j , k ) .
See Barunik and Krehlik (2018) for a detailed analysis of forming the connectedness index.
The frequency connectedness index Y d F helps policymakers determine the nature and extent of the spillovers of inflation at different time frequencies. Therefore, the frequency domain spillover approach helps policymakers formulate appropriate policies to target/control inflation in the short, medium, and long term.

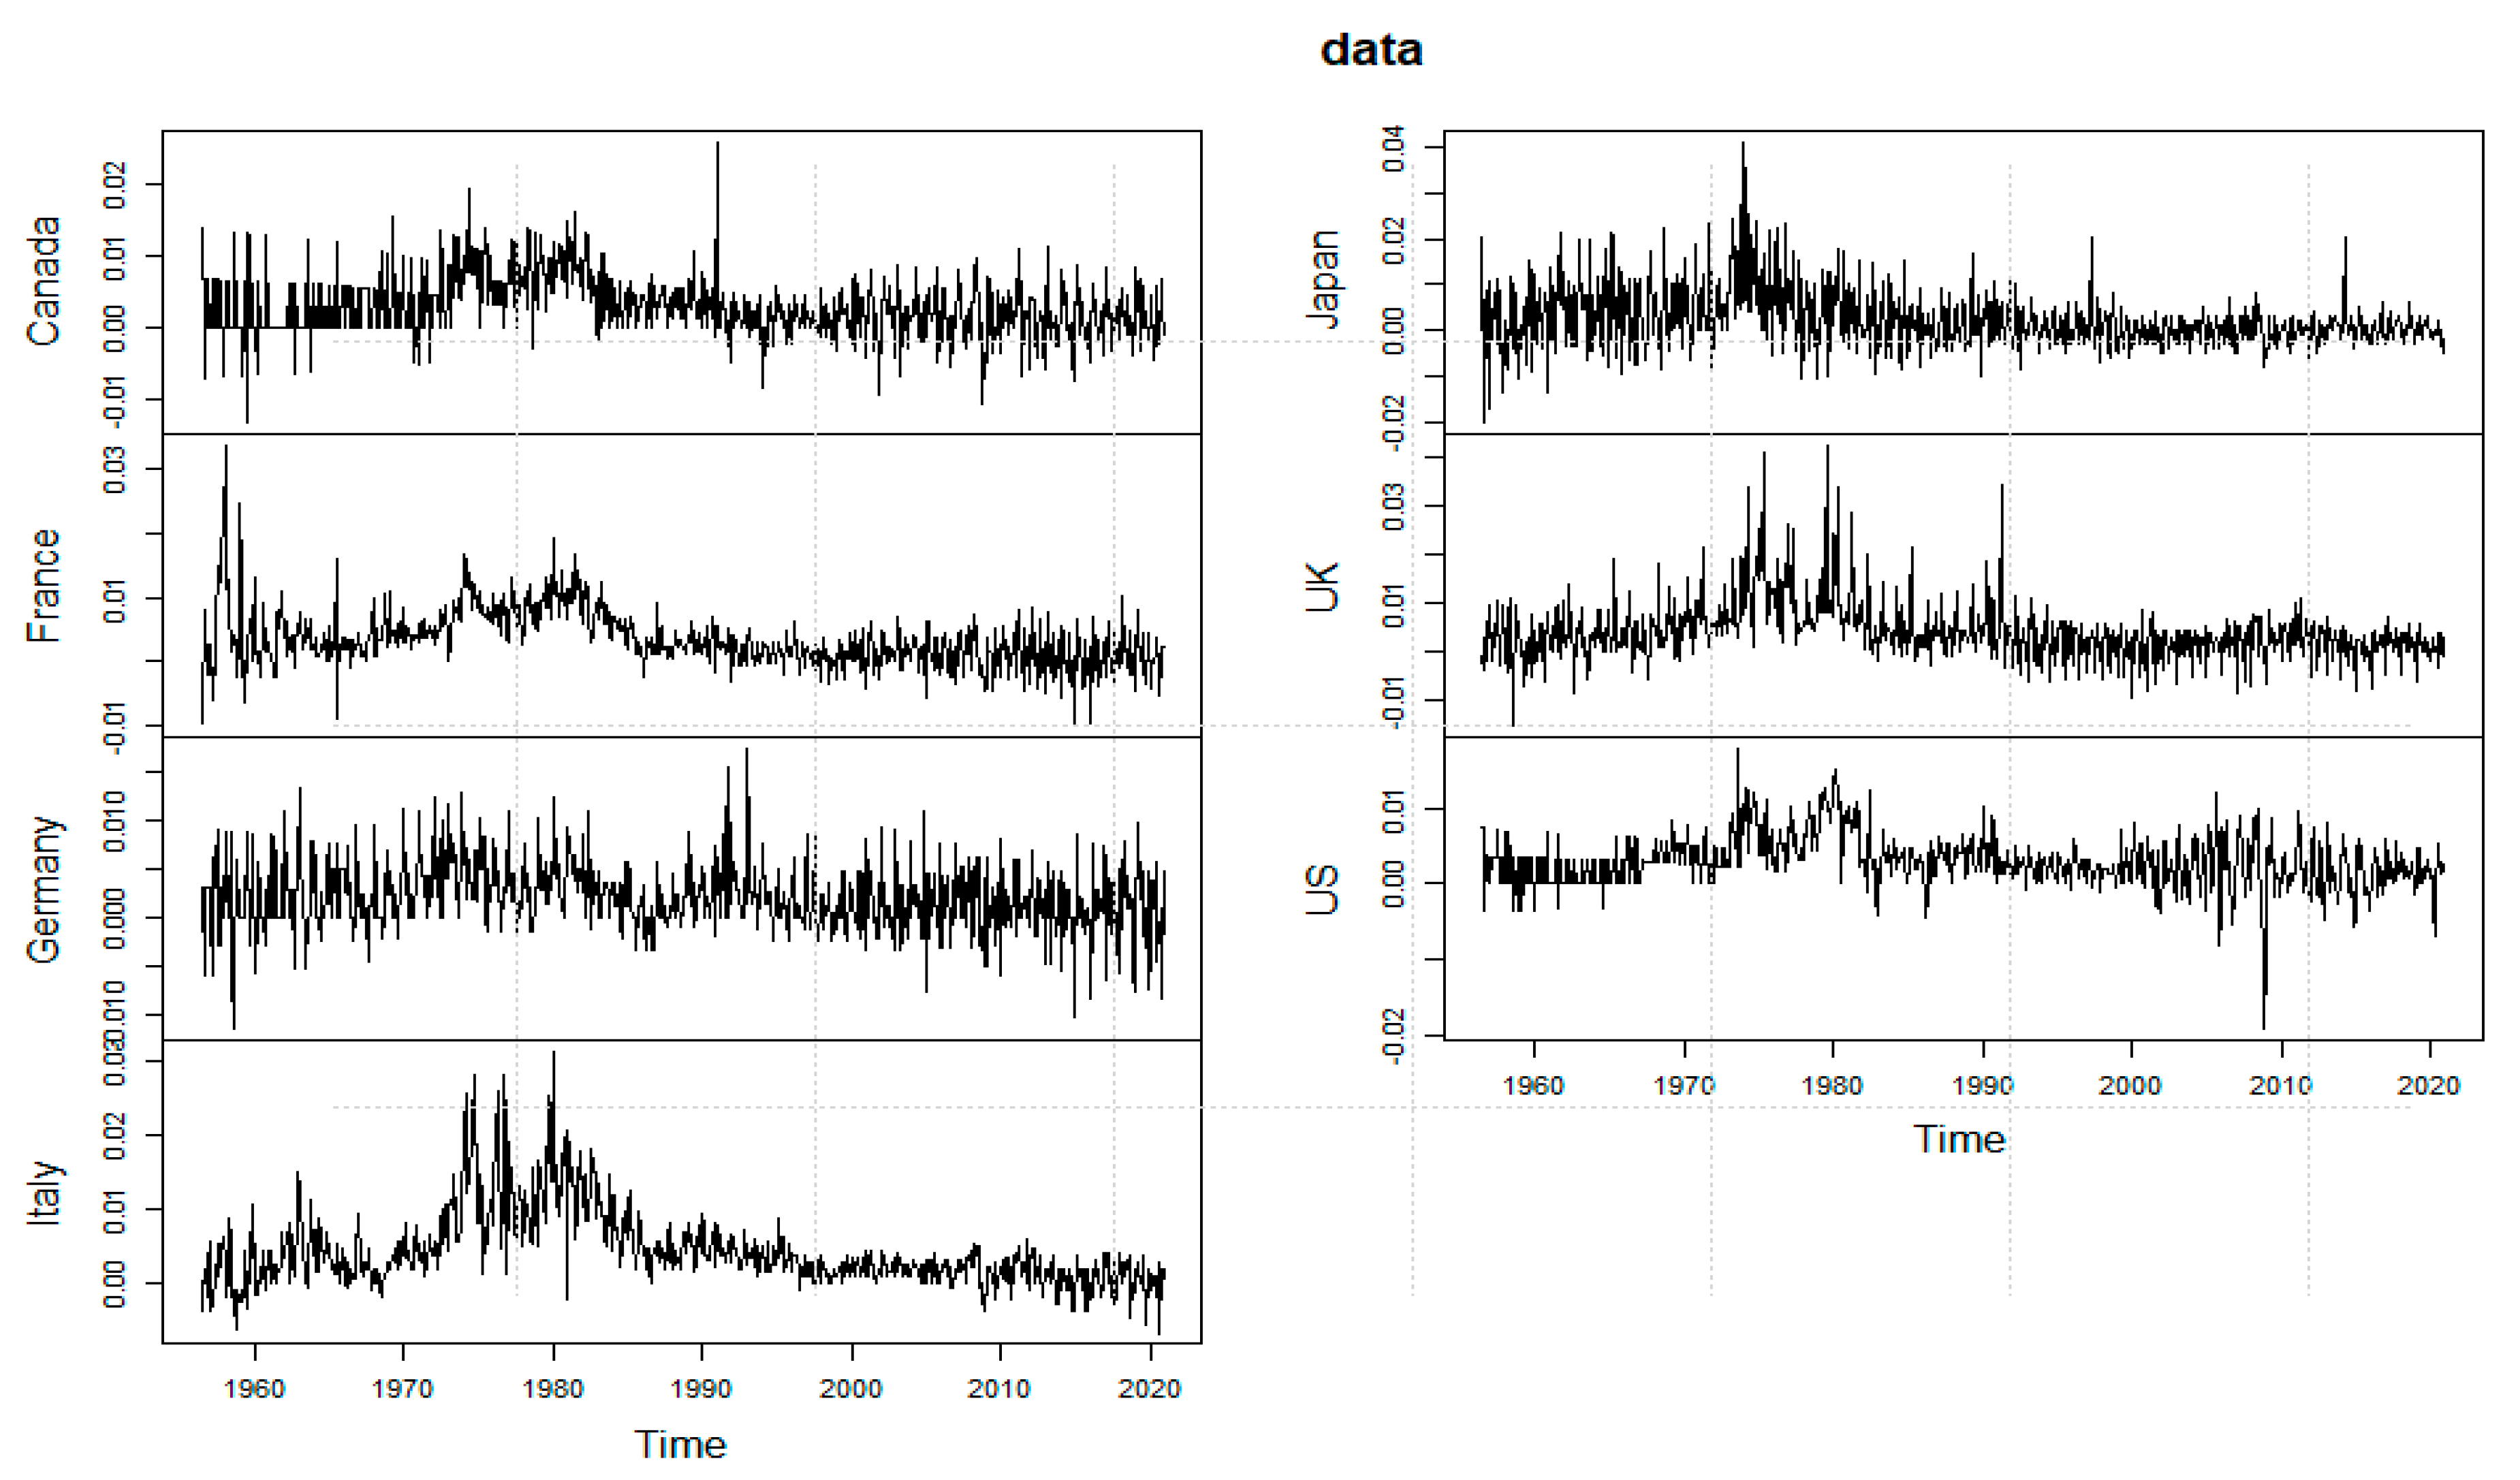
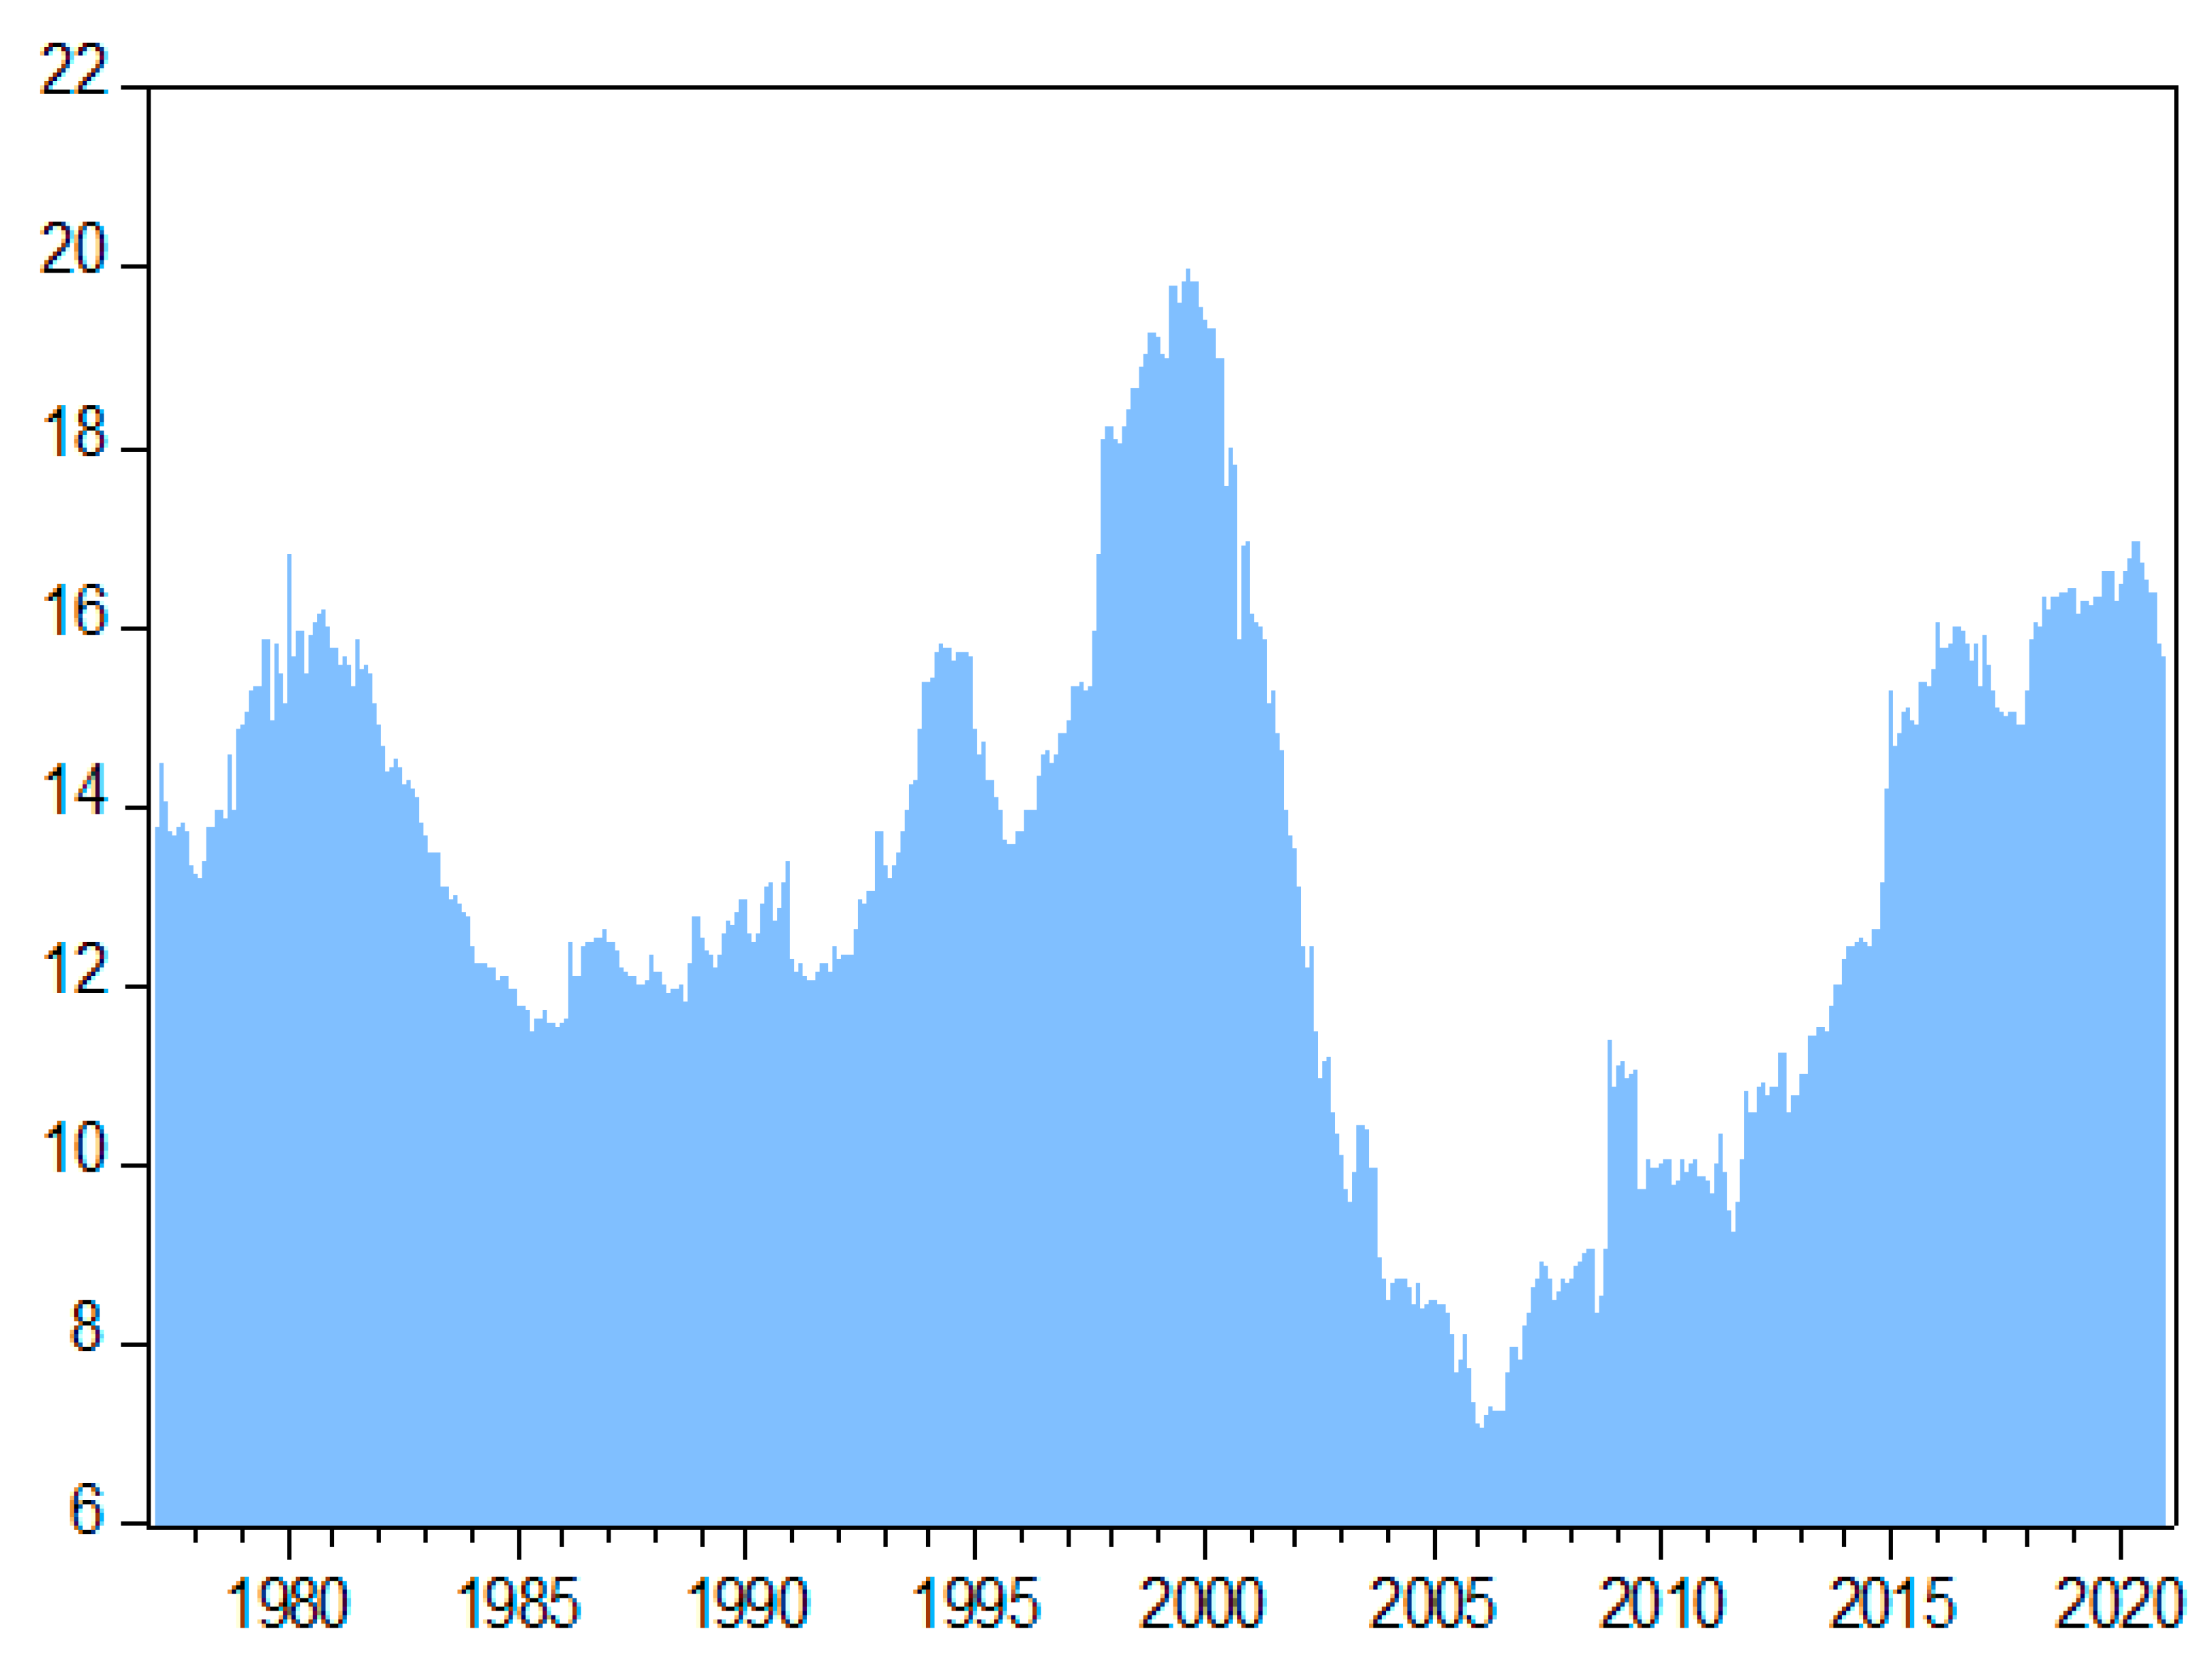
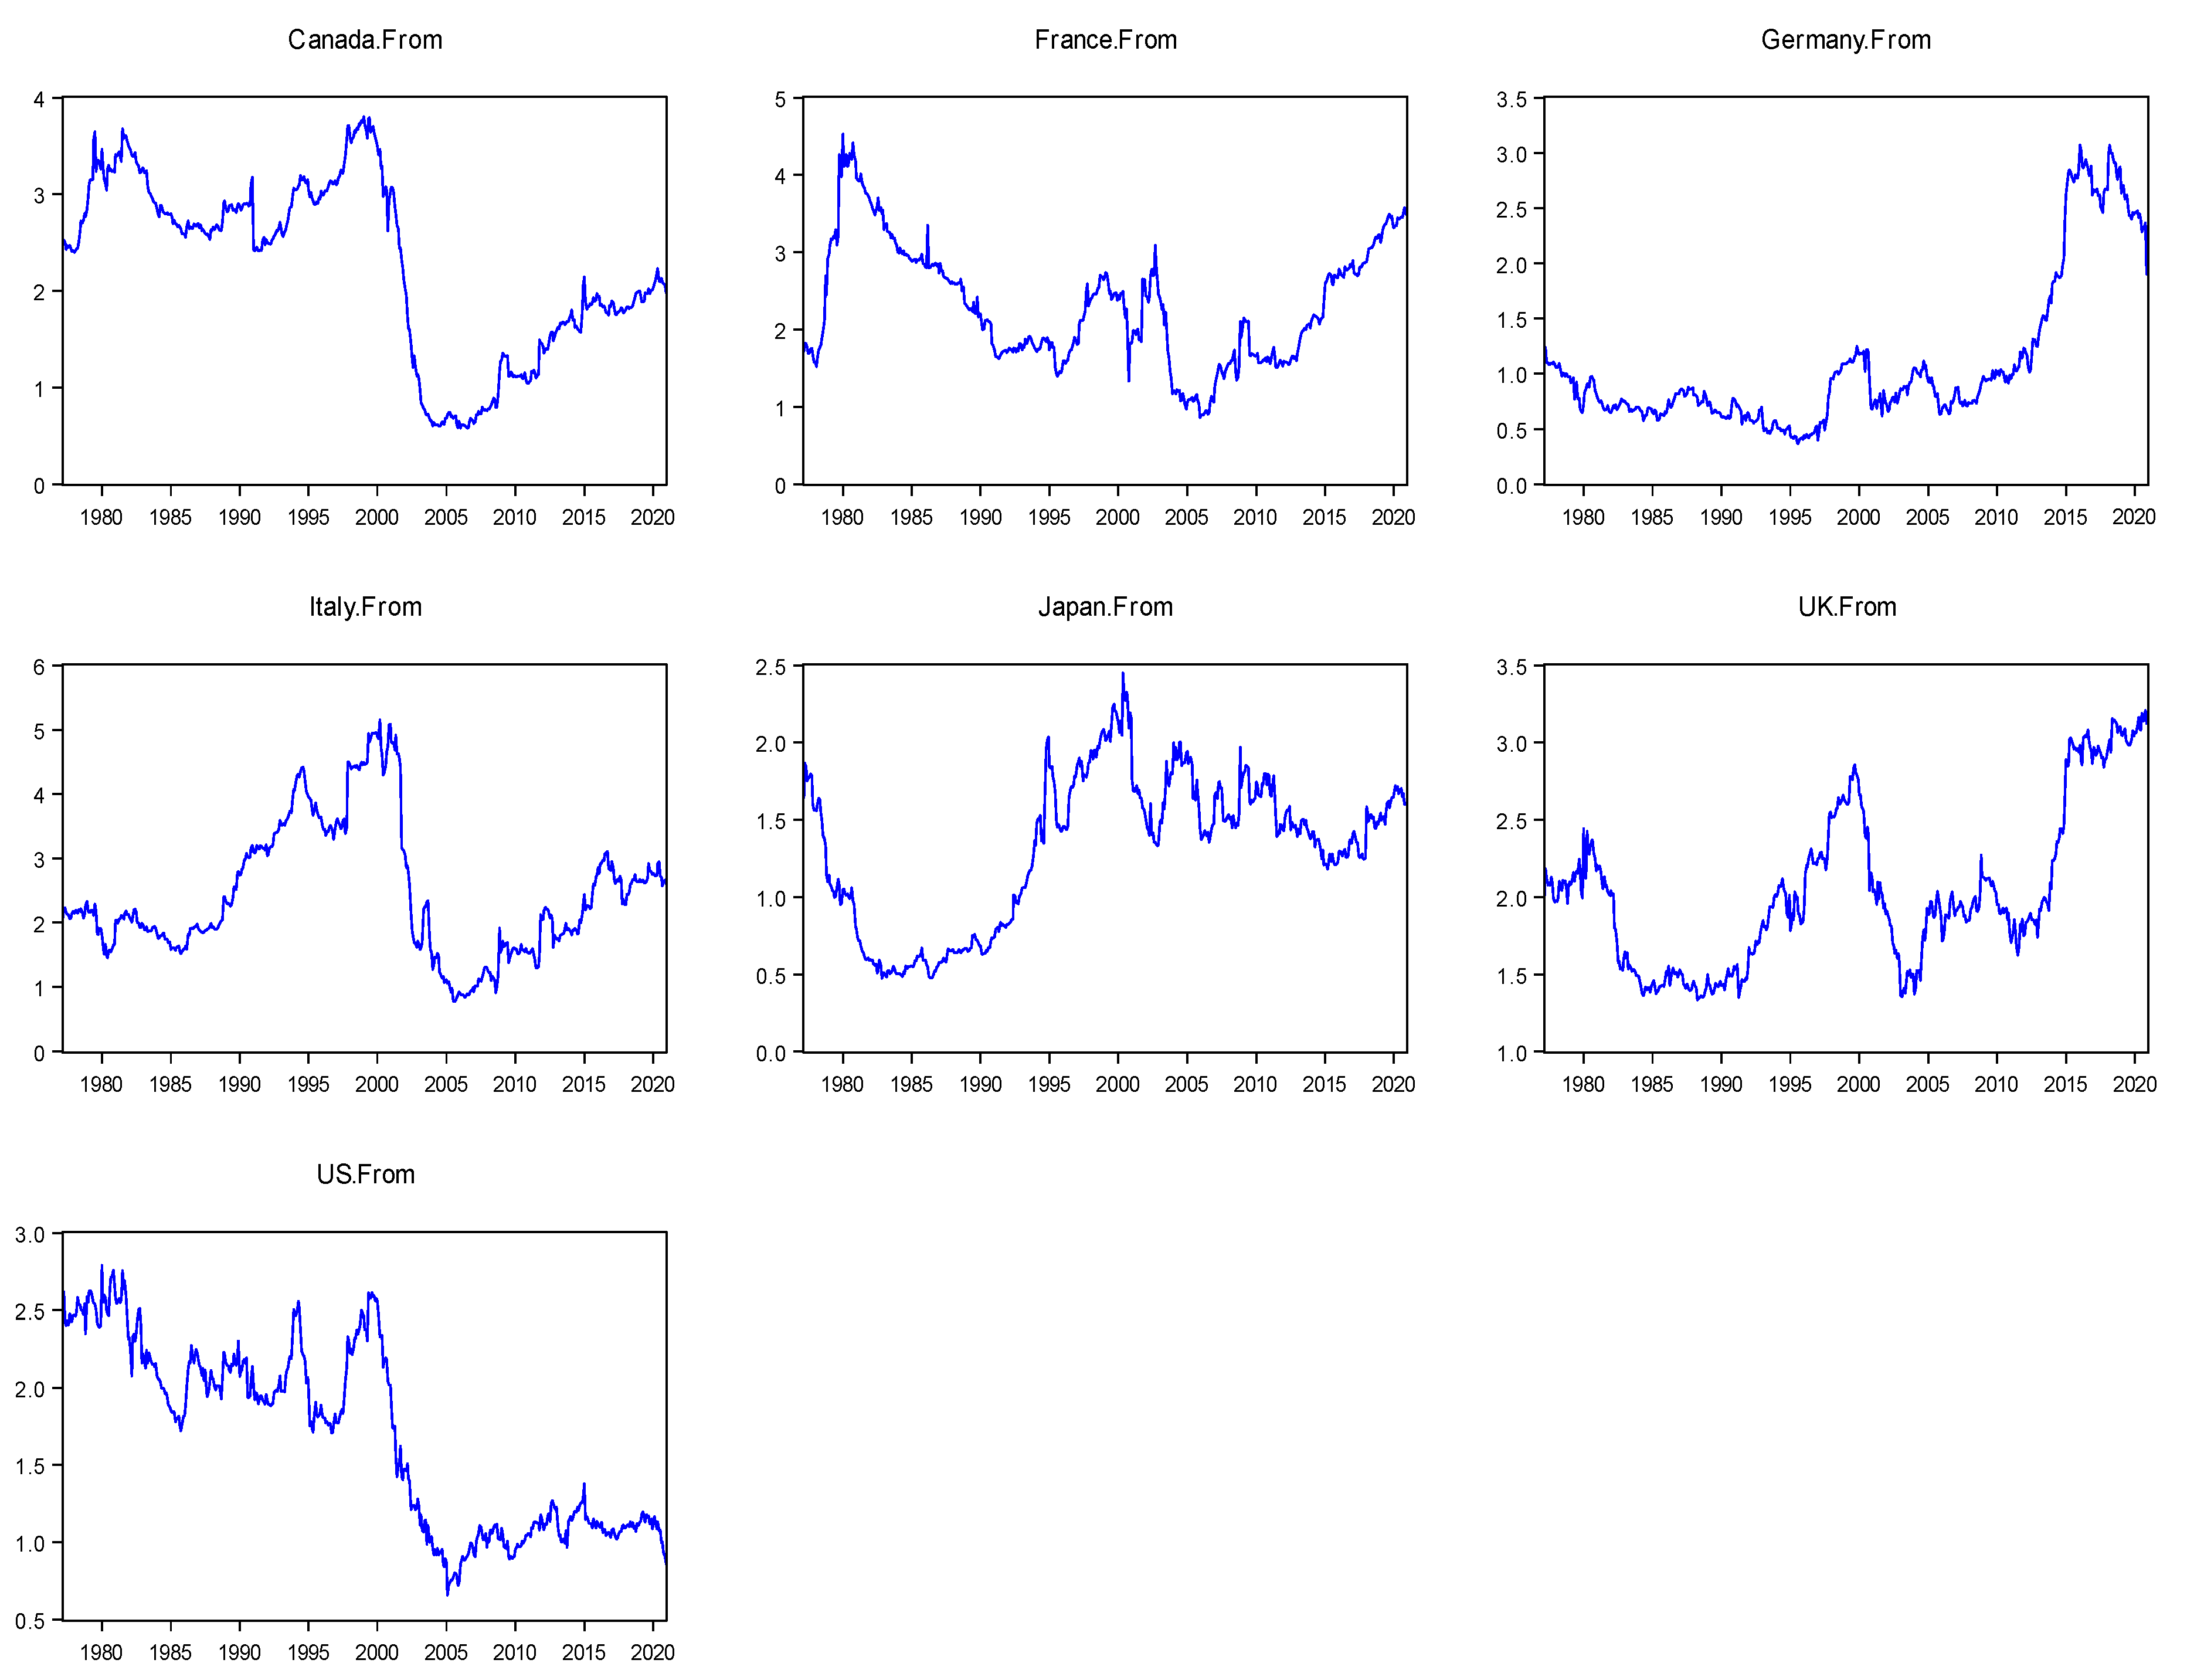
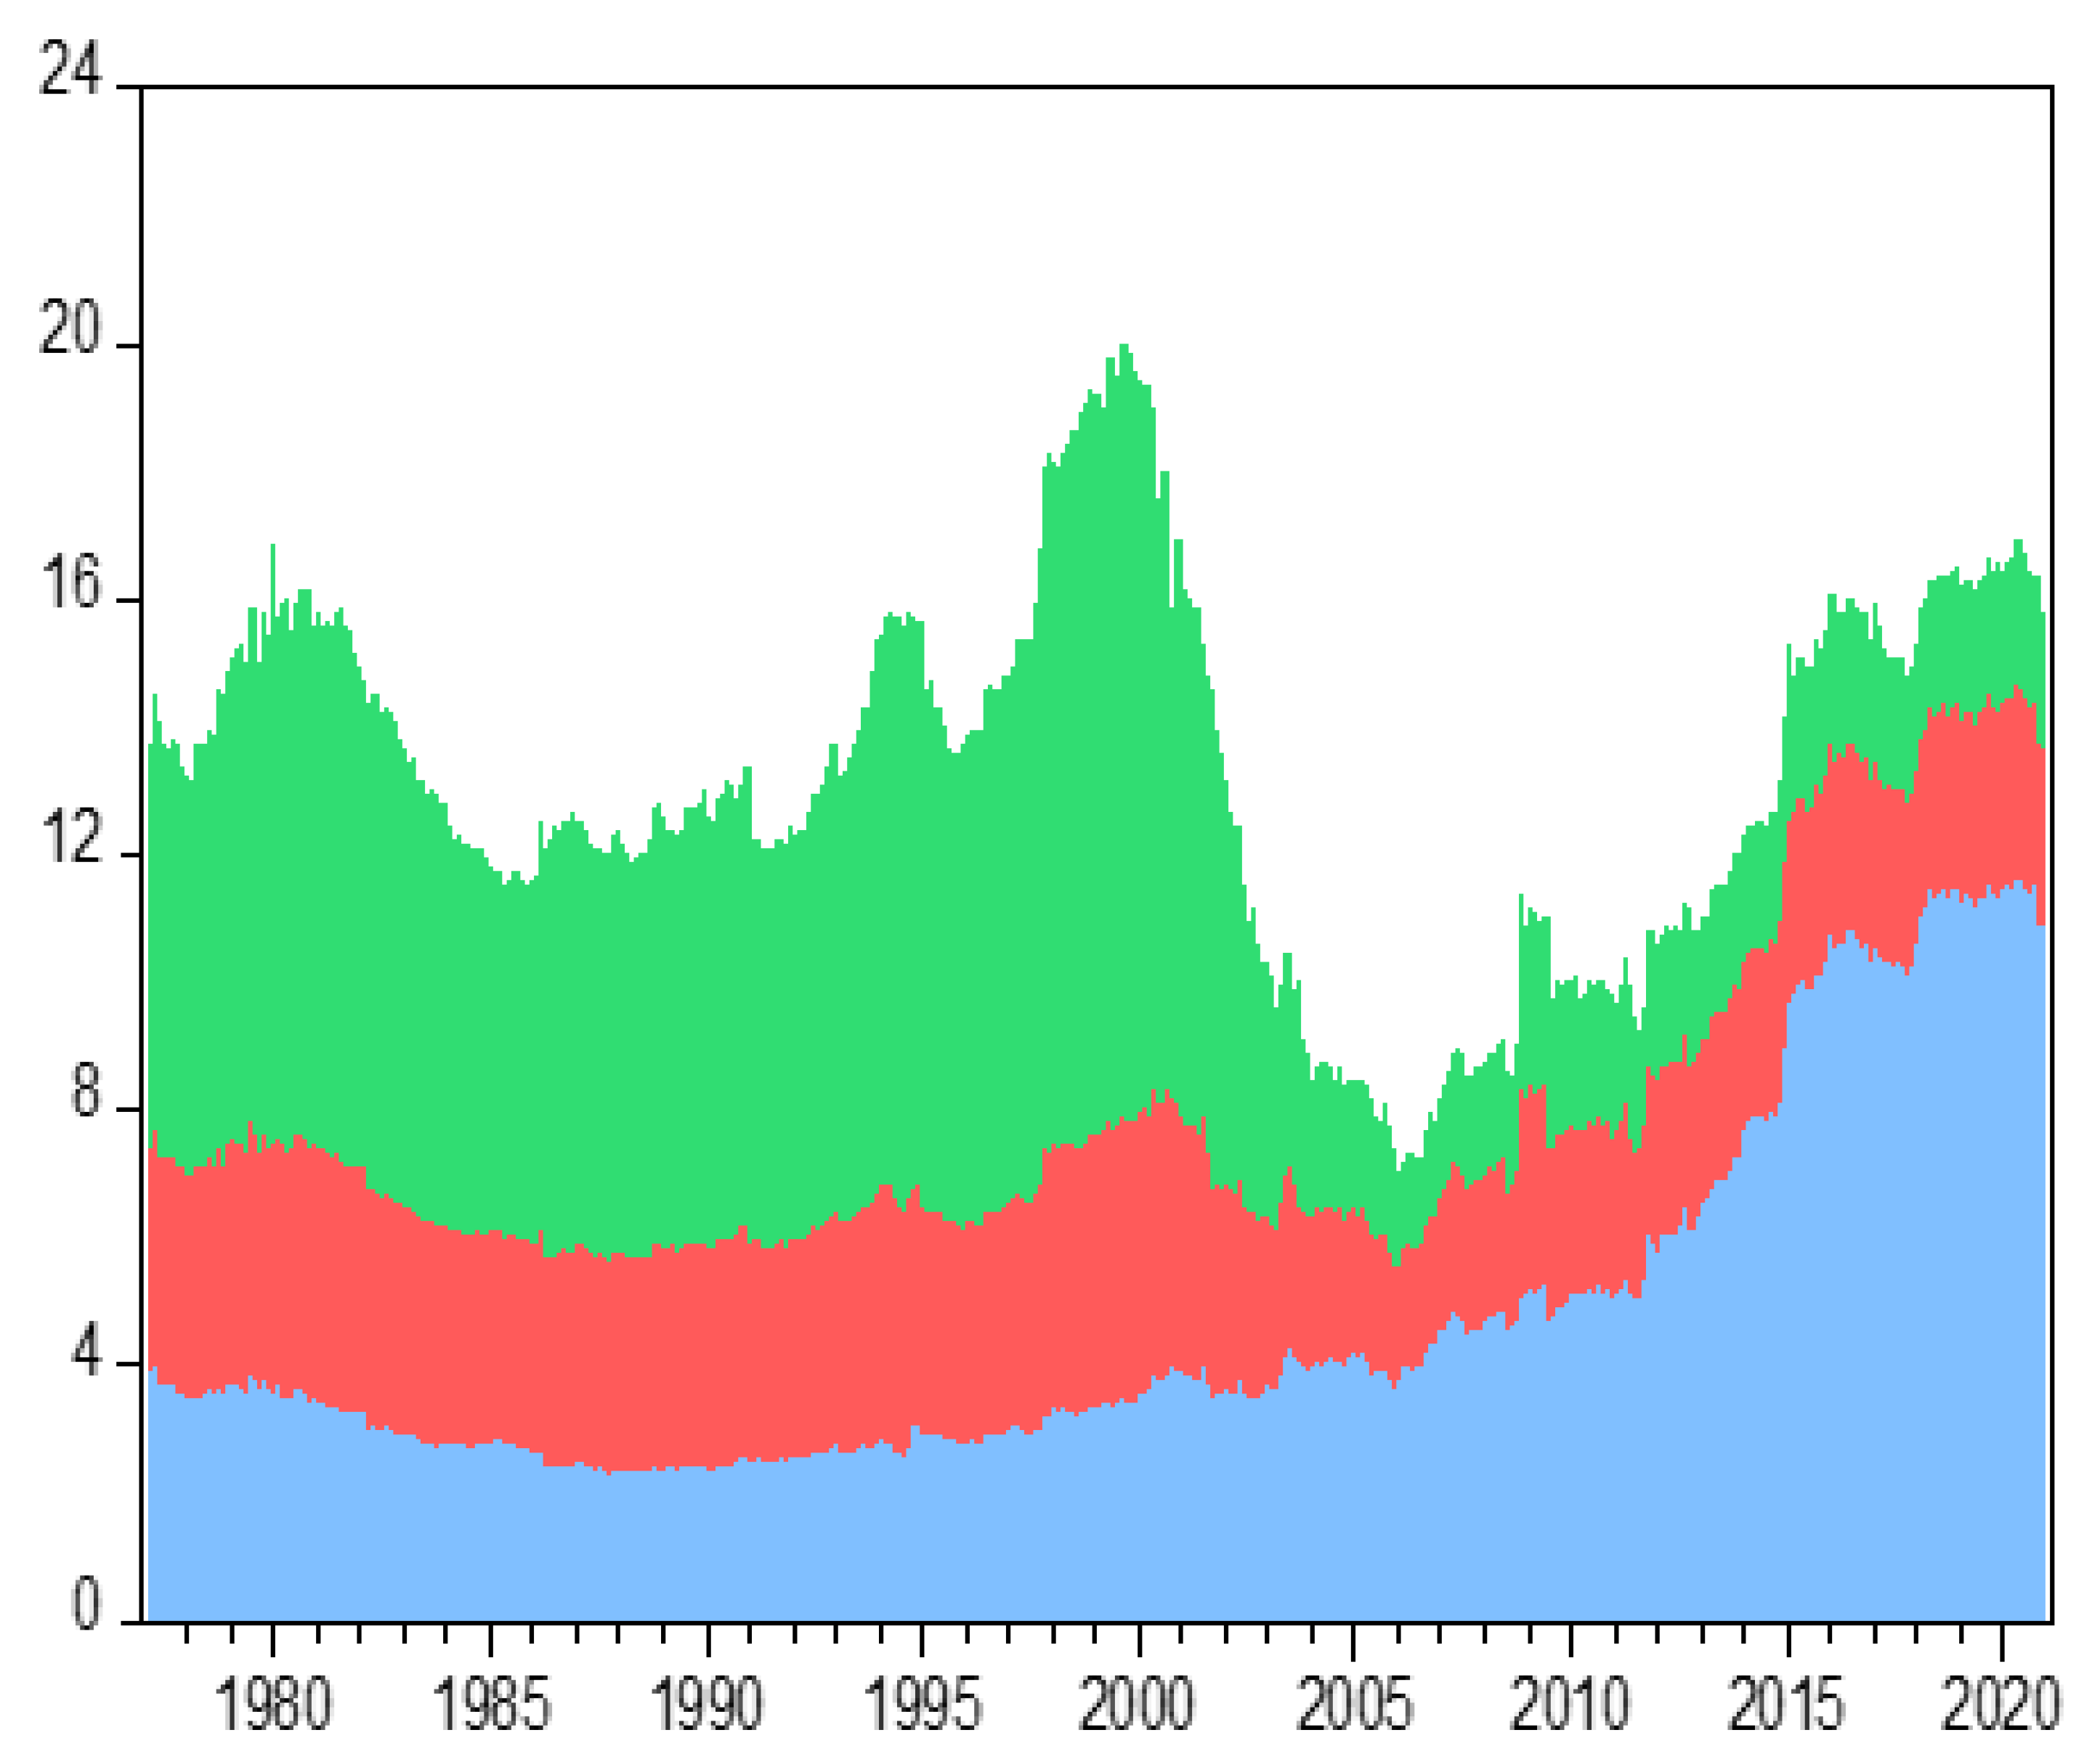
4. Data and Motivation

Figure 1 presents the inflation rates of the G7 countries for the period of 1956–2020. From the mid-1950s to the early 1980s, accelerating trends in annual inflation rates are observed for France, Italy, Japan, the United Kingdom, and the United States. The economic growth of these countries after the Second World War is responsible for this rising trend of inflation. The exogenous influence of the oil price crisis in the early 1970s and the substantial fall in financial asset prices also contributed to the increasing trend of inflation (Tiwari et al. 2019). For Germany and Canada, fairly stable and less volatile inflation rates are noticed over the full sample period. After the mid-1980s, different non-activist monetary policies created anti-inflationary trends in the G7 countries.
Table 1 presents the summary statistics of the inflation rate indices. The highest disinflation was found in Japan (Min = −0.02) and the highest inflation was found in the United Kingdom (Max = 0.042). The average inflation was the highest in Italy and in the United Kingdom (Mean = 0.004). Inflation was the most consistent in the United States (S.D. = 0.003).
As mentioned earlier, Yang et al. (2006) applied impulse responses and the variance decomposition approach to a VAR model for the period of 1973–2003 to investigate the inflation spillover in the G7 countries. Although the impulse response analysis of the VAR model is a handy tool for spillover analyses (see Belke and Osowski 2019; Istiak and Alam 2020; Alam and Istiak 2020, among others), the impulse responses may vary according to the order of the VAR. The methodology of Diebold and Yilmaz (2012) is a superior approach to the VAR model because the Diebold and Yilmaz (2012) method is based on a generalized VAR model in which spillover results are generated from several responses at each rolling window. The methodology of Barunik and Krehlik (2018) also is a better approach to the traditional VAR model because the Barunik and Krehlik (2018) method decomposes the Diebold and Yilmaz (2012) spillover to different frequencies and examines inflation spillover at these different time frequencies. Because of the superiority of the methodology of Diebold and Yilmaz (2012) and Barunik and Krehlik (2018) over competing approaches, these two methodologies have been widely used in the recent spillover literature (see Antonakakis and Badinger (2016); Abosedra et al. (2020); Arčabić and Škrinjarić (2021); Aslanidis et al. (2021), among others).
The next section provides the empirical results obtained from applying the approaches of Diebold and Yilmaz (2012) and Barunik and Krehlik (2018).

5. Estimation Findings

5.1. Estimation Results Based on the Spillover Index Methodology of Diebold and Yilmaz

Table 2 presents the time-domain inflation spillovers estimated by the methodology of Diebold and Yilmaz (2012). The column-wise numbers indicate the contribution of one country’s inflation to the forecast error variance in the other country’s inflation. The row-wise numbers indicate the contribution of the inflation of all other economies to the forecast error variance in a particular economy’s inflation. See Table 2’s note for a detailed discussion. The total spillover index (SI) is found to be 35.82%. This indicates that more than one-third of the total forecast error variance in inflation for the G7 countries originates from spillover. The index indicates a close interconnectedness of this group of countries in terms of inflation spillover.
The inflation of Japan, followed by the United States, contributed the most to the forecast error variance in the inflation for the remaining countries (69.51% and 54.39%, respectively), as shown by the fourth-last row in Table 2. On the other hand, the last column shows that Italy receives the highest spillover from other countries (52.99%), followed by the United Kingdom (42.63%). The net inflation spillovers are calculated as the difference between the inflation spillovers transmitted to others and the inflation spillovers received from others. For example, the net inflation spillover of the United States is calculated as (54.39–25.69)% = 28.72%. The results show that Japan is the biggest net transmitter of inflation spillover (40.222%), followed by the United States (28.728%). It is found that all other G7 countries are net receivers of inflation spillovers.
Table 3 reports net pairwise spillover results of the Diebold and Yilmaz (2012) methodology. The correlations indicate that Japan is a net spreader of inflation to all other G7 countries except Germany. The correlations also indicate that the United States is a net transmitter of inflation to all other G7 countries except Japan.
The inflation spillover index of the G7 countries based on the Diebold and Yilmaz (2012) methodology is depicted in Figure 2. The stagflation created by the oil price shock in the mid-1970s led to high spillover of inflation in 1980. The index started growing again in the 1990s because of the high aggregate demand of the G7 countries arising from the growth of the dotcom bubble and computer-related technology. The peak is observed around 2000 when the system had a spillover of around 20%. The spillover showed a precipitous fall after the burst of the dotcom bubble in 2000. The situation became worse due to the low aggregate demand in the G7 countries because of the 9/11 attack and the recession of the G7 countries around 2001–2002. The spillover was lowest during the financial crisis of 2007–2009. After the crisis, the spillover started to increase, but it again dropped in 2016–2017 during the trade war between the United States and her trading partners and in 2020 during the COVID-19 pandemic period.
Figure 3 represents inflation spillovers in each of the G7 countries from the other remaining countries. For example, the subtitle “Canda.From” represents the graph of inflation spillover in Canada from the other G7 countries. Figure 3 represents that inflation spillovers from the other G7 countries to Canada, France, Germany, Italy, and the United Kingdom have been rising after 2005. For Japan and the United States, this spillover index remains pretty much constant after 2005, indicating that these two countries are creating inflation spillover to the other G7 countries.

5.2. Estimation Results Based on the Spillover Index Methodology of Barunik and Krehlik

As mentioned in the introduction, Barunik and Krehlik (2018) proposed a framework to calculate the spillover for different frequency bands of interest. The current paper decomposes the overall inflation spillover measures into three frequency bands: (π, π/4) or (3.14–0.79); (π/4, π/10) or (0.79–0.31); and (π/10, 0) or (0.31–0.00), that correspond to movements from 1 to 4 months (short term), from 4 to 10 months (medium term), and from 10 to an infinite number of months (long term), respectively.
Table 4 indicates that the inflation spillover index (SI) is the highest in the long term (SI = 18.58% in panel C), followed by the short term (SI = 13.22% in panel A) and medium term (SI = 4.01% in panel B). Japan is the highest net inflation transmitter (53.34%) followed by the United States (33.17%) in the long term. The United States is the net inflation transmitter in all three terms. Germany and Japan are the net inflation transmitters in both the medium and long term. Canada is a net inflation transmitter in the long term, but it is a net inflation recipient in the short term.
Table 5 reports net pairwise spillover results of the Barunik and Krehlik (2018) methodology. The correlation coefficients indicate that the United States is a net transmitter of inflation in the short term (panel A) to all other G7 countries except Germany. In the medium term (panel B), Germany is a net spreader of inflation to Italy, the United Kingdom, and the United States. Japan is a net transmitter of inflation to all other G7 countries except the United States in the medium term. Moreover, France is a net spreader of inflation to Italy and the United Kingdom is a net transmitter of inflation to France and Italy in the medium term. In the long term (panel C), Japan is a net spreader of inflation to all other G7 countries except Germany. The United States is also a net spreader of inflation to all other G7 countries except Japan in the long term. Overall, the results show that the United States and Japan are the strongest net transmitters of inflation.
The inflation spillover index of the G7 countries based on the Barunik and Krehlik (2018) methodology is depicted in Figure 4. This figure divides the total spillover of inflation of Figure 2 into spillover of inflation in the short, medium, and long term. The area-wise spillover in Figure 4 represents that, overall, the spillover of inflation is the highest in the long term (the lower portion) and is the smallest in the medium term (the middle portion). The graph also represents that the inflation spillovers in the short, medium, and long term move (either as an increase or a decrease) in the same direction. It is also found that inflation spillover has been showing an upward trend since 2006 for all terms.
Figure 5 represents the inflation spillover from other countries for each of the G7 countries for the long term. For example, the subtitle “Canda.From Freq3” represents the graph of inflation spillover in Canada from the other G7 countries for the long term. As the highest inflation spillover is observed in the long term (see Table 4), only the pictures of inflation spillover from other countries to each of the G7 countries in the long term are shown to keep the paper short and focused. All G7 countries had high inflation from the other members in around 2000 due to the high aggregate demand arising from the growth of the dotcom bubble and computer-related technology. From 2005 onwards, the inflation spillovers in each of the G7 countries from other members are stable in the long term. The adoption of the Euro in 2002 is one of the possible reasons for this incident. Although Canada, Japan, and the United States are located outside the E.U. region, the inflation spillover in each of these countries reduced in the same period because of the theory of purchasing power parity (PPP) (see Zhou et al. (2008)).
The formulation of the frequency connectedness index Y d F and the inflation spillover results of this section are based on 100 horizons. To check the robustness, 150 horizons were used to produce inflation spillover results. The inflation spillover results with the higher number of horizons are very similar to the current ones. So, the results presented in this section are robust to different forecasting horizons of the spillover model.

6. Economic Analysis of the Findings

In this section, we provide economic explanations of the results presented in the previous section. In order to do that, we compare our findings with other relevant studies and also apply economic theories (discussed in the literature in Section 2) to explain the results.
Table 2 shows that U.S. inflation explains 11.93% of the forecast error variance in Canadian inflation. On the other hand, Canadian inflation explains only 5.56% of the forecast error variance in U.S. inflation. Table 3 shows that the net pairwise inflation spillover from the United States to Canada is 6.3601, meaning that the United States is one of the largest net transmitters of inflation to Canada. Table 4 shows that U.S. inflation explains a high percentage of the forecast error variance in Canadian inflation (4.05%, 1.7%, and 6.18% in the short, medium, and long term, respectively), but Canadian inflation does not explain a high percentage of the forecast error variance in U.S. inflation (only 1.76%, 1.47%, and 2.01% in the short, medium, and long term, respectively). Moreover, Table 5 shows that the net pairwise inflation spillover from the United States to Canada is 2.2904, 0.2303, and 3.85, respectively, in the short, medium, and long term, indicating that the United States is the net inflation spreader to Canada in all terms. The result is consistent with Tiwari et al. (2015), who find that U.S. inflation explains a decent proportion of the total variation in Canadian inflation. However, unlike Tiwari et al. (2015), the current paper does not provide strong evidence that Canadian inflation explains a decent proportion of the total variation in U.S. inflation. So, this part needs some clarification.
Because of the agenda of the nationalistic trade policies and renegotiation of NAFTA by the Republican government in 2016, trade policy uncertainty in the United States started to rise in 2016. Figure 6 indicates that the trade policy uncertainty of the United States started rising in 2016. The U.S. imports from Canada started to decline rapidly during that time. In fact, according to the website of the U.S. Census Bureau, the U.S. imports from Canada became $277.72 billion in 2016, which was the second lowest in the 2010s. The imports were $299.07 billion in 2017, which was the fourth lowest in the 2010s. The imports were $270.38 billion in 2020, which was the lowest in the 2010s because of the fall in aggregate demand in the United States due to the COVID-19 pandemic. The dataset of Tiwari et al. (2015) covers the period from January 1955 to June 2012, whereas the dataset of the current paper covers the period from June 1956 to December 2020. As our dataset includes the outlier period of 2016–2020 involving a very low amount of imports from Canada, Canadian inflation lost some of its capacity to influence U.S. inflation in the full sample through the international trade effect.1 So, this research finds that Canadian inflation did not have a strong spillover effect on U.S. inflation during the period of June 1956 to December 2020.
Table 5 shows that in the medium and long term, Germany is a net spreader of inflation to Italy and the United Kingdom. This finding is consistent with Clarida et al. (1998), who argue that the monetary policies of Italy and the United Kingdom are greatly influenced by the Deutsche Bundesbank, the central bank of Germany. Moreover, Table 5 shows that France is a net spreader of inflation to Germany and Italy in the short and medium term. Additionally, the United Kingdom is a net spreader of inflation to France in all terms. All this evidence indicates that inflation in major European countries is significantly correlated. The theory of purchasing power parity (PPP) could be one possible reason for the high correlation of inflation among the European countries, especially after the introduction of the Euro (see Zhou et al. (2008)). The expansion of the asset purchase programme (APP) of the European Central Bank (declared in January 2015) may be another reason for the potential inflation spillover in the European countries (see Gambetti and Musso (2017)).
Table 2 indicates that U.S. inflation makes a noticeable contribution (54.39%) to the forecast error variance om the inflation of the remaining G7 countries. Table 3 reports that the United States is a net transmitter of inflation to all other G7 countries except Japan. Table 5 reports that the United States is a net transmitter of inflation to most of the G7 countries in all three terms. So, the current paper shows that U.S. inflation has a strong spillover effect on the other G7 countries. This finding supports Yang et al. (2006), who find that sudden changes in the U.S. inflation have strong effects on inflation in the other G7 countries. As there is adequate evidence that purchasing power parity (PPP) holds between the United States and each of the other G7 countries (Gefang 2008), the theory of PPP may be one of the possible reasons for the U.S. inflation spillover to the other G7 countries.
As this paper finds that the United States and Japan are the strongest net transmitters of inflation, the theory of PPP is investigated between the United States and each of the other G7 countries and also between Japan and each of the other G7 countries.
Section 2 indicates that technology spillover can be a potential determinant of the spillover of inflation (Henriksen et al. 2011). Based on this theory, we claim that the spread of low-cost information technology and computer-related services in the United States may be another reason for U.S. inflation spillover to other G7 countries. Alan Greenspan stated in the US Congress in 20052: “The past decade of low inflation and solid economic growth in the United States and in many other countries around the world has been without precedent in recent decades. Much of that favorable performance is attributable to the remarkable confluence of innovations that spawned new computer, telecommunication, and networking technologies, which, especially in the United States, have elevated the growth of productivity, suppressed unit labor costs, and helped to contain inflationary pressures”. When other G7 countries adopt this new technology or import cheap, U.S.-made technology-related products, the price level of other G7 countries may decline. This information-technology-based inflation spillover is one of the reasons for the low inflation of the G7 countries in recent years (see also Lv et al. (2019)).
Section 2 indicates that the inflation of a country can be influenced by the prices of its imported goods (see Bernanke (2007)). Based on this principle, we claim that a large amount of Japanese exports to the other G7 countries may be a possible reason for Japanese inflation spillover to other G7 countries. Table 3 reports that Japan is a net spreader of inflation to all other G7 countries except Germany. Table 4 indicates that Japan is the biggest net spreader (53.34%) of inflation to the other G7 countries in the long term. Table 5 shows that Japan is a net transmitter of inflation to all other G7 countries except Germany in the long term. Japan is the fourth-largest trade partner of the United States. The Unites States imports around 20% of the exports from Japan. According to the website of the Observatory of Economic Complexity (oec.world/en), Japan’s exports to the United States were $135 billion in 2018. In the same year, Japan’s exports to Canada, France, Germany, Italy, and the United Kingdom were $10.5, $8.58, $21.3, $4.52, and $12.8 billion, respectively. The declining trend of Japan’s real broad effective exchange rate since 1995 is a major reason for the huge amount of Japanese exports to the other G7 countries. Moreover, the quantitative easing program under the Abenomics policy resulted in an inflation rate and an interest rate of almost zero in Japan after 2013. An inflation rate of zero helps to keep the nominal wage the same over time and thus has provided Japan with a comparative advantage in international trade. Moreover, as the zero-interest rate environment is not attractive for net capital inflow, the zero-interest rate has helped Japan to maintain a low real exchange rate. Thus, the recent Abenomics policy of Japan has provided her with a favorable position to export a lot of goods and services to the other G7 countries. This Abenomics policy may be a determining factor behind the Japanese inflation spillover to the other G7 countries through the international trade channel.

7. Conclusions

According to The Economic Times3 the G7 countries hold 58% of the global net wealth ($317 trillion) and produce more than 46% of the global GDP. Because of their large economies and high productivity, the G7 countries are the leaders of global growth. The central banks of these countries are committed to maintaining domestic growth and controlling domestic inflation. Because of the substantial amount of trade and financial integration, the theory of purchasing power parity, similar monetary policies, etc., there is a possibility of international transmission of inflation among the G7 countries. Understanding the nature and extent of this inflation spillover is important because, without proper knowledge about this spillover, any loose or tight monetary policy of the central bank of one G7 country may create negative external effects on other G7 countries and ultimately may hamper the global economic growth. Against this backdrop, this paper investigates the nature and extent of inflation spillovers among the G7 countries.
Using data on the G7 countries for the period from June 1956 to December 2020 and applying the time-domain approach of Diebold and Yilmaz (2012) and the frequency-domain approach of Barunik and Krehlik (2018), the paper finds that there is significant evidence of inflation spillover among the G7 countries. The paper shows that the United States is the main net transmitter of inflation in the short term. Additionally, Japan is the leading net spreader of inflation in the medium term. Moreover, Japan and the United States are the main net transmitters of inflation to the other G7 countries in the long term.
The results of this paper show that the inflation spillover index of the G7 countries varies across different terms. The findings suggest that policies to control inflation in the short (1–4 months) and medium (4–10 months) term may not be attractive because inflation spillover has a limited impact on the economy during the short and medium term. Given that the inflation spillover index has the highest value in the long term (see Table 4), the central banks of the G7 countries should adopt monetary policies so that a common macroeconomic shock cannot create inflation spillover in the long term (over 10 months). As Japan and the United States are the major net transmitters of inflation in the long term, each of the other G7 countries should closely observe any price level developments in these two countries. The finding of the paper is very topical at this time when the United States, the net transmitter of inflation in all three terms, is following an exceptionally simple monetary policy during the post-COVID-19 period. As of March 2021, the federal reserve system aims to keep the interest rate at zero until at least 2023. Moreover, the federal reserve system aims to purchase at least $80 billion treasury securities and $40 billion mortgage-backed securities monthly until the United States achieves full employment and an inflation rate of 2%. According to the finding of the current paper, this U.S. inflation may spill over to the other G7 countries in all three terms. The central banks of other G7 countries should set their monetary policies accordingly to achieve their targeted inflation and unemployment rates.
Since 2006, the short, medium, and long-term inflation spillovers have been increasing steadily in the G7 countries (see Figure 4). The paper concludes that this international spillover trend of inflation since 2006 has weakened the individual capacity of the central banks of the G7 countries to control/set domestic inflation in recent times. The study suggests that the central banks of the G7 countries make a collective effort and long-term commitment to achieve price stability. So, policy coordination of the central banks of the G7 countries is essential to achieve the targeted inflation rate in the long term. Moreover, the inflation spillover among the G7 countries indicates that high inflation in one of the countries may increase the inflation expectations of the other countries. This may increase the long-term yield and decrease the bond prices of the other countries. The policymakers of the countries should follow appropriate monetary policies to protect bond investors.
The research method applied in this paper has some limitations and therefore some uncertainty may be involved in the applied analysis. First, the paper does not analyze spillover at different quantiles. Second, breaks are not considered in the model. Finally, some global variables may affect spillover in the G7 countries; however, consideration of those variables is outside of the scope of the current research. A possible extension of this study could be investigating whether a global variable, say simple monetary policies around the world due to the COVID-19 pandemic, can affect the spillover of inflation of the G7 countries.

Author Contributions

K.I. wrote the introduction, explained the results, and the economic analysis; A.K.T. computed the reults, H.H. wrote the literature review; K.S. wrote the conclusion and polished the paper. All authors have read and agreed to the published version of the manuscript.

Funding

This research received no external funding.

Institutional Review Board Statement

Not applicable.

Informed Consent Statement

Not applicable.

Data Availability Statement

Data will be made available upon request.

Conflicts of Interest
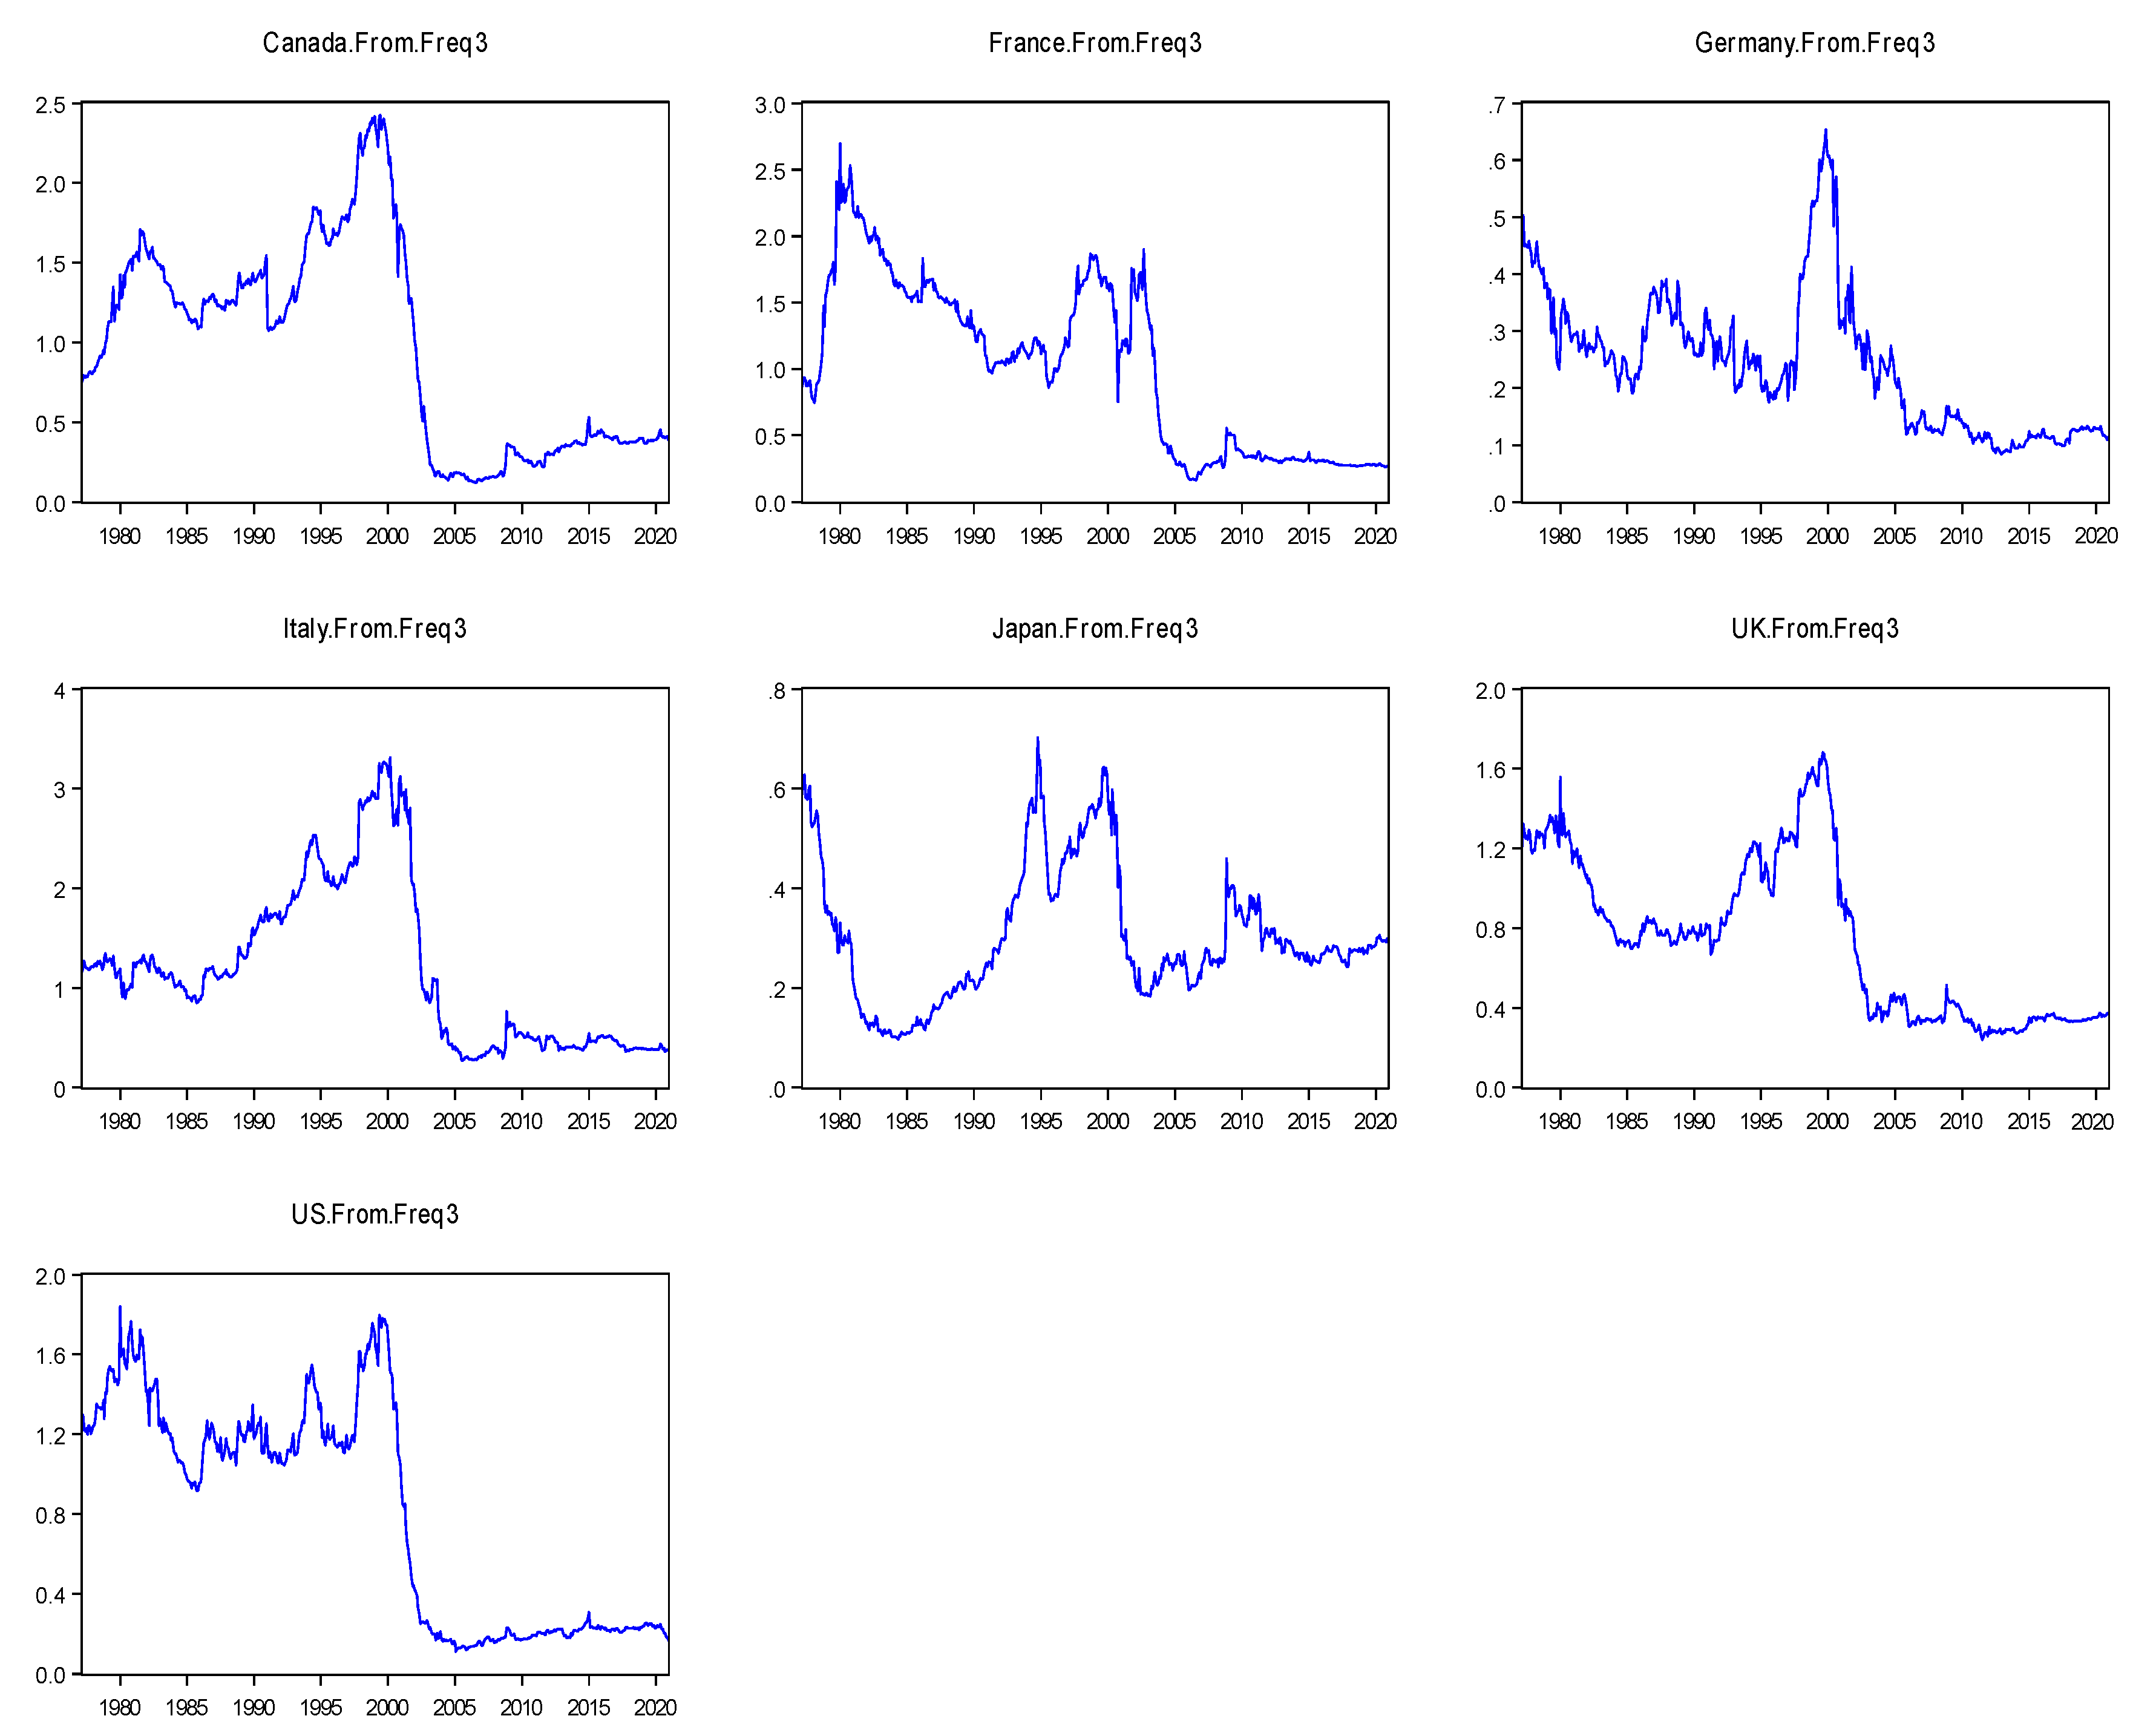
The authors declare no conflict of interest.

Note

1
The correlations of inflation between Canada and the United States were found to be 0.641 and 0.528 for the period of January 1956 to December 2015 and January 2016 to December 2020, respectively. So, the inflation spillover between Canada and the United States was low during the January 2016 to December 2020 period.
2
3

References

  1. Aastveit, Knut Are, Hilde Christiane Bjørnland, and Leif Anders Thorsrud. 2016. The world is not enough! Small open economies and regional dependence. The Scandinavian Journal of Economics 118: 168–95. [Google Scholar] [CrossRef] [Green Version]
  2. Abosedra, Salah, Mahmoud Arayssi, Bernard Ben Sita, and Crispin Mutshinda. 2020. Exploring GDP growth volatility spillovers across countries. Economic Modelling 89: 577–89. [Google Scholar] [CrossRef]
  3. Alam, Md. Rafayet, and Khandokar Istiak. 2020. Impact of US policy uncertainty on Mexico: Evidence from linear and nonlinear tests. Quarterly Review of Economics and Finance 77: 355–66. [Google Scholar] [CrossRef]
  4. Antonakakis, Nikolas, and Harald Badinger. 2016. Economic growth, volatility, and cross-country spillovers: New evidence for the G7 countries. Economic Modelling 52: 352–65. [Google Scholar] [CrossRef] [Green Version]
  5. Arčabić, Vladimir, and Tihana Škrinjarić. 2021. Sharing is caring: Spillovers and synchronization of business cycles in the European Union. Economic Modelling 96: 25–39. [Google Scholar] [CrossRef]
  6. Aslanidis, Nektarios, Aurelio Bariviera, and Alejandro Perez-Laborda. 2021. Are cryptocurrencies becoming more interconnected? Economics Letters 199: 1–7. [Google Scholar] [CrossRef]
  7. Barunik, Jozef, and Tomáš Krehlik. 2018. Measuring the frequency dynamics of financial connectedness and systemic risk. Journal of Financial Econometrics 16: 271–96. [Google Scholar] [CrossRef]
  8. Beck, Günter W., Kristin Hubrich, and Marcellino Massimiliano. 2009. Regional inflation dynamics within and across euro area countries and a comparison with the United States [with discussion]. Economic Policy 24: 141–84. [Google Scholar] [CrossRef]
  9. Belke, Ansgar, and Thomas Osowski. 2019. Measuring fiscal spillovers in EMU and beyond: A Global VAR approach. Scottish Journal of Political Economy 66: 54–93. [Google Scholar] [CrossRef]
  10. Bernanke, Ben. 2007. Globalization and Monetary Policy. Remarks by Chairman Ben Shalom. Bernanke at the Fourth Economic Summit. Stanford: Stanford Institute for Economic Policy Research. [Google Scholar]
  11. Chang, Tsangyao, Wen-Chi Liu, and Chin-Ping Yu. 2010. Revisiting purchasing power parity for G7 countries: Further evidence based on panel SURKSS tests. Applied Economics Letters 17: 1383–87. [Google Scholar] [CrossRef]
  12. Ciccarelli, Matteo, and Benoit Mojon. 2010. Global inflation. The Review of Economics and Statistics 92: 524–35. [Google Scholar] [CrossRef]
  13. Clarida, Richard, Jordi Gali, and Mark Gertler. 1998. Monetary policy rules in practice: Some international evidence. European Economic Review 42: 1033–67. [Google Scholar] [CrossRef] [Green Version]
  14. Diebold, Francis X., and Kamil Yilmaz. 2012. Better to give than to receive: Predictive directional measurement of volatility spillovers. International Journal of Forecasting 28: 57–66. [Google Scholar] [CrossRef] [Green Version]
  15. Gambetti, Luca, and Alberto Musso. 2017. The Macroeconomic Impact of the ECB’s Expanded Asset Purchase Programme (APP). ECB Working Paper No. 2075. Frankfurt: ECB. [Google Scholar]
  16. Gefang, Deborah. 2008. Investigating nonlinear purchasing power parity during the post-Bretton Woods era—A Bayesian exponential smooth transition VECM approach. In Bayesian Econometrics. Advances in Econometrics. Edited by Siddhartha Chib, William Griffiths, Gary Koop and Dek Terrell. Bingley: Emerald Group Publishing Limited, vol. 23, pp. 471–500. [Google Scholar]
  17. Henriksen, Espen, Finn Kydland, and Roman Sustek. 2011. The High Cross-Country Correlations of Prices and Interest Rates. Discussion Paper 11/01. Nottingham: University of Nottingham, Centre for Finance, Credit and Macroeconomics (CFCM). [Google Scholar]
  18. Istiak, Khandokar, and Md. Rafayet Alam. 2019. Oil prices, policy uncertainty and asymmetries in inflation expectations. Journal of Economic Studies 46: 324–34. [Google Scholar] [CrossRef]
  19. Istiak, Khandokar, and Md. Rafayet Alam. 2020. US economic policy uncertainty spillover on the stock markets of the GCC countries. Journal of Economic Studies 47: 36–50. [Google Scholar] [CrossRef]
  20. Johnson, David. 2002. The effect of inflation targeting on the behavior of expected inflation: Evidence from an 11 country panel. Journal of Monetary Economics 49: 1521–38. [Google Scholar] [CrossRef]
  21. Kose, M. Ayhan, Christopher Otrok, and Charles H. Whiteman. 2003. International business cycles: World, region, and country-specific factors. American Economic Review 93: 1216–39. [Google Scholar] [CrossRef] [Green Version]
  22. Lv, Lei, Zhixin Liu, and Yingying Xu. 2019. Technological progress, globalization and low-inflation: Evidence from the United States. PLoS ONE 14: e0215366. [Google Scholar] [CrossRef]
  23. Monacelli, Tommaso, and Luca Sala. 2009. The international dimension of inflation: Evidence from disaggregated consumer price data. Journal of Money, Credit and Banking 41: 101–20. [Google Scholar] [CrossRef]
  24. Mumtaz, Haroon, Saverio Simonelli, and Paolo Surico. 2011. International co-movements, business cycle and inflation: A historical perspective. Review of Economic Dynamics 14: 176–98. [Google Scholar] [CrossRef] [Green Version]
  25. Neely, Christopher J., and David E. Rapach. 2011. International comovements in inflation rates and country characteristics. Journal of International Money and Finance 30: 1471–90. [Google Scholar] [CrossRef]
  26. O’Donnell, D. 2015. G7 in Figures. Wiesbaden: Statistisches Bundesamt (Federal Statistical Office). [Google Scholar]
  27. Osorio, Carolina, and D. Filiz Unsal. 2013. Inflation dynamics in Asia: Causes, changes, and spillovers from China. Journal of Asian Economics 24: 26–40. [Google Scholar] [CrossRef] [Green Version]
  28. Rogoff, Kenneth. 2003. Globalization and global disinflation. Economic Review 88: 45–80. [Google Scholar]
  29. Tiwari, Aviral Kumar, Niyati Bhanja, Arif Billah Dar, and Olaolu Richard Olayeni. 2015. Analyzing time-frequency based co-movement in inflation: Evidence from G-7 countries. Computational Economics 45: 91–109. [Google Scholar] [CrossRef]
  30. Tiwari, Aviral Kumar, Niyati Bhanja, and Arif Billah Dar. 2016. Frequency based co-movement of inflation in selected euro area countries. OECD Journal: Journal of Business Cycle Measurement and Analysis 2015: 1–13. [Google Scholar] [CrossRef]
  31. Tiwari, Aviral Kumar, Muhammad Shahbaz, Haslifah M. Hasim, and Mohamed M. Elheddad. 2019. Analysing the spillover of inflation in selected Euro-area countries. Journal of Quantitative Economics 17: 551–77. [Google Scholar] [CrossRef]
  32. Wang, Pengfei, and Yi Wen. 2007. Inflation dynamics: A cross-country investigation. Journal of Monetary Economics 54: 2004–31. [Google Scholar] [CrossRef] [Green Version]
  33. Yang, Jian, Hui Guo, and Zijun Wang. 2006. International transmission of inflation among G-7 countries: A data-determined VAR analysis. Journal of Banking & Finance 30: 2681–700. [Google Scholar]
  34. Zhou, Su, Mohsen Bahmani-Oskooee, and Ali M. Kutan. 2008. Purchasing power parity before and after the adoption of the Euro. Review of World Economics 144: 134–50. [Google Scholar] [CrossRef] [Green Version]
Figure 1. Inflation rate of the G7 countries, 1956–2020.
Jrfm 14 00392 g001
Figure 2. Overall inflation spillovers with the Diebold and Yilmaz (2012) methodology.
Jrfm 14 00392 g002
Figure 3. Inflation spillover in each of the G7 countries from other countries with the Diebold and Yilmaz (2012) methodology, 1956–2020.
Jrfm 14 00392 g003
Figure 4. Inflation spillovers in the short, medium, and long term with the Barunik and Krehlik (2018) methodology. Note: The lower, middle, and upper portion of the graph represents the inflation spillover in the short, medium, and long term, respectively.
Jrfm 14 00392 g004
Figure 5. Inflation spillover in each of the G7 countries from other countries with the Barunik and Krehlik (2018) methodology in the long term.
Jrfm 14 00392 g005
Figure 6. Trade policy uncertainty index of the United States, January 1996 to December 2020.
Jrfm 14 00392 g006
Table 1. Summary statistics of the inflation rate of G7 countries, 1956–2020.
CanadaFranceGermanyItalyJapanUKUS
Minimum−0.013−0.01−0.012−0.007−0.02−0.016−0.019
Maximum0.0260.0340.0170.0310.0410.0420.018
Median0.0020.0030.0020.0030.0010.0030.003
Mean0.0030.0030.0020.0040.0020.0040.003
Standard Dev.0.0040.0040.0040.0050.0070.0060.003
Jarque–Bera value108.8783.067.4827.8657.52685.8317.1
Observations775775775775775775775
Table 2. Time-domain inflation spillover based on the Diebold and Yilmaz (2012) methodology.
Contribution from (→)
Contribution to (↓)
CanadaFranceGermanyItalyJapanUKUSContribution from Others
Canada67.510032.27992.14974.1728.6313.320111.930132.48
France6.44 *61.94024.341.82713.2724.16018.019938.08
Germany1.970016.829970.3994.1025.5375.90035.270329.61
Italy7.940032.07975.8147.0418.1726.080212.8852.99
Japan2.069971.95028.29015.90870.776.20974.8329.26
UK4.510032.41994.23993.9216.02357.390211.500342.63
US5.569971.35033.53013.8577.8473.530174.29825.69
Contribution to others28.4916.9428.3523.869.5129.1954.39∑(Contribution to others) = ∑(Contribution from others) = 250.74
Contribution to own and others96.0100478.850198.758870.826140.25286.5907128.7286∑(Contribution to own and others) = 700
Net inflation spillover−3.9914−21.14−1.232−29.2240.222−13.41228.728
Spillover index (SI) = 250.74 700 × 100 = 35.82
Note: The numbers in the table represent the proportion of the forecast error variance in inflation contributed from/contributed to other countries. For example, * indicates that Canada’s inflation contributes to 6.44% of the forecast error variance in the inflation of France. Similarly, the number also indicates that 6.44% of the forecast error variance in the inflation of France is contributed by the inflation of Canada. A positive (negative) number in the net inflation spillover row indicates that the country is a net transmitter (receiver) of inflation.
Table 3. Net pairwise inflation spillover based on the Diebold and Yilmaz (2012) methodology.
CanadaFranceGermanyItalyJapanUKUS
Canada-−4.16010.17969−3.768036.56103−1.189936.3601 *
France4.1601-−2.4899−0.252711.32181.74026.6696
Germany−0.179692.4899-−1.708−2.75311.66041.7402
Italy3.768030.25271.708-12.2642.16029.023
Japan−6.56103−11.32182.7531−12.264-−9.8133 **−3.017
UK1.18993−1.7402−1.6604−2.16029.8133-7.9702
US−6.36013−6.6696−1.7402−9.0233.017−7.9702-
Note: A positive number in the table indicates a net inflation spillover from the column country to the row country. For example, * indicates that the United States is a net inflation transmitter to Canada. A negative number in the table indicates a net inflation spillover from the row country to the column country. For example, ** indicates that Japan is a net inflation transmitter to the United Kingdom.
Table 4. Frequency-domain inflation spillover based on the Barunik and Krehlik (2018) methodology.
Panel A: The Spillover for Band 3.14 to 0.79 Roughly Corresponds to 1 to 4 Months (Short Term)
CanadaFranceGermanyItalyJapanUKUSContribution From
Canada52.0301.5001.5101.8691.8802.1214.05012.950
France1.400 *29.1302.7300.7631.4402.8211.55010.710
Germany1.2905.68046.2503.2832.4404.4522.24019.390
Italy1.1201.2301.24020.7971.4801.4701.2407.770
Japan1.6601.5602.7505.06846.4705.6982.79019.530
UK1.8601.9201.2901.4982.76041.5523.16012.460
US1.7600.7402.6501.0781.5201.96732.7409.730
Contribution to9.10012.60012.18013.58011.48018.55015.050∑(Contribution to/from others) = 92.54
Net spillover−3.8501.890−7.2105.810−8.0506.0905.320SI = 92.54 700 × 100 = 13.22
Panel B: The Spillover for Band 0.79 to 0.31 Roughly Corresponds to 4 to 10 Months (Medium Term)
CanadaFranceGermanyItalyJapanUKUSContribution From
Canada8.0400.7400.4600.4130.2700.1191.7003.710
France1.07013.2900.3800.3220.3100.5670.5203.150
Germany0.5300.88014.8600.6581.1001.2390.5704.970
Italy0.6100.5302.3006.1320.3300.7770.5005.040
Japan0.1200.2100.7400.2597.9100.1470.8702.380
UK0.6400.0702.0300.5391.0007.5670.4104.690
US1.4700.4300.5200.5600.5700.56717.3604.130
Contribution to4.4802.8706.4402.7303.5703.4304.550∑(Contribution to/from others) = 28.07
Net Spillover0.740−0.3071.467−2.3101.227−1.2610.443SI = 28.07 700 × 100 = 4.01
Panel C: The Spillover for Band 0.31 to 0.00 Roughly Corresponds to 10 to An Infinite Number of Months (Long Term)
CanadaFranceGermanyItalyJapanUKUSContribution From
Canada7.4400.0300.1801.8976.4801.0786.180 **2.270
France3.97019.5201.2300.74911.5200.7705.9503.460
Germany0.1400.2709.2900.1612.0100.2102.4600.750
Italy6.2000.3302.27020.09716.3603.82911.1405.730
Japan0.2900.1804.7900.58816.3500.3571.1701.050
UK2.0100.4300.9201.88312.2708.2677.9203.630
US2.3300.1900.3602.2195.7600.98024.2001.690
Contribution to14.9801.4009.7307.49054.3907.21034.860∑(Contribution to/from others) = 28.07
Net spillover12.710−2.0608.9801.76053.3403.58033.170SI = 28.07 700 × 100 = 18.58
Note: The numbers in the table represent the proportion of the forecast error variance in inflation contributed from/contributed to other countries. For example, * indicates that Canada’s inflation contributes to 1.40% of the forecast error variance in the inflation of France in the short term. Similarly, ** indicates that 6.18% of the forecast error variance in the inflation of Canada is contributed by the inflation of the United States in the long term. A positive (negative) number in the net inflation spillover row indicates that the country is a net transmitter (receiver) of inflation.
Table 5. Net pairwise inflation spillover based on the Barunik and Krehlik (2018) methodology.
Panel A: The Spillover for 1 to 4 Months (Short Term)
CanadaFranceGermanyItalyJapanUKUS
Canada-0.10010.21980.7490.22050.26112.2904 *
France−0.1001-−2.9498−0.4669−0.12040.90090.8099
Germany−0.21982.9498-2.0433−0.31013.1619−0.4102
Italy−0.7490.4669−2.0433-−3.5882−0.0280.1617
Japan−0.22050.12040.31013.5882-2.93791.2705
UK−0.2611−0.9009−3.16190.028−2.9379-1.1928
US−2.2904−0.80990.4102−0.1617−1.2705−1.1928-
Panel B: The Spillover for 4 to 10 Months (Medium Term)
CanadaFranceGermanyItalyJapanUKUS
Canada-−0.3304−0.07−0.19670.1505−0.52080.2303
France0.3304-−0.4998−0.20790.10010.4970.0903
Germany0.070.4998-−1.64220.3598−0.7910.0497
Italy0.19670.20791.6422-0.07070.238−0.0602
Japan−0.1505−0.1001−0.3598−0.0707-−0.85330.3003
UK0.5208−0.4970.791−0.2380.8533-−0.1568
US−0.2303−0.0903−0.04970.0602−0.30030.1568-
Panel C: The Spillover for 10 to An Infinite Number of Months (Long Term)
CanadaFranceGermanyItalyJapanUKUS
Canada-−3.93960.0399−4.30296.1901−0.93173.85
France3.9396-0.95970.419311.340.34025.7603
Germany−0.0399−0.9597-−2.1091−2.7804−0.70982.1
Italy4.3029−0.41932.1091-15.77171.9468.9208
Japan−6.1901−11.34 **2.7804−15.7717-−11.9133−4.5906
UK0.9317−0.34020.7098−1.94611.9133-6.9398
US−3.85−5.7603−2.1−8.92084.5906−6.9398-
Note: A positive number in the table indicates a net inflation spillover from the column country to the row country. For example, * indicates that the United States is a net inflation transmitter to Canada in the short term. A negative number in the table indicates a net inflation spillover from the row country to the column country. For example, ** indicates that Japan is a net inflation transmitter to France in the long term.
Publisher’s Note: MDPI stays neutral with regard to jurisdictional claims in published maps and institutional affiliations.

