Staging Systems and Nomograms for Soft Tissue Sarcoma


Abstract
:1. Introduction
2. American Joint Committee on Cancer/Union for International Cancer Control (AJCC/UICC) TNM Staging System
3. Nomograms
3.1. General Postoperative Nomograms for STS
3.2. Nomograms for Extremity STS

| Development Series Characteristics | Nomogram Details | Internal Validation | External Validation | |||||||
|---|---|---|---|---|---|---|---|---|---|---|
| Study | Selection Criteria | Timeframe | No. of Centers | Predicted Outcomes | No. of Patients | Nomogram’s Covariates (a) | Concordance Index | Yes/No | Concordance Index | |
| General postoperative nomograms | Kattan [15] 2002 | Primary, surgically treated, any site but skin | 1982–2000 | 1 | 12-y low-grade SSD, 12-y high-grade SSD | 2163 | Histology (7 categories), size (3 categories), age (continuous), site (6 categories), depth (superficial vs. deep) | 0.77 | Yes | 0.64–0.76 (b) |
| Nomograms specific for extremity STS | Mariani [16] 2005 | Primary completely resected extremity STS | 1980–2000 | 1 | 10-y SSD | 642 | Grade (3 tiers), histology, age (continuous), size (3 categories), depth (superficial vs. deep), site (lower vs. upper) | 0.76 | No | |
| Cahlon [32] 2012 | Primary extremity STS treated with limb-sparing surgery without adjuvant therapy | 1982–2006 | 1 | 3-y and 5-y LRrate | 684 | Histology (WDLPS vs. others), surgical resection margin (negative vs. close/positive), grade (low vs. high), age (dichotomic, cutoff at 50 y), size (dichotomic, cutoff at 5 cm) | 0.73 | No | ||
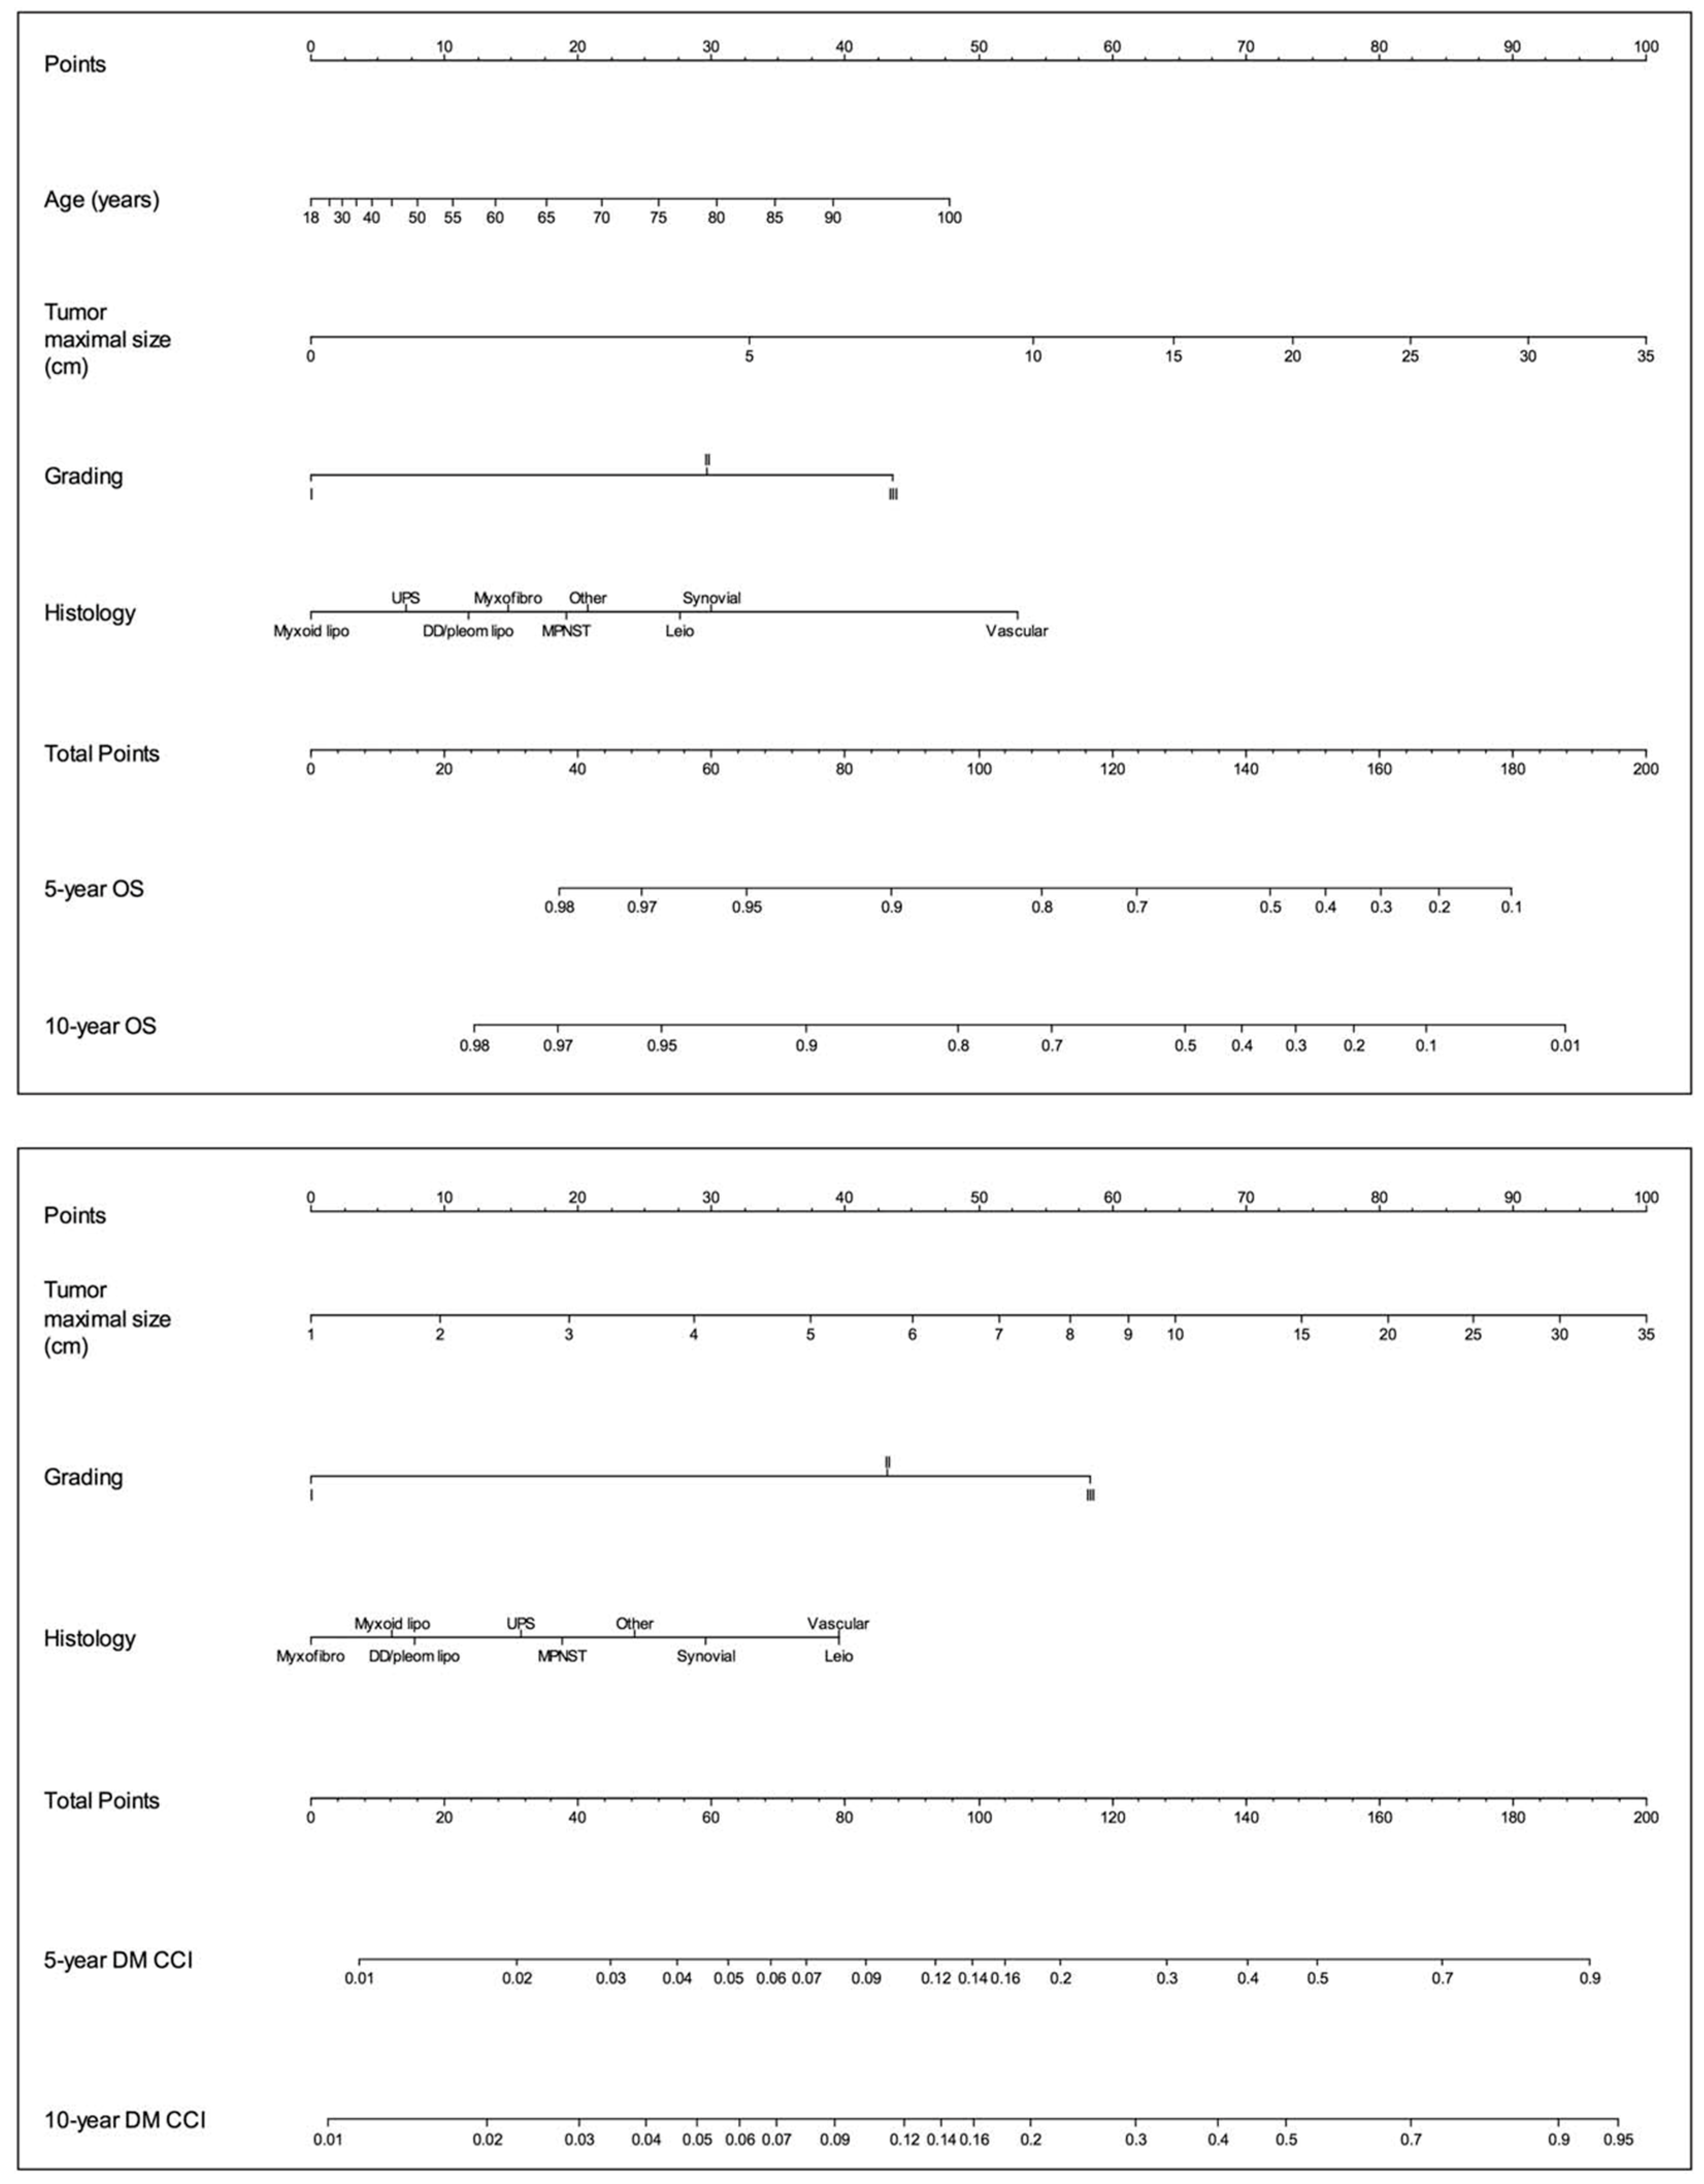
| Callegaro [34] 2016 | Primary extremity STS treated with surgery | 1994–2013 | 1 | 5-y and 10-y OS | 1452 | Size (continuous), histology (9 categories), age (continuous), grading (FNCLCC) | 0.77 | Yes | 0.70–0.77 (c) | |
| 5-y and 10-y DM | 1452 | Size (continuous), grading (FNCLCC), histology (9 categories) | 0.76 | Yes | 0.65–0.75 (c) | |||||
| Van Praag [38] 2017 | Primary high-grade extremity STS surgically treated with curative intent | 2000–2014 | 5 | 3-y, 5- and 10-y cumulative incidence of LR | 766 | Margin status (0 vs. 0.1–2 mm vs. >2 mm), RT (no, neoadjuvant, adjuvant), size (continuous), age (continuous), depth (deep vs. superficial vs. both), histology (5 categories) | 0.68 | No | ||
| 3-y, 5- and 10-y OS | 766 | Age (continuous), size (continuous), RT (no, neoadjuvant, adjuvant), margin status (0 vs. 0.1–2 mm vs. >2 mm, depth (deep vs. superficial vs. both), histology (5 categories) | 0.70 | No | ||||||
| Rueten-Budde [39] 2018 | Primary high-grade extremity STS surgically treated with curative intent | 2000–2014 | 14 | 5-y dynamic OS | 2232 | Baseline variables: age (continuous), size (continuous), depth (deep vs. superficial), histology (7 categories). Radiotherapy (no vs. neoadjuvant vs. adjuvant), margins (R0 vs. R1-2) Time-dependent variables: LR and DM | 0.78 | Yes | 0.83 (d) | |
| Callegaro [12] 2019 | Primary extremity STS treated with surgery | 1994–2013 | 4 | 5-y dynamic OS | 3740 | Age, size and its interaction with landmark time, grading (FNCLCC) and its interaction with landmark time, histology, LR and DM (as first event) | 0.78–0.84 | Yes | 0.67–0.81 (e) | |
3.3. Nomograms for RPS
3.4. Histology-Specific Nomograms
3.4.1. Liposarcoma
3.4.2. Synovial Sarcoma
3.4.3. Rhabdomyosarcoma
3.4.4. Desmoid-Type Fibromatosis
| Study | Development Series Characteristics | Nomogram Details | Internal Validation | External Validation | ||||||
|---|---|---|---|---|---|---|---|---|---|---|
| Selection Criteria | Timeframe | No. of Centers | Predicted Outcomes | No. of Patients | Nomogram’s Covariates (a) | Concordance Index | Yes/No | Concordance Index | ||
| Liposarcoma | Dalal [55] 2006 | Nonmetastatic liposarcoma of the extremity, trunk, or retroperitoneum | 1982–2005 | 1 | 5-y and 12-y DSS | 801 | Histology (5 categories), tumor burden (continuous), age (continuous), surgical resection margins (R0 vs. R1 vs. R2), site (5 categories), presentation status (prior excision vs. biopsy vs. no treatment), tumor depth (superficial vs. deep), sex (male vs. female) | 0.83 | No | |
| Synovial sarcoma | Canter [57] 2008 | Primary, localized, surgically treated patients with synovial sarcoma who did not receive AI chemotherapy | 1982–2006 | 1 | 3-y and 5-y DSS | 196 | Size (continuous), site (upper extremity vs. lower extremity vs. others), depth (superficial vs. deep), variant (biphasic vs. monophasic) | 0.77 | No | - |
| Rhabdomyo-sarcoma | Yang [60] 2014 | Patients with primary RMS (both localized or metastatic) and aged birth to 19 y | 1990–2010 | SEER database (populationbaseddata set) | 5-y and 10-y OS, median survival time | 1679 | Tumor stage (localized vs. regional vs. distant), surgery (yes vs. no), RT (yes vs. no), size (continuous), histological subtype (alveolar vs. embryonal vs. others), age (continuous), tumor site (favorable vs. unfavorable) | 0.74 | No | |
| Shen [61] 2014 | Patients with primary RMS treated with surgery (all ages) | 1990–2010 | SEER database (populationbaseddata set) | 5-y and 10-y causespecific survival and median survival time for patients treated with surgery alone or with surgery plus RT | 1578 | Age (continuous), size (continuous), stage (localized vs. regional vs. distant), histological subtype (embryonal vs. alveolar vs. pleomorphic vs. others), positive regional lymph nodes (no lymph nodes examined vs. 0 vs. 1–3 vs. 4) | 0.78 | No | ||
| Chisholm [59] 2011 | Children with nonmetastatic RMS and embryonal RMS who developed disease recurrence after achieving complete local control (complete remission or stable mass for >6 mo after the end of therapy) with primary therapy | 1984–2003 (primary treatment) | Multicentric (international registry) | Probability of cure defined as survival 3.0 y after disease recurrence | 474 | Type of recurrence (local vs. metastatic 6 local), prior RT (yes vs. no), type of chemotherapy (2-drug vs. 3-drug vs. 6-drug), lymph node status (N0 vs. N1 vs. Nx), tumor size (missing vs. <5 cm vs. >5 cm), tumor site (favorable vs. unfavorable), histology (alveolar vs. nonalveolar), time to disease recurrence (>1.5 y vs. <1.5 y) | No | |||
| Desmoid-type fibromatosis | Crago [64] 2013 | Surgically treated desmoid-type fibromatosis | 1982–2011 | 1 | 3-y, 5-y, and 7-y LRFS and median time to LR | 495 | Age (continuous), tumor site (extremity vs. chest wall vs. GI/intrabdominal vs. other vs. abdominal wall), size (continuous) | 0.70 | Yes | 0.66 (b) |
| Breast phyllodes tumors | Tan [67] 2012 | Surgically treated phyllodes tumors of the breast | 1992–2010 | 1 | 1-y, 3-y, 5-y, and 10-y RFS | 552 | Surgical resection margin (negative vs. positive), mitosis per 10 high-power fields (continuous), atypia (marked vs. moderate vs. mild), overgrowth (present vs. absent) | 0.79 | No | |
| Uterine leiomyo-sarcoma | Zivanovic [68] 2012 | Surgically treated uterine leiomyosarcoma | 1982–2008 | 1 | 5-y OS | 185 | Mitotic index (continuous), tumor grade (high vs. not high), locoregional metastasis (yes vs. no), distant metastasis (yes vs. no), tumor size (continuous), cervical involvement (yes vs. no), age at diagnosis (continuous) | 0.67 | Yes | 0.67 (c) |
3.5. Histology-Specific and Site-Specific Nomograms
3.5.1. Uterine Leiomyosarcoma
3.5.2. Breast Phyllodes Tumors
4. Future Perspectives
Funding
Conflicts of Interest
References
- Kattan, M.W.; Hess, K.R.; Amin, M.B.; Lu, Y.; Moons, K.G.; Gershenwald, J.E.; Gimotty, P.A.; Guinney, J.H.; Halabi, S.; Lazar, A.J.; et al. members of the AJCC Precision Medicine Core. American Joint Committee on Cancer acceptance criteria for inclusion of risk models for individualized prognosis in the practice of precision medicine. CA Cancer J. Clin. 2016, 66, 370–374. [Google Scholar] [CrossRef] [PubMed] [Green Version]
- Gronchi, A.; Miceli, R.; Shurell, E.; Eilber, F.C.; Eilber, F.R.; Anaya, D.A.; Kattan, M.W.; Honoré, C.; Lev, D.C.; Colombo, C.; et al. Outcome prediction in primary resected retroperitoneal soft tissue sarcoma: Histology-specific overall survival and disease-free survival nomograms built on major sarcoma center data sets. J. Clin. Oncol. 2013, 31, 1649–1655. [Google Scholar] [CrossRef] [PubMed]
- Edge, S.B.; Byrd, D.; Compton, C.C.; Fritz, A.G.; Greene, F.L.; Trotti, A. AJCC Cancer Staging Manual, 7th ed.; Springer: New York, NY, USA, 2010. [Google Scholar]
- Yoon, S.S. The New American Joint Commission on Cancer Staging System for Soft Tissue Sarcomas: Splitting versus Lumping. Ann. Surg. Oncol. 2018, 25, 1101–1102. [Google Scholar] [CrossRef] [Green Version]
- Maki, R.G.; Moraco, N.; Antonescu, C.R.; Hameed, M.; Pinkhasik, A.; Singer, S.; Brennan, M.F. Toward better soft tissue sarcoma staging: Building on american joint committee on cancer staging systems versions 6 and 7. Ann. Surg. Oncol. 2013, 20, 3377–3383. [Google Scholar] [CrossRef] [PubMed]
- Lahat, G.; Tuvin, D.; Wei, C.; Anaya, D.A.; Bekele, B.N.; Lazar, A.J.; Pisters, P.W.; Lev, D.; Pollock, R.E. New perspectives for staging and prognosis in soft tissue sarcoma. Ann. Surg. Oncol. 2008, 15, 2739–2748. [Google Scholar] [CrossRef]
- Cates, J.M.M. Performance Analysis of the American Joint Committee on Cancer 8th Edition Staging System for Retroperitoneal Sarcoma and Development of a New Staging Algorithm for Sarcoma-Specific Survival. Ann. Surg. Oncol. 2017, 24, 3880–3887. [Google Scholar] [CrossRef]
- Fisher, S.B.; Chiang, Y.J.; Feig, B.W.; Cormier, J.N.; Hunt, K.K.; Torres, K.E.; Roland, C.L. An Evaluation of the Eighth Edition of the American Joint Committee on Cancer (AJCC) Staging System for Retroperitoneal Sarcomas Using the National Cancer Data Base (NCDB): Does Size Matter? Am. J. Clin. Oncol. 2019, 42, 160–165. [Google Scholar] [CrossRef] [PubMed]
- Cates, J.M.M. The AJCC 8th Edition Staging System for Soft Tissue Sarcoma of the Extremities or Trunk: A Cohort Study of the SEER Database. J. Natl. Compr. Cancer Netw. 2018, 16, 144–152. [Google Scholar] [CrossRef] [Green Version]
- Pasquali, S.; Palmerini, E.; Quagliuolo, V.; Martin-Broto, J.; Lopez-Pousa, A.; Grignani, G.; Brunello, A.; Blay, J.Y.; Tendero, O.; Diaz-Beveridge, R.; et al. Neoadjuvant chemotherapy in high-risk soft tissue sarcomas: A Sarculator-based risk stratification analysis of the ISG-STS 1001 randomized trial. Cancer 2022, 128, 85–93, Erratum in Cancer 2022, 128, 3265. [Google Scholar] [CrossRef]
- Gronchi, A.; Palmerini, E.; Quagliuolo, V.; Martin Broto, J.; Lopez Pousa, A.; Grignani, G.; Brunello, A.; Blay, J.Y.; Tendero, O.; Diaz Beveridge, R.; et al. Neoadjuvant Chemotherapy in High-Risk Soft Tissue Sarcomas: Final Results of a Randomized Trial From Italian (ISG), Spanish (GEIS), French (FSG), and Polish (PSG) Sarcoma Groups. J. Clin. Oncol. 2020, 38, 2178–2186. [Google Scholar] [CrossRef]
- Callegaro, D.; Miceli, R.; Bonvalot, S.; Ferguson, P.C.; Strauss, D.C.; van Praag, V.V.M.; Levy, A.; Griffin, A.M.; Hayes, A.J.; Stacchiotti, S.; et al. Development and external validation of a dynamic prognostic nomogram for primary extremity soft tissue sarcoma survivors. Eclinicalmedicine 2019, 17, 100215. [Google Scholar] [CrossRef] [Green Version]
- Callegaro, D.; Barretta, F.; Swallow, C.J.; Strauss, D.C.; Bonvalot, S.; Honorè, C.; Stoeckle, E.; van Coevorden, F.; Haas, R.; Rutkowski, P.; et al. Longitudinal prognostication in retroperitoneal sarcoma survivors: Development and external validation of two dynamic nomograms. Eur. J. Cancer 2021, 157, 291–300. [Google Scholar] [CrossRef] [PubMed]
- Rueten-Budde, A.J.; van Praag, V.M.; van de Sande, M.A.J.; Fiocco, M.; PERSARC Study Group. External validation and adaptation of a dynamic prediction model for patients with high-grade extremity soft tissue sarcoma. J. Surg. Oncol. 2021, 123, 1050–1056. [Google Scholar] [CrossRef] [PubMed]
- Kattan, M.W.; Leung, D.H.; Brennan, M.F. Postoperative nomogram for 12-year sarcoma-specific death. J. Clin. Oncol. 2002, 20, 791–796. [Google Scholar] [CrossRef] [PubMed]
- Mariani, L.; Miceli, R.; Kattan, M.W.; Brennan, M.F.; Colecchia, M.; Fiore, M.; Casali, P.G.; Gronchi, A. Validation and adaptation of a nomogram for predicting the survival of patients with extremity soft tissue sarcoma using a three-grade system. Cancer 2005, 103, 402–408. [Google Scholar] [CrossRef]
- Eilber, F.C.; Brennan, M.F.; Eilber, F.R.; Dry, S.M.; Singer, S.; Kattan, M.W. Validation of the postoperative nomogram for 12-year sarcoma-specific mortality. Cancer 2004, 101, 2270–2275. [Google Scholar] [CrossRef]
- Eilber, F.C.; Kattan, M.W. Sarcoma nomogram: Validation and a model to evaluate impact of therapy. J. Am. Coll. Surg. 2007, 205 (Suppl. 4), S90–S95. [Google Scholar] [CrossRef]
- Szkandera, J.; Gerger, A.; Liegl-Atzwanger, B.; Absenger, G.; Stotz, M.; Samonigg, H.; Maurer-Ertl, W.; Stojakovic, T.; Ploner, F.; Leithner, A.; et al. Validation of the prognostic relevance of plasma C-reactive protein levels in soft-tissue sarcoma patients. Br. J. Cancer 2013, 109, 2316–2322. [Google Scholar] [CrossRef] [Green Version]
- Szkandera, J.; Pichler, M.; Liegl-Atzwanger, B.; Absenger, G.; Stotz, M.; Ploner, F.; Stojakovic, T.; Samonigg, H.; Eberhard, K.; Leithner, A.; et al. The elevated pre-operative plasma fibrinogen level is an independent negative prognostic factor for cancer-specific, disease-free and overall survival in soft-tissue sarcoma patients. J. Surg. Oncol. 2014, 109, 139–144. [Google Scholar] [CrossRef]
- Ng, D.W.J.; Tan, G.H.C.; Chia, C.S.; Lim, C.X.; Chee, S.K.; Quek, R.H.H.; Farid, M.; Teo, M.C.C. Is the Memorial Sloan Kettering Cancer Centre (MSKCC) sarcoma nomogram useful in an Asian population? Asia-Pac. J. Clin. Oncol. 2017, 13, e466–e472. [Google Scholar] [CrossRef]
- Bagaria, S.P.; Wagie, A.E.; Gray, R.J.; Pockaj, B.A.; Attia, S.; Habermann, E.B.; Wasif, N. Validation of a Soft Tissue Sarcoma Nomogram Using a National Cancer Registry. Ann. Surg. Oncol. 2015, 22 (Suppl. 3), S398–S403. [Google Scholar] [CrossRef] [PubMed]
- Shuman, A.G.; Brennan, M.F.; Palmer, F.L.; Kuk, D.; Moraco, N.; Singer, S.; Shah, J.P.; Patel, S.G. Soft tissue sarcoma of the head & neck: Nomogram validation and analysis of staging systems. J. Surg. Oncol. 2015, 111, 690–695. [Google Scholar] [CrossRef] [Green Version]
- Tan, M.C.; Brennan, M.F.; Kuk, D.; Agaram, N.P.; Antonescu, C.R.; Qin, L.X.; Moraco, N.; Crago, A.M.; Singer, S. Histology-based Classification Predicts Pattern of Recurrence and Improves Risk Stratification in Primary Retroperitoneal Sarcoma. Ann. Surg. 2016, 263, 593–600. [Google Scholar] [CrossRef] [PubMed] [Green Version]
- Squires, M.H.; Ethun, C.G.; Donahue, E.E.; Benbow, J.H.; Anderson, C.J.; Jagosky, M.H.; Salo, J.C.; Hill, J.S.; Ahrens, W.; Prabhu, R.S.; et al. A multi-institutional validation study of prognostic nomograms for retroperitoneal sarcoma. J. Surg. Oncol. 2021, 124, 829–837. [Google Scholar] [CrossRef] [PubMed]
- Wong, R.X.; Koh, Y.S.; Ong, F.; Farid, M.; Tay, T.K.Y.; Teo, M. Applicability of the Sarculator and MSKCC nomograms to retroperitoneal sarcoma prognostication in an Asian tertiary center. Asian J. Surg. 2020, 43, 1078–1085. [Google Scholar] [CrossRef]
- Ferrari, A.; Miceli, R.; Casanova, M.; Gronchi, A.; Collini, P.; Meazza, C.; Zaffignani, E.; Massimino, M.; Spreafico, F.; Mariani, L. Adult-type soft tissue sarcomas in paediatric age: A nomogram-based prognostic comparison with adult sarcoma. Eur. J. Cancer 2007, 43, 2691–2697. [Google Scholar] [CrossRef]
- Szkandera, J.; Gerger, A.; Liegl-Atzwanger, B.; Absenger, G.; Stotz, M.; Friesenbichler, J.; Trajanoski, S.; Stojakovic, T.; Eberhard, K.; Leithner, A.; et al. The lymphocyte/monocyte ratio predicts poor clinical outcome and improves the predictive accuracy in patients with soft tissue sarcomas. Int. J. Cancer 2013, 135, 362–370. [Google Scholar] [CrossRef] [PubMed]
- Kandel, R.A.; Bell, R.S.; Wunder, J.S.; O′Sullivan, B.; Catton, C.N.; White, L.M.; Davis, A.M. Comparison between a 2- and 3-grade system in predicting metastatic-free survival in extremity soft-tissue sarcoma. J. Surg. Oncol. 1999, 72, 77–82. [Google Scholar] [CrossRef]
- Danieli, M.; Barretta, F.; Fiore, M.; Radaelli, S.; Sangalli, C.; Barisella, M.; Stacchiotti, S.; Palassini, E.; Miceli, R.; Frezza, A.M.; et al. Refining the Approach to Patients with Primary Soft Tissue Sarcoma of the Extremities and Trunk Wall: Outcome Improvement Over Time at a Single Institution. Ann. Surg. Oncol. 2022, 29, 3274–3286. [Google Scholar] [CrossRef]
- Squires, M.H.; Ethun, C.G.; Donahue, E.E.; Benbow, J.H.; Anderson, C.J.; Jagosky, M.H.; Manandhar, M.; Patt, J.C.; Kneisl, J.S.; Salo, J.C.; et al. Extremity Soft Tissue Sarcoma: A Multi-Institutional Validation of Prognostic Nomograms. Ann. Surg. Oncol. 2022, 29, 3291–3301. [Google Scholar] [CrossRef] [PubMed]
- Cahlon, O.; Brennan, M.F.; Jia, X.; Qin, L.X.; Singer, S.; Alektiar, K.M. A postoperative nomogram for local recurrence risk in extremity soft tissue sarcomas after limb-sparing surgery without adjuvant radiation. Ann. Surg. 2012, 255, 343–347. [Google Scholar] [CrossRef] [PubMed] [Green Version]
- Bonvalot, S.; Levy, A.; Terrier, P.; Tzanis, D.; Bellefqih, S.; Le Cesne, A.; Le Péchoux, C. Primary Extremity Soft Tissue Sarcomas: Does Local Control Impact Survival? Ann. Surg. Oncol. 2017, 24, 194–201. [Google Scholar] [CrossRef] [PubMed]
- Callegaro, D.; Miceli, R.; Bonvalot, S.; Ferguson, P.; Strauss, D.C.; Levy, A.; Griffin, A.; Hayes, A.J.; Stacchiotti, S.; Pechoux, C.L.; et al. Development and external validation of two nomograms to predict overall survival and occurrence of distant metastases in adults after surgical resection of localised soft-tissue sarcomas of the extremities: A retrospective analysis. Lancet Oncol. 2016, 17, 671–680. [Google Scholar] [CrossRef]
- Digital Forest srl. Available online: http://play.google.com/store/apps/details?id=it.digitalforest.sarculator (accessed on 10 January 2023).
- Voss, R.K.; Callegaro, D.; Chiang, Y.J.; Fiore, M.; Miceli, R.; Keung, E.Z.; Feig, B.W.; Torres, K.E.; Scally, C.P.; Hunt, K.K.; et al. Sarculator is a Good Model to Predict Survival in Resected Extremity and Trunk Sarcomas in US Patients. Ann. Surg. Oncol. 2022, 29, 4376–4385. [Google Scholar] [CrossRef]
- Pasquali, S.; Pizzamiglio, S.; Touati, N.; Litiere, S.; Marreaud, S.; Kasper, B.; Gelderblom, H.; Stacchiotti, S.; Judson, I.; Dei Tos, A.P.; et al. The impact of chemotherapy on survival of patients with extremity and trunk wall soft tissue sarcoma: Revisiting the results of the EORTC-STBSG 62931 randomised trial. Eur. J. Cancer 2019, 109, 51–60. [Google Scholar] [CrossRef]
- van Praag, V.M.; Rueten-Budde, A.J.; Jeys, L.M.; Laitinen, M.K.; Pollock, R.; Aston, W.; van der Hage, J.A.; Dijkstra, P.D.S.; Ferguson, P.C.; Griffin, A.M.; et al. A prediction model for treatment decisions in high-grade extremity soft-tissue sarcomas: Personalised sarcoma care (PERSARC). Eur. J. Cancer 2017, 83, 313–323. [Google Scholar] [CrossRef]
- Rueten-Budde, A.J.; van Praag, V.M.; PERSARC study group; van de Sande, M.A.J.; Fiocco, M. Dynamic prediction of overall survival for patients with high-grade extremity soft tissue sarcoma. Surg. Oncol. 2018, 27, 695–701. [Google Scholar] [CrossRef]
- Gronchi, A.; Strauss, D.C.; Miceli, R.; Bonvalot, S.; Swallow, C.J.; Hohenberger, P.; Van Coevorden, F.; Rutkowski, P.; Callegaro, D.; Hayes, A.J.; et al. Variability in Patterns of Recurrence After Resection of Primary Retroperitoneal Sarcoma (RPS): A Report on 1007 Patients From the Multi-institutional Collaborative RPS Working Group. Ann. Surg. 2016, 263, 1002–1009. [Google Scholar] [CrossRef] [PubMed]
- Gronchi, A.; Miceli, R.; Allard, M.A.; Callegaro, D.; Le Péchoux, C.; Fiore, M.; Honoré, C.; Sanfilippo, R.; Coppola, S.; Stacchiotti, S.; et al. Personalizing the approach to retroperitoneal soft tissue sarcoma: Histology-specific patterns of failure and postrelapse outcome after primary extended resection. Ann. Surg. Oncol. 2015, 22, 1447–1454. [Google Scholar] [CrossRef]
- Toulmonde, M.; Bonvalot, S.; Ray-Coquard, I.; Stoeckle, E.; Riou, O.; Isambert, N.; Bompas, E.; Penel, N.; Delcambre-Lair, C.; Saada, E.; et al. French Sarcoma Group. Retroperitoneal sarcomas: Patterns of care in advanced stages, prognostic factors and focus on main histological subtypes: A multicenter analysis of the French Sarcoma Group. Ann. Oncol. 2014, 25, 730–734. [Google Scholar] [CrossRef]
- Singer, S.; Antonescu, C.R.; Riedel, E.; Brennan, M.F.; Pollock, R.E. Histologic Subtype and Margin of Resection Predict Pattern of Recurrence and Survival for Retroperitoneal Liposarcoma. Ann. Surg. 2003, 238, 358–371. [Google Scholar] [CrossRef]
- Lahat, G.; Anaya, D.A.; Wang, X.; Tuvin, D.; Lev, D.; Pollock, R.E. Resectable well-differentiated versus dedifferentiated liposarcomas: Two different diseases possibly requiring different treatment approaches. Ann. Surg. Oncol. 2008, 15, 1585–1593. [Google Scholar] [CrossRef] [PubMed]
- Pasquali, S.; Gronchi, A.; Strauss, D.; Bonvalot, S.; Jeys, L.; Stacchiotti, S.; Hayes, A.; Honore, C.; Collini, P.; Renne, S.L.; et al. Resectable extra-pleural and extra-meningeal solitary fibrous tumours: A multi-centre prognostic study. Eur. J. Surg. Oncol. 2016, 42, 1064–1070. [Google Scholar] [CrossRef]
- Gronchi, A.; Collini, P.; Miceli, R.; Valeri, B.; Renne, S.L.; Dagrada, G.; Fiore, M.; Sanfilippo, R.; Barisella, M.; Colombo, C.; et al. Myogenic differentiation and histologic grading are major prognostic determinants in retroperitoneal liposarcoma. Am. J. Surg. Pathol. 2015, 39, 383–393. [Google Scholar] [CrossRef] [PubMed]
- Callegaro, D.; Raut, C.P.; Ng, D.; Strauss, D.C.; Honoré, C.; Stoeckle, E.; Bonvalot, S.; Haas, R.L.; Vassos, N.; Conti, L.; et al. Has the Outcome for Patients Who Undergo Resection of Primary Retroperitoneal Sarcoma Changed Over Time? A Study of Time Trends During the Past 15 years. Ann. Surg. Oncol. 2021, 28, 1700–1709. [Google Scholar] [CrossRef]
- Anaya, D.A.; Lahat, G.; Wang, X.; Xiao, L.; Pisters, P.W.; Cormier, J.N.; Hunt, K.K.; Feig, B.W.; Lev, D.C.; Pollock, R.E. Postoperative nomogram for survival of patients with retroperitoneal sarcoma treated with curative intent. Ann. Oncol. 2010, 21, 397–402. [Google Scholar] [CrossRef]
- Raut, C.P.; Callegaro, D.; Miceli, R.; Barretta, F.; Rutkowski, P.; Blay, J.Y.; Lahat, G.; Strauss, D.C.; Gonzalez, R.; Ahuja, N.; et al. Predicting Survival in Patients Undergoing Resection for Locally Recurrent Retroperitoneal Sarcoma: A Study and Novel Nomogram from TARPSWG. Clin. Cancer Res. 2019, 25, 2664–2671. [Google Scholar] [CrossRef] [Green Version]
- Raut, C.P.; Miceli, R.; Strauss, D.C.; Swallow, C.J.; Hohenberger, P.; van Coevorden, F.; Rutkowski, P.; Fiore, M.; Callegaro, D.; Casali, P.G.; et al. External validation of a multi-institutional retroperitoneal sarcoma nomogram. Cancer 2016, 122, 1417–1424. [Google Scholar] [CrossRef] [Green Version]
- Chou, Y.S.; Liu, C.Y.; Chang, Y.H.; King, K.L.; Chen, P.C.; Pan, C.C.; Shen, S.H.; Liu, Y.M.; Lin, A.T.; Chen, K.K.; et al. Prognostic factors of primary resected retroperitoneal soft tissue sarcoma: Analysis from a single asian tertiary center and external validation of gronchi’s nomogram. J. Surg. Oncol. 2016, 113, 355–360. [Google Scholar] [CrossRef]
- Nessim, C.; Raut, C.P.; Callegaro, D.; Barretta, F.; Miceli, R.; Fairweather, M.; Rutkowski, P.; Blay, J.Y.; Strauss, D.; Gonzalez, R.; et al. Postoperative Morbidity After Resection of Recurrent Retroperitoneal Sarcoma: A Report from the Transatlantic Australasian RPS Working Group (TARPSWG). Ann. Surg. Oncol. 2021, 28, 2705–2714. [Google Scholar] [CrossRef] [PubMed]
- Seidensaal, K.; Kieser, M.; Hommertgen, A.; Jaekel, C.; Harrabi, S.B.; Herfarth, K.; Mechtesheimer, G.; Lehner, B.; Schneider, M.; Nienhueser, H.; et al. Neoadjuvant irradiation of retroperitoneal soft tissue sarcoma with ions (Retro-Ion): Study protocol for a randomized phase II pilot trial. Trials 2021, 22, 134. [Google Scholar] [CrossRef] [PubMed]
- Ng, D.; Cyr, D.P.; Burtenshaw, S.M.; Callegaro, D.; Gronchi, A.; Shultz, D.; Brar, S.; Chung, P.; Gladdy, R.A.; Catton, C.; et al. Effect of Preoperative Treatment on the Performance of Predictive Nomograms in Primary Retroperitoneal Sarcoma. Ann. Surg. Oncol. 2022, 29, 2304–2314. [Google Scholar] [CrossRef] [PubMed]
- Dalal, K.M.; Kattan, M.W.; Antonescu, C.R.; Brennan, M.F.; Singer, S. Subtype specific prognostic nomogram for patients with primary liposarcoma of the retroperitoneum, extremity, or trunk. Ann. Surg. 2006, 244, 381–391. [Google Scholar] [CrossRef] [PubMed]
- Stacchiotti, S.; Van Tine, B.A. Synovial Sarcoma: Current Concepts and Future Perspectives. J. Clin. Oncol. 2018, 36, 180–187. [Google Scholar] [CrossRef]
- Canter, R.J.; Qin, L.X.; Maki, R.G.; Brennan, M.F.; Ladanyi, M.; Singer, S. A synovial sarcoma-specific preoperative nomogram supports a survival benefit to ifosfamide-based chemotherapy and improves risk stratification for patients. Clin. Cancer Res. 2008, 14, 8191–8197. [Google Scholar] [CrossRef] [Green Version]
- Gartrell, J.; Pappo, A. Recent advances in understanding and managing pediatric rhabdomyosarcoma. F1000Research 2020, 9, 685. [Google Scholar] [CrossRef]
- Chisholm, J.C.; Marandet, J.; Rey, A.; Scopinaro, M.; de Toledo, J.S.; Merks, J.H.; O′Meara, A.; Stevens, M.C.; Oberlin, O. Prognostic factors after relapse in nonmetastatic rhabdomyosarcoma: A nomogram to better define patients who can be salvaged with further therapy. J. Clin. Oncol. 2011, 29, 1319–1325. [Google Scholar] [CrossRef] [Green Version]
- Yang, L.; Takimoto, T.; Fujimoto, J. Prognostic model for predicting overall survival in children and adolescents with rhabdomyosarcoma. BMC Cancer 2014, 14, 654. [Google Scholar] [CrossRef] [Green Version]
- Shen, W.; Sakamoto, N.; Yang, L. Model to predict the survival benefit of radiation for patients with rhabdomyosarcoma after surgery: A population-based study. Int. J. Oncol. 2014, 45, 549–557. [Google Scholar] [CrossRef] [Green Version]
- Gronchi, A.; Miah, A.B.; Dei Tos, A.P.; Abecassis, N.; Bajpai, J.; Bauer, S.; Biagini, R.; Bielack, S.; Blay, J.Y.; Stacchiotti, S.; et al. ESMO Guidelines Committee, EURACAN and GENTURIS. Electronic address: Clinicalguidelines@esmo.org. Soft tissue and visceral sarcomas: ESMO-EURACAN-GENTURIS Clinical Practice Guidelines for diagnosis, treatment and follow-up☆. Ann. Oncol. 2021, 32, 1348–1365. [Google Scholar] [CrossRef]
- Desmoid Tumor Working Group. The management of desmoid tumours: A joint global consensus-based guideline approach for adult and paediatric patients. Eur. J. Cancer 2020, 127, 96–107. [Google Scholar] [CrossRef] [Green Version]
- Crago, A.M.; Denton, B.; Salas, S.; Dufresne, A.; Mezhir, J.J.; Hameed, M.; Gonen, M.; Singer, S.; Brennan, M.F. A prognostic nomogram for prediction of recurrence in desmoid fibromatosis. Ann. Surg. 2013, 258, 347–353. [Google Scholar] [CrossRef] [Green Version]
- Lazar, A.J.; Tuvin, D.; Hajibashi, S.; Habeeb, S.; Bolshakov, S.; Mayordomo-Aranda, E.; Warneke, C.L.; Lopez-Terrada, D.; Pollock, R.E.; Lev, D. Specific mutations in the beta-catenin gene (CTNNB1) correlate with local recurrence in sporadic desmoid tumors. Am. J. Pathol. 2008, 173, 1518–1527. [Google Scholar] [CrossRef] [PubMed] [Green Version]
- van Broekhoven, D.L.; Verhoef, C.; Grünhagen, D.J.; van Gorp, J.M.; den Bakker, M.A.; Hinrichs, J.W.; de Voijs, C.M.; van Dalen, T. Prognostic value of CTNNB1 gene mutation in primary sporadic aggressive fibromatosis. Ann. Surg. Oncol. 2015, 22, 1464–1470. [Google Scholar] [CrossRef]
- Tan, P.H.; Thike, A.A.; Tan, W.J.; Thu, M.M.; Busmanis, I.; Li, H.; Chay, W.Y.; Tan, M.H.; Phyllodes Tumour Network Singapore. Predicting clinical behaviour of breast phyllodes tumours: A nomogram based on histological criteria and surgical margins. J. Clin. Pathol. 2012, 65, 69–76. [Google Scholar] [CrossRef] [Green Version]
- Zivanovic, O.; Jacks, L.M.; Iasonos, A.; Leitao, M.M., Jr.; Soslow, R.A.; Veras, E.; Chi, D.S.; Abu-Rustum, N.R.; Barakat, R.R.; Brennan, M.F.; et al. A nomogram to predict postresection 5-year overall survival for patients with uterine leiomyosarcoma. Cancer 2012, 118, 660–669. [Google Scholar] [CrossRef] [PubMed]
- Iasonos, A.; Keung, E.Z.; Zivanovic, O.; Mancari, R.; Peiretti, M.; Nucci, M.; George, S.; Colombo, N.; Carinelli, S.; Hensley, M.L.; et al. External validation of a prognostic nomogram for overall survival in women with uterine leiomyosarcoma. Cancer 2013, 119, 1816–1822. [Google Scholar] [CrossRef] [PubMed] [Green Version]
- Tan, B.Y.; Acs, G.; Apple, S.K.; Badve, S.; Bleiweiss, I.J.; Brogi, E.; Calvo, J.P.; Dabbs, D.J.; Ellis, I.O.; Eusebi, V.; et al. Phyllodes tumours of the breast: A consensus review. Histopathology 2016, 68, 5–21. [Google Scholar] [CrossRef] [Green Version]
- Chibon, F.; Lagarde, P.; Salas, S.; Pérot, G.; Brouste, V.; Tirode, F.; Lucchesi, C.; de Reynies, A.; Kauffmann, A.; Bui, B.; et al. Validated prediction of clinical outcome in sarcomas and multiple types of cancer on the basis of a gene expression signature related to genome complexity. Nat. Med. 2010, 16, 781–787. [Google Scholar] [CrossRef]
- Filleron, T.; Le Guellec, S.; Chevreau, C.; Cabarrou, B.; Lesluyes, T.; Lodin, S.; Massoubre, A.; Mounier, M.; Poublanc, M.; Chibon, F.; et al. Value of peri-operative chemotherapy in patients with CINSARC high-risk localized grade 1 or 2 soft tissue sarcoma: Study protocol of the target selection phase III CHIC-STS trial. BMC Cancer 2020, 20, 716. [Google Scholar] [CrossRef]
- Frezza, A.M.; Stacchiotti, S.; Chibon, F.; Coindre, J.M.; Italiano, A.; Romagnosa, C.; Bagué, S.; Dei Tos, A.P.; Braglia, L.; Palmerini, E.; et al. CINSARC in high-risk soft tissue sarcoma patients treated with neoadjuvant chemotherapy: Results from the ISG-STS 1001 study. Cancer Med. 2023, 12, 1350–1357. [Google Scholar] [CrossRef] [PubMed]
- Foersch, S.; Eckstein, M.; Wagner, D.C.; Gach, F.; Woerl, A.C.; Geiger, J.; Glasner, C.; Schelbert, S.; Schulz, S.; Porubsky, S.; et al. Deep learning for diagnosis and survival prediction in soft tissue sarcoma. Ann. Oncol. 2021, 32, 1178–1187. [Google Scholar] [CrossRef] [PubMed]
- Crombé, A.; Roulleau-Dugage, M.; Italiano, A. The diagnosis, classification, and treatment of sarcoma in this era of artificial intelligence and immunotherapy. Cancer Commun. 2022, 42, 1288–1313. [Google Scholar] [CrossRef] [PubMed]
- Shahbaz, S.K.; Koushki, K.; Ayati, S.H.; Bland, A.R.; Bezsonov, E.E.; Sahebkar, A. Inflammasomes and Colorectal Cancer. Cells 2021, 10, 2172. [Google Scholar] [CrossRef]


| Study | Development Series Characteristics | Nomogram Details | Internal Validation | External Validation | |||||
|---|---|---|---|---|---|---|---|---|---|
| Selection Criteria | Timeframe | No. of Centers | Predicted Outcomes | No. of Patients | Nomogram’s Covariates (a) | Concordance Index | Yes/No | Concordance Index | |
| Anaya [48] 2010 | Primary or recurrent, nonmetastatic, resected | 1996–2006 | 1 | Median OS, 3-y OS, and 5-y OS | 343 | Histology (3 categories), completeness of surgical resection, age (dichotomic; cutoff at 65 y), multifocality, tumor size (dichotomic; cutoff at 15 cm), presentation (primary vs. recurrent) | 0.73 (95% CI, 0.71–0.75) | No | - |
| Ardoino [10] 2010 | Primary, localized, resected | 1985–2007 | 1 | 5-y OS and 10-y OS | 192 | Histology (5 categories), FNCLCC grade, size (continuous), surgical resection margins (complete vs. incomplete), age (continuous) | 0.73 | No | - |
| Gronchi [2] 2013 | Primary, localized, resected | 1999–2009 | 3 | 7-y OS | 523 | FNCLCC grade, tumor size (continuous), histology (7 categories), patient age (continuous), multifocality (yes vs. no), extent of surgical resection (complete vs. incomplete) | 0.74 | Yes | 0.67–0.73 (b) |
| 7-y DFS | 475 | FNCLCC grade, tumor size (continuous), histology (7 categories), multifocality (yes vs. no) | 0.71 | Yes | 0.63–0.69 (b) | ||||
| Tan [24] 2016 | Primary, localized, resected | 1982–2010 | 1 | 3-y, 5-y, and 10-y DSD | 632 | Histology (7 categories), extent of surgical resection (R0/R1 vs. R2), no. of organs resected (dichotomic, cutoff at 3 organs), size (3 categories), RT (yes vs. no) | 0.71 (95% CI, 0.66–0.74) | No | - |
| 3-y, 5-y, and 10-y LR rate | 574 | Histology (7 categories), size (3 categories), age (dichotomic; cutoff at 65 y), surgical resection (R0 vs. R1), location (pelvis vs. other), vascular resection (yes vs. no), no. of resected organs (dichotomic; cutoff at 3 organs) | 0.71 (95% CI, 0.67–0.75) | No | - | ||||
| 3-y, 5-y, and 10-y DR rate | 632 | Histology (7 categories), no. of resected organs (0 vs. 1–2 vs. 3 organs), size (3 categories), RT (yes vs. no), vascular resection (yes vs. no) | 0.74 (95% CI, 0.69–0.77) | No | - | ||||
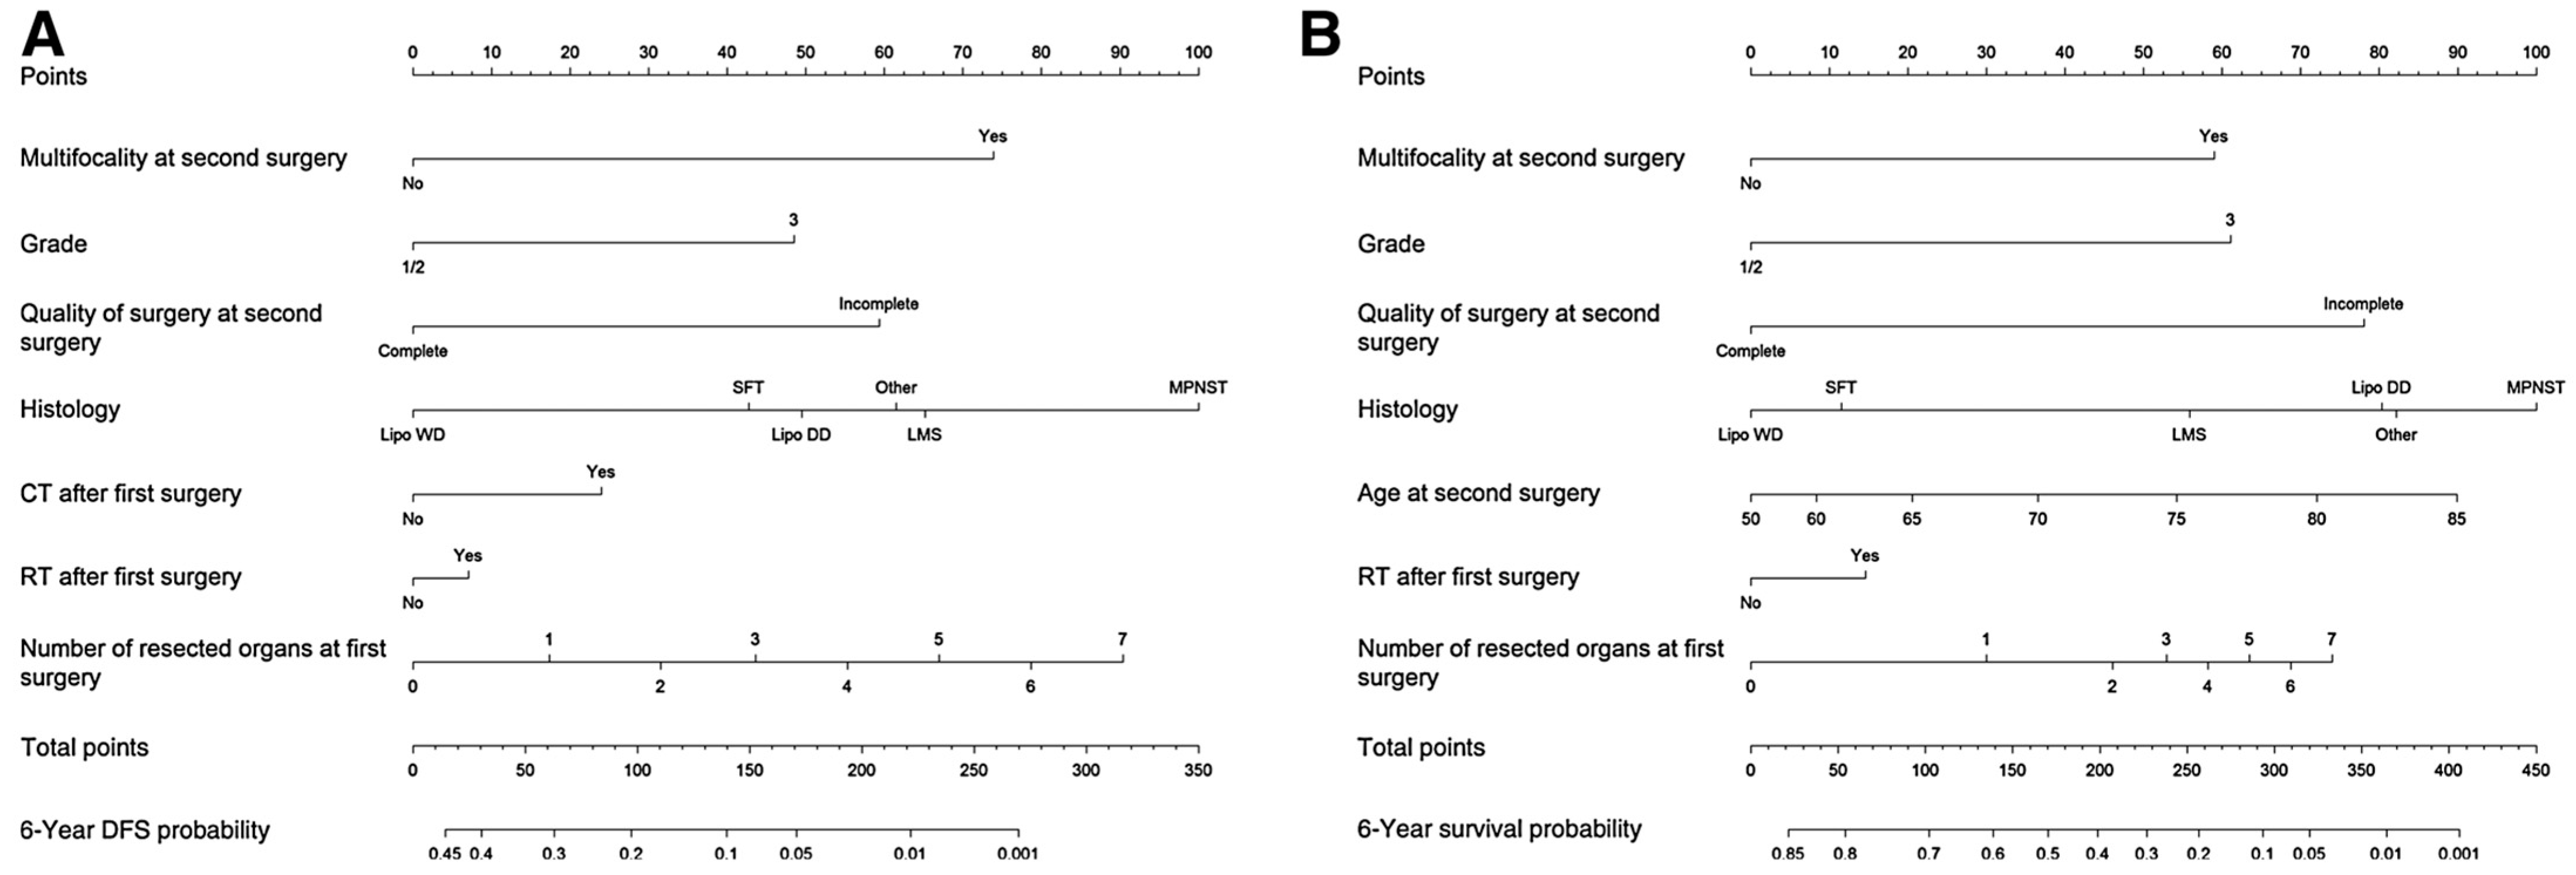
| Raut [49] 2019 | First local relapse, nonmetastatic, resected with curative intent | 2002–2011 | 22 (TARPSWG centers) | 6-y DFS | 602 | Histology (6 categoies), number of resected organs at first surgery (0–7), multifocality at second surgery (yes vs. no), quality of surgery at second surgery (complete vs. incomplete), grade (1/2 vs. 3), ChT after first surgery (yes vs. no), RT after first surgery (yes vs. no) | 0.67 | No | - |
| 22 (TARPSWG centers) | 6-y OS | 602 | Histology (6 categories), age at second surgery (continuous), quality of surgery at second surgery (complete vs. incomplete), number of resected organs at first surgery (0–7), grade (1/2 vs. 3), multifocality at second surgery (yes vs. no), RT after first surgery (yes vs. no) | 0.70 | No | - | |||
| Callegaro [13] 2021 | Primary (non-recurrent), non-metastatic, resected with curative intent | 2002–2017 | 4 | 5-y OS at different time points (0–60 months) throughout the first 5 years of follow-up | 1357 | Landmark time, FNCLCC grade (1/2/3), occurrence of LR (yes vs. no), occurrence of DM (yes vs. no), age at first surgery (continuous), and completeness of resection (complete vs. incomplete) | 0.75–0.85 | Yes | 0.72–0.79 (c) |
| 4 | 5-y DFS at different time points (0–60 months) throughout the first 5 years of follow-up | 1357 | Tumour size (continuous), FNCLCCgrade (1/2/3), multifocality (yes vs. no), landmark time, histology and the interaction terms between landmark time and tumour size, tumour grade, and multifocality. | 0.64–0.72 | Yes | 0.62–0.68 (c) | |||
Disclaimer/Publisher’s Note: The statements, opinions and data contained in all publications are solely those of the individual author(s) and contributor(s) and not of MDPI and/or the editor(s). MDPI and/or the editor(s) disclaim responsibility for any injury to people or property resulting from any ideas, methods, instructions or products referred to in the content. |
© 2023 by the authors. Licensee MDPI, Basel, Switzerland. This article is an open access article distributed under the terms and conditions of the Creative Commons Attribution (CC BY) license (https://creativecommons.org/licenses/by/4.0/).
Share and Cite
Danieli, M.; Gronchi, A. Staging Systems and Nomograms for Soft Tissue Sarcoma. Curr. Oncol. 2023, 30, 3648-3671. https://doi.org/10.3390/curroncol30040278
Danieli M, Gronchi A. Staging Systems and Nomograms for Soft Tissue Sarcoma. Current Oncology. 2023; 30(4):3648-3671. https://doi.org/10.3390/curroncol30040278
Chicago/Turabian StyleDanieli, Maria, and Alessandro Gronchi. 2023. "Staging Systems and Nomograms for Soft Tissue Sarcoma" Current Oncology 30, no. 4: 3648-3671. https://doi.org/10.3390/curroncol30040278