Article

The Clinicopathological Significance of BiP/GRP-78 in Breast Cancer: A Meta-Analysis of Public Datasets and Immunohistochemical Detection

by
Inês Direito
1,†,
Daniela Gomes
1,†,
Fátima Liliana Monteiro
1,
Isa Carneiro
2,3,
João Lobo
2,3,4,
Rui Henrique
2,3,4,
Carmen Jerónimo
2,3,4 and
Luisa Alejandra Helguero
1,*
1
iBiMED—Institute of Biomedicine, University of Aveiro, Agra do Crasto 30, 3810-193 Aveiro, Portugal
2
Department of Pathology, Portuguese Oncology Institute of Porto (IPO Porto), R. Dr. António Bernardino de Almeida, 4200-072 Porto, Portugal
3
Cancer Biology and Epigenetics Group, IPO Porto Research Center (CI-IPOP), Portuguese Oncology Institute of Porto (IPO Porto)/Porto Comprehensive Cancer Centre (Porto.CCC) & RISE@CI-IPOP (Health Research Network), R. Dr. António Bernardino de Almeida, 4200-072 Porto, Portugal
4
Department of Pathology and Molecular Immunology, School of Medicine & Biomedical Sciences, University of Porto (ICBAS-UP), Rua Jorge Viterbo Ferreira 228, 4050-513 Porto, Portugal
*
Author to whom correspondence should be addressed.
These authors contributed equally to this work.
Curr. Oncol. 2022, 29(12), 9066-9087; https://doi.org/10.3390/curroncol29120710
Submission received: 21 October 2022 / Revised: 15 November 2022 / Accepted: 17 November 2022 / Published: 23 November 2022
(This article belongs to the Topic Adaptation Mechanisms in Therapy-Resistant Breast Cancer)

Abstract

:
The endoplasmic reticulum chaperone BiP (also known as GRP-78 or HSPA5) maintains protein folding to allow cell proliferation and survival and has been implicated in carcinogenesis, tumor progression, and therapy resistance. BiP’s association with clinical factors and prognostic potential in breast cancer remains unclear. In this work, three types of analysis were conducted to improve the knowledge of BiP’s clinicopathological potential: (1) analysis of publicly available RNA-seq and proteomics datasets stratified as high and low quartiles; (2) a systematic review and meta-analysis of immunohistochemical detection of BIP; (3) confirmation of findings by BiP immunohistochemical detection in two luminal-like breast cancer small cohorts of paired samples (pre- vs. post-endocrine therapy, and primary pre- vs. metastasis post-endocrine therapy). The TCGA PanCancer dataset and CPTAC showed groups with high BiP mRNA and protein associated with HER2, basal-like subtypes, and higher immune scores. The meta-analysis of BiP immunohistochemistry disclosed an association between higher BiP positivity and reduced relapse-free survival. BiP immunohistochemistry confirmed increased BiP expression in metastasis, an association of BiP positivity with HER2 expression, and nuclear BiP localization with higher a tumor stage and poor outcome. Therefore, three independent approaches showed that BiP protein is associated with worse outcomes and holds prognostic potential for breast cancer.

1. Introduction

Breast cancer is a heterogeneous disease which represents the highest worldwide incidence of cancer in the female population. While prognosis is highly variable depending on the breast cancer subtype, breast cancer remains the leading cause of cancer death in women [1]. One of the current challenges is the identification of markers to improve stratification and predict responses to therapy. Several pre-clinical models have shown that breast cancer cells exploit the unfolded protein response (UPR) to survive therapy [2]. Independent studies have also shown an association of UPR proteins with breast cancer clinical factors, such as lymph node metastasis, estrogen receptor positivity, or decreased overall survival.
The UPR is activated in response to unfolded protein load in the endoplasmic reticulum and constitutes a cytoprotective stress response to maintain proteostasis and allow the adaptation of cells to environmental and metabolic changes [3,4]. The endoplasmic reticulum stressor sensor-binding immunoglobulin protein BiP, also known as GRP-78 or HSPA5, belongs to the HSP70 molecular chaperone family and resides primarily in the endoplasmic reticulum. This multifunctional protein targets misfolded proteins for proteasomal degradation, facilitates the folding and assembly of unfolded proteins to prevent intra and intermolecular aggregation, and controls the activation of transmembrane endoplasmic reticulum stress sensors (IRE1α, PERK and ATF6). Release of endoplasmic reticulum stress sensors from BiP leads to UPR activation and transcription of genes that promote survival and metabolic adaptation [5,6]. Expression of BiP is minimal in benign breast lesions, but it rises dramatically as breast cancer progresses [5,6,7,8]. HER2 amplification, acquired antiestrogen resistance and triple-negative tumors have been associated with increased BiP expression [9]. In addition, some publications correlated BiP protein overexpression with increased tumor size, increased tumor stage and grade, increased number of positive lymph nodes, distant metastasis, recurrent disease, and poor prognosis [5,10]. Furthermore, patients with positive BiP expression have lower overall survival and disease-free survival [11]. Recently, BiP was also found to be expressed on the cell surface of breast cancer cells, linked to early stages of the disease, high p53 and progesterone receptor (PR) levels, and a favorable prognosis in ER-positive tumors [12]. In triple-negative breast cancer, localization of BiP in the plasma membrane has been associated with increased apoptosis and tumor growth inhibition [13]. In addition, BiP controls calcium homeostasis and estrogen receptor alpha (ER)-mediated non-genomic signaling [4,14,15]. Due to its importance as a master regulator in the endoplasmic reticulum it is not surprising that BiP overexpression has been linked to breast cancer progression, as it allows proliferation, angiogenesis, and impacts the response to anticancer therapy [6,15,16,17,18,19,20].
Despite all the recent findings, to date, there is no evaluation of BiP association with clinical factors and pathways in large-scale datasets of mRNA and proteins such as TCGA [21] and CPTAC [22]. Additionally, there is no consensus on the correlation of BiP immunohistochemical expression with breast cancer clinical factors, and its marker potential is unknown. In this work, we carried out a systematic review of the literature and meta-analysis to investigate the associations between immunohistochemical detection of BiP in breast cancer and clinicopathological variables such as lymph node metastasis, molecular differentiation, tumor stage, grade and survival. Moreover, using the cBioPortal [23] to analyze the TCGA PanCancer dataset [21] and CPTAC [22], we were able to confirm that BiP mRNA and protein levels are associated with PAM50 breast cancer molecular subtype and the three immunohistochemical markers used in breast cancer diagnosis (ER, PR, and HER2), with them being higher in HER2+ and triple-negative breast cancer. This analysis also disclosed a potential association of BiP with the immune system, as well as identified pathways that explain these associations. Meta-analysis disclosed an association between higher BiP immunohistochemical positivity and relapse-free survival (RFS). Finally, using a small cohort of breast cancer cases, we were able to confirm increased BiP expression in metastatic tumors. BiP immunohistochemical positivity is associated with HER2 expression and its nuclear expression was related to a higher tumor stage and poorer outcome, highlighting the potential of this protein as a prognostic indicator for breast cancer.

2. Materials and Methods

2.1. Analysis of Public Datasets

The analysis of BiP mRNA expression in tumors, normal tissues, and metastasis was performed using RNA-seq or Gene-ChIP data available in the TNMplot [24] online tool assessed on 22 July 2022.
The publicly available database for tumor genomics and transcriptomics, the cBio Cancer Genomics Portal (cBioPortal) [23], accessed on 28 April 2022 [25], was used to perform an integrative analysis of treatment-naïve primary breast cancers. The TCGA PanCancer dataset, consisting of 1084 samples, of which only 10 samples had been treated [21], was stratified according to mRNA expression z-scores relative to all samples (log RNA Seq V2 RSEM) [BiP-Low (BiP-L) (−2.37–0.66; n = 270 samples)) and BiP-High (BiP-H) (0.58–5.05; n = 271 samples)]. The same procedure was applied to the proteogenomic landscape of breast cancer (CPTAC, Cell 2020) dataset [BiP-L (−1.68–−0.48; n = 30 samples) and BiP-H (0.48–3.16; n = 31 samples)]. CPTAC consists of proteomics data of 122 treatment-naïve primary breast cancer samples analyzed by mass spectrometry and the corresponding clinical data [26]. These two datasets were used to analyze the associations of BiP mRNA or protein levels with clinicopathological factors, survival outcomes, and pathway overrepresentation. Differences were considered statistically significant if pval and qVal ≤ 0.05. Differential expression of gene or protein levels was considered significant if Log FC ≥ 0,4 and p > 0.05. Pathway enrichment was carried out using values/ranks for each differentially expressed gene or protein, and String V11.5 [27,28] and both Kegg and Reactome Pathways were analyzed and considered significantly enriched if the false discovery rate (FDR) ≤ 0.05.
Additionally, the TCGA-BRCA raw counts and FPKM data were downloaded on 20 March 2022 from NCI Genomic Data Commons (GDC) using the TCGAbiolinks package (version 2.22.4, Bioconductor, Seatle, IL, USA)), United States [29] in R (version 4.1.2) and they were used to compare BiP mRNA expression across breast cancer molecular subtypes and identify correlations between BiP expression and immune and other stromal signatures. To compare BiP mRNA expression across breast cancer molecular subtypes, raw counts were normalized using the cumulative sum scaling (CSS) method from the metagenomeSeq package, Bioconductor [30]. The BiP normalized raw counts were plotted against the different breast cancer subtypes and compared by an ANOVA test followed by a Tukey’s test.
To identify correlations between BiP expression and immune and other stromal signatures, BiP was first defined as highly or lowly expressed based on upper and lower quartiles of the raw counts, respectively. The samples corresponding to the middle quartiles were considered unchanged and therefore removed. Genes with less than 1 FPKM in both high and low BiP patients were considered not expressed and removed. Genes that were not present in at least a quarter of the samples were also filtered out, and this was completed based on counts per million using the edgeR package (version 3.36.0, Bioconductor) [31,32,33]. The raw counts for the remaining samples were used to identify the infiltrating immune and stromal scores for samples expressing high and low BiP using the immunedeconv package (version 2.0.4, Omnideconv, Innsbruck, Austria) [34].

2.2. Meta-Analysis of BiP Immunohistochemistry in Breast Cancer Samples

This study was submitted to PROSPERO on 28 April and registered on 10 May 2022 (CRD42022328977).

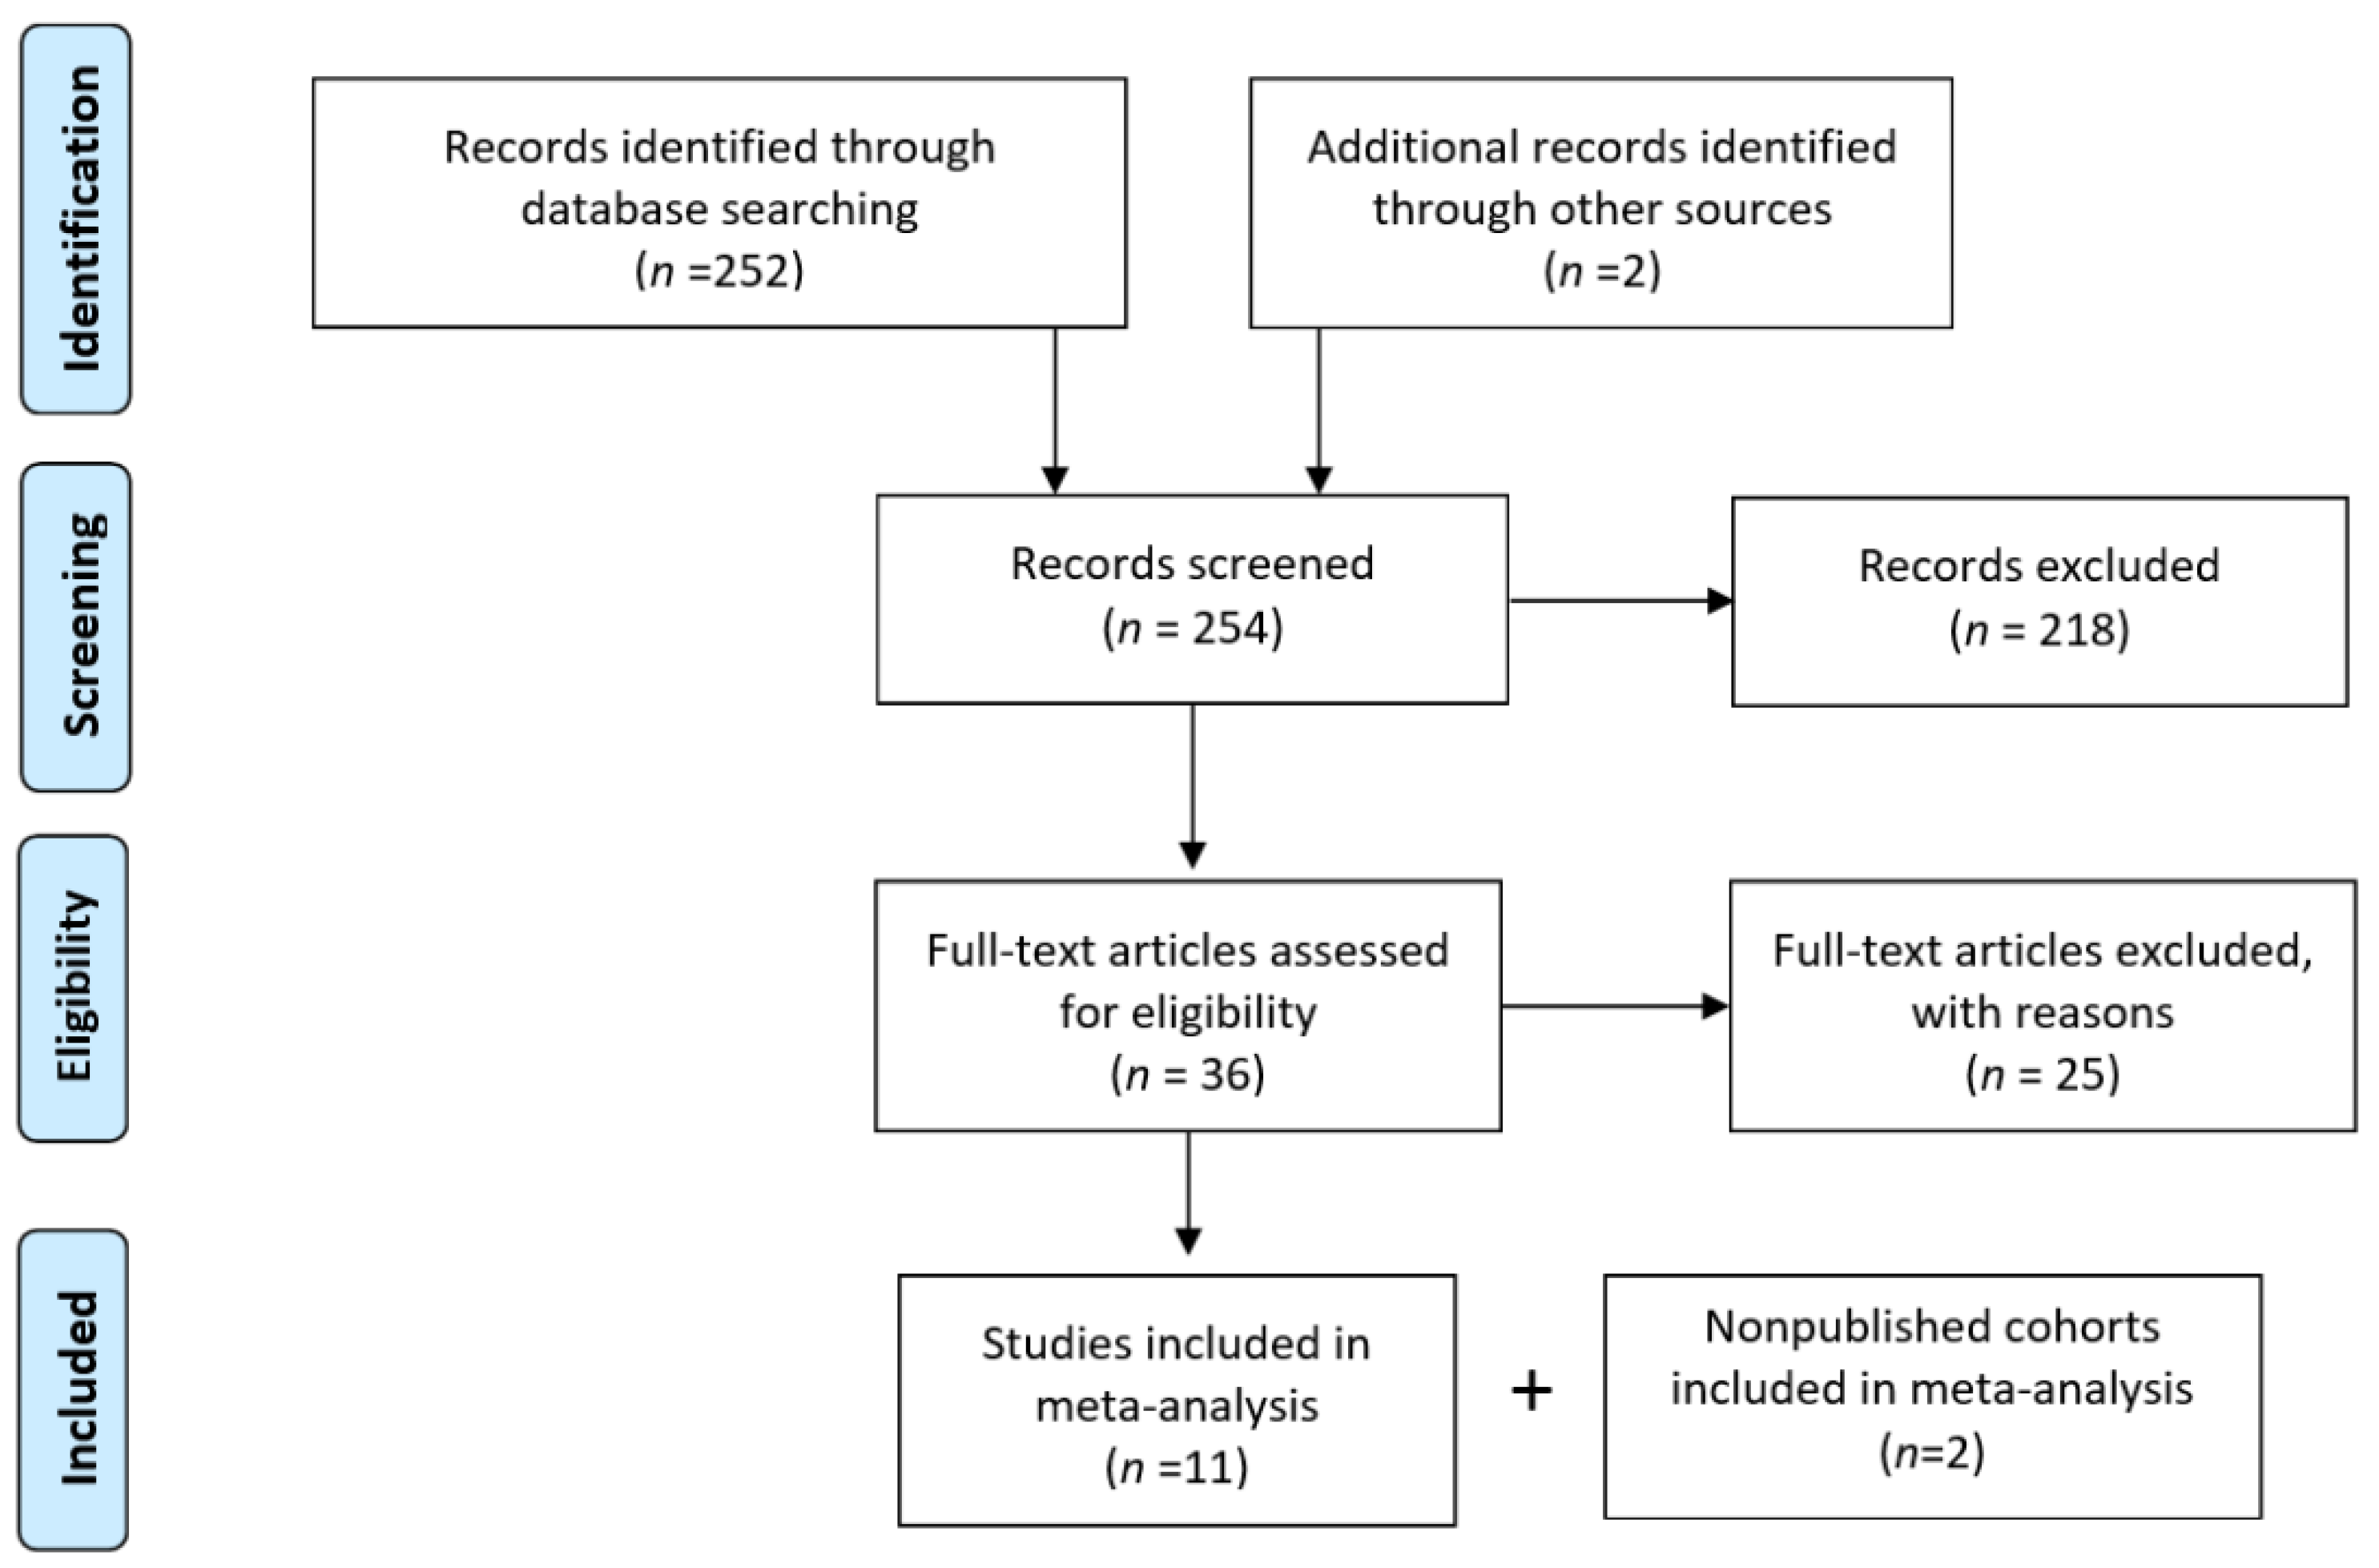
2.2.1. Search Strategy

To identify reports that performed immunohistochemical analysis of BiP in breast cancer, free text words, as well as singular and plural forms of the key terms, were used in the queries. The key words were searched for in the title and abstract to identify all potentially relevant articles in PubMed/Medline and Scopus databases. In PubMed/Medline, the query used was: ((mammary cancer[Title/Abstract]) OR (mammary carcinoma[Title/Abstract]) OR (mammary tumor[Title/Abstract]) OR (mammary neoplasms[Title/Abstract]) OR (breast cancer[Title/Abstract]) OR (breast carcinoma[Title/Abstract]) OR (breast tumor[Title/Abstract]) OR (breast neoplasms[Title/Abstract])) AND ((HSPA5[Title/Abstract]) OR (Endoplasmic reticulum chaperone BiP) OR (GRP-78) OR (GRP78) OR (BiP)). In Scopus, the query was: TITLE-ABS-KEY ((“mammary cancer”) OR (“mammary carcinoma”) OR (“mammary tumor”) OR (“mammary neoplasms”) OR (“breast cancer”) OR (“breast carcinoma”) OR (“breast tumor”) OR (“breast neoplasms”)) AND ((hspa5) OR (“endoplasmic reticulum chaperone BiP”) OR (grp-78) OR (grp78) OR (bip)) AND (LIMIT-TO (DOCTYPE, “ar”). The search was unlimited for articles published up to September 2021. Existing reviews and reference lists were hand searched for studies missed by the initial query. The search was updated on the 8 July 2022 in both databases, but no new studies were identified.

2.2.2. Eligibility and Data Collection

Two of the authors assessed all the retrieved references for eligibility based on the information provided in the title and abstract. All the potentially eligible full-text articles were retrieved for full-text analysis using the inclusion criteria: (1) immunohistochemical analysis of BiP expression levels in human breast cancer samples; (2) studies with sufficient data to evaluate methodological quality and to perform a meta-analysis, which includes a clear description of the study population and immunohistochemical methods (i.e., tissue treatment, antibodies used, positive controls, and cut-off used to assign expression status); (3) correlation between BiP expression and clinicopathological parameters discussed; (4) more than 5 samples analyzed; (5) when different papers reported BiP expression from the same patient cohort, only the most recent or the most complete study was included. Only original reports were considered. Letters, reviews, case reports, editorials, and comments were excluded. Selected references for which a full-text article was not available after contact with dedicated libraries and/or with corresponding authors were also excluded (Supplementary Table S1).

2.2.3. Data Analysis

The analysis was performed in R (version 4.1.2, R Core Team, Vienna, Austria) and the packages meta, dmetar for statistics and netmeta for network meta-analysis [35,36]. The prevalence, Cohen’s d, and relative risk were calculated as point estimates of the association between the expression of BiP and the patients’ clinicopathological characteristics. Pooled prevalence indicates the proportion of positive staining for each marker. Pooled relative risk was calculated for differences in BiP positivity regarding recurrence-free survival. Between-studies, heterogeneity was estimated using heterogeneity index (I2) statistics [37]. In case of substantial heterogeneity between the studies (I2 > 50%), only the results from a random-effects model were considered for further analysis; otherwise, a fixed effect model was used for the pooled statistical analysis, and a meta-regression analysis (mixed-effects model) was performed using an ‘adjusted effect’ to potential moderators. All of the results were considered statistically significant if p < 0.05. Sensitivity analysis was carried out to assess the robustness of the results by removing individual studies from the meta-analysis and assessing the effect on the pooled results. The publication bias was evaluated using funnel plots and two-sided Egger’s tests. Subgroup meta-analyses were performed to explore sources of heterogeneity for the sample type. Meta-regression was also used to assess the influence of the following factors in the BiP proportion of positive cases: (1) sample type, (2) menopausal status, (3) tumor stage, (4) lymph node metastases, (5) tumor grade, (6) ER-positivity, (7) HER2-positivity, and (8) age.

2.3. Immunohistochemical Detection of BiP

2.3.1. Patient Sample Collection and Characterization

The clinicopathological data of the patient cohorts are presented in Supplementary Tables S2 and S3. Tumor samples consisted of formalin-fixed paraffin-embedded tumor tissues from breast cancer patients. The slides were reviewed by the pathologist involved in the study (JL). Staging was performed according to the most recent AJCC staging manual and the histological subtypes considered in the latest World Health Organization classification. Molecular subtype was determined by immunohistochemistry, with ER, PR, HER2 (with confirmation by FISH in case of a 2+ immunohistochemical result), and Ki67, as recommended by the College of American Pathologists. All of the patients were treated by the same multidisciplinary team. The samples used in this study were obtained from the archive of the Department of Pathology of the Portuguese Institute of Oncology of Porto (IPO-P). Their use was approved by IPO-P’s Ethical Committee (CES IPO: 369/2017).

2.3.2. Immunohistochemistry

Immunohistochemical staining was performed on breast cancer tissue samples using the anti-BiP/GRP78 antibody (HPA038845, 1:400, Sigma-Aldrich, St. Louis, MO, USA) validated by the Human Protein Atlas as specific for this protein [38] or anti-Ki-67 (Ab15580, 1:250, Abcam, Cambridge, United Kingdom). Briefly, 4 μm-thick sections were deparaffinized in xylene and hydrated in graded alcohols. Endogenous peroxidase activity was blocked with a 3% hydrogen peroxide solution. For antigen retrieval, sections were immersed in citrate buffer pH = 6.0 (C6H5NaO7.2H2O 2.94 g/L) and heated in a microwave oven for 20 min. The slides were permeabilized with 0.25% Triton X-100 and blocked with 0.2% bovine serum albumin in phosphate buffer saline (PBS), followed by incubation with the primary antibody overnight in a humidified chamber. The slides were washed and the secondary biotinylated antibody (SAB3700856, Sigma, 1:400) was incubated for 2 h at room temperature. The slides were washed with PBS and then incubated with freshly prepared VECTASTAIN ABC Reagent (Vector Laboratories, Burlingame, CA, USA) for 30 min. The slides were developed with 3,3-diaminobenzidine substrate-chromogen solution and subjected to Mayer hematoxylin counterstaining. The immunohistochemical slides were evaluated blinded to patient identity. The number of positive stained cells and total cells were enumerated and the % of positive stained cells was obtained. For BiP, the scoring system combined staining intensity (0, no staining; 1, weak; 2, moderate; 3, strong) and % of stained cells (0, no staining; 1, 1 to <10%; 2, 10 to <50%; 3, 50 to 100%). The final immunohistochemical score was determined by multiplying the individual scores of the previous variables and considered positive if ≥2 (in accordance with most of the studies included in the meta-analysis which used the same cut-off). To evaluate BiP and Ki67 index, the number of positive and total cells were counted, and the % of positive cells was determined. Nikon eclipse Ti-U was used to conduct bright-field microscopy and the slides were quantified in three random field pictures at 200× magnification.

2.3.3. Statistical Analysis

Statistical analyses were performed using the software SPSS version 28.0.1.1, IBM, Armonk, NY, USA and GraphPad Prism version 6.0, Dotmatics, San Diego, CA, USA. Wilcoxon tests were used for analysis of human breast cancer paired tissue samples. The relationships between BiP immunohistochemical staining and clinicopathologic variables were analyzed using the Fisher’s exact probability test. The associations between the expression levels of BiP and Ki67 were analyzed by the Spearman’s rank correlation. Differences were considered significant if p < 0.05.

3. Results

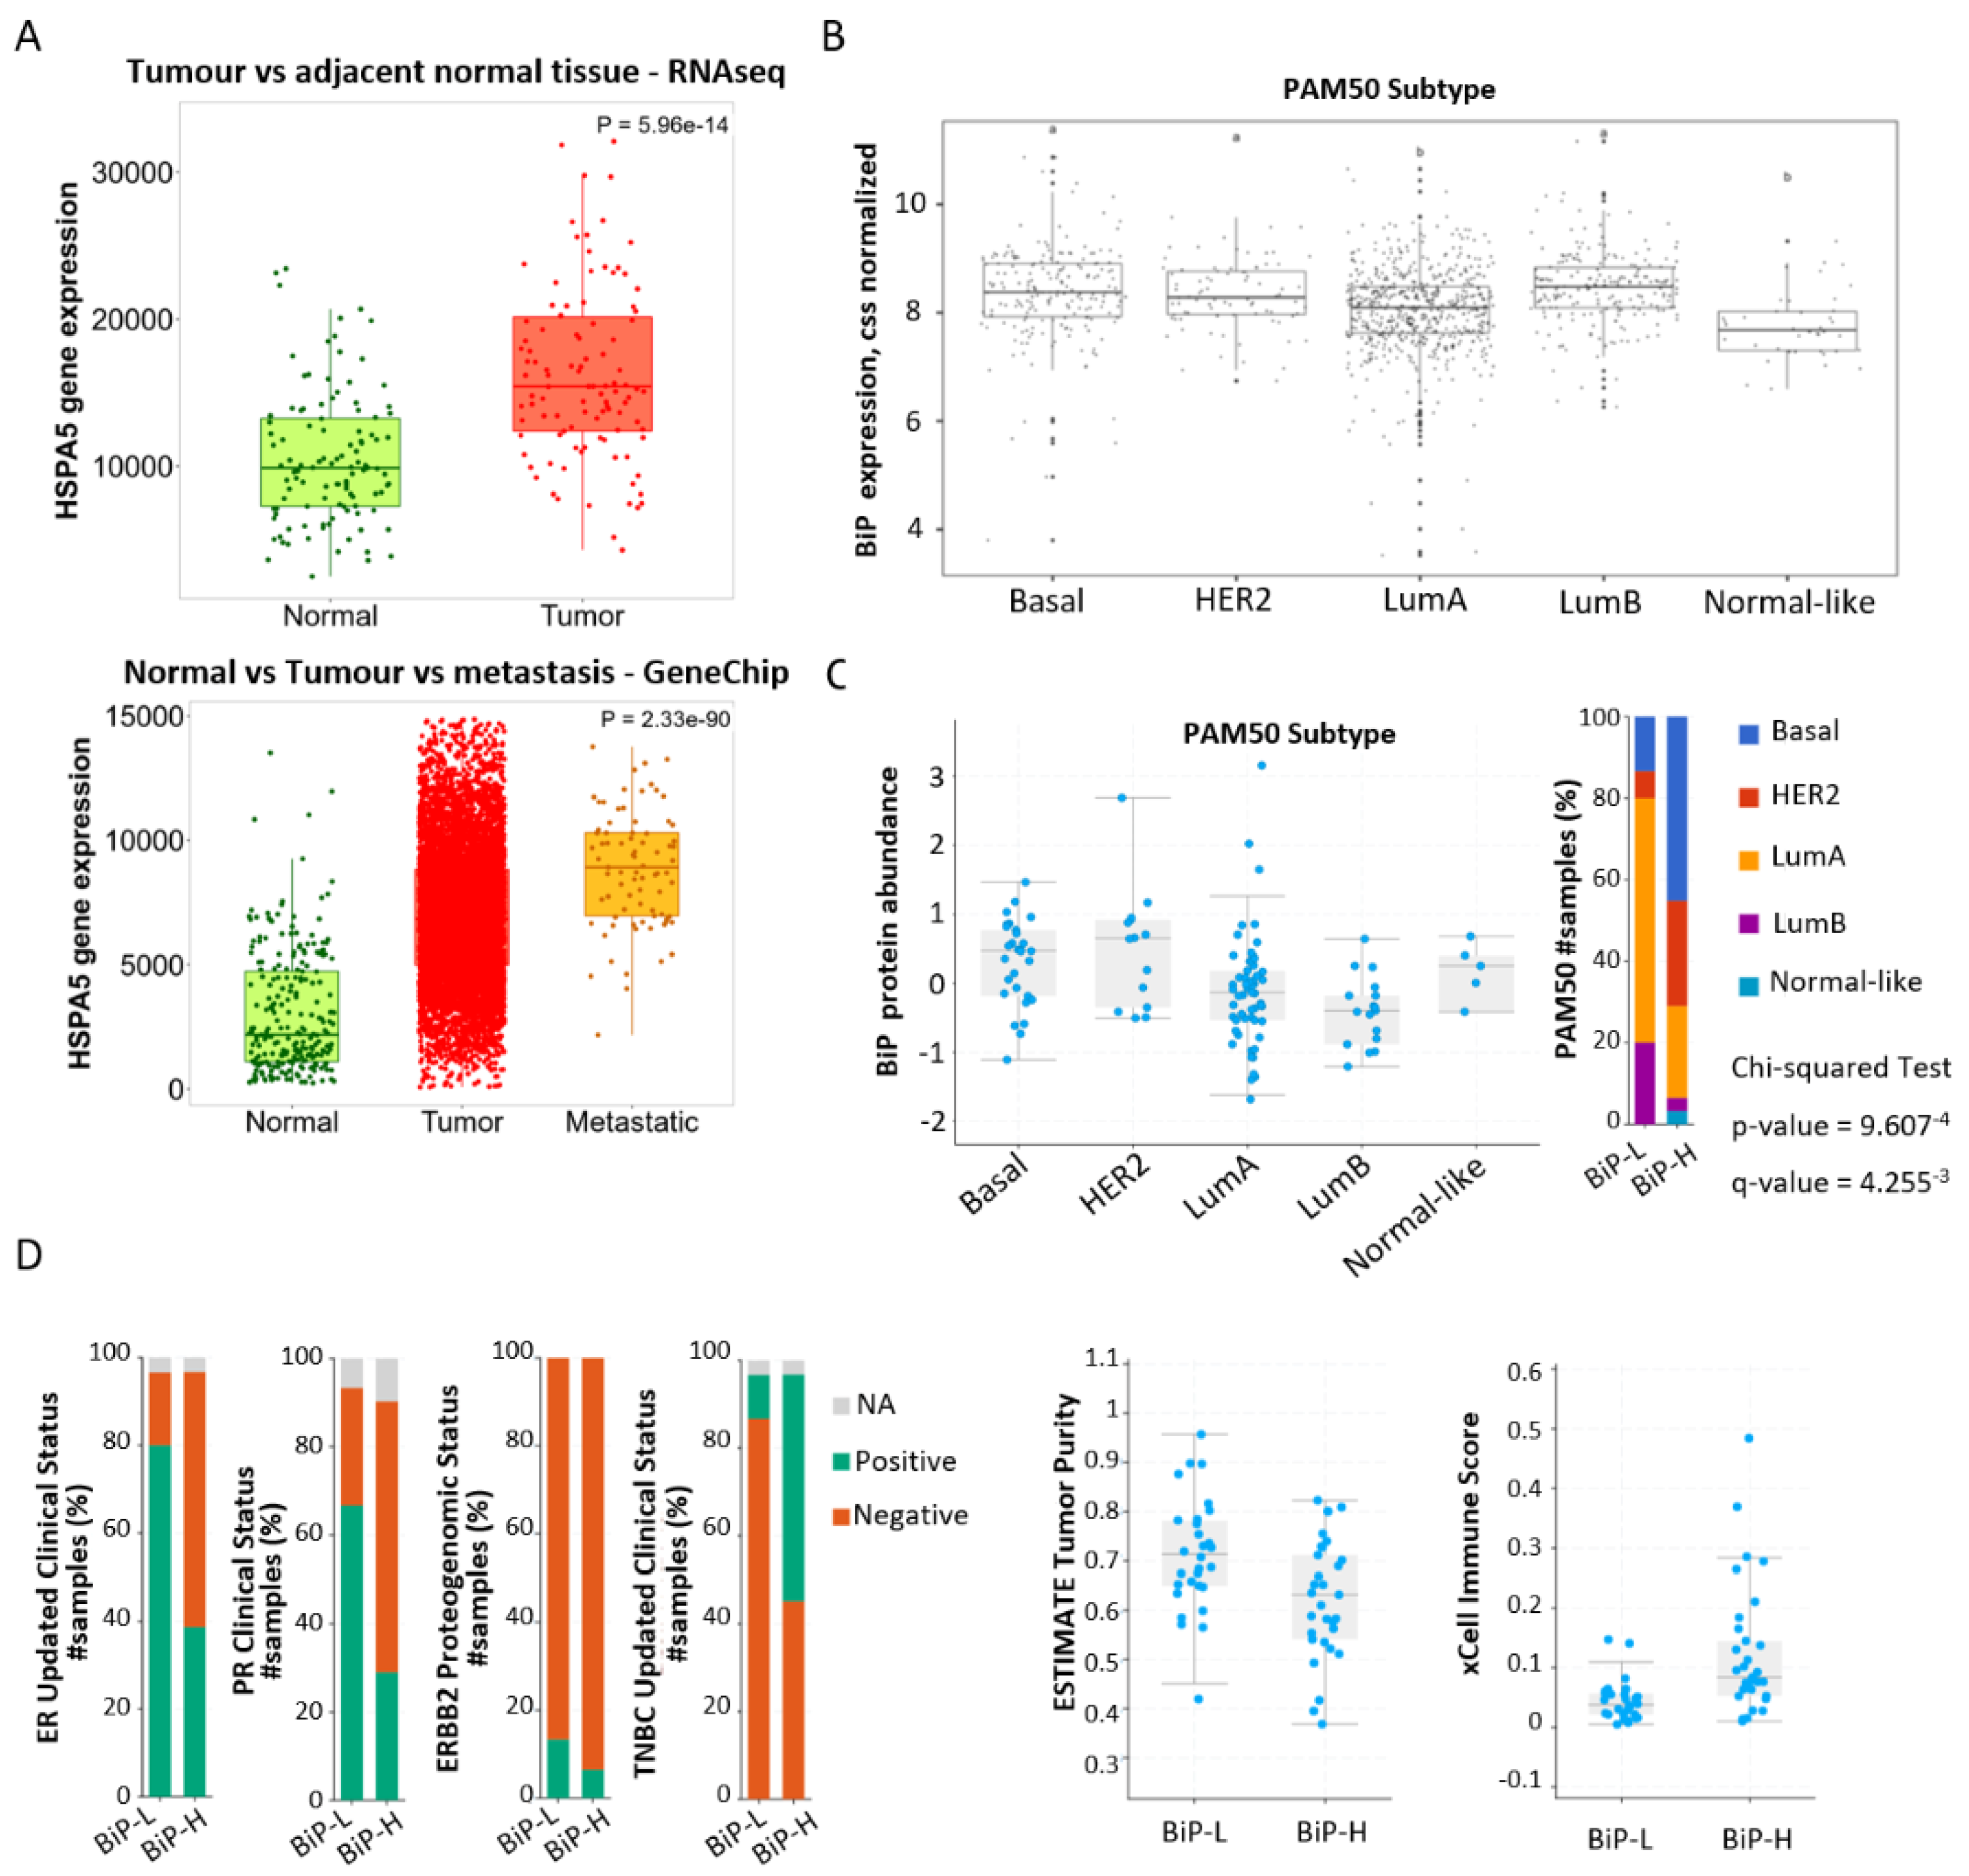
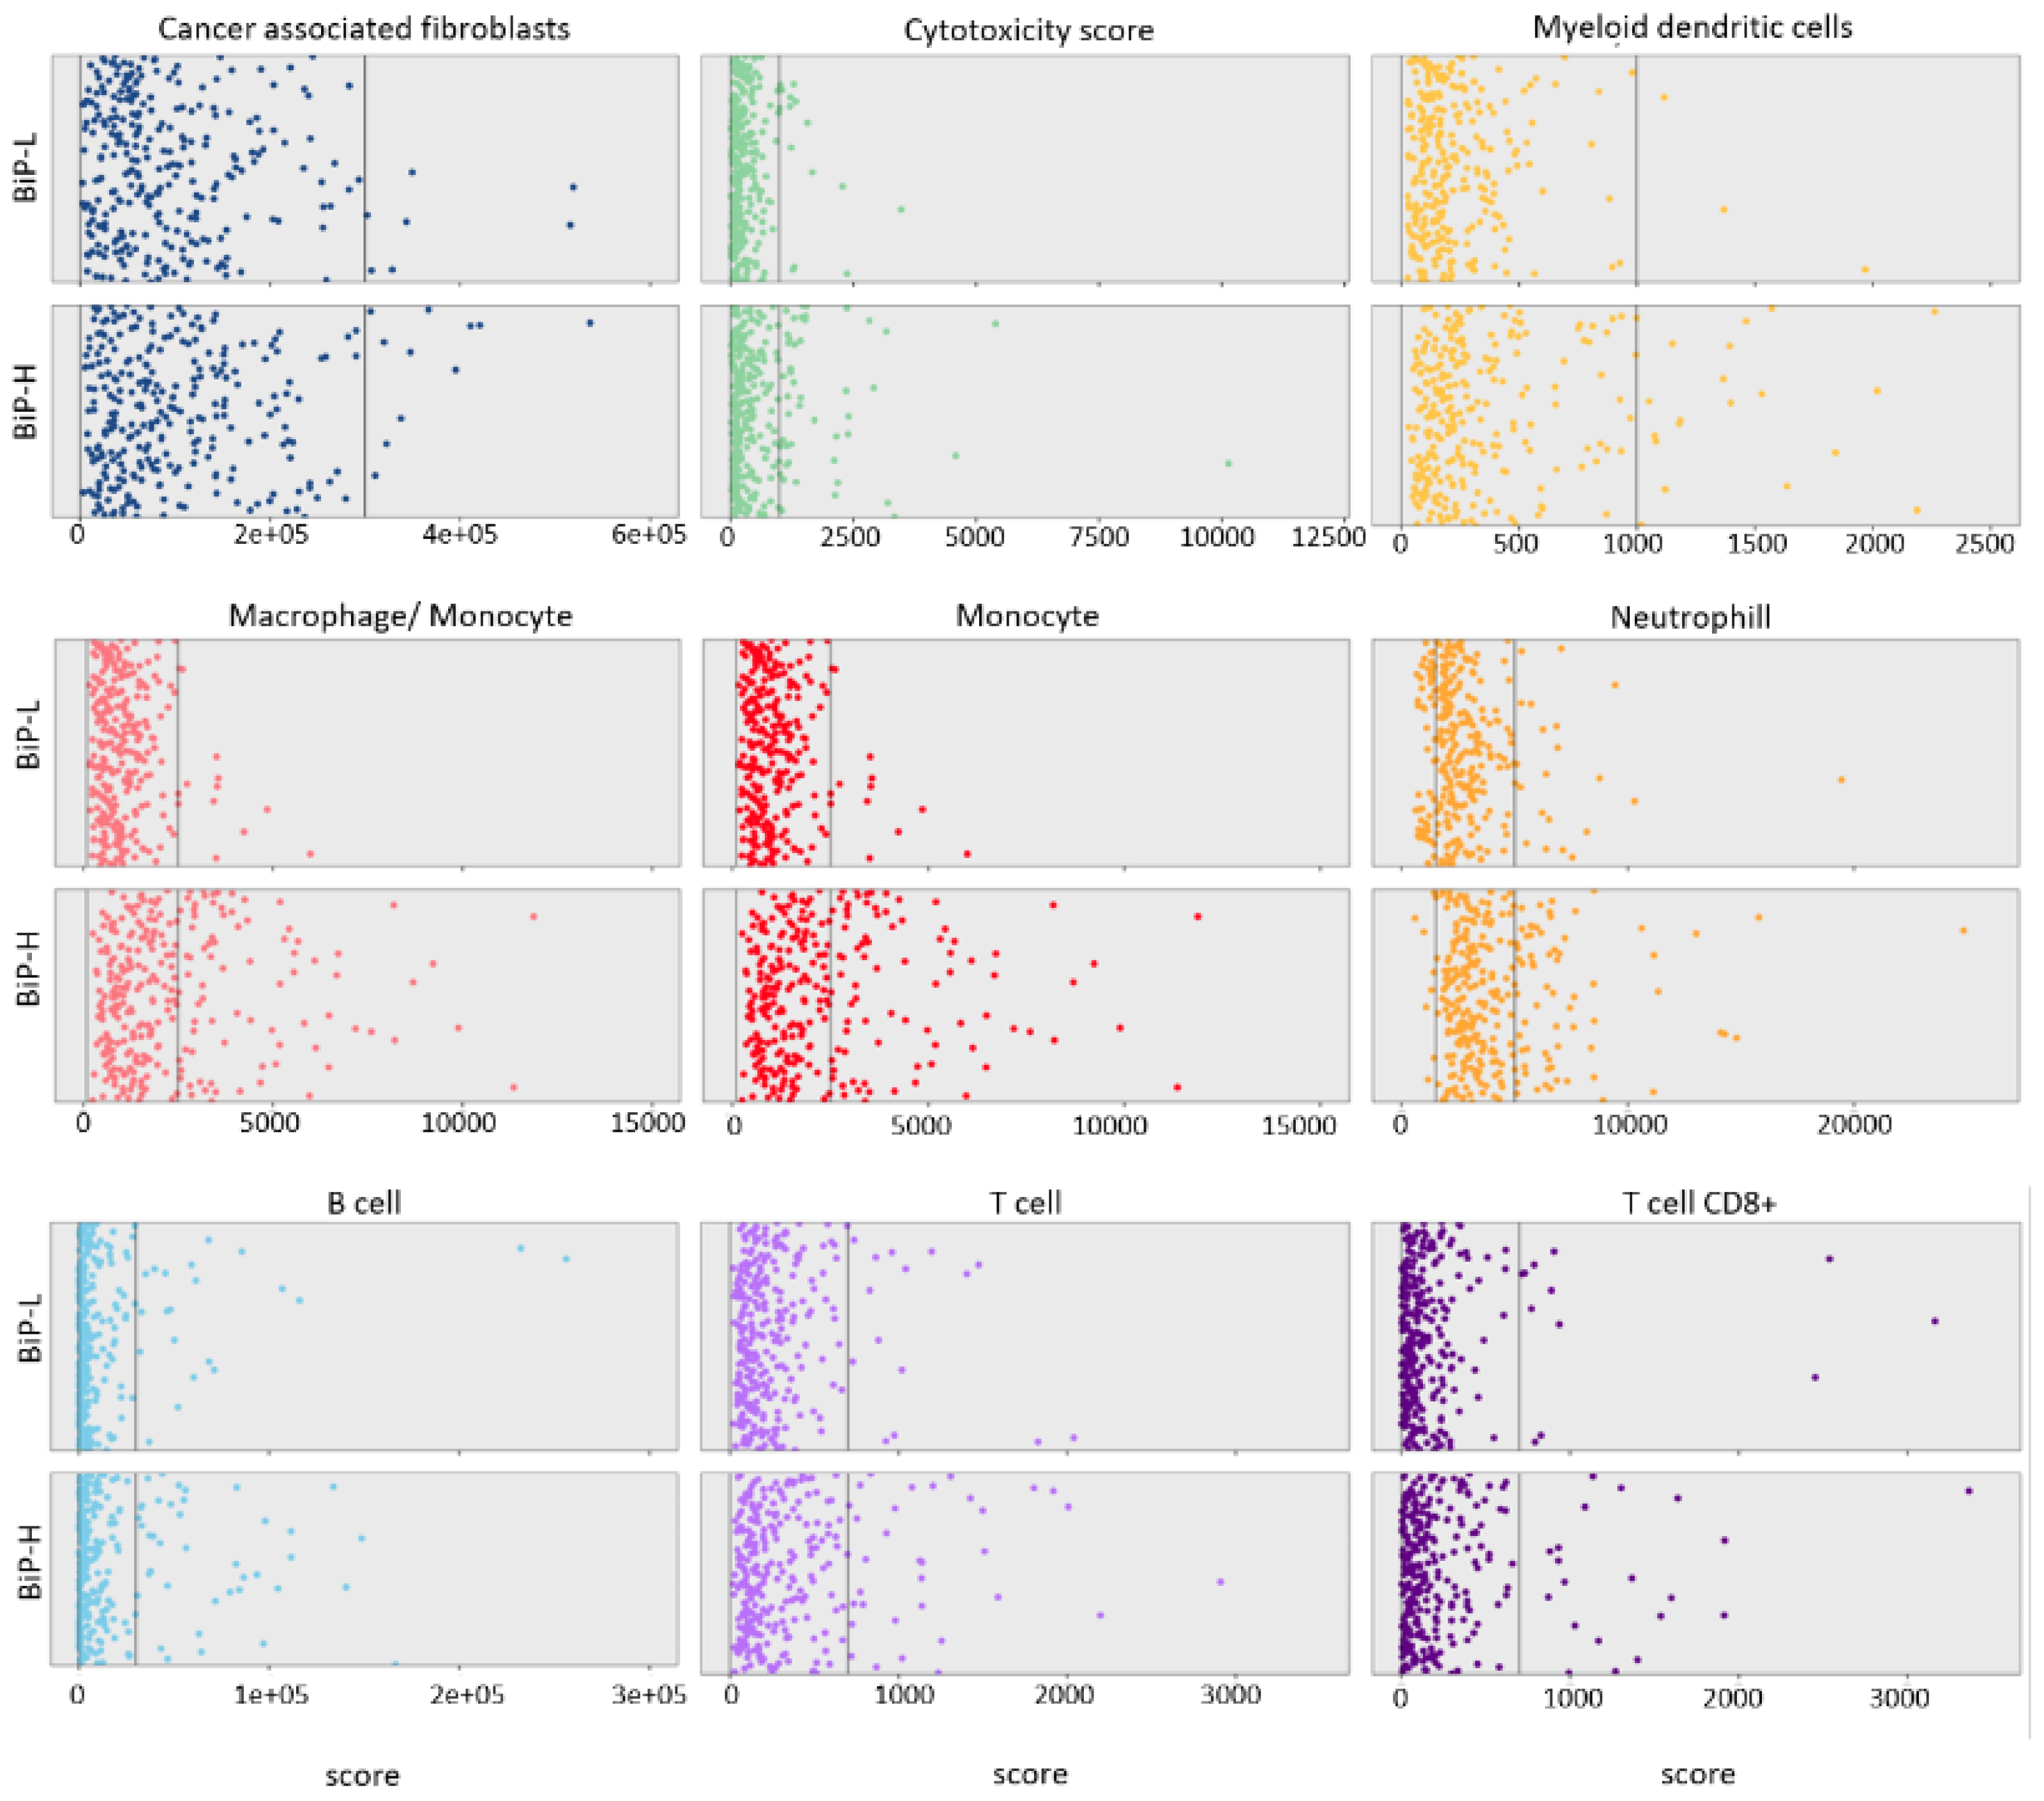
3.1. Stratification of Public Datasets by BiP Differential Expression Correlates with Breast Cancer Molecular Subtype and Immune Score

The analysis of BiP expression in normal and cancer tissues showed that BiP mRNA levels are higher in breast cancer tissues vs. normal tissues [non-paired, p = 9.13 × 10−84 or paired adjacent tissue, p = 5.96 × 10⁻¹⁴] and highest in the metastases (non-paired tissues, p = 2.33 × 10−90; Figure 1A). In the TCGA BRCA dataset, BiP mRNA was lowest in luminal A and normal-like subtypes as compared with basal, HER2 and luminal B subtypes which did not vary with each other (Figure 1B). Analysis of PAM50 breast cancer molecular subtype representation in the CPTAC dataset confirmed higher basal and HER2 subtypes in the high BiP (BiP-H) group and showed higher BiP protein abundance in these subtypes. The protein abundance ratio was lower in luminal A and B, resulting in a higher number of cases of these two subgroups in the low BiP (BiP-L) group (Figure 1C).
Based on protein abundance ratio (CPTAC dataset), the BiP-L group was significantly correlated with ER, PR, and ERBB2 positivity and with a higher estimate tumor purity score (Figure 1D and Table 1). On the other hand, the BiP-H group was significantly correlated with triple-negative breast cancer, TOP2A proteogenomic status, and the xCell immune score (Figure 1D and Table 1). To identify the stromal cell types that could be contributing to these correlations, we used the mcp_count method [39] from the immunodeconv package [34] on the TCGA BRCA RNA-seq dataset. An enrichment of macrophages and monocytes together with a slightly higher increase in neutrophiles and B cells was identified in the BiP-H group (Figure 2). There was no significant difference in overall survival, disease-free survival, or progression free survival between the BiP-H group and the BiP-L group.
In BiP-L vs. BiP-H TCGA PanCancer Atlas groups, the pathways overrepresented where all in the direction of the BiP-H group with the top ten Kegg pathways including protein processing in the endoplasmic reticulum (FDR = 3.47 × 10⁻¹²), the innate immune, and the adaptive immune system (FDR = 2.16 × 10⁻²⁴ and FDR = 2.22 × 10⁻¹⁴, respectively; Table 2).
As expected, UPR (FDR = 8.16 × 10⁻⁷), IRE1alpha activates chaperones (FDR = 1.24 × 10⁻⁵), and XBP1(S) activate chaperone genes (FDR = 1.79 × 10⁻⁵), as well as pathways regulating proteostasis such as lysosome (FDR = 0.0031) and proteasome (FDR = 0.00023) were amongst the significantly overrepresented pathways in BiP-H. In the CPTAC dataset, the top ten enriched pathways in the BiP-H group were protein processing in the endoplasmic reticulum (FDR = 9.15 × 10⁻⁶), the innate immune system (FDR = 3.49 × 10⁻⁸), and UPR (FDR = 0.0077); while in the BiP-L group, DNA repair (FDR = 0.00099) and estrogen-dependent gene expression (FDR = 0.0020) stood out as the most relevant cancer-related pathways (Table 3).
In summary, BiP mRNA and protein levels are significantly associated with PAM50 breast cancer molecular subtype and the three immunohistochemical markers used in breast cancer diagnosis (ER, PR, and HER2). Higher expression is observed in HER2+ and triple-negative breast cancer. Stratifying breast cancer samples by BiP mRNA and protein enriched for known functional effects of BiP on proteostasis including activation of the IRE1alpha/XBP-1 UPR arm. Additionally, stratification according to BiP also disclosed a potential association with the microenvironment innate immune system (macrophages, monocytes and neutrophiles) as well as adaptive immune system (B cells) pathways.

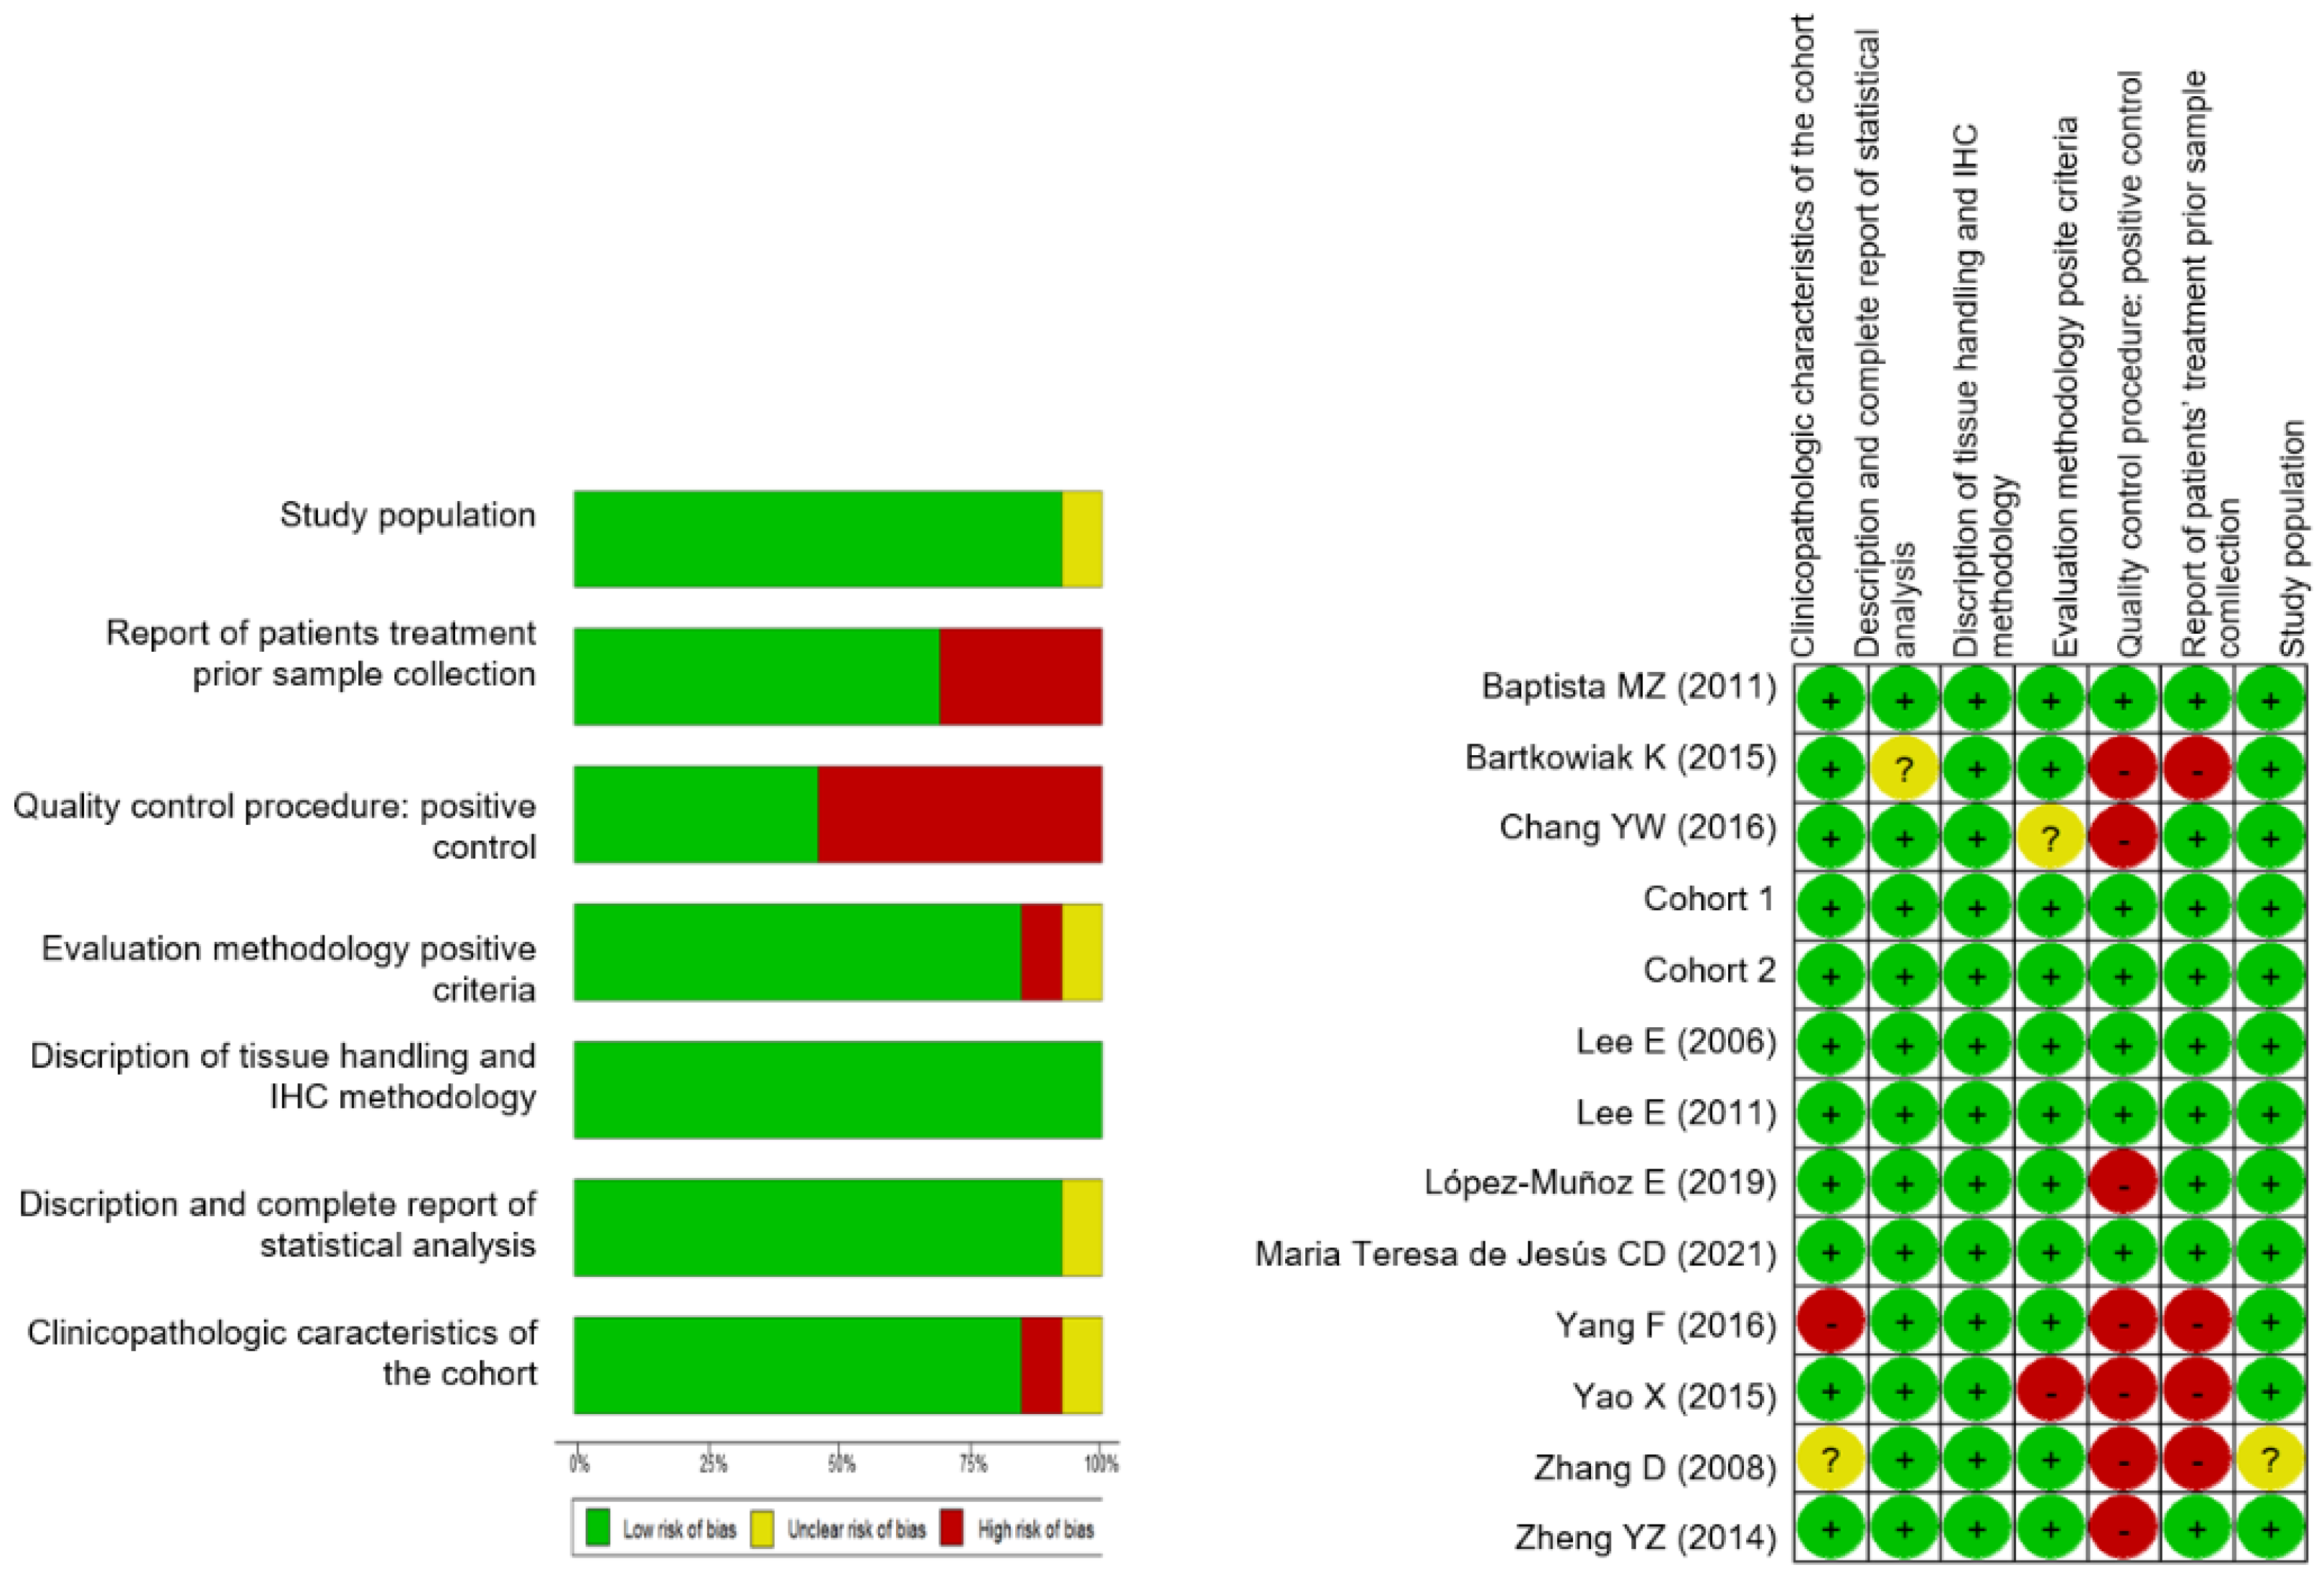
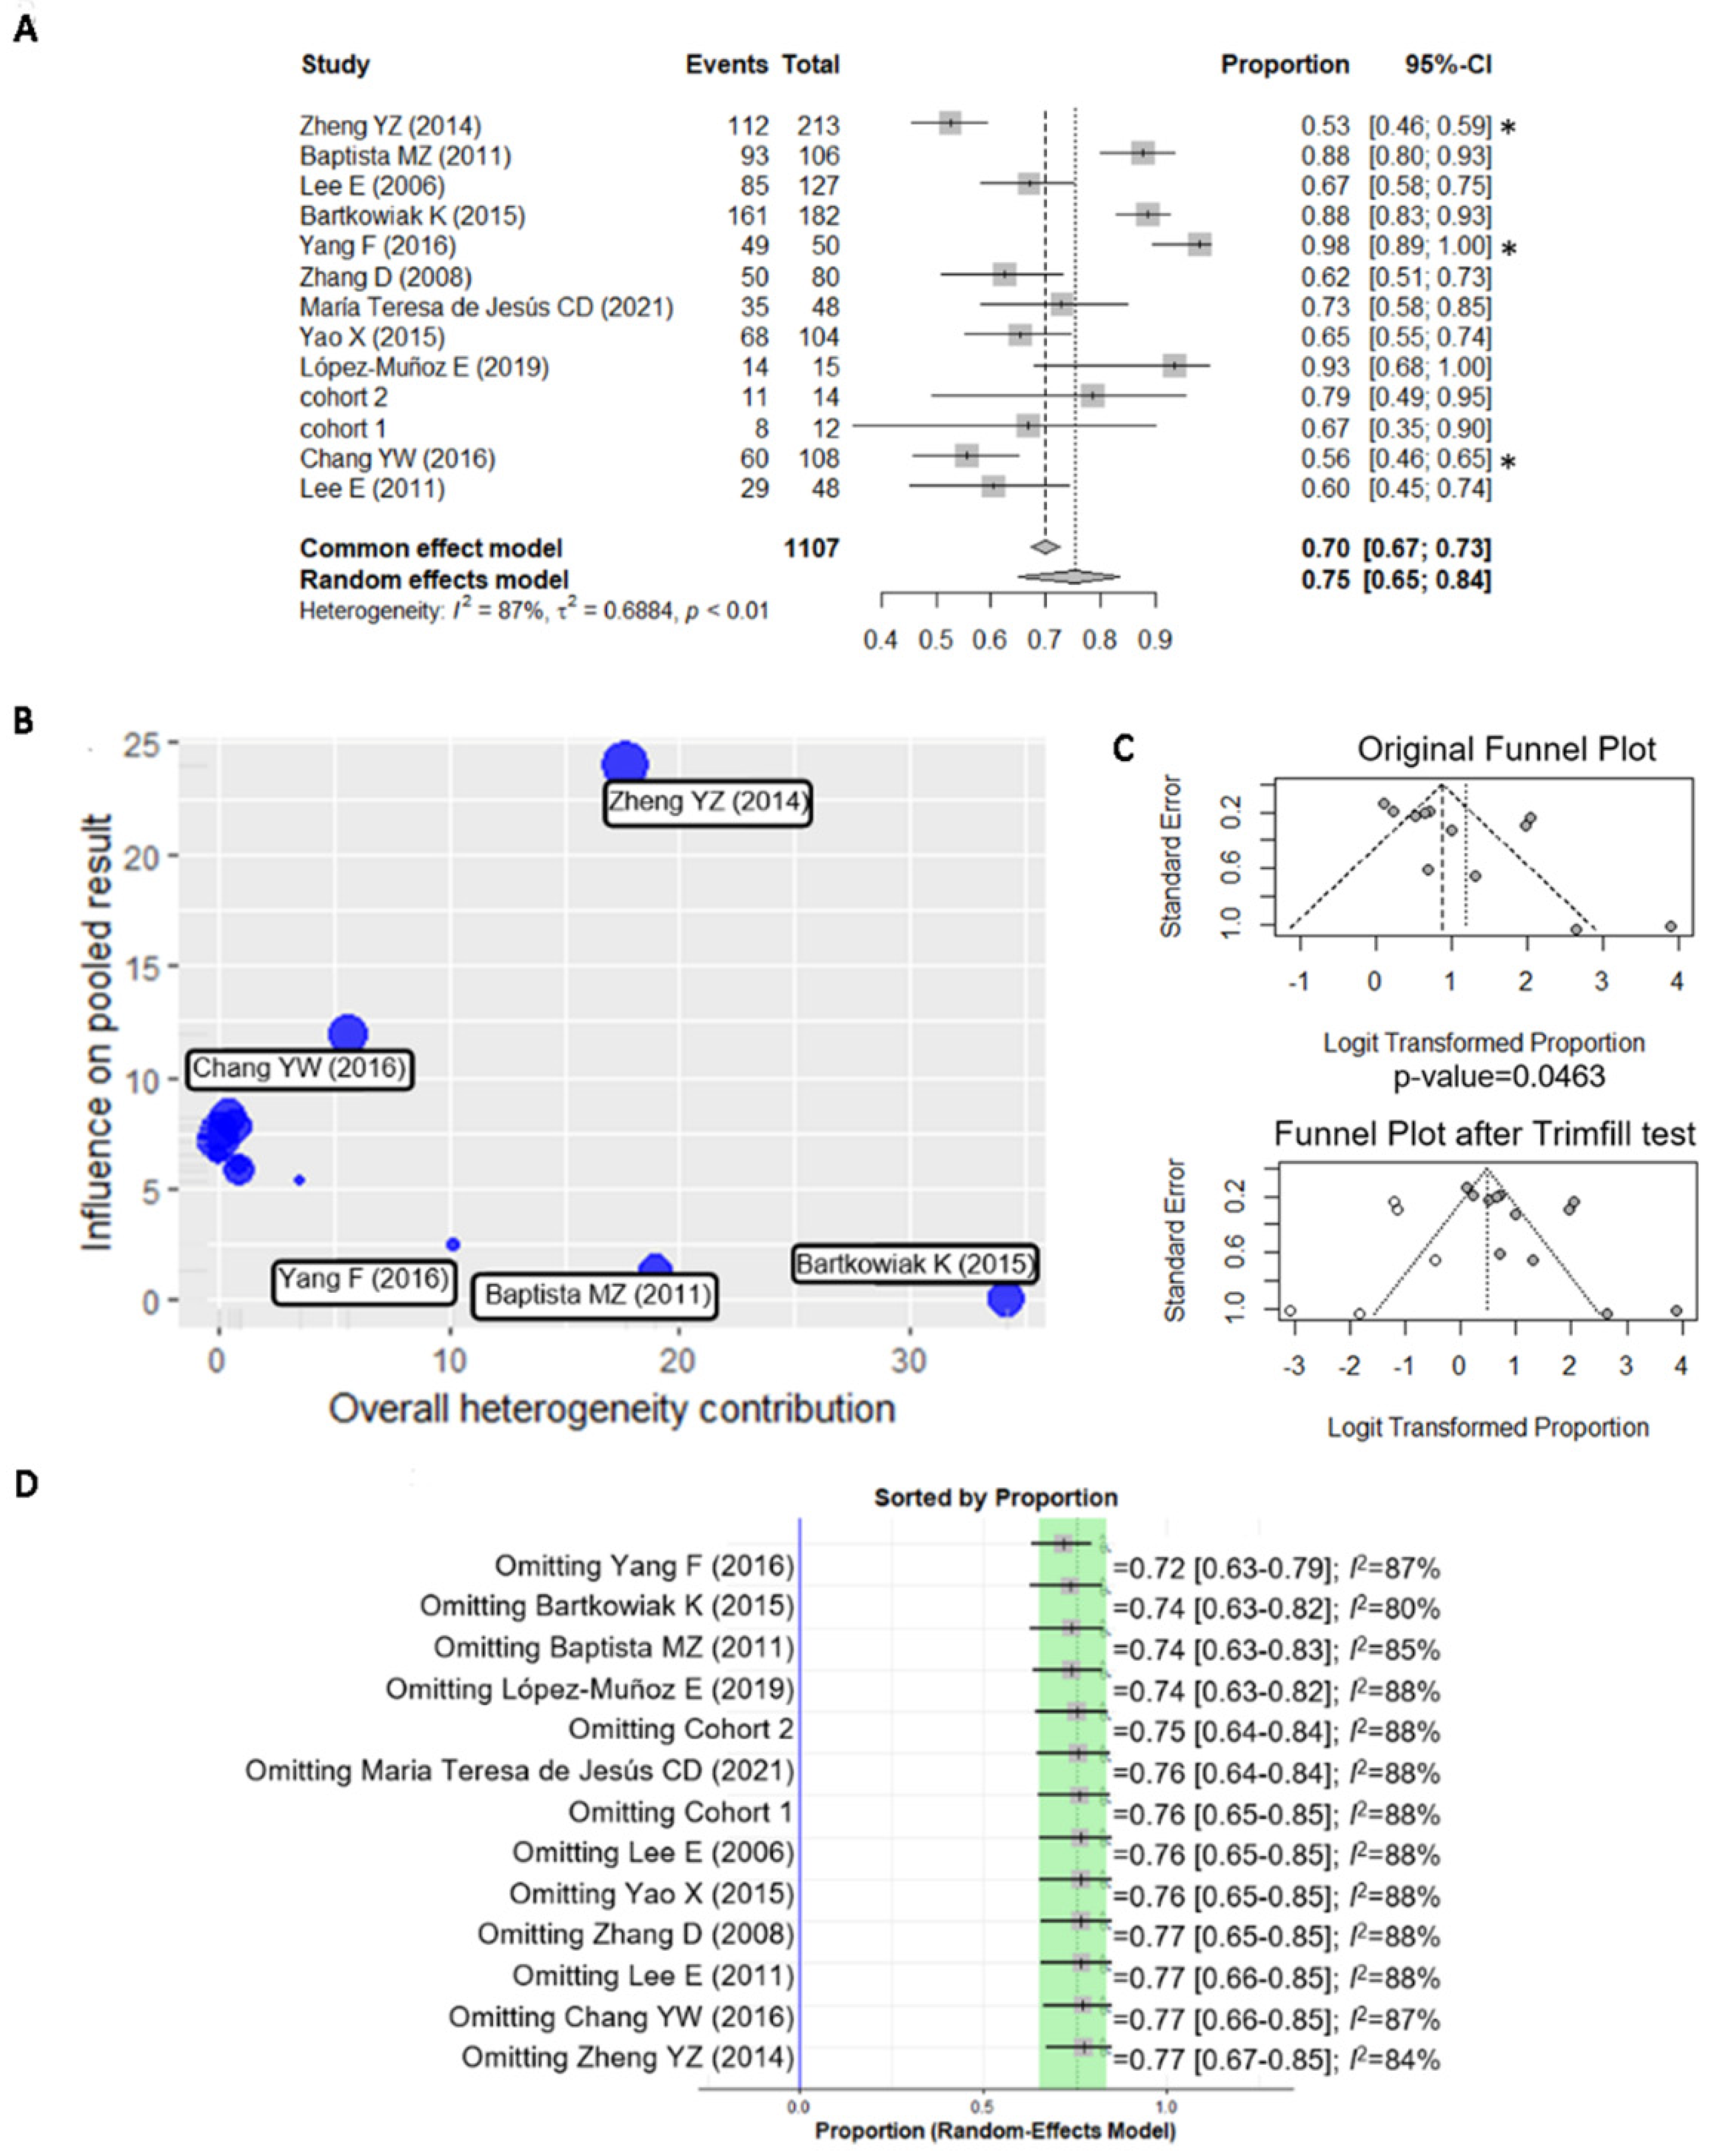
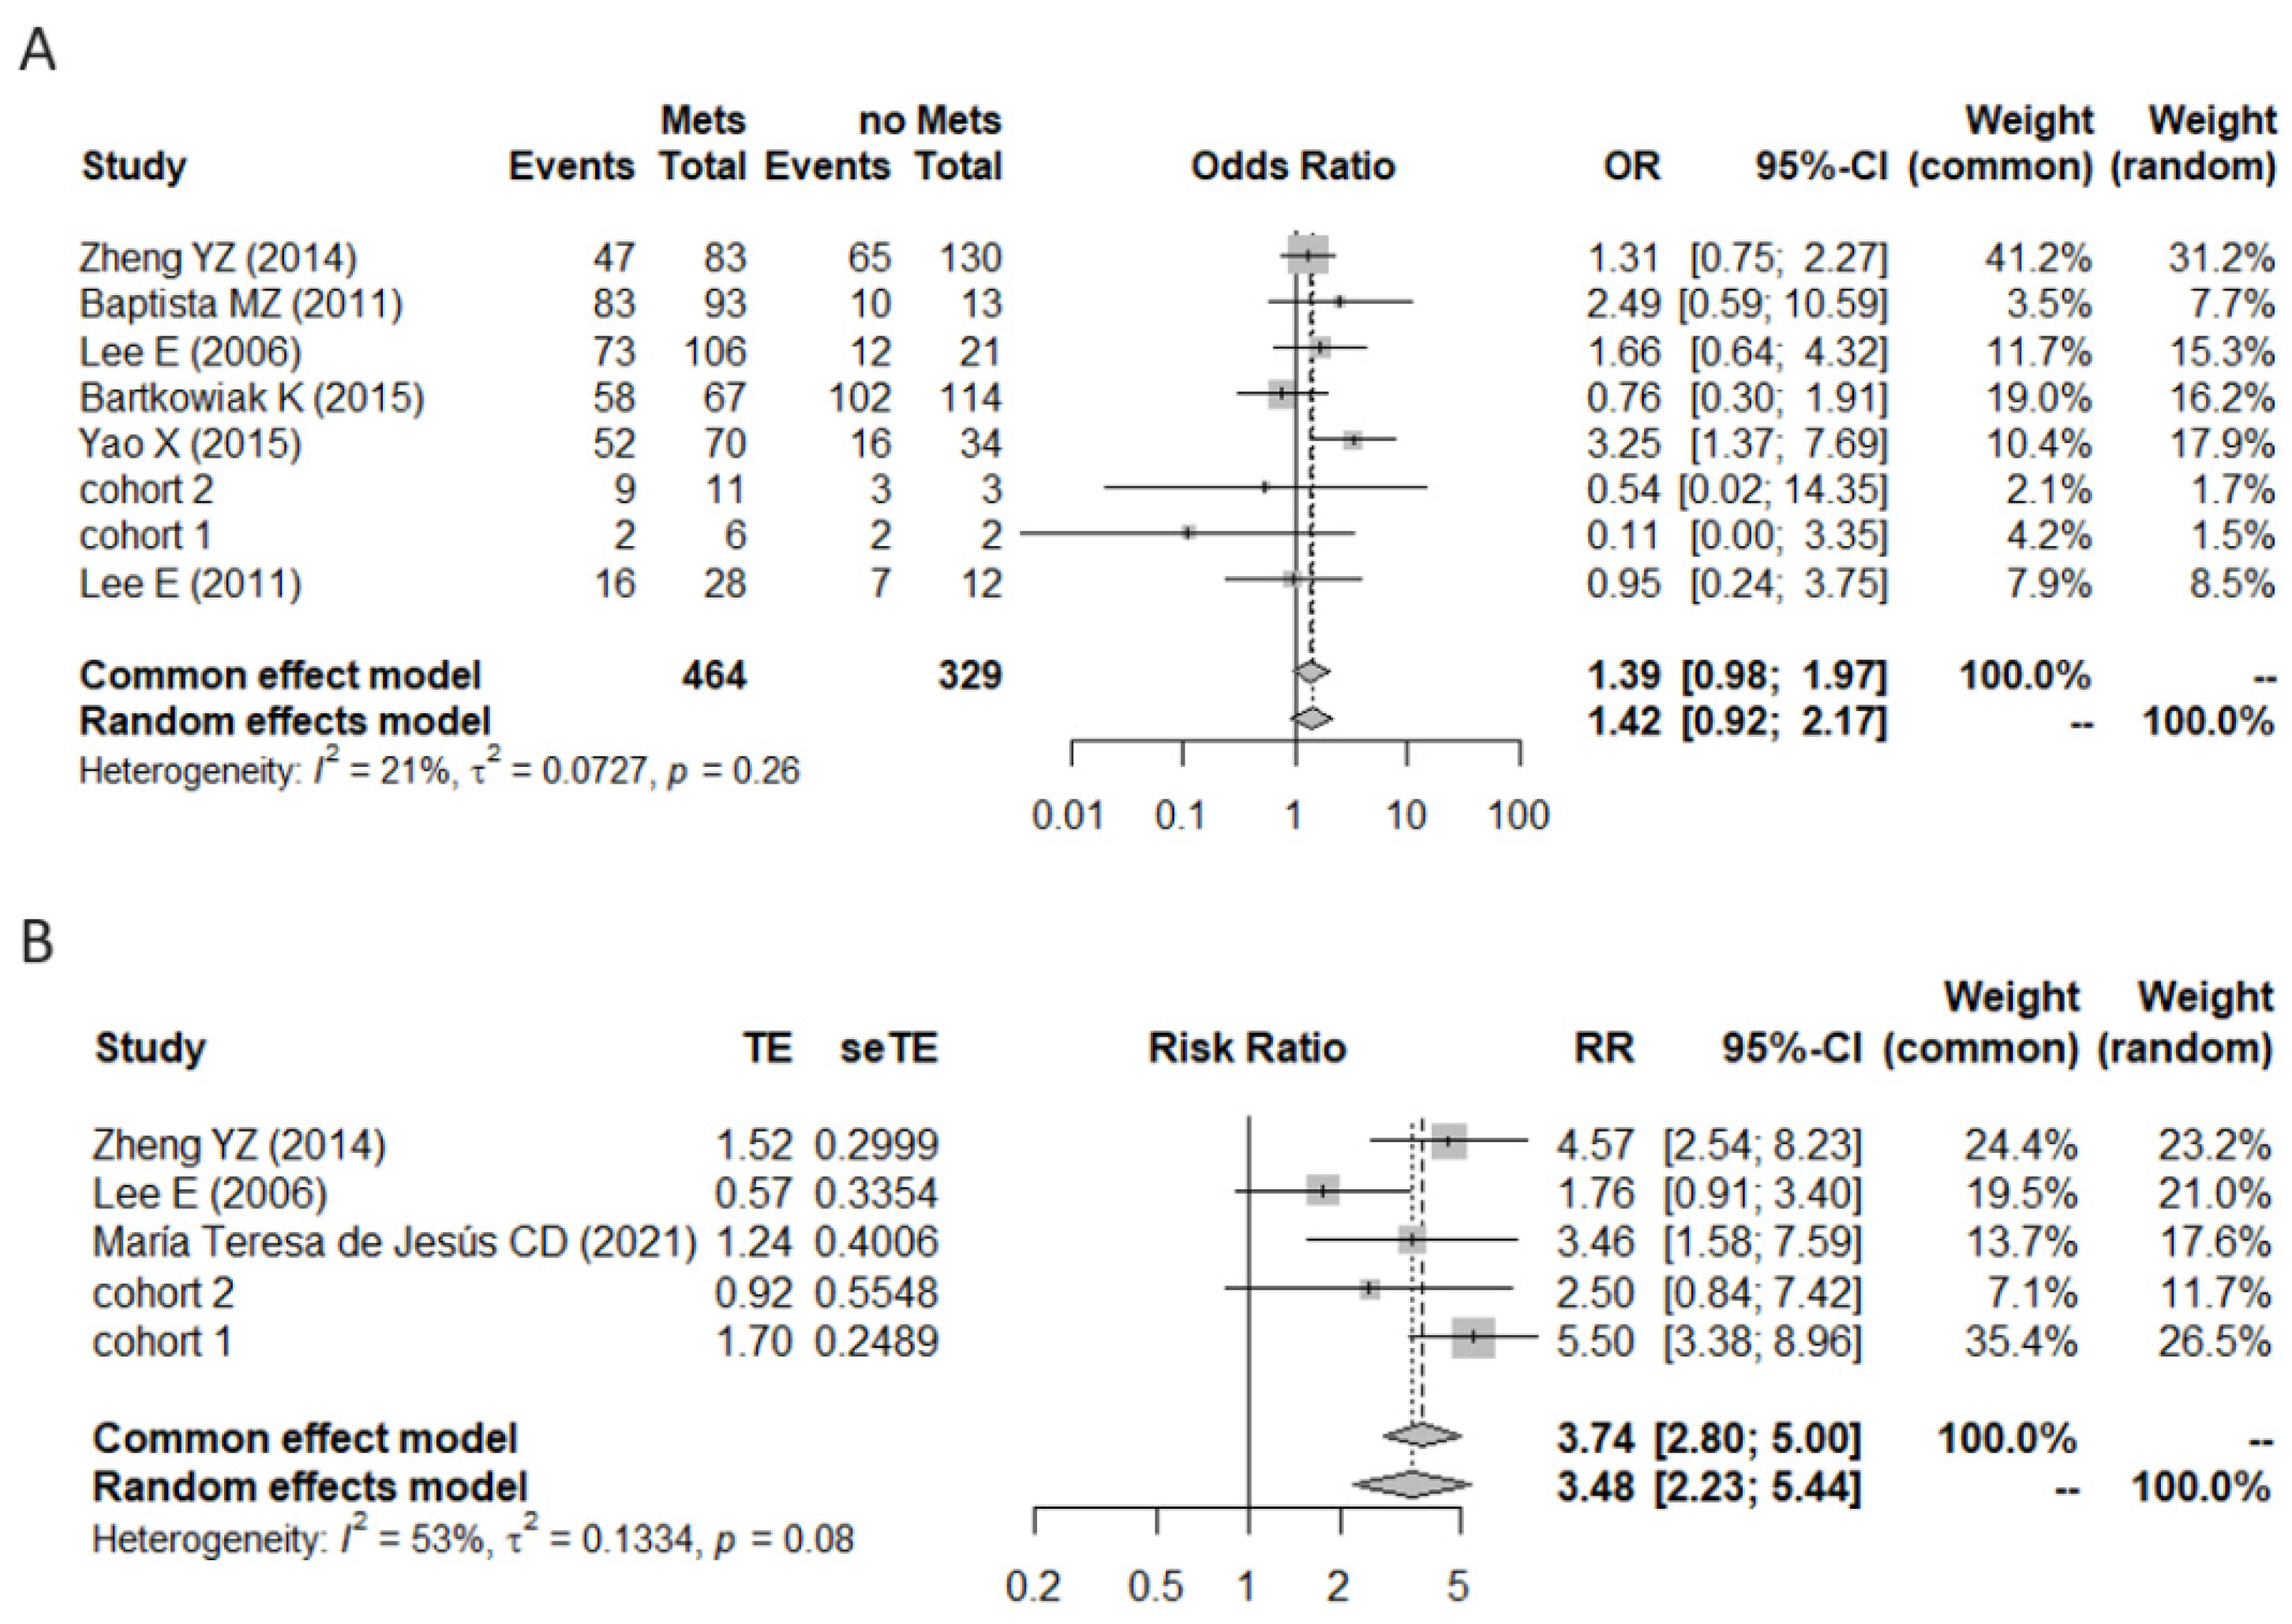
3.2. A Meta-Analysis of BiP Immunohistochemistry Identifies An Association with A Higher Risk of Recurrence

The results from the analysis of public datasets prompted us to investigate the potential of BiP immunohistochemical detection in breast cancer diagnosis and prognosis. We carried out a systematic revision and meta-analysis including retrospective published studies from 2006–2022. Eleven studies were eligible for the analysis (Table 4 and Figure 3) with a total of 1081 breast cancer samples (48–213 samples per study). Additionally, we analyzed, by immunohistochemistry, two cohorts from IPO-P (cohort 1 and 2 untreated luminal tumors; Table 5) totalizing 1107 tumor samples. The REMARK risk of bias [40] showed that a lack of information about quality control/the inclusion of positive control in the study was the most common factor contributing to the bias (high risk in 50% of the studies; Figure 4), followed by insufficient information about patient treatment prior to sample collection (with nearly 50% of the studies not reporting). Poor or insufficient description of the clinicopathological characteristics of the cohorts was also identified in 17% of studies (Figure 4).
Figure 3. Flowchart summarizing the literature selection process for the systematic literature revision and meta-analysis of BiP immunohistochemistry in breast cancer.
Curroncol 29 00710 g003
Table 4. Characteristics of the studies included for meta-analysis of GRP78/BiP in breast cancer.
StudyNPositive CasesAntibodyHistologySampleCutoffPre/Post MenopauseLow/High StageLow/
High Grade
Lymph Nodes +/
Lymph Nodes −
LVC Invasion/
No LVC
Invasion
ER+/
ER−
HER2+/
HER2−
Baptista, M.Z. (2011) [6]10693C50B12N/ATMAscore68/3825/8120/8693/1333/7376/3027/79
Zheng, Y.Z. (2014) [10]21311211587-1-APIDCTMAscore98/115N/A123/5583/130N/A90/12383/130
Lee, E. (2006) [41]12785sc-13968IDC + ILC +
other
Tissuescore66/61116/1152/52106/2150/7797/2723/76
Bartkowiak, K. (2015) [42]182161C50B12IDC + ILC + otherTMAscoreN/A167/14102/7367/11415/131124/376/157
Chang, Y.W. (2016) [43]10860sc-13968IDCTissuescoreN/AN/AN/AN/AN/AN/AN/A
Yao, X. (2015) [5]10468sc-1051IDC + otherTissuescore66/3870/3444/6070/34N/A69/3531/73
Yang, F. (2016) [44]5049sc-13968N/ATissuescoreN/AN/AN/AN/AN/AN/AN/A
Zhang, D. (2008) [45] 8050610979N/ATMAscoreN/AN/A6/88/6N/A6/832/48
María Teresa de Jesús, C.D. (2021) [46]4835ab21685IDC + otherTMAscore24/31N/AN/AN/AN/A27/2613/40
López-Muñoz, E. (2019) [47]1514ab21685IDCTissuescoreN/A11/4N/A11/4N/A11/41/13
Lee, E. (2011) [48]4829sc-13968IDC + otherTissuescore30/18N/A17/3028/12N/AN/A21/25
N/A—not available; IDC—invasive ductal carcinoma; ILC—invasive lobular carcinoma; TMA—tissue microarray; LVC—lymphovascular.
Table 5. Characteristics of the IPO-P’s cohort samples included in the meta-analysis of BiP/GRP78 in breast cancer.
StudyNPositive CasesAntibodyHistologySampleCutoff
Criteria
Low Stage/
High Stage
Low Grade/
High Grade
Lnodes/
No Lnodes
ER+/
ER−
HER2+/
HER2−
cohort 11411HPA038845IDC + ILC + otherTissuescore9/511/31/1314/02/12
cohort 2129HPA038845IDC + ILC + otherTissuescore7/55/712/012/03/9
IDC—invasive ductal carcinoma; ILC—invasive lobular carcinoma.
Figure 4. Risk of bias assessment per criteria presented as percentages across all included studies and risk of bias in individual studies: Baptista, M.Z. (2011) [11], Bartkowiak, K. (2015) [42], Chang, Y.W. (2016) [43], Cohort 1, Cohort 2, Lee, E. (2006) [41], Lee, E. (2011) [48], López-Muñoz, E. (2019) [47], Maria Teresa de Jesús, C.D. (2021) [46], Yang, F. (2016) [44], Yao, X. (2015) [5], Zhang, D. (2008) [45], Zheng, Y.Z. (2014) [10]. + (green circles): low risk; ? (unclear, yellow circles): unclear risk; - (red circles): high risk.
Curroncol 29 00710 g004
Considering all of the studies and the IPO-P cohorts, 775 samples (70%) were positive for BiP, with a positive % range of 53–98% (Figure 5A). The sensitivity analysis identified the studies by Zheng, Y.Z. (2014) [10], Yang, F. (2016) [44], and Chang, Y.W. (2016) [43] as outliers of the pooled results (Figure 5B). The study from Bartkowiak, K. (2015) [42] had the highest contribution to the overall heterogeneity (I2 = 88%) and the study by Zheng, Y.Z. (2014) [10] had the highest influence on the pooled results. The publication bias was evaluated using funnel plots and two-sided Egger’s tests (Figure 5C). Omitting one study at a time did not influence the overall results; therefore, all of the studies were maintained for the subsequent analyses (Figure 5D).
Meta-regression was used to assess whether the heterogeneity between the studies could be explained by clinicopathological variables (Table 6). In the mixed-effects model, grade (p = 0.0498), ER expression (p = 0.0371), HER2 expression (p < 0.0001), and age (p = 0.0018) were unveiled as significant sources of variation that influence BiP positivity. These results agree with the association of BiP protein levels with ER and the high levels in HER2 molecular subtypes (Figure 1D,C).
A binary meta-analysis was performed to determine the relationship between BiP positivity and tumor grade, tumor stage, lymph node metastasis, menopausal status, ER expression, and HER2 expression. Although no significant association was found between lymph node metastasis and BiP positivity (n = 793, from 8 studies; I2 = 21%, CI = [0.92–2.17]) the analysis revealed a tendency for higher BiP immunodetection in metastatic tumors (post-treatment A), which agrees with BiP mRNA levels being highest in the metastasis tissues vs. primary tissues (Figure 1A). Contrary to the expected results, no significant differences were detected between BiP positivity and tumor stage (n = 543, from 6 studies, I2 = 62%, CI = [0.30–2.47]), tumor grade (n = 692, from seven studies, I2 = 28%, CI = [0.47–1.31]), menopausal status (n = 598, from five studies, I2 = 26%, CI = [0.75–1.85]), ER expression (n = 734, from seven studies, I2 = 0%, CI = [0.62–1.33]), or HER2 expression (n = 837, from nine studies, I2 = 13%, CI = [0.58–1.42]). However, BiP positivity was significantly associated with a higher risk of recurrence (n = 414, from five studies, I2 = 53%, RR = 3.48, p-value = 0.08 CI = [2.23–5.44]; Figure 6B). This conclusion should be carefully considered due to the low number of studies analyzed and the lack of correction for co-funding factors; still, the pooled effect was strong and reflected the results of the individual studies.
In summary, there are currently few studies to confidently associate BiP immunohistochemical positivity with clinical factors. Still, in line with the results from mRNA and protein public datasets, our data clearly show that the breast cancer diagnostic markers ER and HER2, as well as tumor grade, influence the heterogeneity of results. In addition, aligned with public dataset analysis, higher BiP immunohistochemical positivity was associated with recurrence-free survival and was borderline with metastasis, suggesting BiP as a prognostic indicator.

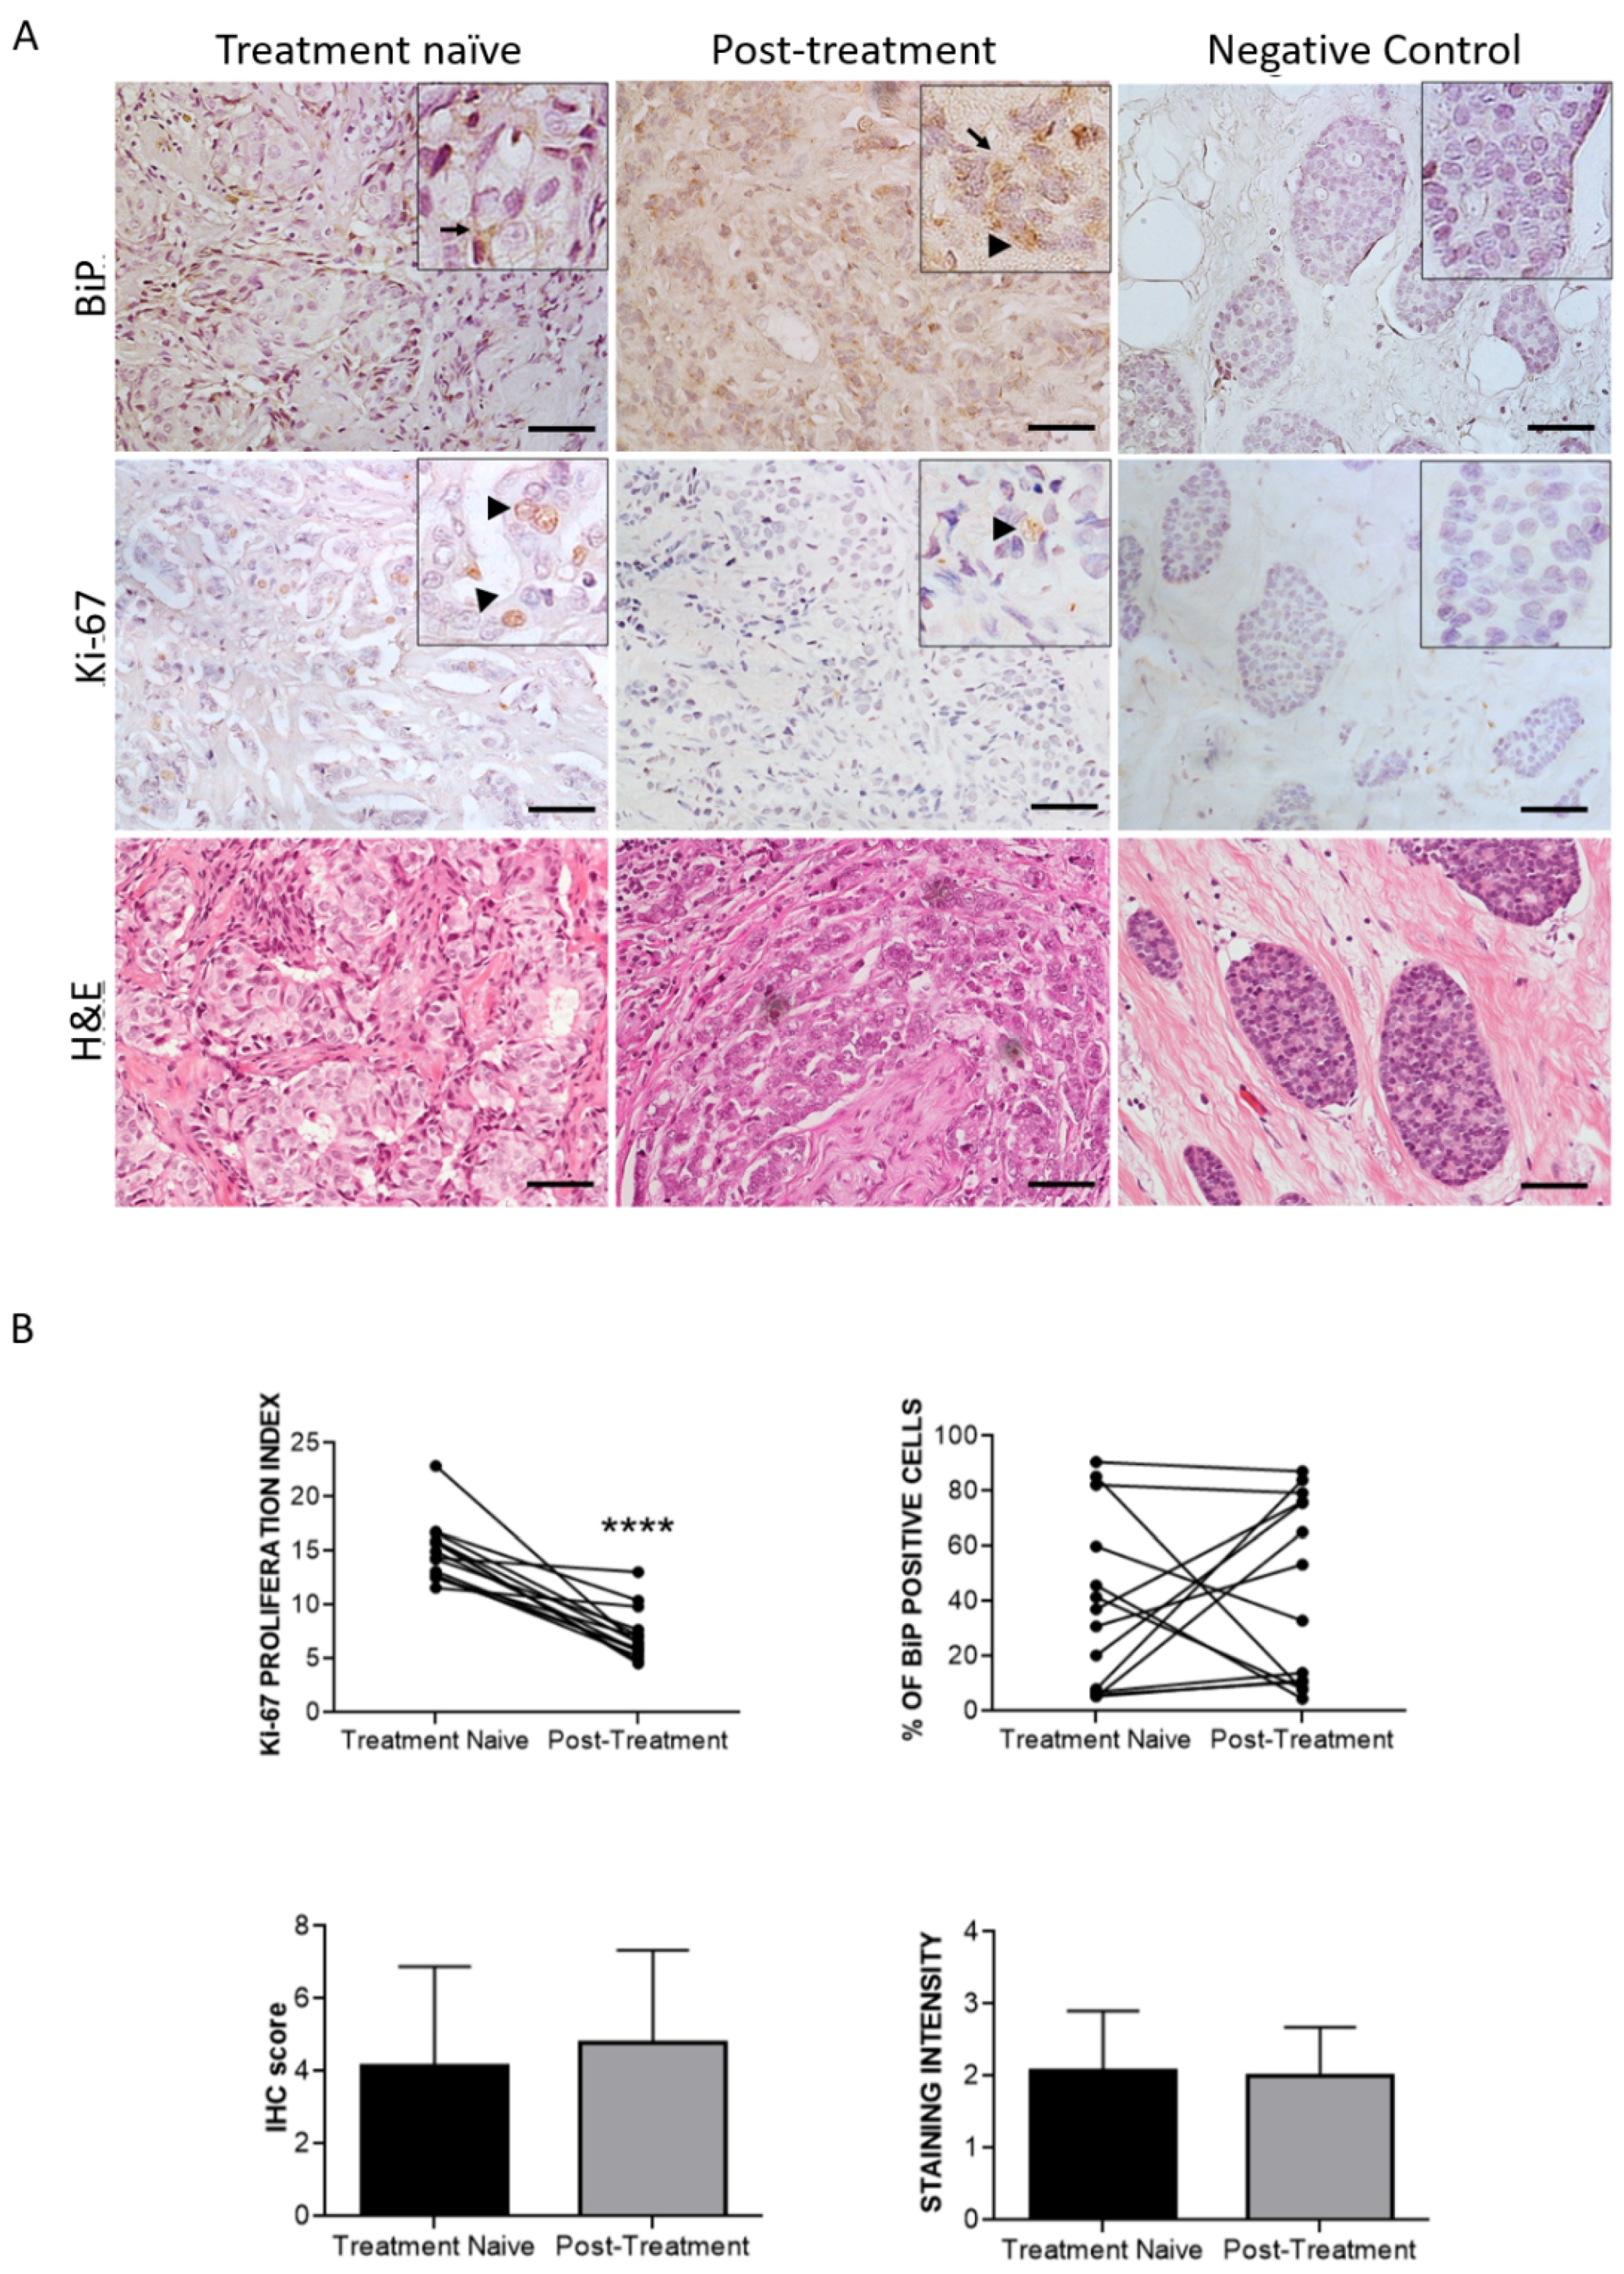
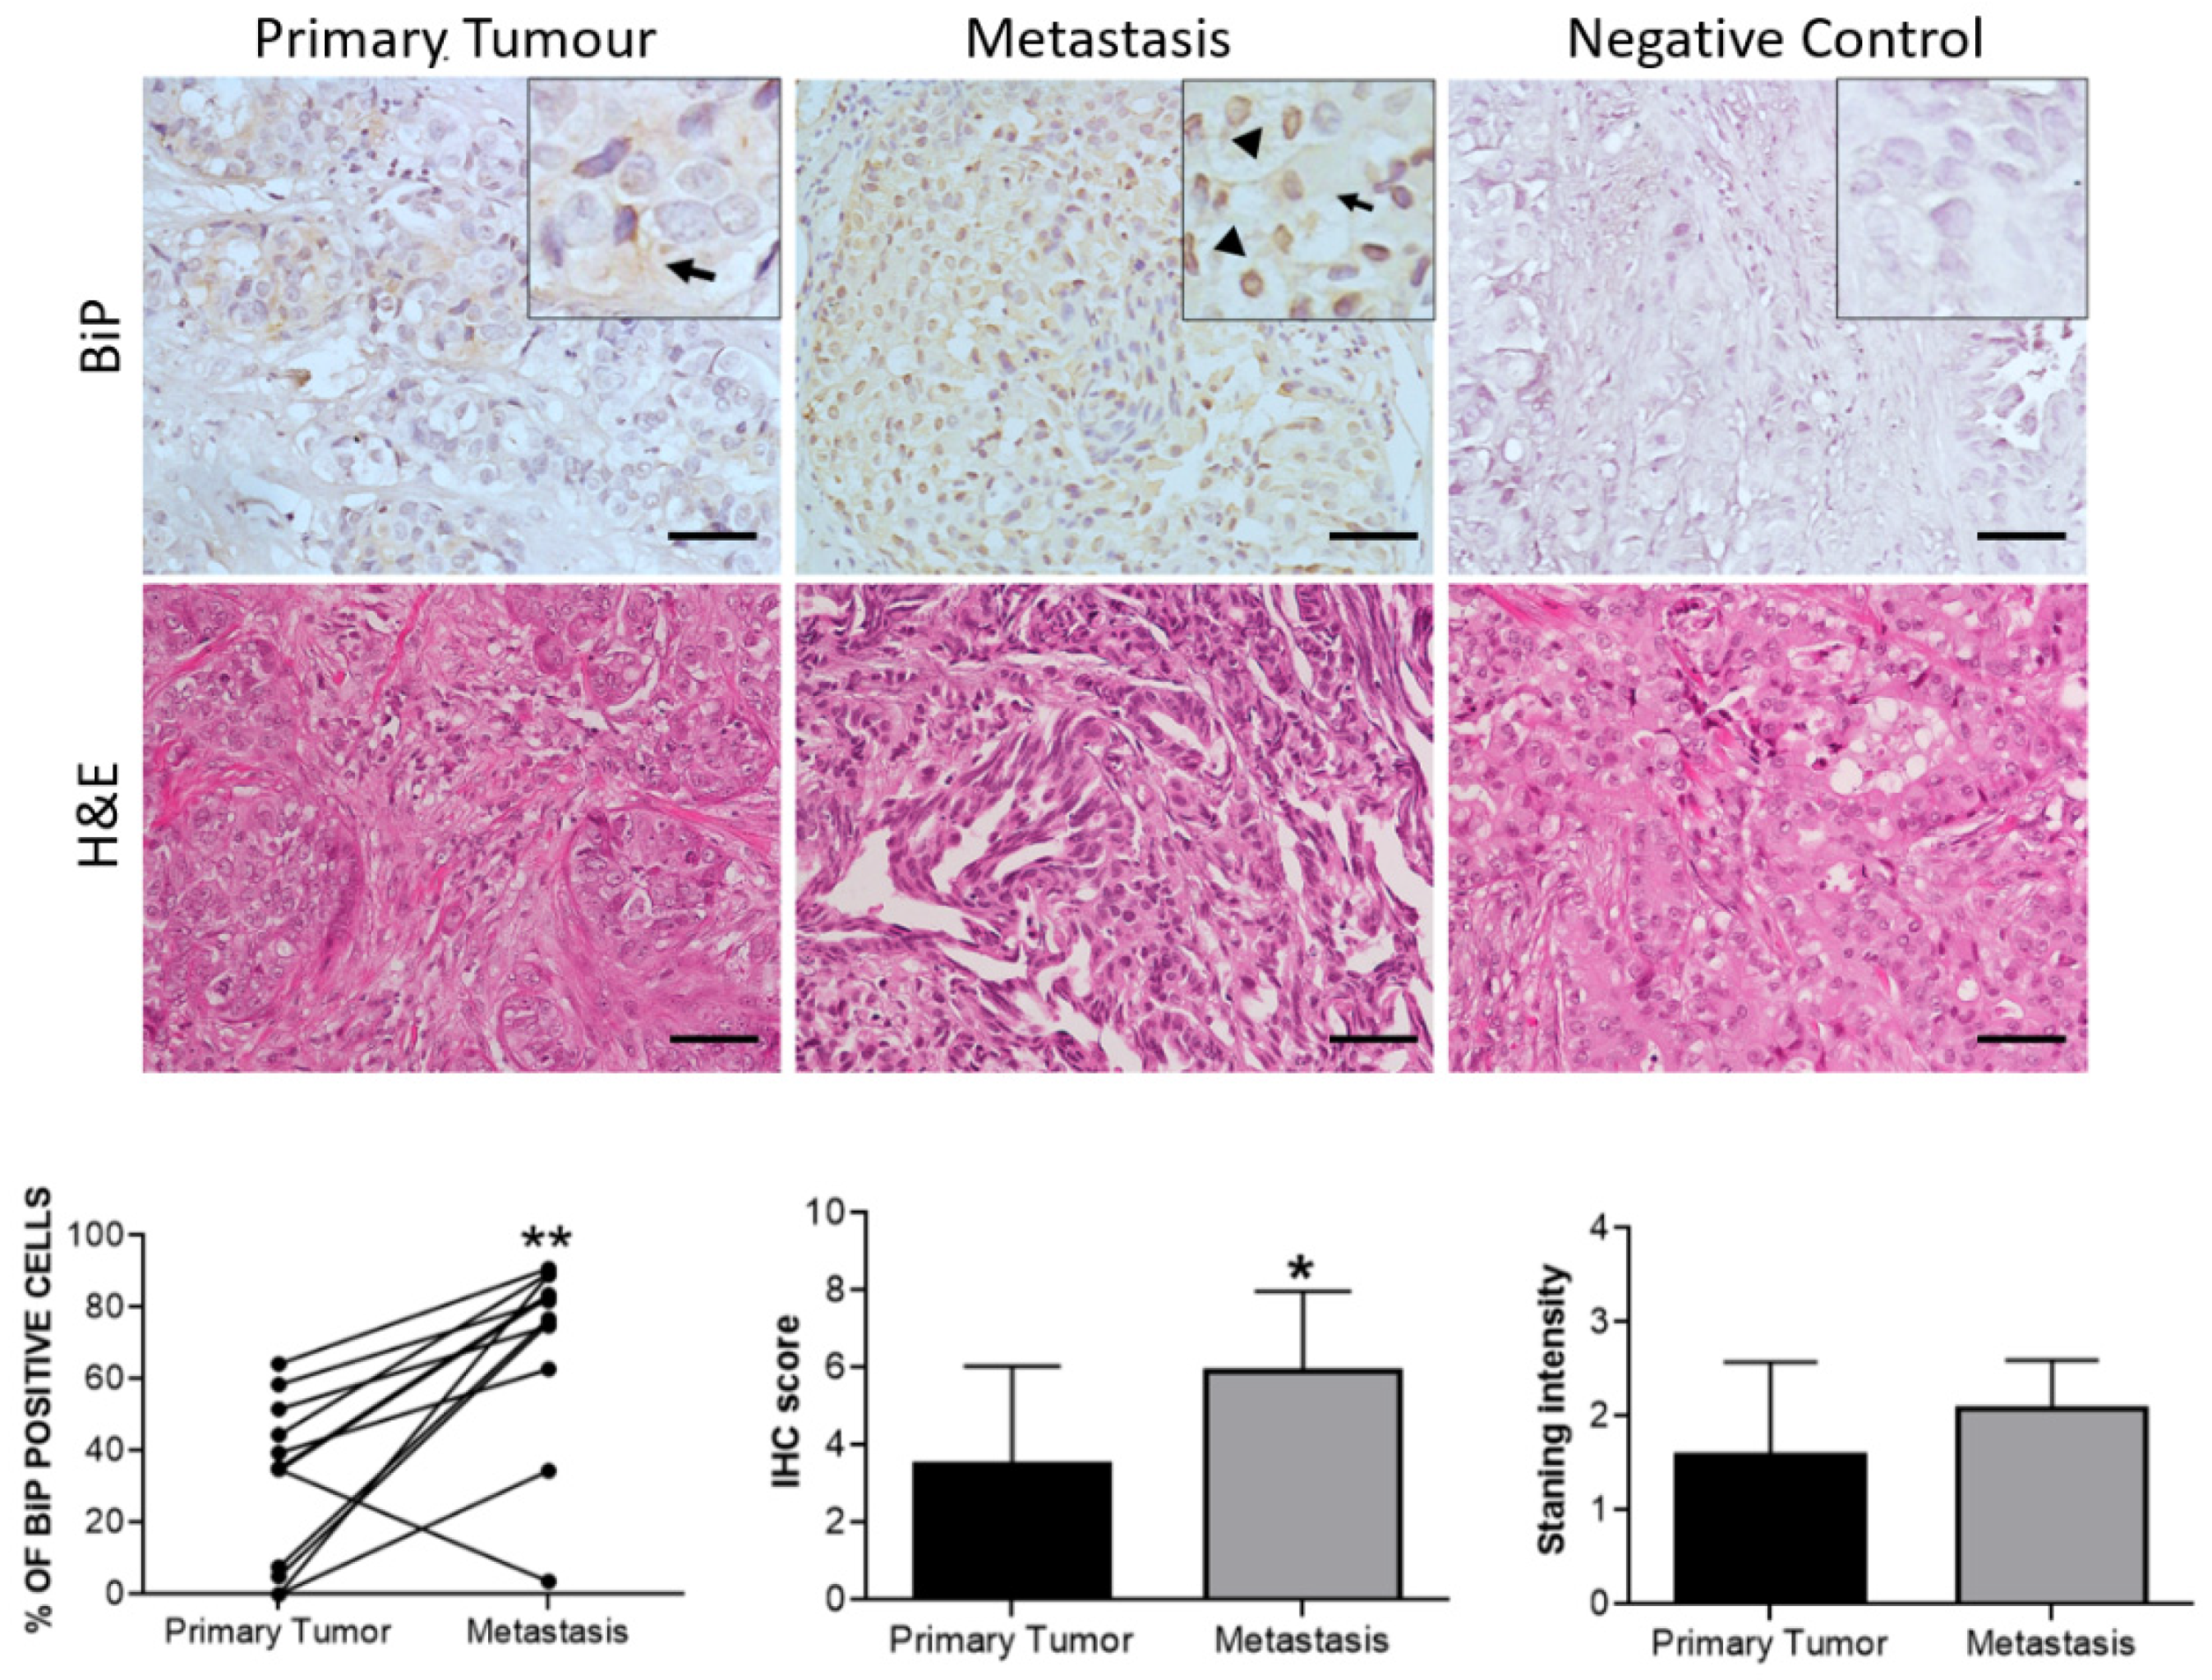
3.3. Effect of Therapy and Metastasis on BiP Expression in Breast Cancer

The analysis of CPTAC showed that BiP protein is lowest in the luminal breast cancer molecular subtypes as well as in tumors expressing ER, and, logically, the BiP-L group had significant overrepresentation of the ER signaling pathway (Table 3). Still, luminal tumors express BiP, which preclinical studies have shown can induce ER non-genomic signaling and interact at the protein level with ERα2. Therefore, we aimed to investigate how the detection of BiP by immunohistochemistry in luminal tumors is influenced by antiestrogen therapy and metastasis.
Immunohistochemical staining of BiP was performed in 52 breast cancer cases retrieved from IPOP’s biobank. Cohort 1 included 14 biopsies from ER+/HER2+ or −, luminal B, or luminal-like primary breast tumors that are treatment-naïve and the paired tumor samples after neoadjuvant antiestrogen treatment. Tumors with ductal, lobular, mixed, or neuroendocrine histological differentiation, staged from IIB to IV, were included. In total, 28 samples from patients with ages from 40 to 87 years old were analyzed in cohort 1. Cohort 2 included 12 ER+/HER2 + or −, luminal or luminal-like, treatment-naïve primary breast tumors and paired metastasis arising after endocrine treatment. Ductal, lobular, or mixed histological types were included as well as tumors staged between I and III. A total of 24 samples from patients with ages ranging 30 to 69 years-old were analyzed. The detailed clinicopathological characteristics of the two cohorts are presented in Supplementary Tables S2 and S3, respectively.
In cohort 1, all except two patients responded well to antiestrogen therapy as shown by a reduction of Ki67 index (Figure 7). In treatment-naïve tumors, BiP positive staining was detected in 78.5% (11/14) of the samples, with them being predominantly cytosolic (72.4%) (Figure 6A) and was significantly correlated with HER2 expression (p-value = 0.046) and tumor grade (p = 0.014) (Table 7).
After antiestrogen treatment, BiP positivity was detected in 85.7% (12/14) of the samples, but this increase was not significant. Interestingly, the subcellular localization of BiP was altered by treatment, with it being both cytosolic and nuclear in eight samples, a 57.1% increase in the nuclear + cytosolic staining compared with treatment-naïve tumors, although the percentage of positive cells and staining intensity remained unchanged (Figure 7B). BiP nuclear expression after antiestrogen treatment was found to be significantly associated with patient death (p-value = 0.043) and with higher tumor stage (p-value = 0.038) (Table 8).
In cohort 2, BiP positivity was detected in 66.7% (8/12) of the primary tumors and in 91.7% (11/12) of their paired metastasis, with the percentage of positive cells significantly being increased in the latter (Figure 8). The subcellular localization of BiP in the metastases was nuclear and cytosolic in 83.3% of the samples, representing a 33.3% increase compared with the paired primary tumors (Figure 8). No significant associations were found between BiP immunodetection and clinicopathological characteristics in this cohort (Table 9 and Table 10).
In summary, despite the small size of the cohorts analyzed, BiP immunohistochemical positivity associated with HER2 expression which is in line with the results from the meta-analysis, mRNA datasets, and protein public datasets. Equally aligned with previous results, BiP expression was found to be higher in metastatic tumors, with its nuclear expression being associated with higher a tumor stage and poorer outcome, further suggesting, that BiP could be a prognostic indicator for breast cancer.

4. Discussion

BiP/GRP78 in the inactive form acts as a key repressor of UPR, but once activated by binding to unfolded proteins, it plays a key role in protein folding and quality control in the endoplasmic reticulum lumen [49]. Cancer progression is associated with genomic instability, hypoxia, and oxidative stress, which all known to increase the dependency on adaptive stress responses that protect from proteotoxic stress related to the accumulation of misfolded proteins. Breast cancer cells usually overexpress molecular chaperones, including BiP, which facilitate the pro-survival and cytoprotective response of cancer cells to environmental stress [8]. Analyzing public datasets, immunohistochemical studies, and our own cohorts, we showed that BiP protein expression is associated with prognosis clinicopathological factors and further validation should establish its potential as an immunohistochemical marker to be used in breast cancer diagnostics.
The analysis of RNA-seq data confirmed previous studies showing higher BiP expression in breast cancer tissues vs. normal tissues and the further BiP increase in metastatic tumors [5,7,42,50]. These findings are in agreement with the meta-analysis and our own cohort 2. This confirms previous pre-clinical data showing that BiP knockdown results in decreased breast cancer cell invasion, proliferation, and metastasis [43,51,52]. Moreover, even though there was no association with tumor stage, the meta-analysis and our own cohorts also showed a significant association between increased BiP positivity and tumor stage. This may be explained by the higher BiP positivity in tumors expressing HER2, which tend to be more aggressive.
When BiP protein was stratified according to the lowest and highest quartile using the CPTAC dataset, a remarkable increase in the number of ER- and PR-positive tumors was significantly represented in the tumors with lowest BiP levels, which was also in agreement with mRNA expression showing significantly lower BiP in luminal A breast cancer vs. the other molecular subtypes. The higher number of ERBB2-positive tumors in lowest BiP group is puzzling given the strong correlations found between BiP and the HER2+ subtype (TCGA, CPTAC, and immunohistochemistry), and this may be due to ERBB2 expression in luminal B molecular subtype. In addition, it is already documented that induction of BiP at protein level is variable and does not always correspond with the transcript level [18], thus these associations deserve further attention.
Higher expression of BiP protein significantly correlated with triple-negative breast cancer and the TOP2A proteogenomic status, with poor differentiation (basal). This together with its positive association with higher grade and metastasis clearly signals BiP as a poor prognosis marker. Additionally, using Immunodeconv version 2.0.4 [34], we observed neutrophils, macrophages, and monocyte signatures in the BiP-high tumors. Although these cells need to be confirmed in the tumor tissue slides, increasing evidence points toward neutrophils and a higher neutrophils/lymphocyte ratio as markers of disease aggressiveness in ER- and HER2-negative breast cancers [53] as well as in triple-negative breast cancers [54] and response to chemotherapy [55], endocrine therapy [56] or trastuzumab treatment [57]. On the other hand, monocytes and macrophages have both pro- and anti-tumor effects in the breast cancer microenvironment [58] and it will be interesting to design future studies to evaluate the correlation of both phenotypes with BiP.
One of the major limitations of this meta-analysis is the high degree of heterogeneity and the potential confounding effects that remain undisclosed. The main methodological discrepancies found between the studies relate to the different antibodies used. Indeed, the antibodies are a significant source of variability as, despite being validated for immunohistochemistry and clinical application, they may yield dissimilar results. In addition, different scoring systems may also explain some heterogeneity since the studies with the higher proportion of BiP-positive cases are the ones that stablished a 1% cut-off [6,42,44]. Even though the sample size was sufficient to disclose a statistically significant prognostic value for BiP, due to the limited statistical power, the sample size should be expanded.
One result that stood out from the meta-analysis showed that BiP positivity was associated with a higher risk of recurrence, although only three studies [10,41,46] the besides IPO-P cohorts were included in this analysis (note that the study by Lee et al., 2011 [48], was not considered since RFS is calculated in a specific subpopulation of breast cancer patients treated with taxanes). While this is supported by the significant association with metastasis, tumor stage, and its higher levels in the more aggressive PAM50 molecular subtypes, this was not found in the CPTAC or TCGA datasets. Nonetheless, since it was not possible to control for co-founding effects in any of the approaches and since BiP mRNA levels in tumors may differ from protein levels, these results deserve further investigation in prospective studies.
Previously, we and others showed that BiP expression was higher in Tamoxifen- and Fulvestrant-resistant breast cancer cell lines [9,59,60,61]. Given that BiP positivity was associated with metastasis, we used a small cohort of treatment-naïve luminal-like breast cancer to further investigate how BiP positivity relates to endocrine response. To the best of our knowledge, this is the first study analyzing the effect of hormone therapy on BiP positivity in human breast cancer tissue. BiP expression after antiestrogen treatment was significantly increased (mostly in the nucleus) and associated with patient death and with a higher tumor stage, thus supporting its association with metastasis and more aggressive tumors. However, BiP positivity was not correlated with Ki67 index and did not significantly change after treatment, although its subcellular localization was significantly increased in the nucleus. BiP can be directed to the nucleus [62] where it may play a role in reducing DNA damage-induced apoptosis [63,64], while in amyotrophic lateral sclerosis, it binds to TDP-43 to prevent its misfolding and subsequent toxicity [65]. Moreover, BiP was shown to molecularly interact with ERα and to be required for gene transcription in the uterus, serving as a hub between ERα-independent and ERα-dependent estrogenic responses [12]. Therefore, we can speculate that a similar regulation may occur in breast cancer, as part of the acquired endocrine resistance process, which may explain its nuclear localization in the metastasis. Future studies in larger cohorts are needed to further validate these associations and better understand BiP regulation in the context of acquired endocrine resistance in breast cancer.
BiP has been described in the cell surface of breast cancer cells; however, its prognostic value remains controversial: cell surface expression was associated with good prognosis and response to chemotherapy in PR+ breast cancers [12] and triple-negative breast cancer [13,66]. On the other hand, cell membrane relocalization of BiP was related to increased proliferation and migration [5], as well as with the increased metastatic potential and stemness [67] of breast cancer cells while no prognostic value of BiP cell membrane expression was found in a cohort of stage II–III breast cancer [6]. Although BiP cell surface expression is of specific relevance as there are currently anti-BiP antibodies in pre-clinical trials [68] in our cohort, we only found one case with few cells showing this subcellular localization. This may be explained by the different techniques used to detect cell surface BiP, namely the epitope recognized by the antibody used in this study and/or the system used to amplify the signal. In addition, it was recently demonstrated that cell surface BiP was present in very low amounts and in only a subpopulation (10%) of MCF-7 cells [69]. Since we only analyzed a small luminal-like breast cancer cohort, the lack of BiP detection on cell membranes may be also explained by this characteristic.

5. Conclusions

The three independent research approaches used in this study showed that higher BiP protein levels are associated with worse outcomes and their detection holds prognostic potential for breast cancer. Meta-analysis of publicly available RNA-seq and proteomics datasets of human breast cancers disclosed, for the first time, an association of BiP differential expression with immune signatures and a differential expression of BiP mRNA according to breast cancer molecular subtypes. The systematic review and meta-analysis of the immunohistochemical detection of BIP identified for the first time that ER and HER2 are factors that contribute to BiP positivity. This meta-analysis also confirmed that BiP positivity is significantly associated with recurrence-free survival. The immunohistochemical detection of BiP in two small cohorts of luminal breast cancers disclosed a novel finding, the effect of endocrine treatment on BiP subcellular localization and confirmed that increased BiP expression is associated with metastasis and HER2 expression. Nevertheless, factors contributing to heterogeneity in the immunohistochemical determination of BiP positivity, such as the type of antibody, the cut-off for positivity, and the subcellular localization as well as confounding effects, need to be further explored. In summary, BiP/GPR-78 has been implicated in response to stress caused by nutrient deprivation, hypoxia, or resistance to chemotherapy in breast cancer. An active UPR thus provides a survival advantage to cancer cells over normal cells and the analysis presented in this manuscript showed the association between BiP expression and HER2 and basal molecular subtypes (usually more aggressive than luminal-like tumors), and its association with metastasis and short relapse-free survival highlights the prognostic potential of BiP for breast cancer as an indicator of poorer outcomes.

Supplementary Materials

The following supporting information can be downloaded at: https://www.mdpi.com/article/10.3390/curroncol29120710/s1, Table S1: List of causes for excluding studies from the metanalysis, Table S2: Clinicopathological data of the patient cohort 1 from IPOP, Table S3: Clinicopathological data of the patient cohort 2 from IPOP.

Author Contributions

Conceptualization, L.A.H.; methodology, I.D., F.L.M., D.G., I.C. and J.L.; formal analysis, I.D., F.L.M., D.G. and L.A.H.; investigation, I.D., F.L.M., D.G. and L.A.H.; resources, R.H., C.J. and L.A.H.; writing—original draft preparation, I.D., D.G., F.L.M. and L.A.H.; writing—review and editing, F.L.M., I.C., J.L., C.J., R.H. and L.A.H.; funding acquisition, L.A.H. All authors have read and agreed to the published version of the manuscript.

Funding

This research was funded by national funds through FCT—Fundação para a Ciência e a Tecnologia—within the projects UIDB/04501/2020 and UIDP/04501/2020, granted to the Aveiro Institute for Biomedicine. This work was also supported by the SR&TD Integrated Programmes “pAGE—Protein aggregation Across the Lifespan” (CENTRO-01-0145-FEDER-000003), MEDISIS (CENTRO-01-0246-FEDER-000018) and by IPO Porto Research Center (PI-27-CBEG). Inês Direito, Liliana Monteiro, and João Lobo are supported by the FCT PhD fellowships SFRH/BD/123821/2016, COVID/BD/151682/2022, SFRH/BD/117818/2016, COVID/BD/151716/2021 and SFRH/BD/132751/2017. Image acquisition was performed in the LiM facility of iBiMED, a node of PPBI (Portuguese Platform of BioImaging): POCI-01-0145-FEDER-022122.

Institutional Review Board Statement

The study was conducted according to the guidelines of the Declaration of Helsinki and approved by the Ethics Committee of the Portuguese Oncology Institute of Porto (protocol code CES IPO: 369/2017, date of approval: 14 December 2017).

Informed Consent Statement

Patient consent was waived due to the fact that only archival tissue was used exclusively in a retrospective way, obviating the need for patient consent according to Portuguese Law Art 19°, n6, Law 12/2005 from January.

Data Availability Statement

The data presented in this study are available in the article and supplementary material. The TCGAPanCancer and CPTAC dataset are publicly available through: https://www.cbioportal.org/ (accessed on 22 July 2022).

Conflicts of Interest

The authors declare no conflict of interest.

References

  1. Cancer Fact Sheets: Breast Cancer. Available online: http://gco.iarc.fr/today (accessed on 27 December 2021).
  2. Direito, I.; Fardilha, M.; Helguero, L.A. Contribution of the Unfolded Protein Response to Breast and Prostate Tissue Homeostasis and Its Significance to Cancer Endocrine Response. Carcinogenesis 2019, 40, 203–215. [Google Scholar] [CrossRef]
  3. Wang, J.; Lee, J.; Liem, D.; Ping, P. HSPA5 Gene Encoding Hsp70 Chaperone BiP in the Endoplasmic Reticulum. Gene 2017, 618, 14. [Google Scholar] [CrossRef]
  4. Carvalho, H.H.; Silva, P.A.; Mendes, G.C.; Brustolini, O.J.B.; Pimenta, M.R.; Gouveia, B.C.; Valente, M.A.S.; Ramos, H.J.O.; Soares-Ramos, J.R.L.; Fontes, E.P.B. The Endoplasmic Reticulum Binding Protein BiP Displays Dual Function in Modulating Cell Death Events. Plant Physiol. 2014, 164, 654. [Google Scholar] [CrossRef] [Green Version]
  5. Yao, X.; Liu, H.; Zhang, X.; Zhang, L.; Li, X.; Wang, C.; Sun, S. Cell Surface GRP78 Accelerated Breast Cancer Cell Proliferation and Migration by Activating STAT3. PLoS ONE 2015, 10, e0125634. [Google Scholar] [CrossRef]
  6. Baptista, M.Z.; Sarian, L.; Vassallo, J.; Pinto, G.A.; Soares, F.A.; de Souza, G.A. Prognostic Significance of GRP78 Expression Patterns in Breast Cancer Patients Receiving Adjuvant Chemotherapy. Int. J. Biol. Markers 2011, 26, 188–196. [Google Scholar] [CrossRef] [PubMed]
  7. Fernandez, P.M.; Tabbara, S.O.; Jacobs, L.K.; Manning, F.C.R.; Tsangaris, T.N.; Schwartz, A.M.; Kennedy, K.A.; Patierno, S.R. Overexpression of the Glucose-Regulated Stress Gene GRP78 in Malignant but Not Benign Human Breast Lesions. Breast Cancer Res. Treat. 2000, 59, 15–26. [Google Scholar] [CrossRef] [PubMed]
  8. Sokolowska, I.; Woods, A.G.; Gawinowicz, M.A.; Roy, U.; Darie, C.C. Identification of Potential Tumor Differentiation Factor (TDF) Receptor from Steroid-Responsive and Steroid-Resistant Breast Cancer Cells. J. Biol. Chem. 2012, 287, 1719. [Google Scholar] [CrossRef] [PubMed] [Green Version]
  9. Cook, K.L.; Shajahan, A.N.; Wärri, A.; Jin, L.; Hilakivi-Clarke, L.A.; Clarke, R. Glucose-Regulated Protein 78 Controls Cross-Talk between Apoptosis and Autophagy to Determine Antiestrogen Responsiveness. Cancer Res. 2012, 72, 3337. [Google Scholar] [CrossRef] [PubMed] [Green Version]
  10. Zheng, Y.; Cao, Z.; Hu, X.; Shao, Z. The Endoplasmic Reticulum Stress Markers GRP78 and CHOP Predict Disease-Free Survival and Responsiveness to Chemotherapy in Breast Cancer. Breast Cancer Res. Treat. 2014, 145, 349–358. [Google Scholar] [CrossRef]
  11. Yang, C.; Zhang, Z.; Zou, Y.; Gao, G.; Liu, L.; Xu, H.; Liu, F. Expression of Glucose-Regulated Protein 78 as Prognostic Biomarker for Triple-Negative Breast Cancer. Histol. Histopathol. 2020, 35, 559–568. [Google Scholar] [CrossRef]
  12. Yerushalmi, R.; Raiter, A.; Nalbandyan, K.; Hardy, B. Cell Surface GRP78: A Potential Marker of Good Prognosis and Response to Chemotherapy in Breast Cancer. Oncol. Lett. 2015, 10, 2149. [Google Scholar] [CrossRef] [Green Version]
  13. Raiter, A.; Yerushalmi, R.; Hardy, B. Pharmacological Induction of Cell Surface GRP78 Contributes to Apoptosis in Triple Negative Breast Cancer Cells. Oncotarget 2014, 5, 11452. [Google Scholar] [CrossRef] [Green Version]
  14. Dhamad, A.E.; Zhou, Z.; Zhou, J.; Du, Y. Systematic Proteomic Identification of the Heat Shock Proteins (Hsp) That Interact with Estrogen Receptor Alpha (ERα) and Biochemical Characterization of the ERα-Hsp70 Interaction. PLoS ONE 2016, 11, 160312. [Google Scholar] [CrossRef] [PubMed] [Green Version]
  15. Li, J.; Lee, A. Stress Induction of GRP78/BiP and Its Role in Cancer. Curr. Mol. Med. 2006, 6, 45–54. [Google Scholar] [CrossRef] [PubMed]
  16. Wang, M.; Wey, S.; Zhang, Y.; Ye, R.; Lee, A.S. Role of the Unfolded Protein Response Regulator GRP78/BiP in Development, Cancer, and Neurological Disorders. Antioxid Redox Signal. 2009, 11, 2307. [Google Scholar] [CrossRef] [Green Version]
  17. Fu, Y.; Lee, A.S. Glucose Regulated Proteins in Cancer Progression, Drug Resistance and Immunotherapy. Cancer Biol. 2006, 5, 741–744. [Google Scholar] [CrossRef] [PubMed] [Green Version]
  18. Gazit, G.; Lu, J.; Lee, A.S. De-Regulation of GRP Stress Protein Expression in Human Breast Cancer Cell Lines. Breast Cancer Res. Treat. 1999, 54, 135–146. [Google Scholar] [CrossRef] [PubMed]
  19. Li, Z.; Li, Z. Glucose Regulated Protein 78: A Critical Link between Tumor Microenvironment and Cancer Hallmarks. Biochim. Biophys. Acta 2012, 1826, 13–22. [Google Scholar] [CrossRef] [PubMed]
  20. La, X.; Zhang, L.; Li, H.; Li, Z.; Song, G.; Yang, P.; Yang, Y. Ajuba Receptor Mediates the Internalization of Tumor-Secreted GRP78 into Macrophages through Different Endocytosis Pathways. Oncotarget 2018, 9, 15464–15479. [Google Scholar] [CrossRef] [Green Version]
  21. PanCanAtlas Publications|NCI Genomic Data Commons. Available online: https://gdc.cancer.gov/about-data/publications/pancanatlas (accessed on 26 July 2022).
  22. CPTAC|Office of Cancer Clinical Proteomics Research. Available online: https://proteomics.cancer.gov/programs/cptac (accessed on 26 July 2022).
  23. CBioPortal for Cancer Genomics. Available online: https://www.cbioportal.org/ (accessed on 26 July 2022).
  24. Bartha, Á.; Győrffy, B. TNMplot.Com: A Web Tool for the Comparison of Gene Expression in Normal, Tumor and Metastatic Tissues. Int. J. Mol. Sci. 2021, 22, 2622. [Google Scholar] [CrossRef]
  25. Cerami, E.; Gao, J.; Dogrusoz, U.; Gross, B.E.; Sumer, S.O.; Aksoy, B.A.; Jacobsen, A.; Byrne, C.J.; Heuer, M.L.; Larsson, E.; et al. The CBio Cancer Genomics Portal: An Open Platform for Exploring Multidimensional Cancer Genomics Data. Cancer Discov. 2012, 2, 401–404. [Google Scholar] [CrossRef] [Green Version]
  26. Krug, K.; Jaehnig, E.J.; Satpathy, S.; Blumenberg, L.; Karpova, A.; Anurag, M.; Miles, G.; Mertins, P.; Geffen, Y.; Tang, L.C.; et al. Proteogenomic Landscape of Breast Cancer Tumorigenesis and Targeted Therapy. Cell 2020, 183, 1436–1456.e31. [Google Scholar] [CrossRef] [PubMed]
  27. STRING: Functional Protein Association Networks. Available online: https://string-db.org/ (accessed on 26 July 2022).
  28. Szklarczyk, D.; Gable, A.L.; Nastou, K.C.; Lyon, D.; Kirsch, R.; Pyysalo, S.; Doncheva, N.T.; Legeay, M.; Fang, T.; Bork, P.; et al. The STRING Database in 2021: Customizable Protein-Protein Networks, and Functional Characterization of User-Uploaded Gene/Measurement Sets. Nucleic Acids Res. 2021, 49, D605–D612. [Google Scholar] [CrossRef] [PubMed]
  29. Mounir, M.; Lucchetta, M.; Silva, T.C.; Olsen, C.; Bontempi, G.; Chen, X.; Noushmehr, H.; Colaprico, A.; Papaleo, E. New Functionalities in the TCGAbiolinks Package for the Study and Integration of Cancer Data from GDC and GTEx. PLoS Comput. Biol. 2019, 15, e1006701. [Google Scholar] [CrossRef] [PubMed] [Green Version]
  30. Bioconductor—MetagenomeSeq. Available online: https://bioconductor.org/packages/release/bioc/html/metagenomeSeq.html (accessed on 16 August 2022).
  31. Chen, Y.; Lun, A.T.L.; Smyth, G.K. From Reads to Genes to Pathways: Differential Expression Analysis of RNA-Seq Experiments Using Rsubread and the EdgeR Quasi-Likelihood Pipeline. F1000Research 2016, 5, 1438. [Google Scholar] [CrossRef] [Green Version]
  32. McCarthy, D.J.; Chen, Y.; Smyth, G.K. Differential Expression Analysis of Multifactor RNA-Seq Experiments with Respect to Biological Variation. Nucleic Acids Res. 2012, 40, 4288. [Google Scholar] [CrossRef] [Green Version]
  33. Robinson, M.D.; McCarthy, D.J.; Smyth, G.K. EdgeR: A Bioconductor Package for Differential Expression Analysis of Digital Gene Expression Data. Bioinformatics 2010, 26, 139–140. [Google Scholar] [CrossRef] [Green Version]
  34. Sturm, G.; Finotello, F.; Petitprez, F.; Zhang, J.; Baumbach, J.; Fridman, W.H.; List, M.; Aneichyk, T. Comprehensive Evaluation of Transcriptome-Based Cell-Type Quantification Methods for Immuno-Oncology. Bioinformatics 2019, 35, i436–i445. [Google Scholar] [CrossRef]
  35. Balduzzi, S.; Rücker, G.; Schwarzer, G. How to Perform a Meta-Analysis with R: A Practical Tutorial. Evid. Based Ment. Health 2019, 22, 153–160. [Google Scholar] [CrossRef] [Green Version]
  36. Package “netmeta” Title Network Meta-Analysis Using Frequentist Methods. Available online: https://cran.r-project.org/web/packages/netmeta/netmeta.pdf (accessed on 22 June 2021).
  37. Higgins, J.P.T.; Thompson, S.G. Quantifying Heterogeneity in a Meta-Analysis. Stat. Med. 2002, 21, 1539–1558. [Google Scholar] [CrossRef]
  38. HSPA5—Antibodies—The Human Protein Atlas. Available online: https://www.proteinatlas.org/ENSG00000044574-HSPA5/antibody (accessed on 26 July 2022).
  39. Becht, E.; Giraldo, N.A.; Lacroix, L.; Buttard, B.; Elarouci, N.; Petitprez, F.; Selves, J.; Laurent-Puig, P.; Sautès-Fridman, C.; Fridman, W.H.; et al. Estimating the Population Abundance of Tissue-Infiltrating Immune and Stromal Cell Populations Using Gene Expression. Genome Biol. 2016, 17, 218. [Google Scholar] [CrossRef] [PubMed]
  40. McShane, L.M.; Altman, D.G.; Sauerbrei, W.; Taube, S.E.; Gion, M.; Clark, G.M. REporting Recommendations for Tumour MARKer Prognostic Studies (REMARK). Br. J. Cancer 2005, 93, 387–391. [Google Scholar] [CrossRef] [PubMed] [Green Version]
  41. Lee, E.; Nichols, P.; Spicer, D.; Groshen, S.; Yu, M.C.; Lee, A.S. GRP78 as a Novel Predictor of Responsiveness to Chemotherapy in Breast Cancer. Cancer Res. 2006, 66, 7849–7853. [Google Scholar] [CrossRef] [Green Version]
  42. Bartkowiak, K.; Kwiatkowski, M.; Buck, F.; Gorges, T.M.; Nilse, L.; Assmann, V.; Andreas, A.; Müller, V.; Wikman, H.; Riethdorf, S.; et al. Disseminated Tumor Cells Persist in the Bone Marrow of Breast Cancer Patients through Sustained Activation of the Unfolded Protein Response. Cancer Res. 2015, 75, 5367–5377. [Google Scholar] [CrossRef] [PubMed] [Green Version]
  43. Chang, Y.; Tseng, C.; Wang, M.; Chang, W.; Lee, C.; Chen, L.; Hung, M.; Su, J. Deacetylation of HSPA5 by HDAC6 Leads to GP78-Mediated HSPA5 Ubiquitination at K447 and Suppresses Metastasis of Breast Cancer. Oncogene 2016, 35, 1517–1528. [Google Scholar] [CrossRef]
  44. Yang, F.; Tang, X.Y.; Liu, H.; Jiang, Z.W. Inhibition of Mitogen-Activated Protein Kinase Signaling Pathway Sensitizes Breast Cancer Cells to Endoplasmic Reticulum Stress-Induced Apoptosis. Oncol. Rep. 2016, 35, 2113–2120. [Google Scholar] [CrossRef] [Green Version]
  45. Zhang, D.; Tai, L.K.; Wong, L.L.; Putti, T.C.; Sethi, S.K.; Teh, M.; Koay, E.S. Proteomic characterization of differentially expressed proteins in breast cancer: Expression of hnRNP H1, RKIP and GRP78 is strongly associated with HER-2/neu status. Proteom. Clin. Appl. 2008, 2, 99–107. [Google Scholar] [CrossRef]
  46. María Teresa de Jesús, C.D.; Agni Jaim, M.G.; Cindy Karina, V.V.; Víctor Alberto, O.C.; Nicolás, R.T.; Verónica, G.O.; Fabio Abdel, S.G.; Patricia, P.S.; Sergio, F.H.; Eunice, L.M. BIK and GRP78 Protein Expression as Possible Markers of Response to Preoperative Chemotherapy and Survival in Breast Cancer. Taiwan J. Obs. Gynecol. 2021, 60, 245–252. [Google Scholar] [CrossRef]
  47. López-Muñoz, E.; Corres-Molina, M.; García-Hernández, N. Correlation of the protein expression of GRP78 and BIK/NBK with prognostic markers in patients with breast cancer and neoadjuvant chemotherapy. J. Obstet. Gynaecol. 2019, 40, 419–426. [Google Scholar] [CrossRef]
  48. Lee, E.; Nichols, P.; Groshen, S.; Spicer, D.; Lee, A.S. GRP78 as Potential Predictor for Breast Cancer Response to Adjuvant Taxane Therapy. Int. J. Cancer 2011, 128, 726. [Google Scholar] [CrossRef]
  49. Ibrahim, I.M.; Abdelmalek, D.H.; Elfiky, A.A. GRP78: A Cell’s Response to Stress. Life Sci. 2019, 226, 156. [Google Scholar] [CrossRef]
  50. Scriven, P.; Coulson, S.; Haines, R.; Balasubramanian, S.; Cross, S.; Wyld, L. Activation and Clinical Significance of the Unfolded Protein Response in Breast Cancer. Br. J. Cancer 2009, 101, 1692–1698. [Google Scholar] [CrossRef] [PubMed] [Green Version]
  51. Conner, C.; Lager, T.W.; Guldner, I.H.; Wu, M.; Hishida, Y.; Hishida, T.; Ruiz, S.; Yamasaki, A.E.; Gilson, R.C.; Belmonte, J.; et al. Cell Surface GRP78 Promotes Stemness in Normal and Neoplastic Cells. Sci. Rep. 2020, 10, 3474. [Google Scholar] [CrossRef] [Green Version]
  52. Chang, Y.; Chen, H.; Tseng, C.; Hong, C.; Ma, J.; Hung, M.; Wu, C.; Huang, M.; Su, J. De-Acetylation and Degradation of HSPA5 Is Critical for E1A Metastasis Suppression in Breast Cancer Cells. Oncotarget 2014, 5, 10558. [Google Scholar] [CrossRef] [PubMed] [Green Version]
  53. Ethier, J.; Desautels, D.; Templeton, A.; Shah, P.S.; Amir, E. Prognostic Role of Neutrophil-to-Lymphocyte Ratio in Breast Cancer: A Systematic Review and Meta-Analysis. Breast Cancer Res. 2017, 19, 2. [Google Scholar] [CrossRef] [Green Version]
  54. Tokumaru, Y.; Oshi, M.; Murthy, V.; Tian, W.; Yan, L.; Angarita, F.; Nagahashi, M.; Matsuhashi, N.; Futamura, M.; Yoshida, K.; et al. Low Intratumoral Genetic Neutrophil-to-Lymphocyte Ratio (NLR) Is Associated with Favorable Tumor Immune Microenvironment and with Survival in Triple Negative Breast Cancer (TNBC). Am. J. Cancer Res. 2021, 11, 5743. [Google Scholar]
  55. Xu, J.; Ni, C.; Ma, C.; Zhang, L.; Jing, X.; Li, C.; Liu, Y.; Qu, X. Association of Neutrophil/Lymphocyte Ratio and Platelet/Lymphocyte Ratio with ER and PR in Breast Cancer Patients and Their Changes after Neoadjuvant Chemotherapy. Clin. Transl. Oncol. 2017, 19, 989–996. [Google Scholar] [CrossRef] [PubMed]
  56. Andre, F.; Slimane, K.; Bachelot, T.; Dunant, A.; Namer, M.; Barrelier, A.; Kabbaj, O.; Spano, J.; Marsiglia, H.; Rouzier, R.; et al. Breast Cancer With Synchronous Metastases: Trends in Survival During a 14-Year Period. J. Clin. Oncol. 2004, 22, 3302–3308. [Google Scholar] [CrossRef]
  57. Hu, Y.; Wang, S.; Ding, N.; Li, N.; Huang, J.; Xiao, Z. Platelet/Lymphocyte Ratio Is Superior to Neutrophil/Lymphocyte Ratio as a Predictor of Chemotherapy Response and Disease-Free Survival in Luminal B-like (HER2−) Breast Cancer. Clin. Breast Cancer 2020, 20, e403–e409. [Google Scholar] [CrossRef]
  58. Jeong, J.; Suh, Y.; Jung, K. Context Drives Diversification of Monocytes and Neutrophils in Orchestrating the Tumor Microenvironment. Front. Immunol. 2019, 10, 1817. [Google Scholar] [CrossRef]
  59. Direito, I.; Monteiro, L.; Melo, T.; Figueira, D.; Lobo, J.; Enes, V.; Moura, G.; Henrique, R.; Santos, M.A.S.; Jerónimo, C.; et al. Protein Aggregation Patterns Inform about Breast Cancer Response to Antiestrogens and Reveal the RNA Ligase RTCB as Mediator of Acquired Tamoxifen Resistance. Cancers 2021, 13, 3195. [Google Scholar] [CrossRef] [PubMed]
  60. Fu, Y.; Li, J.; Lee, A.S. GRP78/BiP Inhibits Endoplasmic Reticulum BIK and Protects Human Breast Cancer Cells against Estrogen Starvation-Induced Apoptosis. Cancer Res. 2007, 67, 3734–3740. [Google Scholar] [CrossRef] [Green Version]
  61. Ariazi, E.A.; Cunliffe, H.E.; Lewis-Wambi, J.S.; Slifker, M.J.; Willis, A.L.; Ramos, P.; Tapia, C.; Kim, H.R.; Yerrum, S.; Sharma, C.G.N.; et al. Estrogen Induces Apoptosis in Estrogen Deprivation-Resistant Breast Cancer through Stress Responses as Identified by Global Gene Expression across Time. Proc. Natl. Acad. Sci. USA 2011, 108, 18879–18886. [Google Scholar] [CrossRef] [PubMed] [Green Version]
  62. Reddy, R.K.; Mao, C.; Baumeister, P.; Austin, R.C.; Kaufman, R.J.; Lee, A.S. Endoplasmic Reticulum Chaperone Protein GRP78 Protects Cells from Apoptosis Induced by Topoisomerase Inhibitors: Role of ATP Binding Site in Suppression of Caspase-7 Activation. J. Biol. Chem. 2003, 278, 20915–20924. [Google Scholar] [CrossRef] [Green Version]
  63. Barker, S.; Weinfeld, M.; Zheng, J.; Li, L.; Murray, D. Identification of Mammalian Proteins Cross-Linked to DNA by Ionizing Radiation. J. Biol. Chem. 2005, 280, 33826–33838. [Google Scholar] [CrossRef] [Green Version]
  64. Zhai, L.; Kita, K.; Wano, C.; Wu, Y.; Sugaya, S.; Suzuki, N. Decreased Cell Survival and DNA Repair Capacity after UVC Irradiation in Association with Down-Regulation of GRP78/BiP in Human RSa Cells. Exp. Cell Res. 2005, 305, 244–252. [Google Scholar] [CrossRef]
  65. François-Moutal, L.; Scott, D.; Ambrose, A.J.; Zerio, C.J.; Rodriguez-Sanchez, M.; Dissanayake, K.; May, D.G.; Carlson, J.M.; Barbieri, E.; Moutal, A.; et al. Heat Shock Protein Grp78/BiP/HspA5 Binds Directly to TDP-43 and Mitigates Toxicity Associated with Disease Pathology. Sci. Rep. 2022, 12, 8140. [Google Scholar] [CrossRef]
  66. Raiter, A.; Lipovetsky, J.; Hyman, L.; Mugami, S.; Ben-Zur, T.; Yerushalmi, R. Chemotherapy Controls Metastasis Through Stimulatory Effects on GRP78 and Its Transcription Factor CREB3L1. Front. Oncol. 2020, 10, 1500. [Google Scholar] [CrossRef]
  67. Jakobsen, C.G.; Rasmussen, N.; Laenkholm, A.; Ditzel, H.J. Phage Display Derived Human Monoclonal Antibodies Isolated by Binding to the Surface of Live Primary Breast Cancer Cells Recognize GRP78. Cancer Res. 2007, 67, 9507–9517. [Google Scholar] [CrossRef] [Green Version]
  68. Hernandez, I.; Cohen, M. Linking Cell-Surface GRP78 to Cancer: From Basic Research to Clinical Value of GRP78 Antibodies. Cancer Lett. 2022, 524, 1–14. [Google Scholar] [CrossRef] [PubMed]
  69. Zhang, Y.; Liu, R.; Ni, M.; Gill, P.; Lee, A.S. Cell Surface Relocalization of the Endoplasmic Reticulum Chaperone and Unfolded Protein Response Regulator GRP78/BiP. J. Biol. Chem. 2010, 285, 15065–15075. [Google Scholar] [CrossRef] [PubMed]
Figure 1. Association of BiP differential expression with breast cancer clinical factors and pathways. (A) Analysis of BiP mRNA expression in breast tumor tissue compared to normal and metastatic tissues using gene-chip- or RNA-seq-based data available in TNMplot; (B) Analysis of BiP mRNA expression across PAM50 subtypes using TCGA-BRCA data in R. ANOVA followed by Tukey’s test: significant difference at 5% level of significance. (C) Analysis of BiP protein levels across breast cancer subtypes using the CPTAC dataset in cBioPortal. (D) BiP correlation with clinical factors. BiP protein abundance in the CPTAC dataset was used to stratify the BiP higher and lower quartiles (BiP-H and BiP-L) and an analysis carried out using cBiopPotal. ER—estrogen receptor, PR—progesterone receptor, TNBC—triple-negative breast cancer, and ERBB2—receptor tyrosine-protein kinase erbB-2.
Curroncol 29 00710 g001
Figure 2. Association of BiP differential expression (high vs. low; BiP-H and BiP-L, respectively) with tissue-infiltrating immune and stromal cell populations using the mcp_count method from the immunodeconv package and TCGA-BRCA data overall.
Curroncol 29 00710 g002
Figure 5. Quality assessment of the meta-analysis. (A) Forest plot showing the pooled results of BiP positive expression in breast cancer samples in the included studies: Baptista, M.Z. (2011) [6], Bartkowiak, K. (2015) [42], Chang, Y.W. (2016) [43], Lee, E. (2006) [41], Lee, E. (2011) [48], López-Muñoz, E. (2019) [47], Maria Teresa de Jesús, C.D. (2021) [46], Yang, F. (2016) [44], Yao, X. (2015) [5], Zhang, D. (2008) [45], Zheng, Y.Z. (2014) [10], cohort 1 and cohort 2; * identifies the possible outliers. CI—confidence interval. (B) Baujat plot comparing the weight of each study to the overall BiP staining heterogeneity; (C) funnel plot showing the asymmetry and publication bias for BiP and the addition of five studies with the trim-fill test. (D) Sensitivity analysis showing that omitting one study at a time does not influence the overall results.
Curroncol 29 00710 g005
Figure 6. Forest plots for the binary meta-analysis. (A) Association between BiP positivity and lymph node metastasis in the studies Baptista, M.Z. (2011) [6], Bartkowiak, K. (2015) [42], Lee, E. (2006) [41], Lee, E. (2011) [48], Yao, X. (2015) [5], Zheng, Y.Z. (2014) [10], cohort 1 and cohort 2.; (B) Association between BiP positivity and recurrence-free survival [RFS] in the studies Lee, E. (2006) [41], Maria Teresa de Jesús, C.D. (2021) [46], Zheng, Y.Z. (2014) [10], cohort 1 and cohort 2. Individual study estimates of crude odds ratios and 95% confidence intervals (CI). Due to heterogeneity (I2), only random effects estimates were considered. Error bars indicate confidence intervals.
Curroncol 29 00710 g006
Figure 7. Representative pictures of BiP and Ki67 immunostaining and respective H&E in treatment-nave biopsies vs. their matched post-treatment tumors. (A) Arrows indicate cytosolic BiP expression while arrowheads show BiP and Ki67 nuclear localization in neoplastic cells. All pictures were from the same invasive ductal carcinoma case as seen in the corresponding H&E slide showing irregular and angulated tubules infiltrating the breast stroma. Scale bars: 50 μm (B) Graphs comparing % Ki67 index and %BiP positive cells, as well as BiP immunohistochemical (IHC) score in paired treatment-naïve biopsies and post-treatment tumors (n = 14). ****: p < 0.0001; Wilcoxon paired test.
Curroncol 29 00710 g007
Figure 8. Representative pictures of BiP immunostaining and respective H&E in treatment-naïve primary tumors vs. their paired metastasis. Arrows indicate cytosolic BiP expression while arrowheads show BiP nuclear localization in neoplastic cells. All pictures were from the same invasive ductal carcinoma case, as seen in the corresponding H&E slide showing irregular ducts infiltrating the breast stroma. Scale bars: 50 μm. The bar graphs comparing %BiP positive cells, BiP IHC score, and BiP IHC intensity of staining in paired treatment untreated tumors vs. post-treatment metastases (n = 12). *: p < 0.05, **: p < 0.01; Wilcoxon paired test.
Curroncol 29 00710 g008
Table 1. Association of BiP-High (BiP-H) and BiP-Low (BiP-L) groups in CPTAC dataset with clinical factors.
Clinical AttributeAttribute TypeStatistical Testp-Valueq-ValueHigher in
TOP2A Proteogenomic StatusPatientChi-squared Test5.67 × 10−141.82 × 10⁻¹²BiP-H
ERBB2 Proteogenomic StatusPatientChi-squared Test8.17 × 10−131.31 × 10⁻¹¹BiP-L
TNBREAST CANCER Updated Clinical StatusPatientChi-squared Test1.38 × 10−101.47 × 10⁻⁹BiP-H
xCell Immune ScorePatientWilcoxon Test8.45 × 10−55.41 × 10⁻⁴BiP-H
ESTIMATE Immune ScorePatientWilcoxon Test3.10 × 10−41.66 × 10⁻³BiP-H
PAM50SampleChi-squared Test9.61 × 10−44.39 × 10⁻³
CIBERSORT Absolute ScorePatientWilcoxon Test3.10 × 10−30.0123BiP-H
ER Updated Clinical StatusPatientChi-squared Test3.46 × 10−30.0123BiP-L
ESTIMATE TumorPurityPatientWilcoxon Test7.61 × 10−30.0244BiP-L
PR Clinical StatusPatientChi-squared Test0.0120.035BiP-L
Table 2. Overrepresented pathways in TCGA PanCancer Atlas dataset stratified by BiP-High (BiP-H) and BiP-Low (BiP-L) quartiles.
#term IDTerm DescriptionGenes MappedEnrichment ScoreDirectionFDRMethod
KEGG PATHWAYS
hsa04141Protein processing in the endoplasmic reticulum43399.369BiP-H3.47 × 10−12ks
hsa05169Epstein–Barr virus infection40363.869BiP-H1.94 × 10−7ks
hsa04612Antigen processing and presentation21493.643BiP-H1.97 × 10−7ks
hsa04110Cell cycle29409.514BiP-H8.80 × 10−7ks
hsa04650Natural killer cell-mediated cytotoxicity26390.086BiP-H1.91 × 10−6ks
hsa05164Influenza A30351.733BiP-H4.67 × 10−6ks
hsa05332Graft-versus-host disease15461.606BiP-H1.40 × 10−5afc
hsa04940Type I diabetes mellitus13479.743BiP-H2.75 × 10−5afc
hsa04145Phagosome3826.468BiP-H6.58 × 10−5ks
hsa05152Tuberculosis28285.612BiP-H6.58 × 10−5ks
hsa03050Proteasome14420.107BiP-H0.00023afc
hsa04142Lysosome2226.693BiP-H0.0031ks
hsa05020Prion disease42125.948BiP-H0.0087ks
REACTOME PATHWAYS
HSA-168249Innate immune system178269.185BiP-H2.16 × 10−24ks
HSA-6798695Neutrophil degranulation90348.227BiP-H1.06 × 10−19ks
HSA-1280218Adaptive immune system132248.407BiP-H2.22 × 10−14ks
HSA-1280215Cytokine Signaling in the immune system149234.508BiP-H5.12 × 10−12ks
HSA-913531Interferon signaling47415.029BiP-H6.46 × 10−12ks
HSA-1236975Antigen processing cross-presentation31421.988BiP-H1.09 × 10−9ks
HSA-909733Interferon alpha/beta signaling27501.242BiP-H2.01 × 10−9ks
HSA-72766Translation2342.642BiP-H4.59 × 10−9ks
HSA-1236974ER–phagosome pathway28420.465BiP-H1.62 × 10−8ks
HSA-983169Class I MHC-mediated antigen processing and presentation54311.864BiP-H1.68 × 10−8ks
HSA-5688426Deubiquitination45299.335BiP-H3.27 × 10−8ks
HSA-381119Unfolded protein response (UPR)20437.966BiP-H8.16 × 10−7afc
HSA-2132295MHC class II antigen presentation31321.922BiP-H1.24 × 10−5ks
HSA-381070IRE1alpha activates chaperones14459.057BiP-H1.24 × 10−5afc
HSA-449147Signaling by Interleukins97186.579BiP-H1.79 × 10−5ks
HSA-381038XBP1(S) activates chaperone genes13428.195BiP-H0.00017afc
HSA-977225Amyloid fiber formation13330.029BiP-H0.0055afc
HSA-983168Antigen processing: ubiquitination and proteasome degradation32217.782BiP-H0.0060ks
Bold denotes top10 pathway. ks: Kolmogorov–Smirnov test; afc: aggregate fold change.
Table 3. Overrepresented pathways in CPTAC protein dataset stratified by BiP-High (BiP-H) and BiP-Low (BiP-L) quartiles.
#term IDTerm DescriptionGenes MappedEnrichment ScoreDirectionFDRMethod
KEGG PATHWAYS
hsa04141Protein processing in the endoplasmic reticulum40183.735BiP-H9.15 × 10−6ks
hsa04657IL-17 signaling pathway15325.286BiP-H0.00014afc
hsa01100Metabolic pathways1510.503067Both0.0049ks
REACTOME PATHWAYS
HSA-6798695Neutrophil degranulation9423.212BiP-H1.65 × 10−9ks
HSA-168249Innate immune system170156.502BiP-H3.49 × 10−8ks
HSA-1474244Extracellular matrix organization37249.065BiP-H1.52 × 10−7ks
HSA-6799990Metal sequestration by antimicrobial proteins5737.368BiP-H2.17 × 10−6afc
HSA-6803157Antimicrobial peptides125.985BiP-H2.17 × 10−6afc
HSA-72766Translation58113.467BiP-H1.46 × 10−5ks
HSA-1799339SRP-dependent cotranslational protein targeting to membrane46119.151BiP-H0.00011ks
HSA-1474228Degradation of the extracellular matrix16280.973BiP-H0.00041afc
HSA-71291Metabolism of amino acids and derivatives75102.951BiP-H0.00041ks
HSA-1442490Collagen degradation10321.766BiP-H0.0020afc
HSA-877300Interferon gamma signaling18222.754BiP-H0.0063afc
HSA-381119Unfolded protein response (UPR)1821.652BiP-H0.0077afc
HSA-1280215Cytokine signaling in the immune system80115.149BiP-H0.0089ks
HSA-198933Immunoregulatory interactions between a lymphoid and a non-lymphoid cell13248.601BiP-H0.0089afc
HSA-1236975Antigen processing cross-presentation30159.939BiP-H0.0095ks
HSA-1280218Adaptive immune system1030.869687BiP-H0.0098ks
HSA-5617833Cilium assembly32251172BiP-L1.85 × 10−5ks
HSA-1852241Organelle biogenesis and maintenance38211028BiP-L0.00019ks
HSA-73894DNA repair31198671BiP-L0.00099ks
HSA-9018519Estrogen-dependent gene expression15328834BiP-L0.0020afc
HSA-74160Gene expression (Transcription)1110.735739BiP-L0.0050ks
HSA-5620924Intraflagellar transport16296691BiP-L0.0060afc
Bold denotes the top ten pathways. ks: Kolmogorov–Smirnov test; afc: aggregate fold change.
Table 6. Meta regression summary table.
StratificationNo. of Studiesp-ValueI2 (%)
Menopause status60.109270.00
Tumor stage70.724875.84
Tumor grade90.0498 *74.77
Lymph node metastasis100.959484.40
ER expression100.0371 *68.72
HER2 expression11<0.0001 *47.08
Age50.0018 *0.00
* Significative association.
Table 7. Correlation between BiP expression clinicopathological factors in cohort 1.
Clinical FactorCases, No.p-Value
Histology140.449
Age141.000
Grade140.014 *
HER2+140.046 *
Stage140.946
Lymph node metastasis140.308
Vital status140.353
Response to HT140.120
Ki-67 index140.373 #
* Statistically significant Fisher exact test. # Pearson’s correlation test.
Table 8. Correlation between BiP subcellular localization and clinical factors in IPOP’s cohort 1.
Clinical FactorCases, No.p-Value
HER2+141.000
Grade140.209
Stage140.038 *
Lymph node metastasis140.209
Vital status140.043 *
Response to HT140.326
* Statistically significant Fisher exact test.
Table 9. Correlation between BiP expression and the clinicopathological factors in cohort 2.
Clinical FactorCases, No.p-Value
Age121.000
Histology120.510
Grade120.567
HER2+121.000
Stage111.000
Lymph node metastasis81.000
Time to metastasis120.834
Table 10. Correlation between BiP subcellular localization and clinical factors in cohort 2.
Clinical FactorCases, No.p-Value
HER2+121.000
Grade121.000
Stage110.900
Lymph node metastasis80.604
Time to metastasis120.682
Publisher’s Note: MDPI stays neutral with regard to jurisdictional claims in published maps and institutional affiliations.

