Article

Pyrrolizidine Alkaloids from Monofloral and Multifloral Italian Honey

1
Department of Veterinary Medical Sciences, Alma Mater Studiorum—University of Bologna, via Tolara di sopra 50, 40064 Ozzano dell’Emilia, Italy
2
National Reference Laboratory for Plant Toxins in Food, Food Chemical Department, IZSLER, Via Fiorini, 5, 40127 Bologna, Italy
*
Author to whom correspondence should be addressed.
Int. J. Environ. Res. Public Health 2023, 20(7), 5410; https://doi.org/10.3390/ijerph20075410
Submission received: 6 March 2023 / Revised: 29 March 2023 / Accepted: 3 April 2023 / Published: 5 April 2023
(This article belongs to the Special Issue Health Risks and Dietary Intake of Emerging Pollutants)

Abstract

:
Pyrrolizidine alkaloids (PAs) are secondary metabolites produced by plants as a self-defense against insects. After bioactivation in the liver, some PAs can cause acute or chronic toxicity in humans. The aim of this study was to determine the presence of PAs in 121 samples of monofloral and multifloral honey from three different Italian regions (Friuli-Venezia Giulia, Marche and Calabria) to meet the European Food Safety Authority (EFSA) suggestion. An in-house liquid chromatography with tandem mass spectrometry (LC-MS/MS) method was validated according to European Union Reference Laboratory (EURL) performance criteria. This method allowed the detection and quantification of 35 PAs. Of the 121 honey samples, 38 (31%), mostly from Calabria, contained PAs. The total content of the PAs ranged from 0.9 µg/kg to 33.1 µg/kg. In particular, echimidine was the most prevalent PA. A rapid human exposure assessment to PAs in honey and a risk characterization was performed using the EFSA RACE tool. The assessment highlighted a potential health concern only for toddlers who frequently consume elevated quantities of honey. This study showed a low presence of PAs in Italian honey; however, the importance of continuously monitoring these compounds is stressed, along with the suggestion that the relevant authorities establish maximum limits to guarantee support for producers and consumer safety.

1. Introduction

Pyrrolizidine alkaloids (PAs) and their N-oxides (PANOs) are secondary metabolites derived from a necine base produced by plants as a self-defense against insects. Pyrrolizidine alcaloids have received increasing attention due to their toxicity as well as their presence in several plant species relevant to human and animal nutrition [1]. More than 660 different PAs have been identified [2]. They have been detected in more than 6000 plant species [2,3], mainly Senecio spp. and Eupatorium spp. (Asteraceae), Echium spp. (Boraginaceae) and Crotalaria spp. (Fabaceae) [4]. The PA content can vary depending on the plant species, site of accumulation, harvest time and climatic conditions. In general, they are found in greater quantities in flowers and seeds and to a lesser extent in leaves, stamens, and roots. The possible routes of human dietary exposure to PAs occur through the ingestion of plants and herbal products (drugs, herbal teas, dietary supplements) [5,6,7,8] as well as animal products such as honey [4]. Honey and other hive products can be contaminated with PAs as a results of bees foraging on alkaloid-producing plants [9]. Recent studies have shown that PAs can also be found in water and soil [10,11].
The toxicity of PAs has been widely documented, being almost exclusively associated with their metabolites [1]. Pyrrolizidine alkaloids themselves are pro-toxins, biologically and toxicologically inactive, and need to be metabolically activated in order to exert toxicity; consequently, if not activated, they do not develop toxicity [5]. These compounds are mainly bioactivated in the liver by CYP450 monooxygenases [1,2,4,12] producing 6,7-dihydro-7-hydroxy-1-(hydroxymethyl)-5H-pyrrolizine (ester pyrrolyl), a strong electrophile that can rapidly bind to nucleophilic centers such as nucleic acids, proteins and amino acids, forming pyrrole complexes that can persist in tissues and generate toxicity, especially in the liver [2,9,13,14,15]. These compounds have been shown to be hepatotoxic, pneumotoxic, genotoxic and carcinogenic and exhibit developmental toxicity [5,7]. An important detoxification pathway is by conjugation with glutathione, forming soluble compounds that are much less toxic and more easily eliminated [16].
Pyrrolizidine alkaloids are hepatotoxic to animals and humans; they can cause acute toxicity and have chronic effects [9,12,17]. Chronic exposure to low levels of PAs can cause liver cirrhosis and cancer as metabolic activation produces genotoxic and carcinogenic reactive pyrrolic forms [9]. The International Agency for Research on Cancer (IARC) has evaluated several PAs and has classified lasiocarpine, monocrotaline and riddelliine as Group 2B (possibly carcinogenic to humans), while hydroxysenkirkine, isatidine, jacobine, retrorsine, seneciphylline, senkirkine and symphytine were included in Group 3 (not classifiable as to their carcinogenicity to humans) [15,18,19]. As a consequence, the EFSA, the European Food Safety Authority, has repeatedly considered the issue of the presence of pyrrolizidine alkaloids in food with the aim of establishing the level of risk to public health [12,13].
In fact, maximum levels in bee pollen have been set by the Commission Regulation (EU) 2020/2040 [1,20], while there is still no regulation for the presence of these alkaloids in honey and limits to establish criteria for acceptance or rejection in the marketing of this food have not yet been set [21]. For this reason, the EFSA has suggested collecting data regarding the content of PAs/PANOs in honey of different geographical and botanical origins. Exhaustive data regarding PA/PANO content in honey from Italy are scarce. Lucatello et al. (2021) recently found 17 PAs/PANOs in honey samples from the Veneto region and showed that 45% of the samples analyzed contained at least one PA. However, the consumption of this honey did not seem to represent a risk for adult consumers [22].
To meet the EFSA suggestion, the aim of this research was to determine the presence of PAs in Italian honey. Honey samples from three Italian regions (Friuli-Venezia Giulia, Marche, and Calabria) were analyzed for their PA/PANO content using an in-house liquid chromatography with tandem mass spectrometry (LC-MS/MS) method, developed and validated by the National Reference Laboratory for Plant Toxins in Food (LNR-TVN) of the Istituto Zooprofilattico Sperimentale della Lombardia e dell’Emilia Romagna (IZSLER) in Bologna. This method is capable of detecting up to 35 analytes, according to Commission Regulation (EU) 2020/2040 [20]. The assessment of human exposure to PAs in honey has been estimated on the basis of the results of the analysis in order to characterize the health risk for all age groups of the population.

2. Materials and Methods

2.1. Sampling

A total of 121 different types of honey were collected from several Italian beekeepers in three Italian regions: Friuli-Venezia Giulia (n = 37), Marche (n = 39) and Calabria (n = 45). The province of origin of the honey is reported in Table 1. Samples included both multifloral (n = 34) and monofloral (n = 87) honey. Monofloral honey was the most representative and the plant species are reported in Table 2.

2.2. Chemicals and Standards

Analytical standards of all pyrrolizidine alkaloids and their N-oxide were purchased from Phytolab (Vestenbergsgreuth, Germany): Echimidine (Em), Echimidine-N-oxide (EmNO), Echinatine (En), Echinatine-N-oxide (EnNO), Erucifoline-N-oxide (ErNO), Europine (Eu), Europine-N-oxide (EuNO), Heliosupine (Hs), Heliosupine-N-oxide (HsNO), Heliotrine (Ht), Heliotrine-N-oxide (HtNO), Indicine (Id), Indicine-N-oxide (IdNO), Integerrimine (Ir), Integerrimine-N-oxide (IrNO), Intermedine (Im), Intermedine-N-oxide (ImNO), Lasiocarpine (Lc), Lycopsamine (Ly), Lycopsamine-N-oxide (LyNO), Retrorsine (Rt), Retrorsine-N-oxide (RtNO), Rinderine (Rn), Rinderine-N-oxide (RnNO), Senecionine (Sn), Senecionine-N-oxide (SnNO), Seneciphylline (Sp), Seneciphylline-N-oxide (SpNO), Senecivernine (Sv), Senecivernine-N-oxide (SvNO), Senkirkine (Sk), Spartioidine (St), Spartioidine-N-oxide (StNO), Usaramine (Us) and Usaramine-N-oxide (UsNO). Methanol (LC-MS grade) was from VWR Chemicals (Rosny-sous-Bois-cedex, France), sulphuric acid (96%) and acetonitrile (LC-MS grade) were from Carlo Erba Reagents (Val de Reuil Cedex, France), formic acid was from Carlo Erba Reagents (Milan, Italy) and ammonium formate (analytical grade) was from Sigma-Aldrich (St. Louis, MO, USA). Ultrapure water used throughout the experiments was produced by an EvoQua Water Technologies system (Diessechem, Milan, Italy).

2.3. Materials

QuEChERS reagents (magnesium sulphate 4 g, sodium chloride 1 g, sodium citrate 1 g, disodium hydrogen citrate sesquihydrate 0.5 g) were from Agilent Technologies (Santa Clara, CA, USA).

2.4. Working Solutions

Stock standard solutions of each compound were prepared by dissolving suitable quantities of reference material in methanol to obtain a concentration of 1000 µg/mL. Working standard solutions containing all PAs—native and N-oxide—were prepared in water/methanol (95:5 v/v) for spiking purposes. All solutions were stored at −20 °C [23].

2.5. Sample Preparation

A 2.5 ± 0.1 g aliquot of homogenized sample was weighed into a 50 mL Falcon tube.
Samples were treated as follows: addition of 15 mL of sulphuric acid 0.1 M, vortex and horizontal shaker for 45 min; addition of 15 mL of acetonitrile and QuEChERS extraction reagents, horizontal shaker for 30 min and centrifuged at 3000 rpm at room temperature for 10 min. An aliquot of supernatant extract was dried with a gentle flow of nitrogen in a water bath at 40 °C. The dry extract was dissolved in 1 mL of water/methanol (95:5 v/v) and transferred into vial for LC-MS/MS analysis. A quality control sample (i.e., spiked sample at LOQ) was assessed at every batch analysis.

2.6. Melissopalynological Analysis

To identify the botanical and geographical origin of honey, a qualitative-quantitative melissopalynological analysis was carried out using the microscopic method UNI 11299:2008. The analysis was performed on four honey samples showing higher quantities of PAs: two multifloral (27.1–33.1 µg/kg) and one chestnut (30.6 µg/kg) from the Calabria and one Stachys honey (9.2 µg/kg) from the Marche. All honey samples were diluted in ultrapure water and centrifuged. The sediment was transferred onto the microscope slide to be examined. For the estimation of the relative frequencies of pollen types, a minimum of 300 pollen grains were counted at 400x magnification using light microscope Axiolab 5 (Carl Zeiss, Jena, Germany) [24].

2.7. Instrumentation

The LC-MS/MS system used was an Acquity ultra-performance liquid chromatograph (UPLC) coupled to Quattro Premiere XE triple quadrupole mass spectrometer (Waters, Milford, MA, USA). The system was computer-controlled and data acquisition, peak integration and calibration were performed using TargetLynx software v.4.1. The chromatographic column was an Acquity UPLC C8 100 cm × 2.1 mm, 1.7 µm (Water Corporation, Milford, CT, USA). The mobile phase consisted of 5 mM ammonium formate and 0.1% formic acid in water (A) and in methanol (B) [25]. The flow rate was set at 0.3 mL/min; 10 μL was injection volume. The mobile phase gradient was set as follows: from 5% to 20% of B for 10 min, from 20% to 50% for 5 min and return to initial condition for 0.5 min and hold for 1.5 min. Total run time was 17 min. The ESI source was in positive ionization mode with a capillary voltage of 1.0 kV, a cone voltage of 40 V, a source temperature of 120 °C and a desolvation temperature of 450 °C. Ionization and fragmentation conditions for PAs were identified by using a continuous infusion of the tuning solutions and gradually changing the parameters.

2.8. Quantification

Pyrrolizidine alkaloids were identified and quantified on the basis of retention time, ion fragments produced and ion ratio. The retention time had to be ± 0.2 min compared to reference peaks. In Figure 1 and Figure 2 are shown the chromatograms of a standard mixture of PAs and a standard mixture of PANOs, respectively, at 5 ng/mL concentration.
A honey matrix-matched calibration curve was prepared to quantify PA content of unknown samples. Pyrrolizidine alkaloid concentration was extrapolated by means of the least squares regression method. Calibration curve concentration levels were 0.5–1–2.5–5–10–25 ng/mL.

2.9. Performance Evaluation

The method was validated according to the EURL-MP guidance document plant toxins performance criteria [26] and Regulation 401/2006/EC [27]. Specificity, recovery rates, linearity, repeatability, within-laboratory reproducibility, limit of detection (LOD) and limit of quantification (LOQ) were evaluated. Specificity was verified and the presence of interference was checked by analyzing 20 honey samples of different species. Correlation coefficients (R2) of the matrix-matched calibration curve had to be ≥ 0.99 for all analytes. The LOD at 0.5 µg/kg and LOQ at 1 µg/kg were established on the basis of a signal-to-noise ratio, S/N = 3 (LOD) and S/N ≥ 5 (LOQ). Repeatability and overall recovery were assessed by analyzing blank samples fortified with PAs at concentrations of 1–10–25 µg/kg in six replicates per level. The same experiment was carried out in two additional sessions to determine within-laboratory reproducibility. The selectivity of the LC–MS/MS method is obtained by acquiring the data in MRM mode and monitoring one precursor ion and two daughter ions for each molecule according to SANTE/12089/2016 [28]. The LC-MS/MS parameters are reported in Table 3. Of the 35 analytes, 14 were isomers and were classified into five groups: Sn-group (Sn, Sv, Ir), Ly-group (Ly, Im, Id, En, Rn), Sp-group (Sp, St), Em-group (Em, Hs) and Rt-group (Rt, Us); the same applied to the N-oxides.

2.10. Statistical Analysis

The lower-bound approach was used to substitute with zero the values below the LOQ, as indicated by EFSA [12]. The central limit theorem was taken into consideration to assess the normality of distribution [29]. Kruskal–Wallis one-way ANOVA with Dunn’s multiple comparisons post-hoc test was performed to determine significant differences among the honey types in the same region of origin and among the honey types without taking into consideration the origin. The p-value obtained underwent Bonferroni’s correction. The Levene test was performed to assess the homoscedasticity and consequently the robust one-way ANOVA Tahmane post-hoc test was applied to detect significant differences of the PA/PANO content among the three different regions.
The presence/absence of PAs was used to create a dichotomous variable and X2 test was performed to detect significant association between the above-mentioned variable, the honey types and the region of origin. The type and the strength of association were assessed by calculating the Cramer V value [30]. Statistical analyses were performed using R 4.2.1 (R foundation for statistical computing; Vienna, Austria; https://www.R-project.org/ accessed on 15 January 2023). Data are reported as median, mean ± SD (standard deviation). A p-value < 0.05 was considered statistically significant.

2.11. Exposure Assessment and Risk Characterization

Human exposure assessment and risk characterization were performed using the EFSA RACE tool [31]. It is a spreadsheet that calculates human intake of food contaminants (e.g., PAs) for all member state subgroups of population taking into account: (1) food consumption data [32]; (2) detailed food description based on FoodEx2 food classification; (3) experimental occurrence of selected substances in the food commodity. In order to evaluate the health risk, exposure is therefore compared with the relevant toxicological reference points. The first is the Acute Reference Dose (ARfD), which is an estimate of the quantity of a substance in food and/or drinking-water, normally expressed on a body-weight basis, that can be ingested in a period of 24 h or less without appreciable health risk to the consumer on the basis of all the known facts at the time of the evaluation [33]. The Acute Reference Dose is a reference point for short-term exposure. The second is the benchmark dose lower confidence limit for a 10% excess cancer risk (BMDL10), a reference value for long-term exposure that corresponds to a specific change in an adverse response compared to the response in unexposed subjects [34].
For contaminants such as PAs, these two toxicological values for both acute and chronic exposure were considered. The acute human health risk was characterized in terms of percentage of ARfD ingested while chronic risk was described with the Margin of Exposure (MoE) approach. The MoE is the ratio between the dose associated with a small increase in adverse effect (BMDL10) and the level of human exposure calculated by RACE.
For RACE exposure assessment, the selected food item was “honey” while the highest PA content detected in the samples was entered as our worst-case occurrence data. The ARfD was 2 mg/kg bw per day and BMDL10 was 237 µg/kg bw, as updated reference points for the sum of 1,2-unsaturated PAs assuming equal potency [13].
A percentage of ARfD ingested lower than 100% and an MoE of 10,000 or higher would be of low concern from a public health point of view for acute and chronic risk, respectively. The RACE tool analyzed every population subgroup in terms of consumption pattern. This approach results in outcomes referencing the whole population or consumers only depending on the answers given within the food consumption survey. For all population groups, mean, median and 95th percentile output values were calculated. The 95th percentile was considered the relevant value for a high honey consumption pattern.

3. Results and Discussion

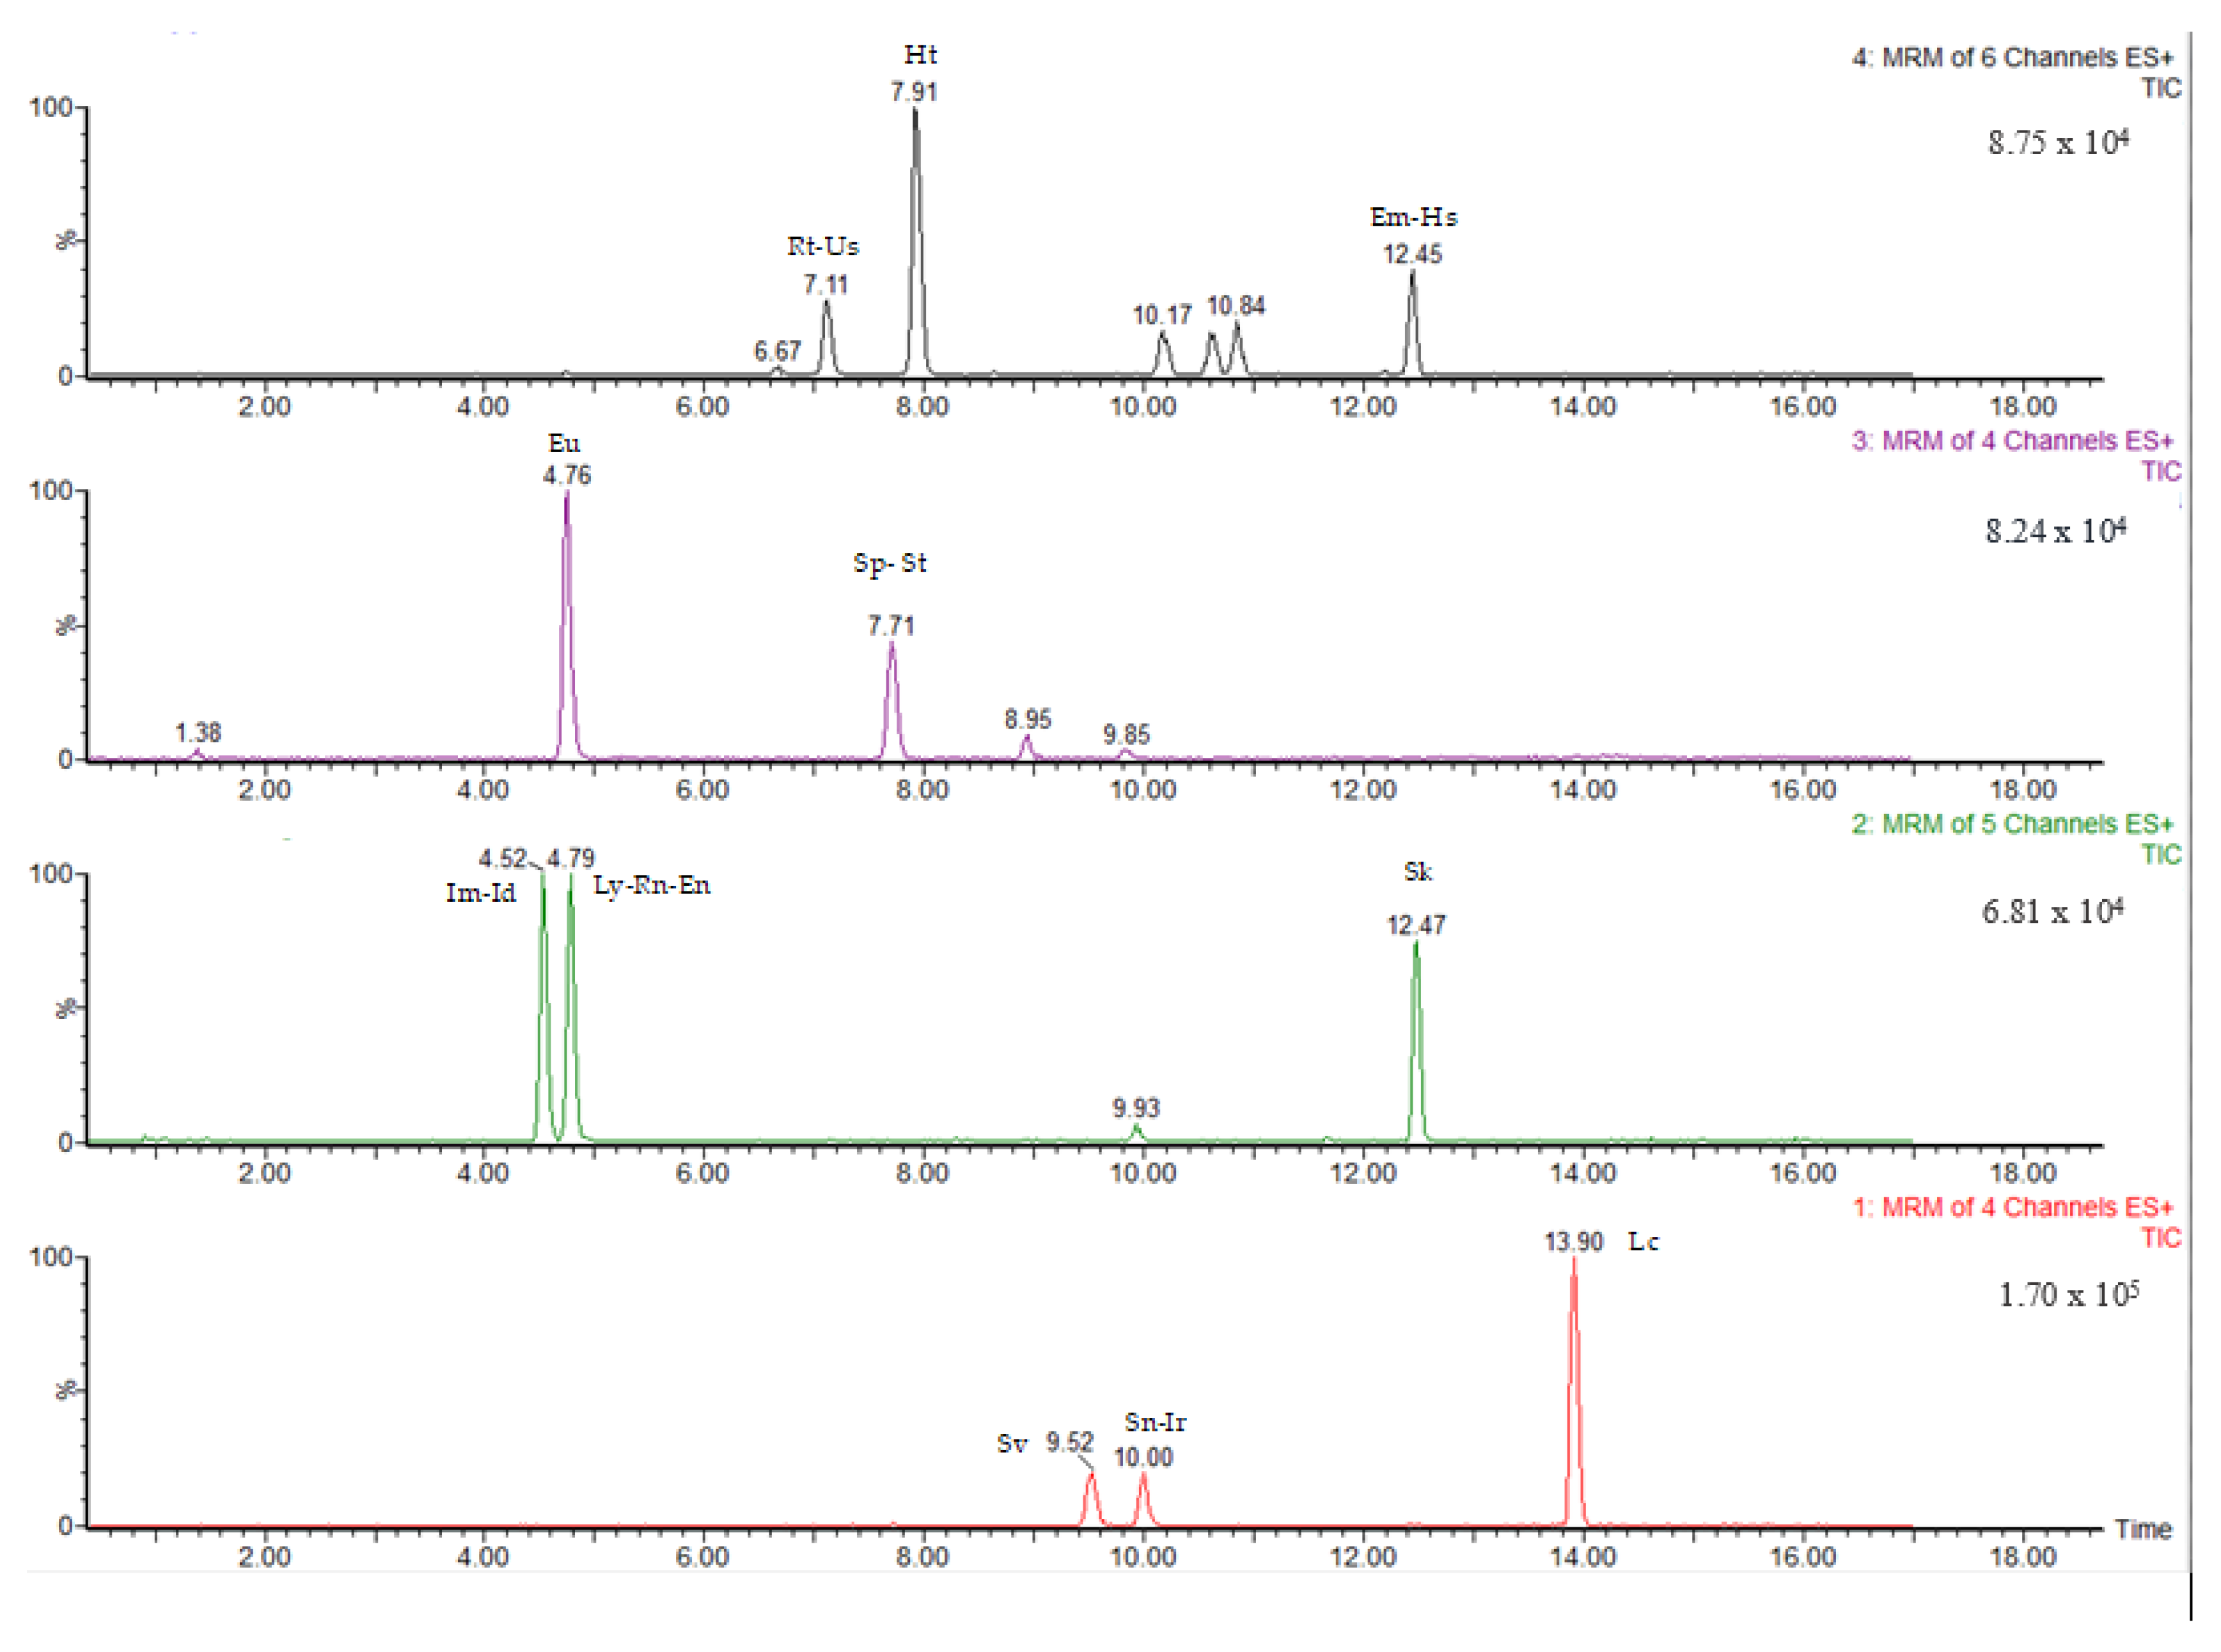
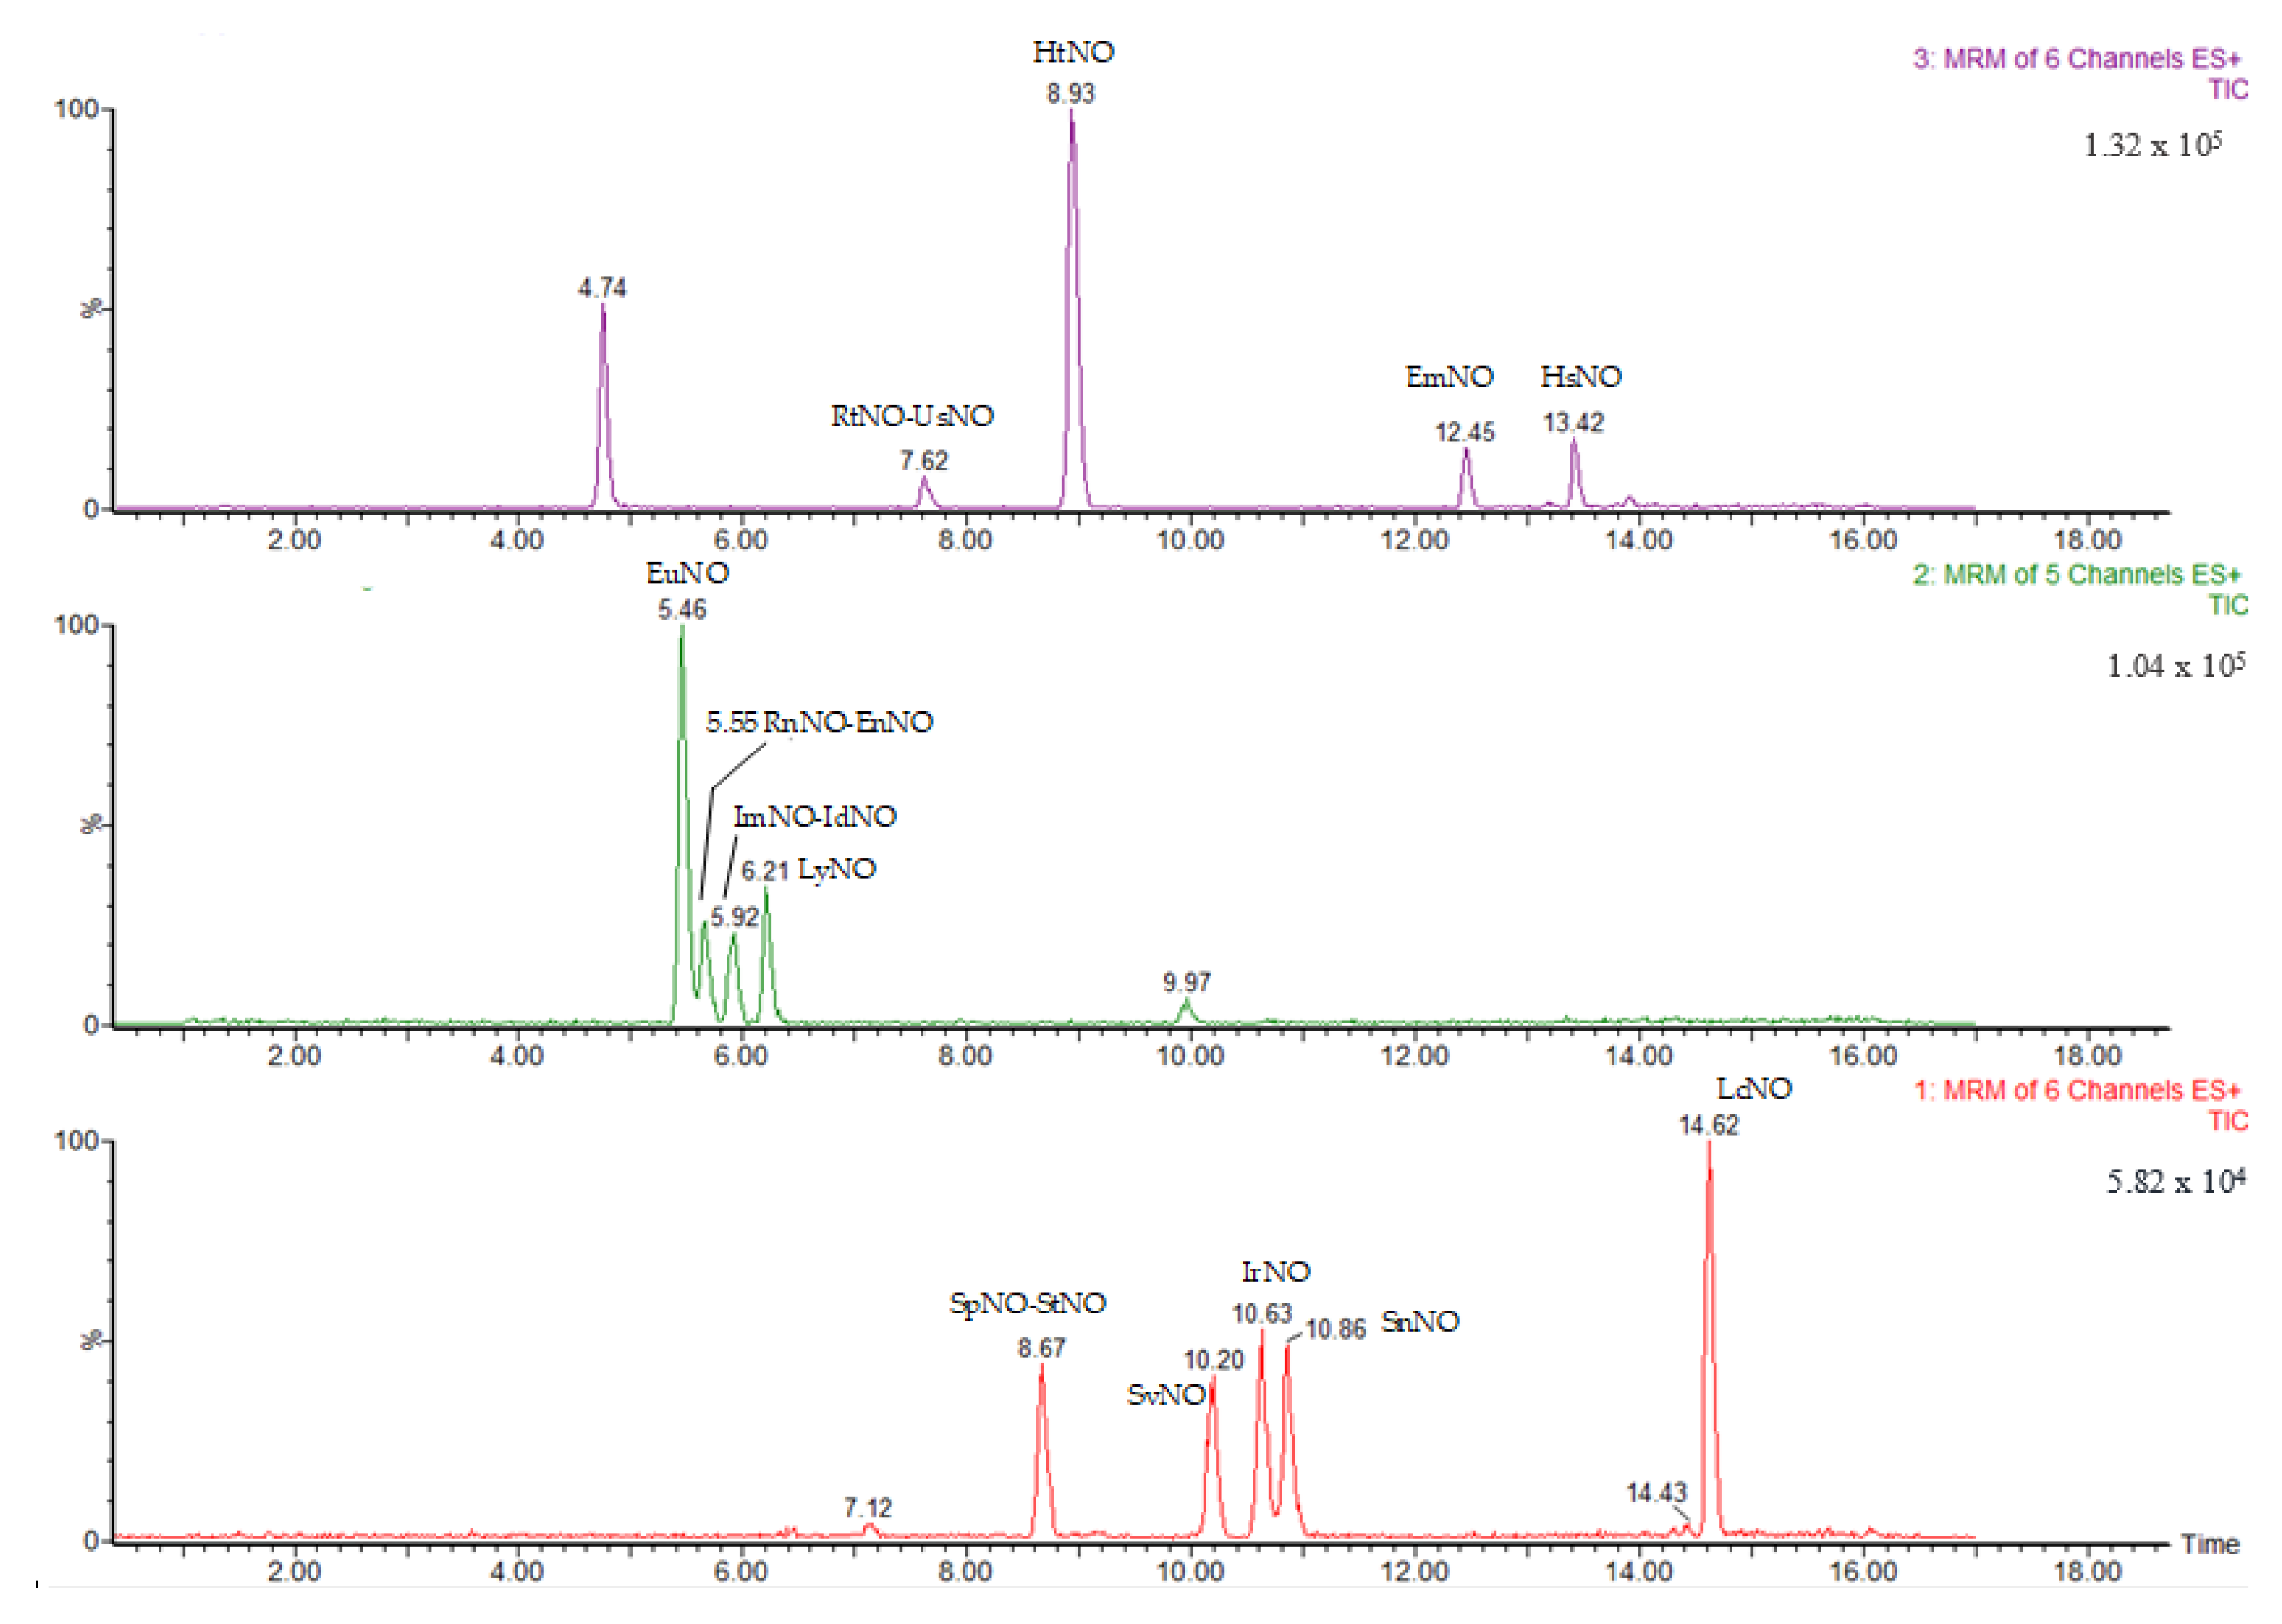
3.1. LC-MS/MS Method Validation

Pyrrolizidine alkaloids (n = 18) and their related PANOs (n = 17) were detected and quantified. In the validation phase, the possible coelution of alkaloid isomers was assessed and the following co-elutions were found according to Commission Regulation (EU) 2020/2040: lycopsamine/indicine, renderine/echinatine, intermedine-N-oxide/indicine-N-oxide, senecivernine/integerrimine, echimidine/heliosupine, seneciphylline/spartioidine, seneciphylline-N-oxide/spartioidine-N-oxide, retrosine/usaramine and retrosine-N-oxide/usaramine-N-oxide. In chromatograms of blank honey extracts no significant interfering peaks were detected at the retention time of all 35 PAs/PANOs. The method exhibited linearity for PA concentrations in the 1 to 50 µg/kg range; R squared (R2) was ≥ 0.99 for all the PAs in honey. In accordance with the EURL-MP guidance document for plant toxin performance criteria [35], a recovery range of 70–120%, a relative standard deviation (RSDr %) of repeatability ≤ 20% and an RSDR% of within laboratory reproducibility ≤ 25% were required. The experimental values of all the substances are reported in Table 4 and all the performance criteria were met. Therefore, the method can be considered fit for purpose. The limit of quantification (LOQ) for all PAs and PANOs was 1 µg/kg.

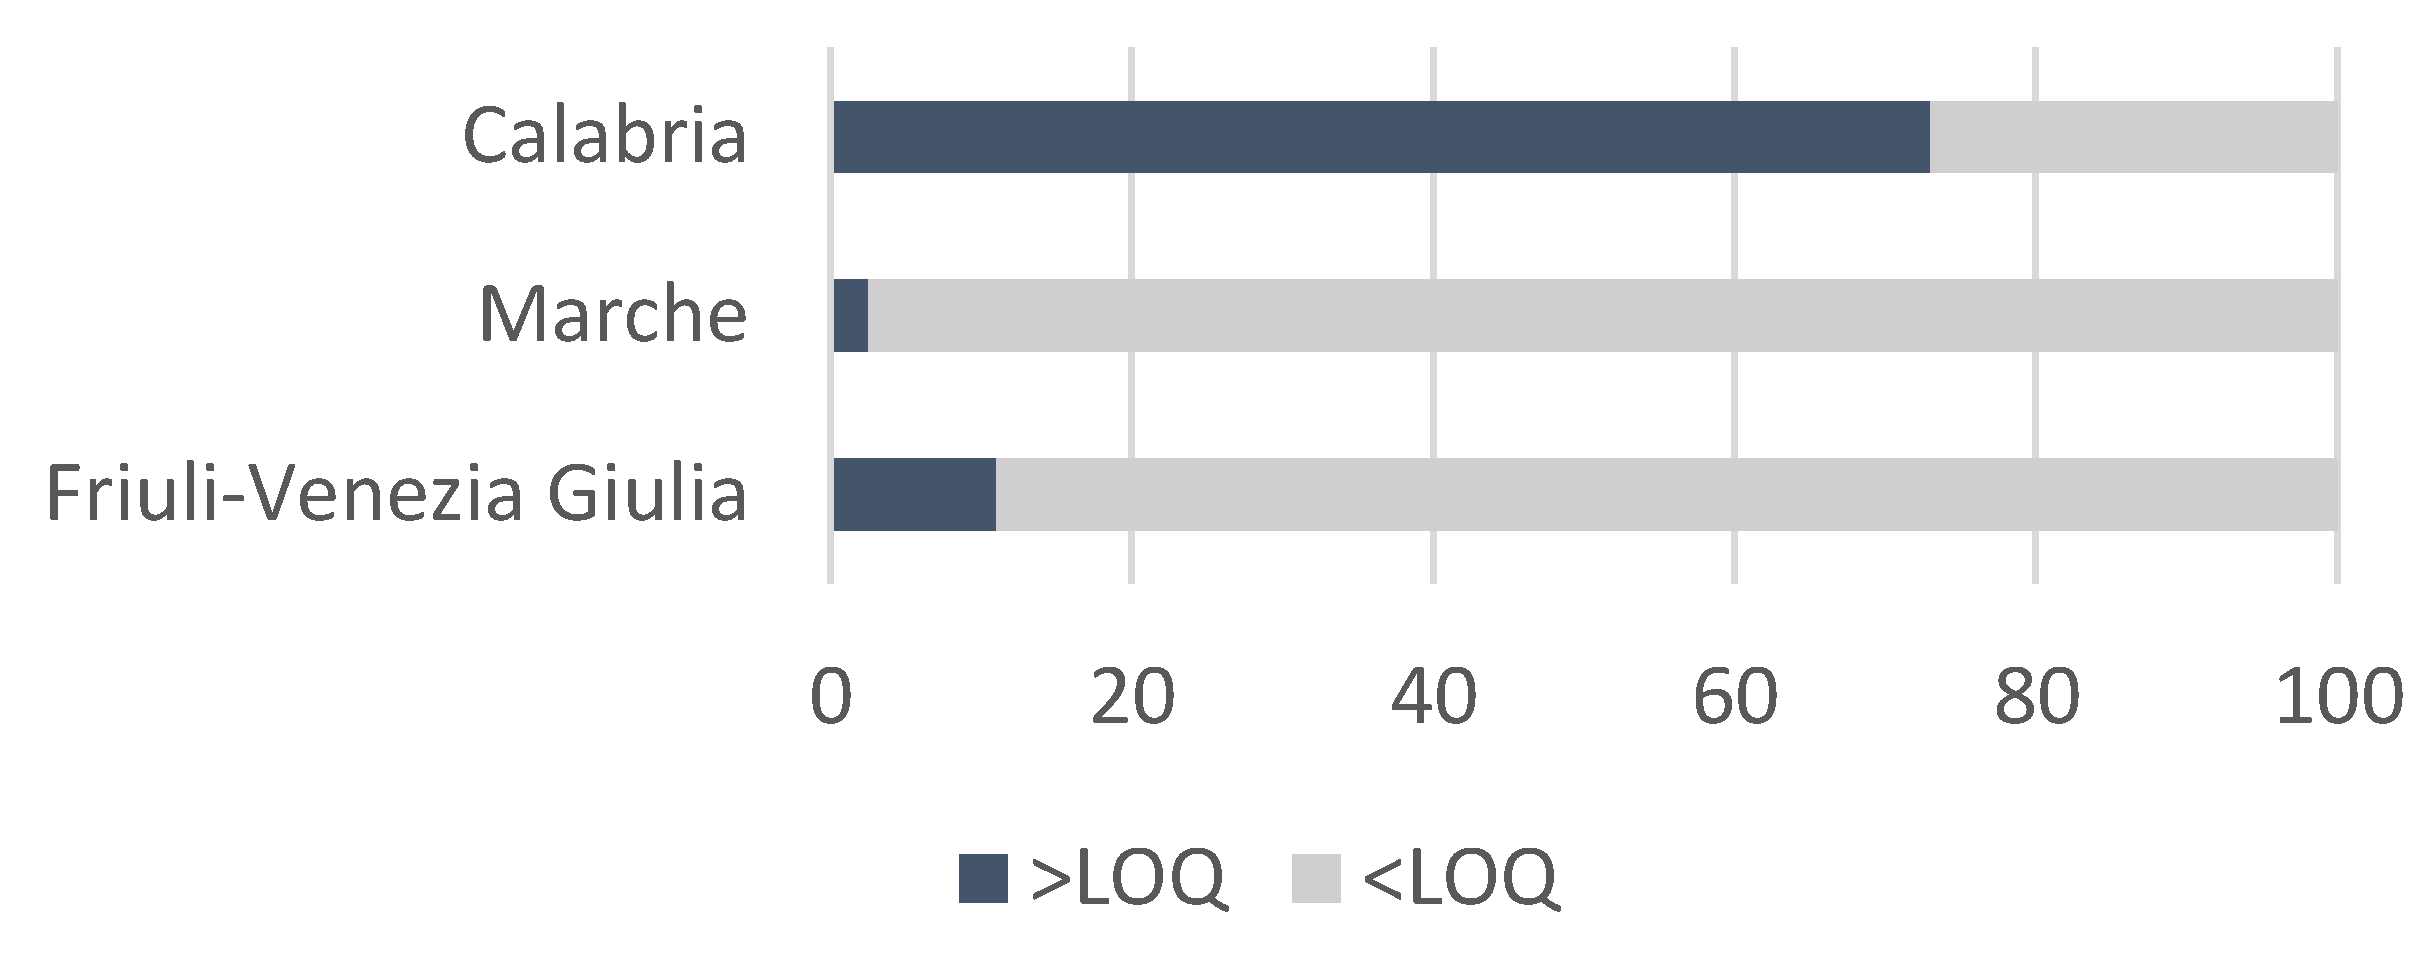
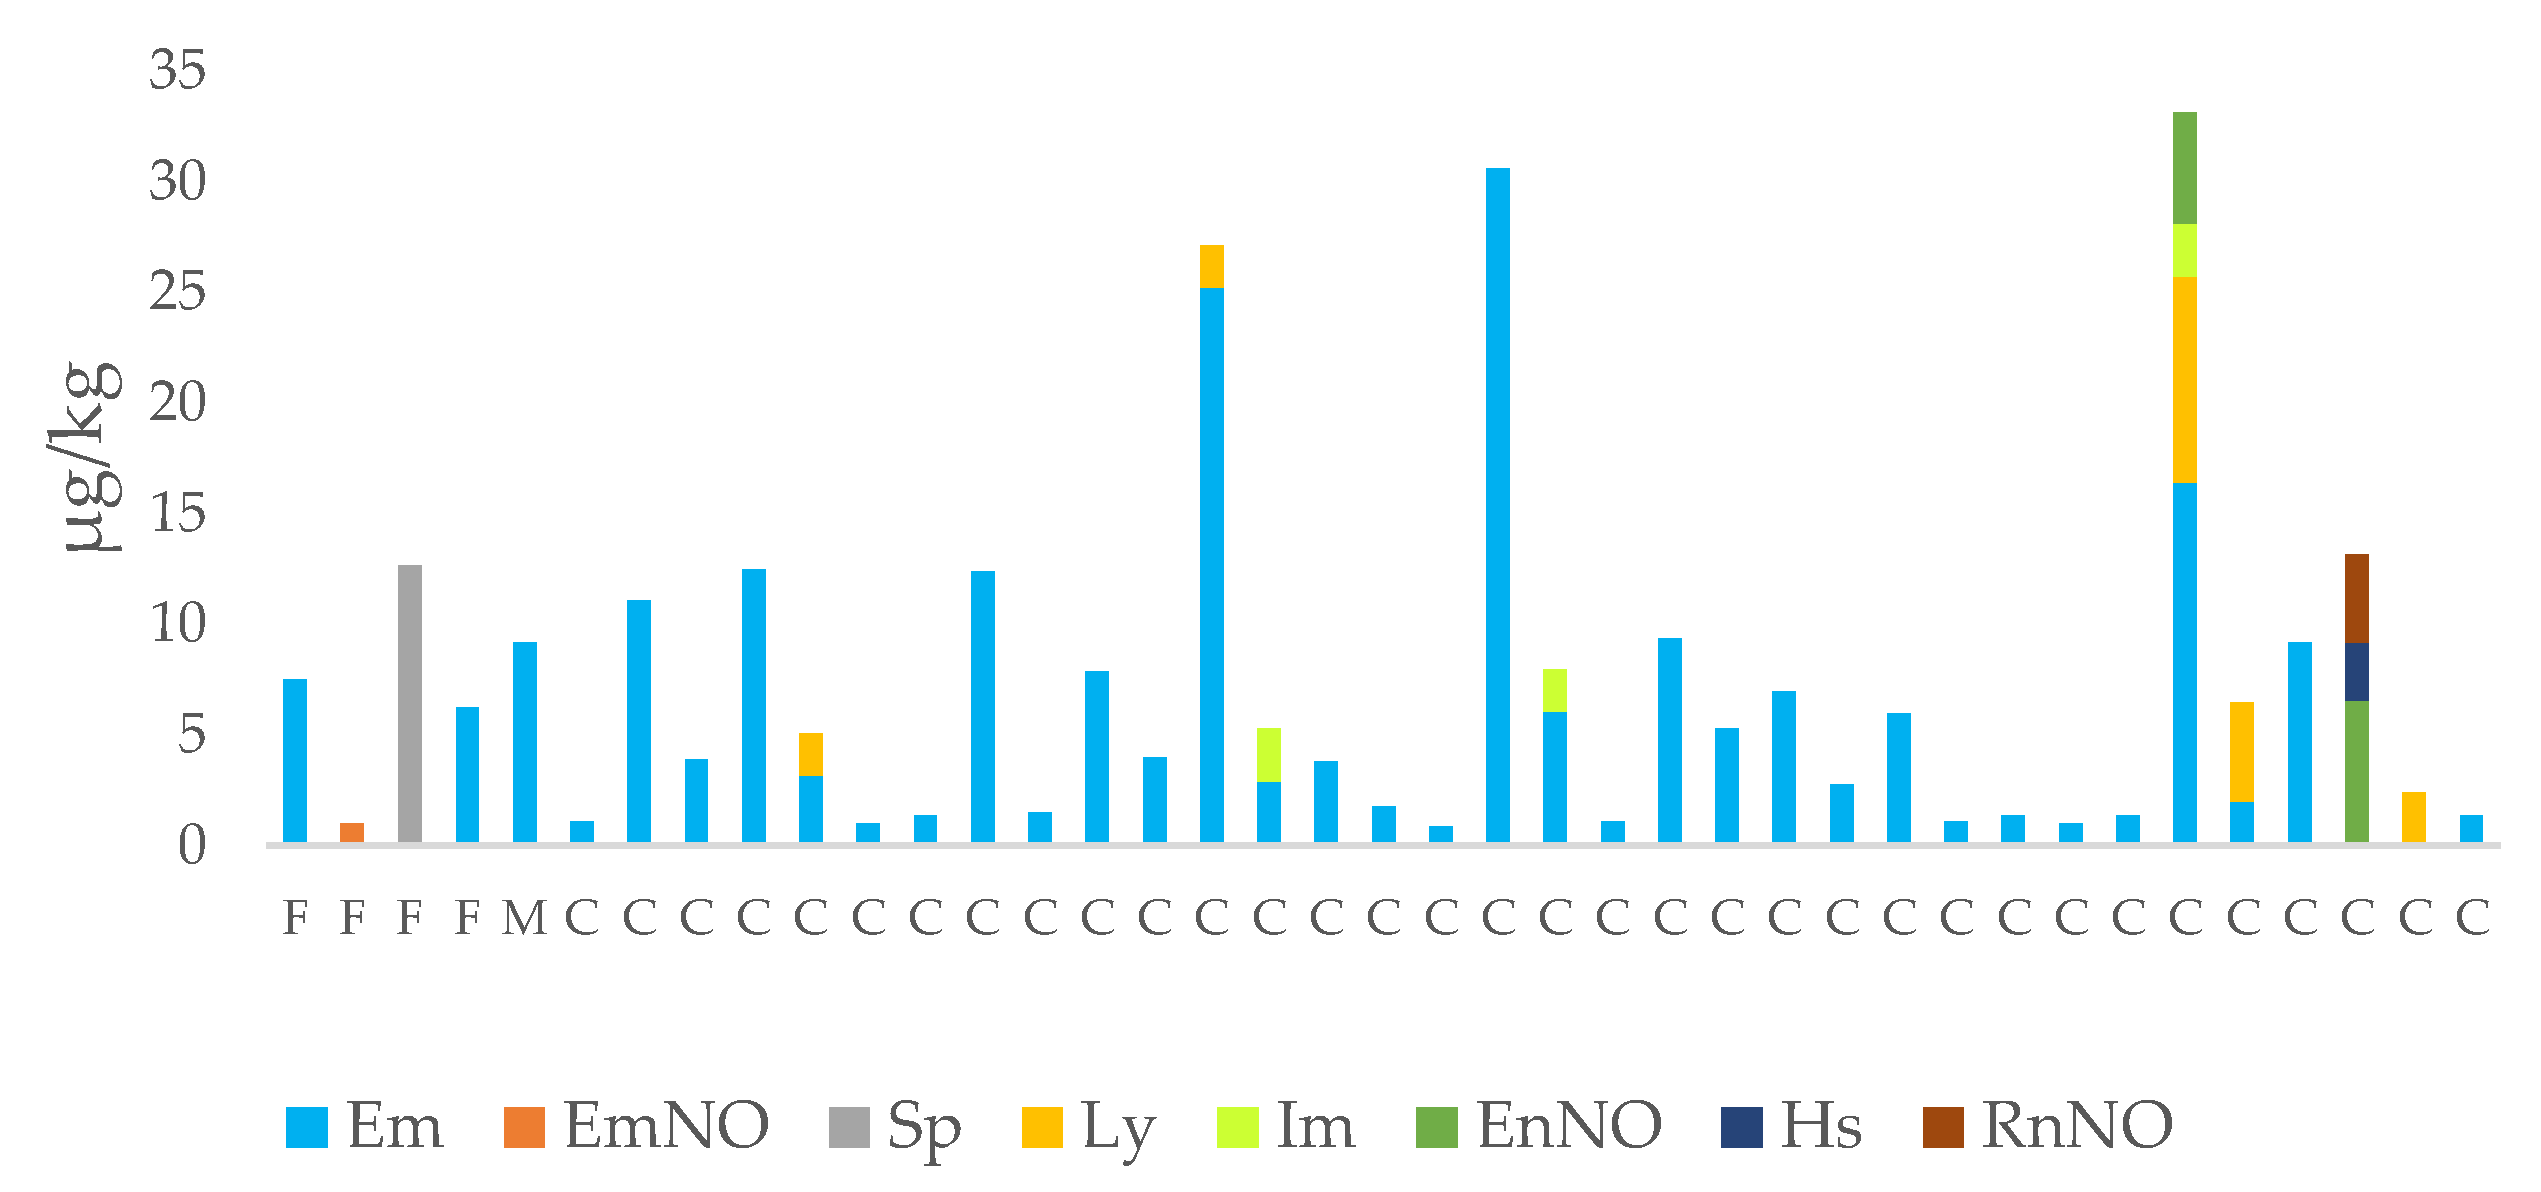
3.2. PA/PANO Content in Honey Samples

The method was used to determine 35 PAs in 121 honey samples from three different Italian regions. The samples were analyzed in six analytical sessions and a quality control (QC) sample was evaluated simultaneously, having a recovery in the 70–120% range. The percentage of PA-positive samples is reported in Figure 3. Figure 4 shows the compounds detected in the honey samples and their sum when more than one PA was present while, in Figure 5, the mean content of the PAs is reported.
Of the 37 honey samples analyzed from Friuli-Venezia Giulia, PAs were found in concentrations above the LOQ in only 4 multifloral samples (11%). The predominant PAs found in three samples (8%) were echimidine (mean ± SD 4.94 ± 3.47 µg/kg) followed by seneciphylline in one sample (3%, 12.7 µg/kg) while in the Marche only one sample of monofloral honey from Stachys officinalis contained echimidine above the LOQ (9.2 µg/kg) (Figure 6). S. officinalis can be considered a typical crop of the Marche. It belongs to the family of Lamiaceae and does not belong to one of the major PA-producing families; therefore, the presence of an echimidine content above the LOQ was probably due to pollen contamination by the PA-producing plant species, as confirmed by melissopalynological analysis. Thirty-three samples from Calabria contained PAs above the LOQ. In particular, all 9 multifloral samples were contaminated, while 24 samples of the 36 monofloral honey samples were contaminated. The predominant PAs were echimidine (31 samples) followed by lycopsamine (5 samples), intermedine (3 samples), echinatine N-oxide (2 samples), rinderine N-oxide (1 sample) and heliosupine N-oxide (1 sample) (Figure 4).
Overall, the total content of PAs ranged from 0.9 µg/kg in a chestnut honey from Calabria to 33.1 µg/kg in a multifloral sample from the same region (Figure 4). The mean content (±SD) of the PAs detected was 7.11 ± 8.25 µg/kg, of the same order of magnitude, albeit higher, than the mean value of 4.7 ± 11.1 µg/kg reported by Lucatello et al. (2021) for honey samples from local producers in the Veneto [22].
Of the 35 PAs analyzed, 8 showed values higher than the LOQ (Figure 5). The most abundant and most variable PA was echimidine, detected in 35 samples (27%) with a mean content (±SD) of 6.28 ± 6.76 µg/kg, followed by lycopsamine, detected in 5 samples (4%), intermedine in 3 samples (2.5%), echinatine N-oxide in 2 samples (1.7%) and finally seneciphylline, echimidine N-oxide, rinderine N-oxide and heliosupine N-oxide detected in 1 sample each (0.8%). One sample from Calabria contained four different PAs: echimidine, lycopsamine, intermedine and echinatine N-oxide. In particular, echimidine, lycopsamine and intermedine were the most prevalent PAs. This finding was in agreement with previous publications [36,37,38,39,40,41,42]. Table 5 summarizes the PA/PANO data present in the scientific literature.
Pollen composition was investigated in order to understand the origin of PAs in the most contaminated Calabria honey and in the Stachys officinalis honey sample from the Marche. Melissopalynological analysis revealed the presence of pollen from the genus belonging to the Boraginaceae family: Echium, Cerinthe and Cynoglossum. Echimidine is a typical alkaloid of the genus Echium, in particular of Echium plantagineum, a plant widespread throughout Italy (Portal to the Flora of Italy, https://dryades.units.it/floritaly/index.php?procedure=taxon_page&tipo=all&id=4297 (accessed on 7 February 2023)). The elevated levels of echimidine and its N-oxide derivative, which were higher than the LOQ in the honey from all three regions, could be explained by the notable presence of this species in Italy. Lycopsamine is another alkaloid that was present in the samples, although in lower quantities. This alkaloid is produced by a number of plants, including Echium vulgaris, belonging to the Boraginaceae family and widespread in Italy (Portal to the Flora of Italy, https://dryades.units.it/floritaly/index.php?procedure=taxon_page&tipo=all&id=4297 (accessed on 7 February 2023)).
The results obtained in the present study regarding Italian honey were consistent with the results published by other authors who have reported the concentration of PAs in European honey. A study of 40 samples of Polish multifloral honey collected directly from beekeepers showed an alkaloid content ranging from 1.0 to 20.2 μg/kg, with an average content of 2.9 μg/kg. In the same study, the analysis of 14 honey samples of Asian origin showed a much higher content of PAs [43]. In a more recent study [44], the PA content in the Polish honey ranged from 2.2 to 31.6 μg/kg while the total PA content monitored in foreign honey ranged from 5.8 to 147.0 μg/kg.
Bodi et al. (2014) published the results of PA content in honey sampled from German and Austrian beekeepers. These samples showed a significantly lower rate of positive samples than those bought at the supermarket and from other sources. The mean total PA content ranged from 6.1 μg/kg of honey in beekeeper samples to 14 μg/kg in discount products and 15 μg/kg in branded honey [45]. Dübecke et al. (2011) observed substantial differences in the quantity of PAs found in honey depending on the country of origin. The mean concentration of PAs in 381 European honey samples was 17 μg/kg, including negative samples [37]. These data were very similar to the present data. Honey from Germany, Bulgaria and Romania showed lower levels of PAs (1–43 μg/kg) than honey from Italy and Spain (concentrations up to 225 μg/kg) as honey from these regions often contained an elevated number of Echium pollen grains (18 PAs and N-oxides monitored) [46].
Martinello et al. (2014) reported a higher content of PAs (nine monitored alkaloids) in honey samples that were blends of EU and non-EU honey for which the mean content determined was 17.5 μg/kg. The mean PA content in the EU honey was 3.1 μg/kg [41]. All the results reported, however, could have been underestimated due to the limited number of PAs monitored.
Honey samples produced in Belgium were less contaminated and presented a different contamination profile; PAs were found in 67% of the samples examined, with maximum and average concentrations of 60.53 μg/kg and 1.20 μg/kg, respectively. The majority of samples (49%) contained from 0.05 to 0.99 μg/kg of contaminants [47].
The analysis of 103 Spanish honey samples (Echium spp. honey) showed the presence of PAs in 97 samples with a content ranging from 1 to 237 μg/kg. The mean PA concentration of the PA-positive samples was 48 ± 55.5 μg/kg. The PA pattern was clearly dominated by echimidine, lycopsamine and their N-oxides, which accounted for 97.8% of the total ΣPA, while seneciphyilline and heliothrine N-oxide were detected at a much lower incidence [42].

3.3. Variables Affecting the Content of PAs/PANOs in Honey Samples

Qualitative variables: a significant, albeit moderate (Cramér’s V = 0.483), association (p = 1.56 × 10⁻¹³) was detected between the presence/absence of PAs and the specific region using the Chi-square test. In Calabria, 73% of the samples were found to contain PAs.
Quantitative variables: significant differences among honey types were detected within the same region. In the Marche, the sum of the PAs and echimidine were significantly higher in Stachys honey (p = 7.53 × 10−06), while in honey samples from Friuli-Venezia Giulia no significant differences were recorded. A more complex pattern was evidenced in honey from Calabria due to the presence of a high percentage of samples having a PA content > the LOQ; this made multiple comparisons among the different types of honey possible. In particular, the multifloral honey samples showed a significantly higher content of echimidine (10.28 ± 10.69 µg/kg) than citrus fruit honey (1.7 ± 1.25 µg/kg) (p = 0.0261) (Figure 7) and a significantly higher content of intermedine than the acacia honey (p = 0.0253). Finally, one monofloral Sulla honey from the province of Catanzaro was characterized by the exclusive presence of N-oxide derivatives of three PAs, echinatine, rinderine and heliosupine, which were not present in any other honey sample (Figure 4).

3.4. Exposure Assessment and Health Risk Characterization

Data entries on the RACE spreadsheet are summarized in Table 6 while the outcomes of the calculation are reported in Table 7 and Table 8 for acute and chronic exposure to PAs, respectively.
For acute exposure assessment, all values were well below the ARfD. On the other hand, for chronic assessment the RACE tool calculated a MoE lower than 10,000 (i.e., mean 7302, median 7876) for toddler consumers. The number of observations (< 60) was not sufficient for an accurate MoE calculation for the 95th percentile output for toddlers, both as consumers and as total population. However, these values were below the 10,000 threshold (3759 and 4654, respectively). This means that the daily consumption of elevated quantities of honey containing PAs at the highest concentration detected could probably pose a health risk for toddlers and children. Unfortunately, the RACE tool does not give specific information regarding food consumption; however, looking at the Italian food consumption survey, which is the RACE reference for Italy, it can be seen that means of 16.6 g/day for the total population and 19.6 g/day for consumers are data referring to the category “sugar, fructose, honey and other nutritious sweeteners”. For consumers of large quantities, these values can double [32]. Furthermore, this survey is quite outdated as it was carried out in 2005–2006 and consumption habits have changed over time.
The health concerns for toddlers and children, who are frequent consumers of large quantities of honey, were also highlighted by the 2011 EFSA opinion regarding PAs [12]; however, it should be noted that a previous BMDL10 of 70 µg/kg bw was used for the risk characterization while the mean occurrence in honey could be considered in line with the highest findings of the authors. The exposure assessment and risk characterization were carried out according to the worst-case scenario, having used a single occurrence datum of the PAs detected in a single sample. In order to better understand whether there is a real risk associated with the consumption of honey, additional PA monitoring should be carried out. The margins of exposure for all other population groups were greater than 10,000, signifying a negligible risk for those age groups.

4. Conclusions

This study, along with others carried out in different countries, could be very useful for both Food Safety Authorities and beekeepers in identifying, classifying and creating a map of the distribution of geographical areas at risk for the presence of PA-producing flora. In addition, health authorities need to develop better traceability of the origin of honey, together with the integration of data on nomadism practices, so that geographic areas at risk for the presence of PA-containing plants may easily be identified. This identification could be very useful in improving the safety and quality of honey.
While a sum of 33.1 µg PAs/kg has been associated with negligible health risks related to the consumption of honey, chronic exposure assessment and risk characterization have highlighted a potential health concern only for toddlers who frequently consume elevated quantities of honey. This finding could be influenced by uncertainties deriving from real honey consumption habits and a “worst-case” PA occurrence. In order to better characterize the risk, additional monitoring studies regarding PAs should be implemented. It is worth pointing out that the ingestion of honey could be associated with infant botulism as honey is a dietary reservoir of Clostridium botulinum spores [48]. This possibility is well known to pediatricians who should not recommend honey-containing supplements or the use of honey as a flavoring agent for infants, in particular those younger than 12 months [48,49].
Despite the possible health risks for specific population subgroups, honey is a very rich food, possessing health and therapeutic properties that vary, similarly to its aroma, depending on the flowers from which the bees have extracted the nectar. In addition to glucose and fructose, honey contains polyphenols, flavonoids, alkaloids, glycosides and volatile compounds with proven antioxidant, anti-microbial and anti-inflammatory effects and with potential neuroprotective effects [50,51,52,53].

Author Contributions

Conceptualization, E.C. and P.R.; methodology, E.C.; software, T.D.; validation, E.C. and M.P.; formal analysis, M.P.; investigation, E.C., M.P. and S.B.; resources, S.B.; data curation, S.B. and T.D.; writing—original draft preparation, G.I. and M.P.; writing—review and editing, G.I., E.C., M.P., S.B. and P.R.; visualization, G.I.; supervision, E.C., S.B. and P.R.; project administration, E.C. and P.R.; funding acquisition, E.C. All authors have read and agreed to the published version of the manuscript.

Funding

This research received no external funding.

Institutional Review Board Statement

Not applicable.

Informed Consent Statement

Not applicable.

Data Availability Statement

Not applicable.

Conflicts of Interest

The authors declare no conflict of interest.

References

  1. Moreira, R.; Pereira, D.; Valentão, P.; Andrade, P. Pyrrolizidine Alkaloids: Chemistry, Pharmacology, Toxicology and Food Safety. Int. J. Mol. Sci. 2018, 19, 1668. [Google Scholar] [CrossRef] [PubMed] [Green Version]
  2. Ebmeyer, J.; Braeuning, A.; Glatt, H.; These, A.; Hessel-Pras, S.; Lampen, A. Human CYP3A4-Mediated Toxification of the Pyrrolizidine Alkaloid Lasiocarpine. Food Chem. Toxicol. 2019, 130, 79–88. [Google Scholar] [CrossRef] [PubMed]
  3. Stegemann, T.; Kruse, L.H.; Brütt, M.; Ober, D. Specific Distribution of Pyrrolizidine Alkaloids in Floral Parts of Comfrey (Symphytum officinale) and Its Implications for Flower Ecology. J. Chem. Ecol. 2019, 45, 128–135. [Google Scholar] [CrossRef] [PubMed]
  4. Brugnerotto, P.; Seraglio, S.K.T.; Schulz, M.; Gonzaga, L.V.; Fett, R.; Costa, A.C.O. Pyrrolizidine Alkaloids and Beehive Products: A Review. Food Chem. 2021, 342, 128384. [Google Scholar] [CrossRef]
  5. Casado, N.; Morante-Zarcero, S.; Sierra, I. The Concerning Food Safety Issue of Pyrrolizidine Alkaloids: An Overview. Trends Food Sci. Technol. 2022, 120, 123–139. [Google Scholar] [CrossRef]
  6. Chen, L.; Zhang, Q.; Yi, Z.; Chen, Y.; Xiao, W.; Su, D.; Shi, W. Risk Assessment of (Herbal) Teas Containing Pyrrolizidine Alkaloids (PAs) Based on Margin of Exposure Approach and Relative Potency (REP) Factors. Foods 2022, 11, 2946. [Google Scholar] [CrossRef]
  7. Dusemund, B.; Nowak, N.; Sommerfeld, C.; Lindtner, O.; Schäfer, B.; Lampen, A. Risk Assessment of Pyrrolizidine Alkaloids in Food of Plant and Animal Origin. Food Chem. Toxicol. 2018, 115, 63–72. [Google Scholar] [CrossRef]
  8. Habs, M.; Binder, K.; Krauss, S.; Müller, K.; Ernst, B.; Valentini, L.; Koller, M. A Balanced Risk–Benefit Analysis to Determine Human Risks Associated with Pyrrolizidine Alkaloids (PA)—The Case of Tea and Herbal Infusions. Nutrients 2017, 9, 717. [Google Scholar] [CrossRef] [Green Version]
  9. Edgar, J.A.; Colegate, S.M.; Boppré, M.; Molyneux, R.J. Pyrrolizidine Alkaloids in Food: A Spectrum of Potential Health Consequences. Food Addit. Contam. Part A 2011, 28, 308–324. [Google Scholar] [CrossRef]
  10. Hama, J.R.; Strobel, B.W. Pyrrolizidine Alkaloids Quantified in Soil and Water Using UPLC-MS/MS. RSC Adv. 2019, 9, 30350–30357. [Google Scholar] [CrossRef] [Green Version]
  11. Hama, J.R.; Strobel, B.W. Occurrence of Pyrrolizidine Alkaloids in Ragwort Plants, Soils and Surface Waters at the Field Scale in Grassland. Sci. Total Environ. 2021, 755, 142822. [Google Scholar] [CrossRef]
  12. EFSA Panel on Contaminants in the Food Chain (CONTAM). Scientific Opinion on Pyrrolizidine Alkaloids in Food and Feed. EFSA J. 2011, 9, 2406. [Google Scholar] [CrossRef]
  13. EFSA Panel on Contaminants in the Food Chain (CONTAM); Knutsen, H.K.; Alexander, J.; Barregård, L.; Bignami, M.; Brüschweiler, B.; Ceccatelli, S.; Cottrill, B.; Dinovi, M.; Edler, L.; et al. Risks for Human Health Related to the Presence of Pyrrolizidine Alkaloids in Honey, Tea, Herbal Infusions and Food Supplements. EFSA J. 2017, 15, e04908. [Google Scholar] [CrossRef] [Green Version]
  14. Ruan, J.; Yang, M.; Fu, P.; Ye, Y.; Lin, G. Metabolic Activation of Pyrrolizidine Alkaloids: Insights into the Structural and Enzymatic Basis. Chem. Res. Toxicol. 2014, 27, 1030–1039. [Google Scholar] [CrossRef]
  15. Xia, Q.; He, X.; Shi, Q.; Lin, G.; Fu, P.P. Quantitation of DNA Reactive Pyrrolic Metabolites of Senecionine—A Carcinogenic Pyrrolizidine Alkaloid by LC/MS/MS Analysis. J. Food Drug Anal. 2020, 28, 167–174. [Google Scholar] [CrossRef] [Green Version]
  16. Xu, J.; Wang, W.; Yang, X.; Xiong, A.; Yang, L.; Wang, Z. Pyrrolizidine Alkaloids: An Update on Their Metabolism and Hepatotoxicity Mechanism. Liver Res. 2019, 3, 176–184. [Google Scholar] [CrossRef]
  17. Kakar, F.; Akbarian, Z.; Leslie, T.; Mustafa, M.L.; Watson, J.; van Egmond, H.P.; Omar, M.F.; Mofleh, J. An Outbreak of Hepatic Veno-Occlusive Disease in Western Afghanistan Associated with Exposure to Wheat Flour Contaminated with Pyrrolizidine Alkaloids. J. Toxicol. 2010, 2010, 313280. [Google Scholar] [CrossRef] [Green Version]
  18. IARC (International Agency for Research on Cancer). IARC Monographs on the Evaluation of Carcinogenic Risks to Humans, 1st ed.; World Health Organization: Lyon, France, 1987; ISBN 978-92-832-1411-3. [Google Scholar]
  19. IARC (International Agency for Research on Cancer). Some Traditional Herbal Medicines, Some Mycotoxins, Naphthalene and Styrene. In IARC Monographs on the Evaluation of Carcinogenic Risks to Humans; IARC: Lyon, France, 2002; ISBN 978-92-832-1282-9. [Google Scholar]
  20. European Commission. Commission Regulation (EU) 2020/2040 of 11 December 2020 amending Regulation (EC) No 1881/2006 as regards maximum levels of pyrrolizidine alkaloids in certain foodstuffs. Off. J. Eur. Union 2020, 1–5. [Google Scholar]
  21. Alvarado-Avila, L.Y.; Moguel-Ordóñez, Y.B.; García-Figueroa, C.; Ramírez-Ramírez, F.J.; Arechavaleta-Velasco, M.E. Presencia de Alcaloides Pirrolizidínicos En Miel y Los Efectos de Su Consumo En Humanos y Abejas. Revisión. Rev. Mex. Cienc. Pecu. 2022, 13, 787–802. [Google Scholar] [CrossRef]
  22. Lucatello, L.; Merlanti, R.; De Jesus Inacio, L.; Bisutti, V.; Montanucci, L.; Capolongo, F. Pyrrolizidine Alkaloid Concentrations in Local Italian and Retail Honeys of Different Origin: A Scenario of Human Exposure. J. Food Compos. Anal. 2021, 104, 104182. [Google Scholar] [CrossRef]
  23. Griffin, C.T.; Danaher, M.; Elliott, C.T.; Glenn Kennedy, D.; Furey, A. Detection of Pyrrolizidine Alkaloids in Commercial Honey Using Liquid Chromatography–Ion Trap Mass Spectrometry. Food Chem. 2013, 136, 1577–1583. [Google Scholar] [CrossRef] [PubMed]
  24. Von Der Ohe, W.; Persano Oddo, L.; Piana, M.L.; Morlot, M.; Martin, P. Harmonized Methods of Melissopalynology. Apidologie 2004, 35, S18–S25. [Google Scholar] [CrossRef]
  25. Bundesinstitut für Risikobewertung. Determination of Pyrrolizidine Alkaloids (PA) in Honey by SPE-LC-MS/MS Method Protocol BfR-PA-Honey-1.0/2013; Bundesinstitut für Risikobewertung: Berlin, Germany, 2013; pp. 1–17. [Google Scholar]
  26. EURL-MP-Method_002 (Version 2) Determination of Pyrrolizidine Alkaloids in Plant-Based Food and Feed Materials, Including (Herbal) Teas, Herbal Food Supplements, Fodder and Feedstuffs by LC-MS/MS; RIKILT Wageningen University & Research: Wageningen, The Netherlands, 2019; pp. 1–26.
  27. European Commissions. Commission Regulation (EC) No 401/2006 of 23 February 2006 Laying down the Methods of Sampling and Analysis for the Official Control of the Levels of Mycotoxins in Foodstuffs. Off. J. Eur. Union. 2006, 12–34. [Google Scholar]
  28. European Commission. Health and Food Safety Directorate-General (DG SANTE). Guidance Document on Identification of Mycotoxin in Food and Feed. SANTE/12089/2016; European Commission DG SANTE: Bruxelles, Belgium, 2016. [Google Scholar]
  29. Mascha, E.J.; Vetter, T.R. Significance, Errors, Power, and Sample Size: The Blocking and Tackling of Statistics. Anesth. Analg. 2018, 126, 691–698. [Google Scholar] [CrossRef] [PubMed]
  30. Cramér, H. The Two-Dimensional Case. In Mathematical Methods of Statistics; Princeton University Press: Princeton, NJ, USA, 1946; p. 282. ISBN 0-691-08004-6. [Google Scholar]
  31. Fürst, P.; Milana, M.R.; Pfaff, K.; Tlustos, C.; Vleminckx, C.; Arcella, D.; Barthélémy, E.; Colombo, P.; Goumperis, T.; Pasinato, L.; et al. Risk Evaluation of Chemical Contaminants in Food in the Context of RASFF Notifications. EFSA Support. Publ. 2019, 16, 1625E. [Google Scholar] [CrossRef]
  32. Leclercq, C.; Arcella, D.; Piccinelli, R.; Sette, S.; Le Donne, C.; Turrini, A.; INRAN-SCAI 2005–06 Study Group. The Italian National Food Consumption Survey INRAN-SCAI 2005–06: Main Results in Terms of Food Consumption. Public Health Nutr. 2009, 12, 2504–2532. [Google Scholar] [CrossRef] [Green Version]
  33. FAO-WHO. Pesticide residues in food. In Proceedings of the Joint Meeting of the FAO Panel of Experts on Pesticide Residues in Food and the Environment and the WHO Core Assessment Group on Pesticide Residues, Rome, Italy, 20–29 September 2004. [Google Scholar]
  34. Dakeishi, M.; Murata, K.; Tamura, A.; Iwata, T. Relation Between Benchmark Dose and No-Observed-Adverse-Effect Level in Clinical Research: Effects of Daily Alcohol Intake on Blood Pressure in Japanese Salesmen. Risk Anal. 2006, 26, 115–123. [Google Scholar] [CrossRef] [Green Version]
  35. European Union Reference Laboratory (EURL). EURLMP-Background doc_003 Guidance Document Performance Criteria v1.1 draft of 17 September 2021. Available online: https://www.wur.nl/en/research-results/research-institutes/food-safety-research/reference-laboratory/european-union-reference-laboratory/eurl-mycotoxins-plant-toxins/library-eurl-mp.htm (accessed on 16 January 2023).
  36. Cao, X.; Deng, W.; Fu, M.; Zhu, Y.; Liu, H.; Wang, L.; Zeng, J.; Wei, Y.; Xu, X.; Yu, J. Seventy-Two-Hour Release Formulation of the Poorly Soluble Drug Silybin Based on Porous Silica Nanoparticles: In Vitro Release Kinetics and In Vitro/In Vivo Correlations in Beagle Dogs. Eur. J. Pharm. Sci. 2013, 48, 64–71. [Google Scholar] [CrossRef]
  37. Dübecke, A.; Beckh, G.; Lüllmann, C. Pyrrolizidine Alkaloids in Honey and Bee Pollen. Food Addit. Contam. Part A 2011, 28, 348–358. [Google Scholar] [CrossRef]
  38. Griffin, C.T.; O’Mahony, J.; Danaher, M.; Furey, A. Liquid Chromatography Tandem Mass Spectrometry Detection of Targeted Pyrrolizidine Alkaloids in Honeys Purchased within Ireland. Food Anal. Methods 2015, 8, 18–31. [Google Scholar] [CrossRef]
  39. Huybrechts, B.; Callebaut, A. Pyrrolizidine Alkaloids in Food and Feed on the Belgian Market. Food Addit. Contam. Part A 2015, 32, 1939–1951. [Google Scholar] [CrossRef]
  40. Kempf, M.; Wittig, M.; Schönfeld, K.; Cramer, L.; Schreier, P.; Beuerle, T. Pyrrolizidine Alkaloids in Food: Downstream Contamination in the Food Chain Caused by Honey and Pollen. Food Addit. Contam. Part A 2011, 28, 325–331. [Google Scholar] [CrossRef] [Green Version]
  41. Martinello, M.; Cristofoli, C.; Gallina, A.; Mutinelli, F. Easy and Rapid Method for the Quantitative Determination of Pyrrolizidine Alkaloids in Honey by Ultra Performance Liquid Chromatography-Mass Spectrometry: An Evaluation in Commercial Honey. Food Control 2014, 37, 146–152. [Google Scholar] [CrossRef]
  42. Orantes-Bermejo, F.J.; Serra Bonvehí, J.; Gómez-Pajuelo, A.; Megías, M.; Torres, C. Pyrrolizidine Alkaloids: Their Occurrence in Spanish Honey Collected from Purple Viper’s Bugloss (Echium spp.). Food Addit. Contam. Part A 2013, 30, 1799–1806. [Google Scholar] [CrossRef]
  43. Kowalczyk, E.; Sieradzki, Z.; Kwiatek, K. Determination of Pyrrolizidine Alkaloids in Honey with Sensitive Gas Chromatography-Mass Spectrometry Method. Food Anal. Methods 2018, 11, 1345–1355. [Google Scholar] [CrossRef] [Green Version]
  44. Kowalczyk, E.; Kwiatek, K. Simultaneous Determination of Pyrrolizidine and Tropane Alkaloids in Honey by Liquid Chromatography–Mass Spectrometry. J. Vet. Res. 2022, 66, 235–243. [Google Scholar] [CrossRef]
  45. Bodi, D.; Ronczka, S.; Gottschalk, C.; Behr, N.; Skibba, A.; Wagner, M.; Lahrssen-Wiederholt, M.; Preiss-Weigert, A.; These, A. Determination of Pyrrolizidine Alkaloids in Tea, Herbal Drugs and Honey. Food Addit. Contam. Part A 2014, 31, 1886–1895. [Google Scholar] [CrossRef]
  46. Kast, C.; Dübecke, A.; Kilchenmann, V.; Bieri, K.; Böhlen, M.; Zoller, O.; Beckh, G.; Lüllmann, C. Analysis of Swiss Honeys for Pyrrolizidine Alkaloids. J. Apic. Res. 2014, 53, 75–83. [Google Scholar] [CrossRef]
  47. Picron, J.-F.; Herman, M.; Van Hoeck, E.; Goscinny, S. Monitoring of Pyrrolizidine Alkaloids in Beehive Products and Derivatives on the Belgian Market. Environ. Sci. Pollut. Res. 2020, 27, 5693–5708. [Google Scholar] [CrossRef]
  48. Abdulla, C.O.; Ayubi, A.; Zulfiquer, F.; Santhanam, G.; Ahmed, M.A.S.; Deeb, J. Infant Botulism Following Honey Ingestion. Case Rep. 2012, 2012, bcr1120115153. [Google Scholar] [CrossRef] [Green Version]
  49. Tanzi, M.G.; Gabay, M.P. Association Between Honey Consumption and Infant Botulism. Pharmacotherapy 2002, 22, 1479–1483. [Google Scholar] [CrossRef] [PubMed]
  50. Vică, M.L.; Glevitzky, M.; Dumitrel, G.-A.; Bostan, R.; Matei, H.V.; Kartalska, Y.; Popa, M. Qualitative Characterization and Antifungal Activity of Romanian Honey and Propolis. Antibiotics 2022, 11, 1552. [Google Scholar] [CrossRef] [PubMed]
  51. Fratianni, F.; Amato, G.; d’Acierno, A.; Ombra, M.N.; De Feo, V.; Coppola, R.; Nazzaro, F. In Vitro Prospective Healthy and Nutritional Benefits of Different Citrus Monofloral Honeys. Sci. Rep. 2023, 13, 1088. [Google Scholar] [CrossRef] [PubMed]
  52. Hossain, M.L.; Lim, L.Y.; Hammer, K.; Hettiarachchi, D.; Locher, C. A Review of Commonly Used Methodologies for Assessing the Antibacterial Activity of Honey and Honey Products. Antibiotics 2022, 11, 975. [Google Scholar] [CrossRef]
  53. Zulkifli, N.A.; Hassan, Z.; Mustafa, M.Z.; Azman, W.N.W.; Hadie, S.N.H.; Ghani, N.; Mat Zin, A.A. The Potential Neuroprotective Effects of Stingless Bee Honey. Front. Aging Neurosci. 2023, 14, 1048028. [Google Scholar] [CrossRef]
Figure 1. Chromatogram of a standard mixture of PAs at 5 ng/mL concentration.
Ijerph 20 05410 g001
Figure 2. Chromatogram of a standard mixture of PANOs at 5 ng/mL concentration.
Ijerph 20 05410 g002
Figure 3. The percentage of honey samples with PA content >LOQ and <LOQ is reported to highlight the differences among regions.
Ijerph 20 05410 g003
Figure 4. Pyrrolizidine alkaloids (PAs) in honey samples from different Italian regions (F = Friuli-Venezia Giulia; M = Marche; C = Calabria). Data expressed in µg/kg, Em = echimidine; EmNO = echimidine N-oxide; Sp = seneciphylline; Ly = lycopsamine; Im = intermedine; EnNO = echinatine N-oxide; Hs = heliosupine; RnNO = rinderine N-oxide.
Ijerph 20 05410 g004
Figure 5. Mean content of pyrrolizidine alkaloids (PAs) in honey samples from Friuli-Venezia Giulia, Marche and Calabria Italian regions. Data are expressed in µg/kg and reported as mean ± SD, with the exception of EmNO, Sp, Hs and RnNO, which were found in only one sample. Em = echimidine (n = 35); EmNO = echimidine N-oxide (n = 1); Sp = seneciphylline (n = 1); Ly = lycopsamine (n = 5); Im = intermedine (n = 3); EnNO = echinatine n-oxide (n = 2); Hs = heliosupine (n = 1); RnNO = rinderine n-oxide (n = 1).
Ijerph 20 05410 g005
Figure 6. Chromatograms of echimidine (9.2 µg/kg) present in a Stachys officinalis honey sample.
Ijerph 20 05410 g006
Figure 7. Mean content of echimidine in samples from Calabria region. Data are expressed in µg/kg and reported as mean ± SD.
Ijerph 20 05410 g007
Table 1. Botanical characteristics and origin of honey samples.
Honey TypesOrigin
Multifloral, Winter heath, Common whitebeam, Dandelion, Acacia, Chestnut and LindenUdine (Friuli-Venezia Giulia)
Multifloral, Rapeseed, Linden, Acacia, Bastard Indigobush and ChestnutPordenone (Friuli-Venezia Giulia)
Multifloral and Mahaleb CherryTrieste (Friuli-Venezia Giulia)
Multifloral, Sunflower, Rapeseed, Honeydew, Mustard, Clover and BetonyAncona (Marche)
Multifloral, Chestnut and AcaciaFermo (Marche)
Multifloral and SunflowerMacerata (Marche)
Multifloral, Chestnut, Honeydew and AcaciaAscoli Piceno (Marche)
Multifloral, Acacia, Sulla, Citrus Fruits and ChestnutVibo Valentia (Calabria)
Acacia, Citrus Fruits and ChestnutCosenza (Calabria)
Multifloral, Acacia, Sulla, Citrus Fruits, Eucalyptus and ChestnutCatanzaro (Calabria)
Chestnut and Winter heathCrotone (Calabria)
Acacia and Citrus FruitsReggio Calabria (Calabria)
Table 2. Botanical origin of monofloral honey samples.
Monofloral Honey TypesTotal Samples
Acacia or robinia (Robinia pseudoacacia)25
Chestnut (Castanea sativa)15
Sunflower (Heliantus annuus L.)14
Citrus fruits7
Linden (Tilia L.)6
Rapeseed (Brassica napus)4
Honeydew3
Winter heath (Erica carnea)2
Sulla (Sulla coronaria)2
Eucalyptus (E. camaldulensis, E. occidentalis)2
Mustard (Sinapis arvensis)1
Clover (Trifolium pratense)1
Betony (Stachys officinalis)1
Common whitebeam (Sorbus aria)1
Bastard indigobush (Amorpha fruticosa)1
Dandelion (Taraxacum officinale)1
Mahaleb cherry (Prunus mahaleb)1
Table 3. The LC-MS/MS parameters for PAs and PANOs (CE: collision energy, Q: Quantifier ion, q: qualifier ion).
Pyrrolizidine AlkaloidsMH+CEm/zQ, q
Sn-group336.225
25
120.2
138.0
Q
q
Ly-group299.720
25
138.0
156.0
Q
q
Ht314.120
25
138.0
156.0
Q
q
Eu33020
15
138.0
156.0
Q
q
Sk366.130
25
122.0
167.9
Q
q
ErN366.135
25
94.1
119.1
Q
q
LyN-group316.125
25
172.0
138.0
Q
q
HtN330.225
25
172.0
111.0
Q
q
EuN346.225
20
172.0
328.1
Q
q
Lc412.125
18
120.1
220.0
Q
q
Sp-group33425
25
120.1
138.0
Q
q
Em-group398.620
15
119.9
220.4
Q
q
Rt-group352.125
25
120.0
138.3
Q
q
SnN-group352.125
30
94.0
118.0
Q
q
LcN428.130
25
254.0
94.0
Q
q
SpN-group350.130
25
94.0
120.0
Q
q
EmN-group414.230
25
254.0
220.0
Q
q
RtN-group368.330
20
94.0
120.0
Q
q
Table 4. Validation parameters for all 35 PAs and PANOs (RSDr: repeatability, RSDR: within-laboratory reproducibility).
AnalyteConc (µg/kg)Recovery %RSDrRSDR
Em-Hs194.513.5314.81
1085.313.2123.08
2576.94.526.28
EmN182.910.7911.63
1075.410.0410.75
2572.99.4111.21
Eu177.514.8317.97
1060.34.4718.61
2584.80.9623.87
EuN183.613.2415.28
1079.34.1816.96
2571.95.3310.58
Ht190.611.0612.52
1075.78.9114.42
2570.45.917.13
HtN191.311.4512.87
1080.64.485.16
2571.88.199.81
Im179.913.1720.19
1070.12.9519.46
2562.65.287.50
ImN174.30.6915.41
1071.17.129.81
2567.117.759.66
Lc193.77.0115.83
1084.311.6523.03
2576.24.817.64
LcN174.817.8620.46
1068.312.9613.77
2567.64.519.87
Ly, Id, En, Rn184.97.7220.84
1072.56.8124.21
2565.63.6413.70
LyN, IdN174.89.569.99
1068.35.548.86
2567.67.5211.24
Rt, Us175.811.3416.64
1071.57.8919.31
2564.77.287.63
RtN, UsN187.68.9221.43
1074.78.3610.56
2566.76.9511.48
Sp, St180.315.3119.67
1087.67.0123.97
2579.669.28
SpN, StN179.711.919.64
1070.26.5114.11
2565.26.4111.89
Sn, Ir196.410.3711.41
1084.96.4518.22
25815.185.87
SnN185.111.3713.61
1078.55.7212.22
2574.22.8812.05
Sv188.112.122.88
1071.98.3920.51
25724.620.16
SvN197.99.3810.21
1085.88.1411.68
2584.57.8310.81
Sk187.412.8518.87
107611.1117.55
2577.52.5816.36
EnN192.112.8520.56
1075.311.119.22
2561.92.5810.03
RnN176.114.4515.31
1070.55.8617.63
2568.98.3713.12
IrN188.46.7712.48
1081.64.287.22
2577.210.1313.36
HsN195.18.6410.21
1086.47.79.04
2587.73.4911.66
Table 5. Content of PAs/PANOs detected in honey in different studies. Maximum levels or, when possible, range or average values have been reported. The PAs/PANOs covered by this work are listed (n.i.: not investigated).
Kowalczyk
et al., 2022
Picron
et al., 2020
Martinello et al., 2017Lucatello et al., 2016Griffin et al., 2014Martinello et al., 2014Orantes-Bermejo
et al., 2013
This Research
PA/PANO (µg/kg)Polish Honey Foreign HoneyBelgian HoneyForeign HoneyRetail HoneyItalian Beekeepers Retail HoneyRetail HoneySpanish Honey by Beekeepers Italian Honey
Echimidine7.3120.05.918.840.4–3.30.3–1.0545.516936.9 ± 44.362371.0–30.6
Echinatinen.i.n.i.n.i.n.i.n.i.n.i.n.i.n.i.n.i.n.i.<LOQ
Europinen.i.n.i.0.009134.85n.i.n.i.n.i.n.i.n.i.n.i.<LOQ
Heliosupine n.i.n.i.n.i.n.i.n.i.n.i.n.i.n.i.n.i.n.i.LOQ-2.6
Heliotrine n.i.n.i.<LOQ39.44<LOQ<LOQ<LOQ<LOQn.i.n.i.<LOQ
Indicine n.i.n.i.n.i.n.i.n.i.n.i.n.i.n.i.n.i.n.i.<LOQ
Integerrimine n.i.n.i.n.i.n.i.n.i.n.i.n.i.n.i.n.i.n.i.<LOQ
Intermedine 9.223.3n.i.n.i.<LOQ<LOQn.i.31n.i.n.i.1.9–2.4
Lasiocarpine n.i.n.i.<LOQ5.77<LOQ<LOQn.i.<LOQn.i.n.i.<LOQ
Lycopsamine 14.122.5n.i.n.i.0.2–74.7<LOQ392.6425.7 ± 4.28181.9–9.3
Retrorsine 4.34.35.825.32<LOQ0.9–14.5<LOQ<LOQn.i.n.i.<LOQ
Rinderine n.i.n.i.n.i.n.i.n.i.n.i.n.i.n.i.n.i.n.i.<LOQ
Senecionine 2.22.79.671.46<LOQ0.8–2.18.4<LOQn.i.n.i.<LOQ
Seneciphylline 4.14.07.354.04<LOQ0.6–1.15.7<LOQ4.1 ± 4.7920LOQ-12.71
Senecivernine <LOQ3.04.150.41n.i.n.i.n.i.n.i.n.i.n.i.<LOQ
Senkirkine n.i.n.i.42.441.15<LOQ<LOQ<LOQ<LOQ<LOQ<LOQ<LOQ
Spartioidine n.i.n.i.n.i.n.i.n.i.n.i.n.i.n.i.n.i.n.i.<LOQ
Usaramine n.i.n.i.n.i.n.i.n.i.n.i.n.i.n.i.n.i.n.i.<LOQ
Echimidine-N-oxide n.i.n.i.8.240.17n.i.n.i.n.i.n.i.21.4 ± 23.0970LOQ-1.01
Echinatine-N-oxide n.i.n.i.n.i.n.i.n.i.n.i.n.i.n.i.n.i.n.i.5–6.6
Erucifoline-N-oxide n.i.n.i.0.090.14n.i.n.i.n.i.n.i.n.i.n.i.<LOQ
Europine-N-oxide n.i.n.i.0.541.30n.i.n.i.n.i.n.i.n.i.n.i.<LOQ
Heliosupine-N-oxide n.i.n.i.n.i.n.i.n.i.n.i.n.i.n.i.n.i.n.i.<LOQ
Heliotrine-N-oxide n.i.n.i.<LOQ0.37n.i.n.i.n.i.n.i.2.3 ± 0.584<LOQ
Indicine-N-oxiden.i.n.i.0.470.18n.i.n.i.n.i.n.i.n.i.n.i.<LOQ
Intermedine-N-oxiden.i.n.i.0.260.21n.i.n.i.n.i.n.i.n.i.n.i.<LOQ
Integerrimine-N-oxiden.i.n.i.n.i.n.i.n.i.n.i.n.i.n.i.n.i.n.i.<LOQ
Lycopsamine-N-oxiden.i.n.i.0.290.09n.i.n.i.n.i.n.i.4.0 ± 2.798<LOQ
Retrorsine-N-oxiden.i.n.i.0.860.90n.i.n.i.<LOQn.i.<LOQ<LOQ<LOQ
Rinderine-N-oxiden.i.n.i.n.i.n.i.n.i.n.i.n.i.n.i.n.i.n.i.LOQ-4
Senecionine-N-oxiden.i.n.i.0.540.26n.i.n.i.<LOQn.i.<LOQ<LOQ<LOQ
Seneciphylline-N-oxiden.i.n.i.0.160.28n.i.n.i.<LOQn.i.<LOQ<LOQ<LOQ
Senecivernine-N-oxiden.i.n.i.0.67<LOQn.i.n.i.n.i.n.i.n.i.n.i.<LOQ
Spartioidine-N-oxiden.i.n.i.n.i.n.i.n.i.n.i.n.i.n.i.n.i.n.i.<LOQ
Usaramine-N-oxide n.i.n.i.n.i.n.i.n.i.n.i.n.i.n.i.n.i.n.i.<LOQ
Table 6. Summary of RACE parameters for exposure assessment and risk characterization.
RACE Parameters
ContaminantPyrrolizidine alkaloids (sum of 1,2-unsaturated)
Food descriptionHoney
Analytical result33.1 µg/kg
Reference value acute (ARfD)2 mg/kg bw
Reference value chronic (BMDL10)237 µg/kg bw
Survey countryItaly [32]
Table 7. Summary of RACE outputs for acute health risk characterization.
Output (% ARfD)
Acute Consumers OnlyMeanMedian95th Percentile
Toddlers0.00220.00240.0047 1
Other children0.00120.00080.0024 1
Adolescents0.00070.00050.0016 1
Adults0.00050.00030.0011
Elderly0.00040.00030.0010
Very elderly0.00060.00050.0009 1
Acute whole populationMeanMedian95th percentile
Toddlers0.00023- 20.00236
Other children0.00008- 20.00072
Adolescents0.00001- 2-
Adults0.00003- 20.00018
Elderly0.00003- 20.00026
Very elderly0.00004- 20.00031
1 Number of observations lower than 60; the 95th percentile may not be statistically robust. 2 Values not given by the model.
Table 8. Summary of RACE outputs for chronic health risk characterization.
Output (MoE)
Chronic Consumers OnlyMeanMedian95th Percentile
Toddlers730378763759 1
Other children12,49615,7525783 1
Adolescents24,13424,70217,184 1
Adults36,74050,47612,411
Elderly44,50042,96120,764 1
Very elderly27,29431,1477279 1
Chronic whole populationMeanMedian95th percentile
Toddlers52,581- 24654
Other children141,868- 216,468
Adolescents851,578- 2- 2
Adults456,875- 262,293
Elderly391,059- 239,953
Very elderly327,532- 237,591
1 Number of observations lower than 60; the 95th percentile may not be statistically robust. 2 Values not given by the model.
Disclaimer/Publisher’s Note: The statements, opinions and data contained in all publications are solely those of the individual author(s) and contributor(s) and not of MDPI and/or the editor(s). MDPI and/or the editor(s) disclaim responsibility for any injury to people or property resulting from any ideas, methods, instructions or products referred to in the content.

