
Construction of a Musculoskeletal Discomfort Scale for the Lower Limbs of Workers: An Analysis Using the Multigroup Item Response Theory
 , ,
, ,
Abstract
:1. Introduction
2. Methods
2.1. Site and Sample Selection
2.2. Administration of the Research Instrument
2.3. Statistical Analysis
3. Results
3.1. Data and Statistical Analysis
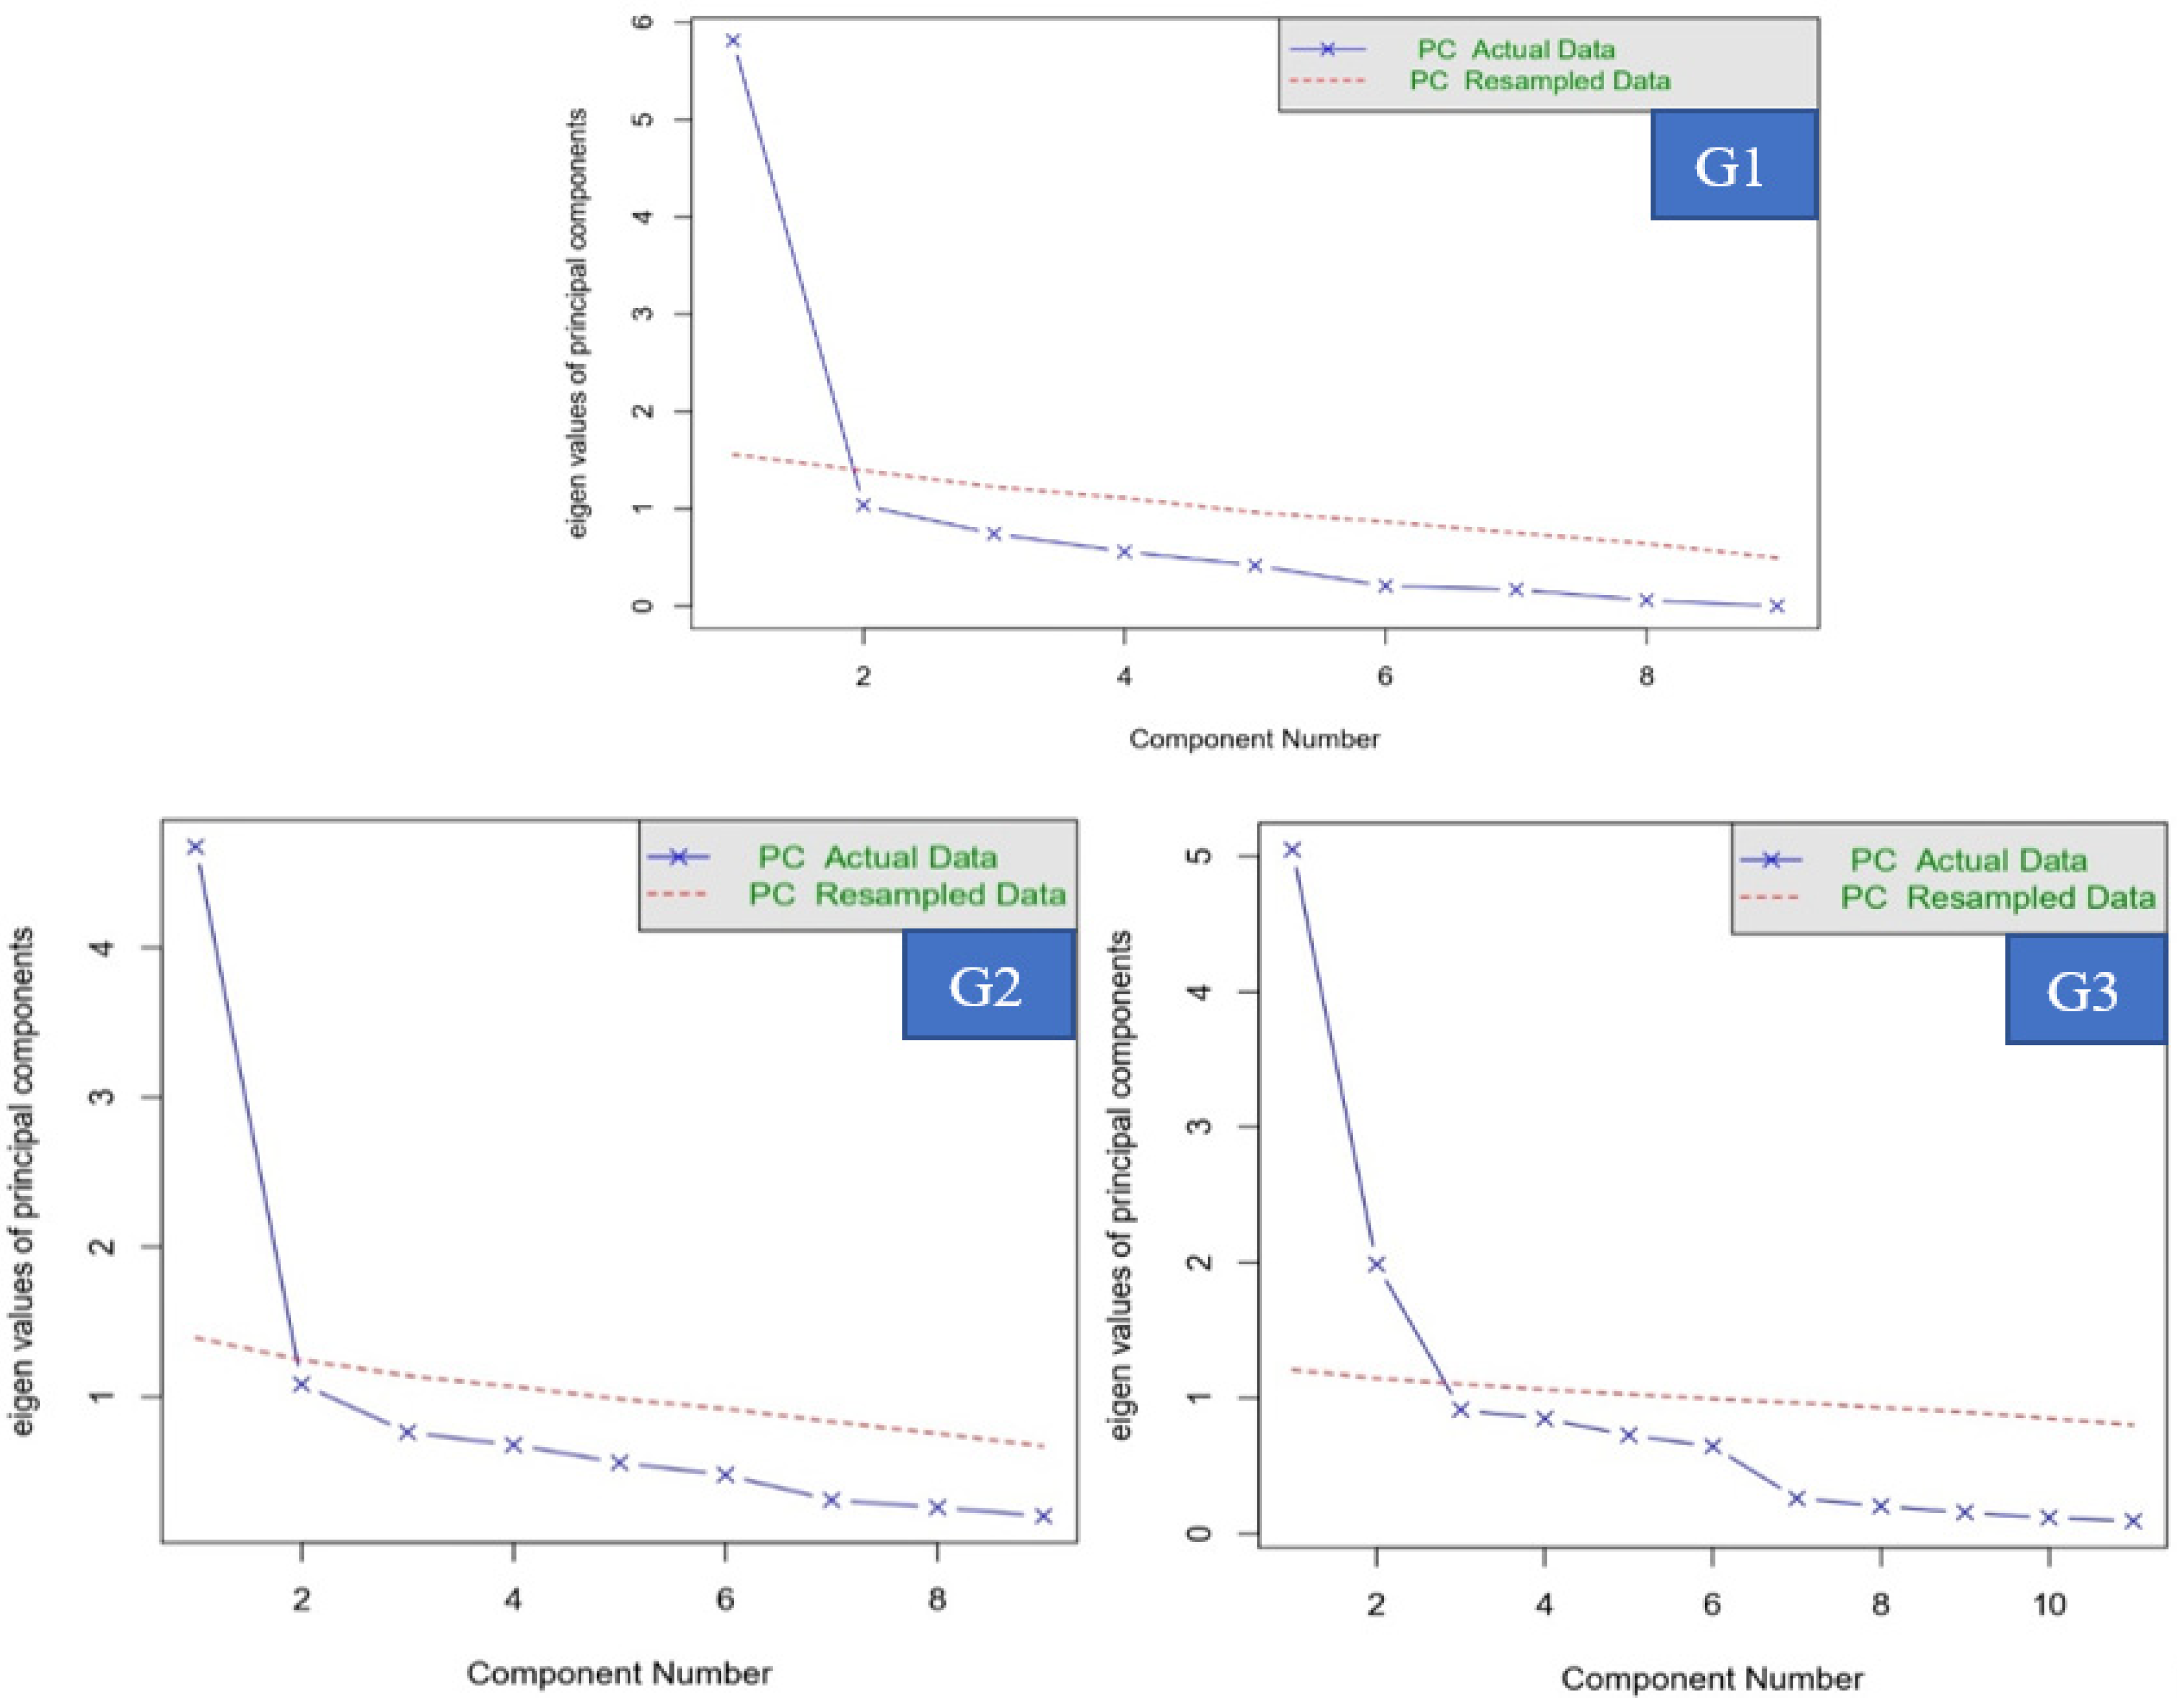
3.2. Dimensionality and Item Parameter Estimation
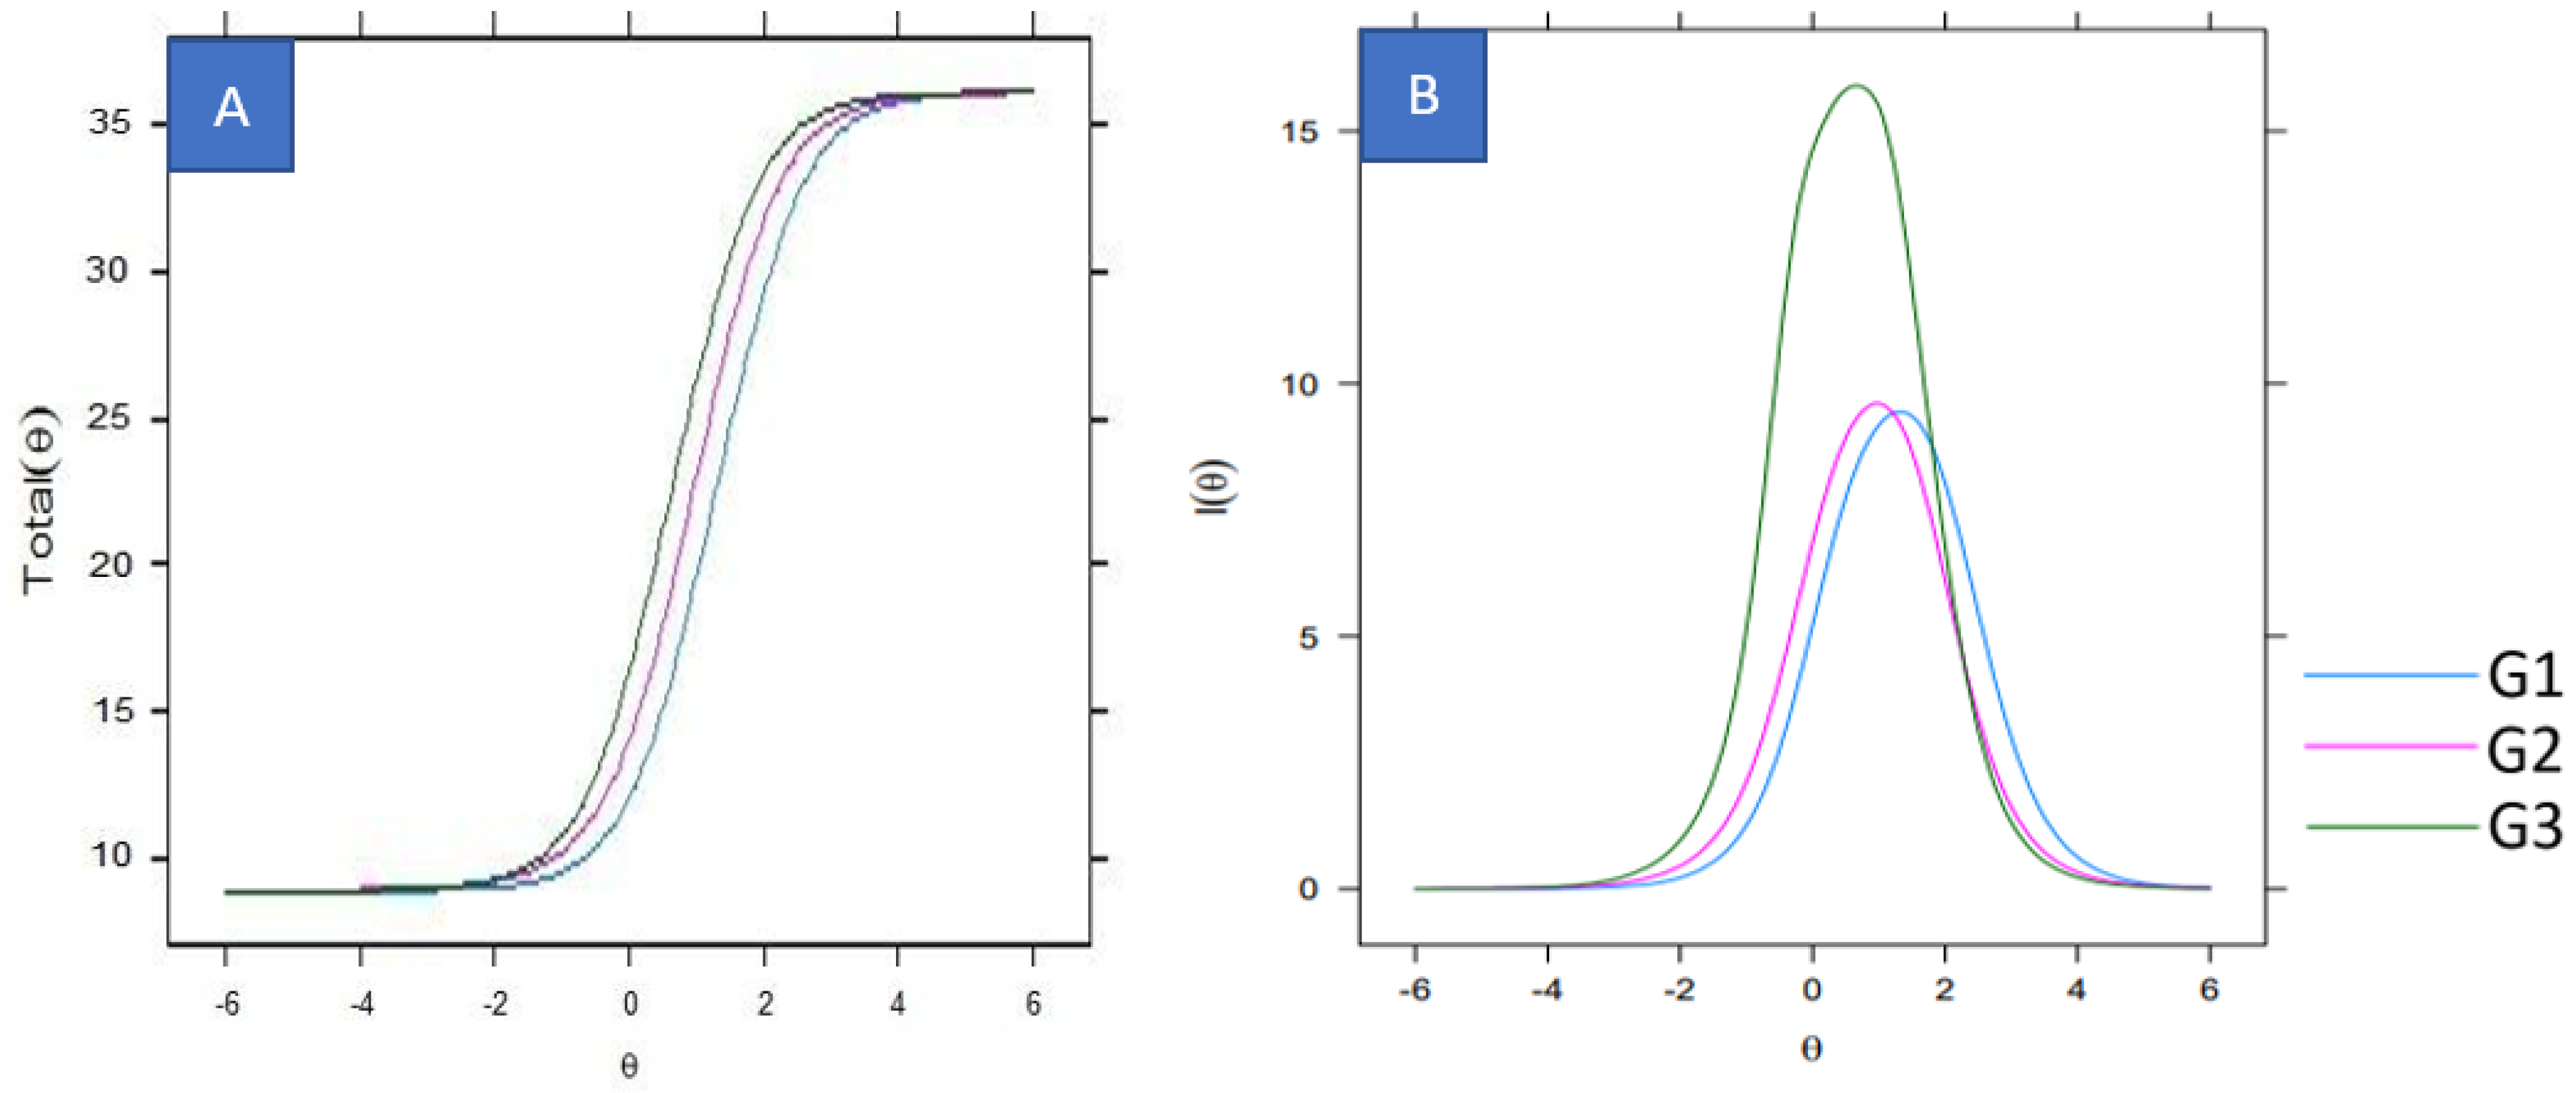
3.3. Instrument and Information Tests
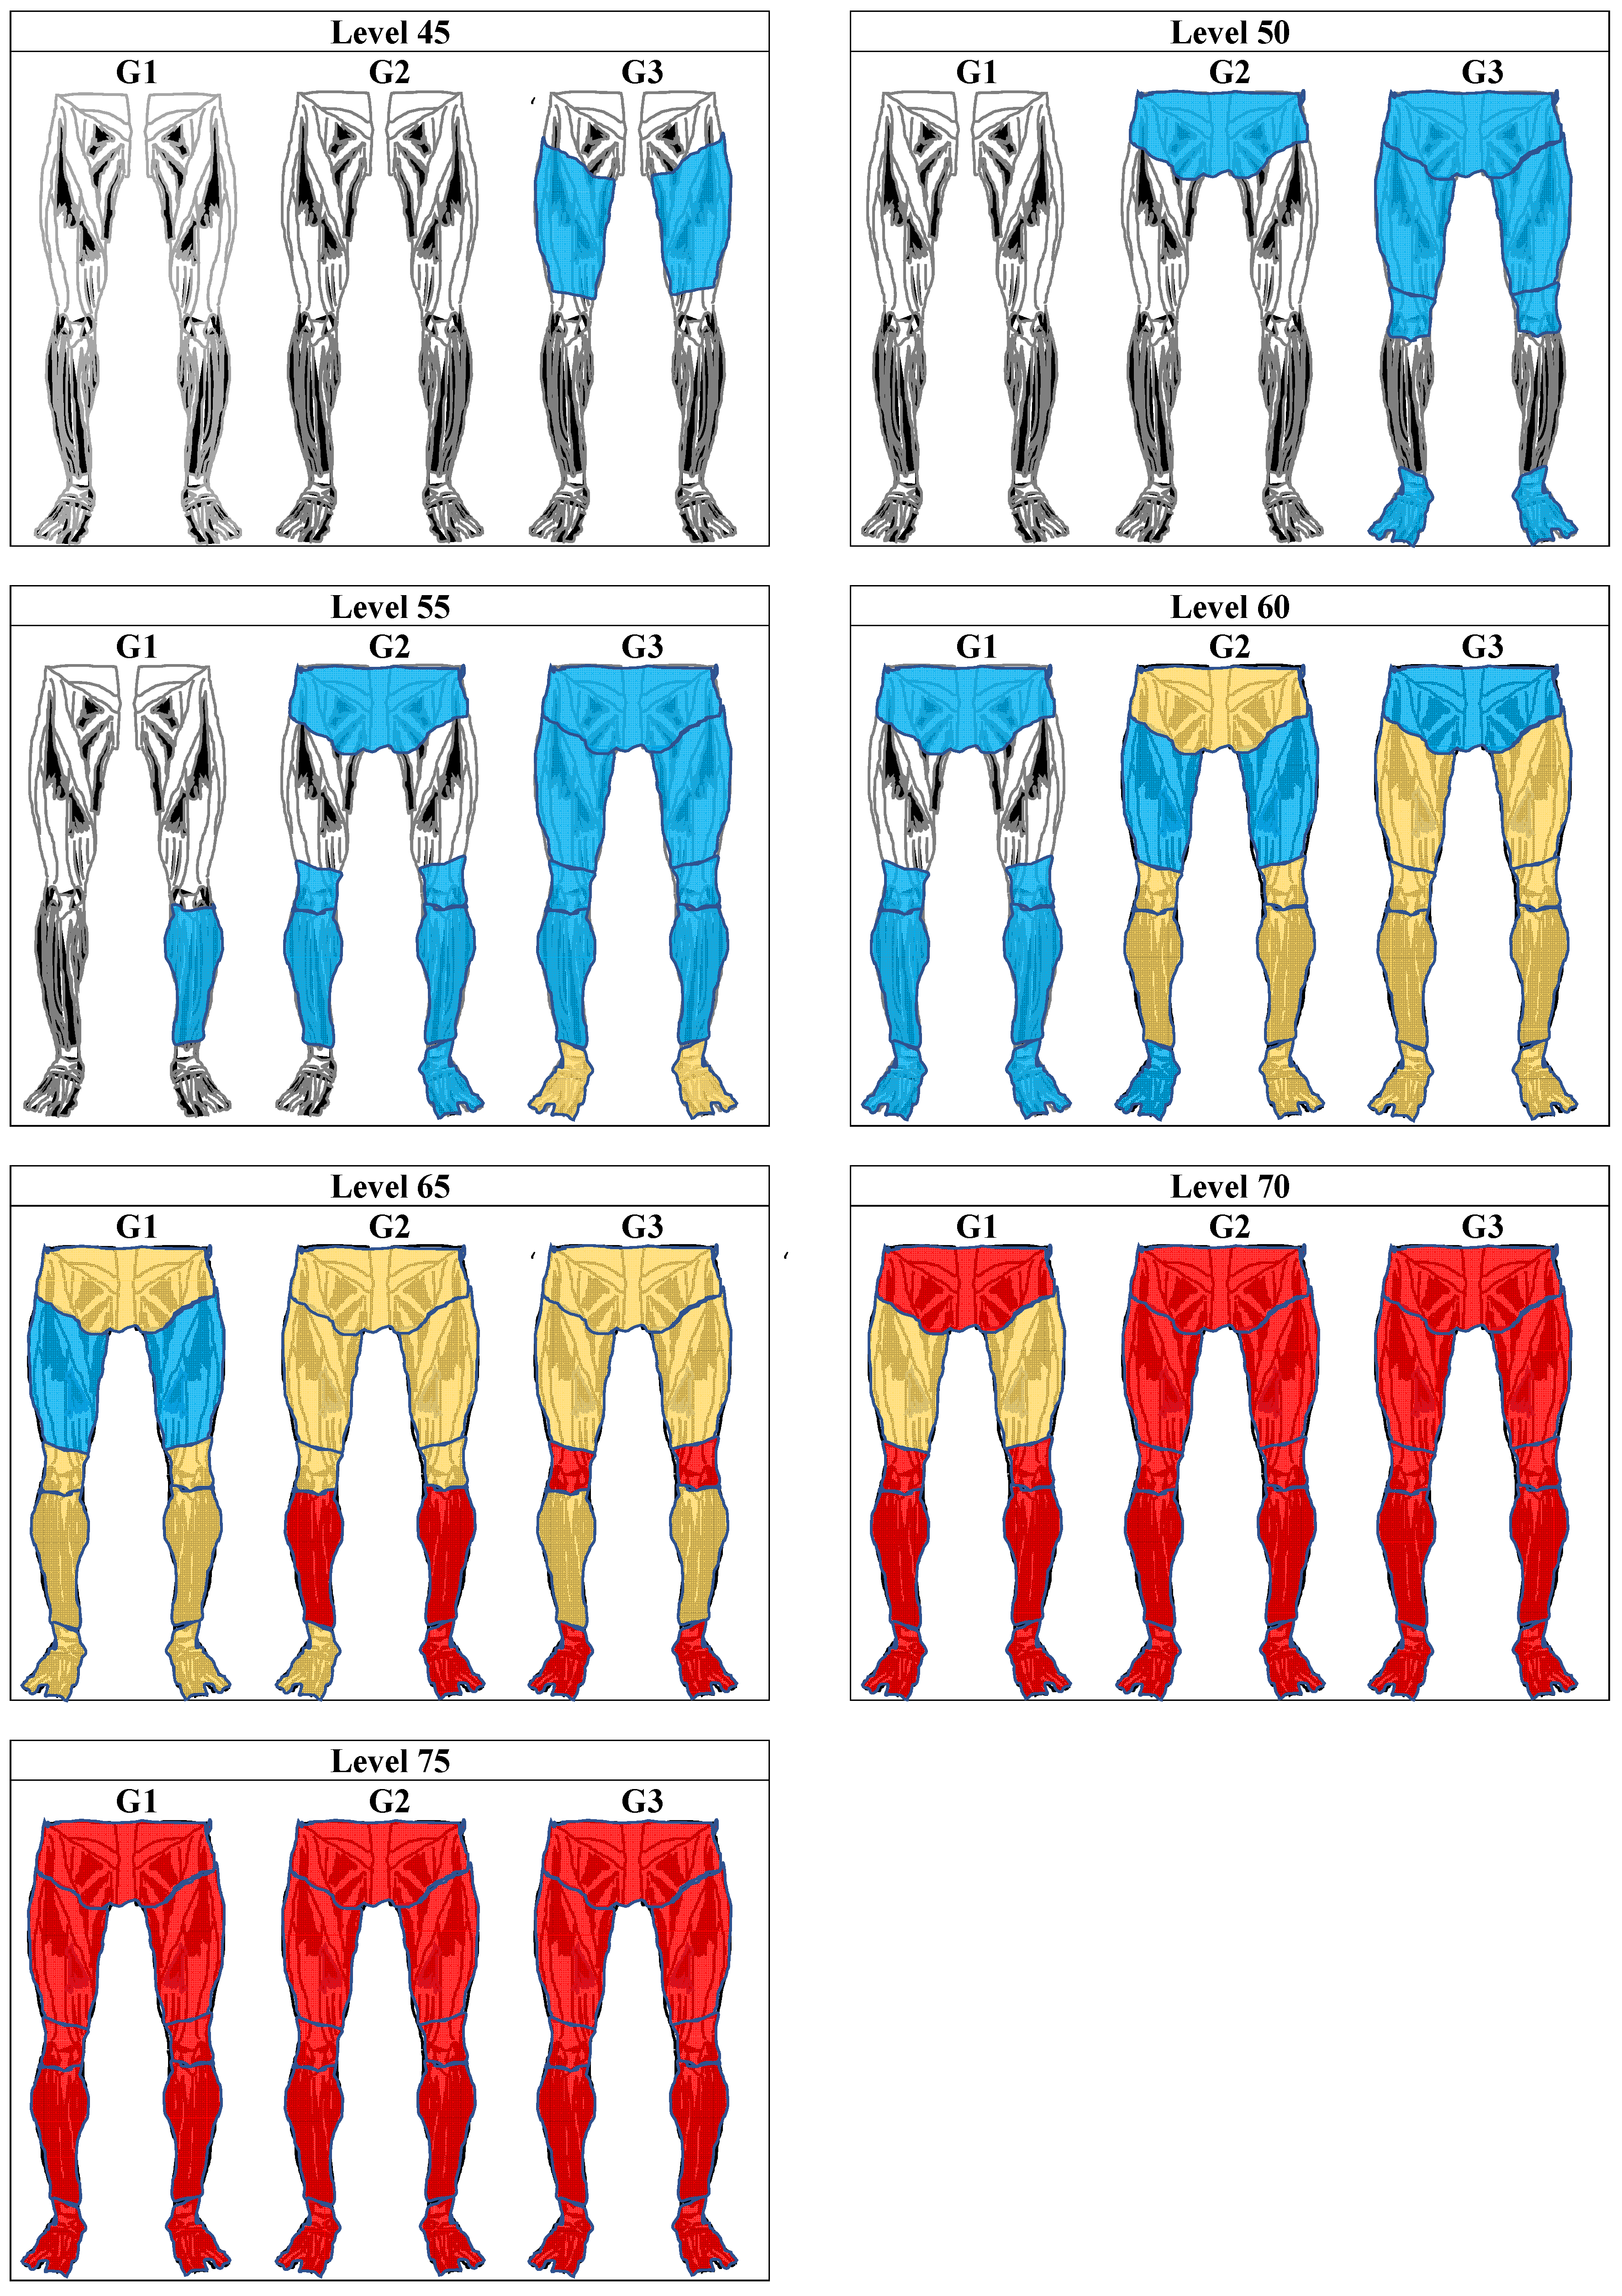
3.4. Lower Limb Discomfort Scale
4. Discussion
4.1. Health Workers
4.2. Education Workers
4.3. Industrial Workers
5. Conclusions
Author Contributions
Funding
Institutional Review Board Statement
Informed Consent Statement
Data Availability Statement
Conflicts of Interest
Appendix A. Data Collection Instrument
| 1–What is your sex: ( ) Male ( ) Female 2–How old are you? _________________ years. 3–What is your weight? _________________ Kg. 4–What is your height? _________________ centimeters. 5–How long have you been in this profession? __________ months 6–What is your professional group? ( ) Health workers ( ) Education workers ( ) Footwear industry workers 7–Indicate the frequency with which you experience some musculoskeletal pain in the following regions of the lower limbs: | |||||
| Diagram | Regions | Frequency of Pain Symptoms | |||
| Never | Rarely | Often | Daily | ||
 | 1–Hips | A | B | C | D |
| 2–Left thigh | A | B | C | D | |
| 3–Right thigh | A | B | C | D | |
| 4–Left knee | A | B | C | D | |
| 5–Right knee | A | B | C | D | |
| 6–Left leg | A | B | C | D | |
| 7–Right leg | A | B | C | D | |
| 8–Left foot | A | B | C | D | |
| 9–Right foot | A | B | C | D | |
Appendix B. Comparison of Response Patterns at Different Levels of the Lower Limb Discomfort Scale
| Level 45 | Level 50 | Level 55 | Level 60 | Level 65 | Level 70 | Level 75 | |
| Factors | X2 (p-Value) | X2 (p-Value) | X2 (p-Value) | X2 (p-Value) | X2 (p-Value) | X2 (p-Value) | X2 (p-Value) |
| Sex | |||||||
| Category 1 x | |||||||
| Category 2 | 55.69 (0.7008) | 3.93 (1.0000) | 5.03 (1.0000) | 3.51 (1.0000) | 5.04 (0.9999) | 0.07 (0.9644) | 5.25 (0.5125) |
| Category 3 | 69.75 (0.9241) | 10.31 (1.0000) | 14.71 (0.9999) | 31.34 (0.7692) | 13.74 (0.9995) | 2.97 (0.9360) | 2.71 (0.6082) |
| Category 4 | 65.00 (0.5464) | 4.09 (1.0000) | 6.92 (0.9999) | 10.69 (0.9861) | 4.90 (0.9990) | 1.50 (0.8262) | 4.71 (0.4521) |
| Category 5 | 78.57 (0.0452) | 24.48 (0.5487) | 35.06 (0.3247) | 27.11 (0.5124) | 16.11 (0.8106) | 3.88 (0.6923) | 6.67 (0.3523) |
| Category 6 | 214.73 (0.0030) | 71.97 (0.8772) | 138.97 (0.0041) | 90.36 (0.0054) | 41.47 (0.5807) | 7.49 (0.8749) | 17.03 (0.2545) |
| Category 2 x | |||||||
| Category 3 | 36.13 (0.9141) | 7.66 (1.0000) | 7.07 (0.9826) | 11.43 (0.9538) | 6.23 (1.0000) | 0.57 (0.9893) | 0.22 (0.6384) |
| Category 4 | 29.03 (0.4109) | 2.62 (0.9948) | 2.06 (0.9565) | 3.80 (0.7040) | 1.96 (0.9822) | 0.03 (0.8667) | 4.83 (0.0894) |
| Category 5 | 26.86 (0.1393) | 16.74 (0.3344) | 11.67 (0.6331) | 9.01 (0.6206) | 8.64 (0.7331) | 0.38 (0.9440) | 8.79 (0.0322) |
| Category 6 | 148.26 (0.0531 *) | 49.25 (0.9926) | 64.14 (0.9022) | 37.70 (0.6599) | 23.44 (0.9132) | 2.73 (0.9870) | 28.21 (0.0030) |
| Category 3 x | |||||||
| Category 4 | 40.70 (0.9094) | 4.00 (1.0000) | 5.80 (0.9984) | 8.25 (0.9988) | 4.28 (1.0000) | 0.61 (0.9989) | - |
| Category 5 | 43.11 (0.5939) | 14.70 (0.9913) | 17.14 (0.9049) | 8.85 (0.9999) | 7.01 (0.9999) | 1.23 (0.9987) | - |
| Category 6 | 172.42 (0.0823 *) | 53.48 (0.9994) | 83.94 (0.7133) | 29.94 (0.996) | 18.72 (1.0000) | 3.57 (0.9995) | 8.09 (0.5250) |
| Category 4 x | |||||||
| Category 5 | 26.63 (0.3747) | 6.57 (0.8328) | 10.96 (0.8119) | 4.48 (0.9918) | 3.57 (0.9372) | 0.46 (0.9936) | - |
| Category 6 | 148.54 (0.0929 *) | 31.54 (1.0000) | 65.27 (0.9122) | 28.29 (0.9757) | 14.11 (0.9960) | 2.74 (0.9971) | 9.09 (0.5233) |
| Category 5 x | |||||||
| Category 6 | 129.76 (0.2356) | 24.49 (1.0000) | 40.06 (1.0000) | 25.94 (0.9981) | 13.15 (0.9997) | 3.16 (0.9987) | 10.10 (0.5219) |
| Age | |||||||
| Category 1 x | |||||||
| Category 2 | 47.59 (0.6841) | 3.29 (1.0000) | 4.39 (0.9999) | 3.57 (0.9999) | 3.48 (0.9990) | 0.01 (0.9620) | 1.89 (0.7550) |
| Category 3 | 21.00 (0.4589) | 1.21 (0.9966) | 1.24 (0.9900) | 0.58 (0.9891) | 1.80 (0.9375) | 0.02 (0.8786) | 4.67 (0.3224) |
| Category 4 | 23.45 (0.7101) | 0.93 (0.9996) | 5.57 (0.9603) | 10.34 (0.2420) | 4.89 (0.1799) | 1.14 (0.5645) | 0.89 (0.6386) |
| Category 5 | 41.21 (0.4616) | 4.32 (1.0000) | 2.66 (0.9989) | 10.89 (0.9275) | 3.41 (0.9991) | 0.91 (0.8239) | 4.50 (0.2124) |
| Category 6 | 18.36 (0.6846) | 1.44 (0.9841) | 3.23 (0.7793) | 4.37 (0.7368) | 2.21 (0.8185) | 1.08 (0.7827) | 0.90 (0.6386) |
| Category 7 | 84.92 (0.1415) | 29.73 (0.9979) | 49.15 (0.9147) | 28.90 (0.5226) | 15.03 (0.7748) | 4.59 (0.9171) | 14.08 (0.04977) |
| Category 8 | 86.67 (0.0376) | 21.06 (0.8570) | 35.44 (0.3540) | 36.08 (0.0298) | 14.59 (0.2645) | 1.97 (0.5792) | 16.963 (0.0305) |
| Category 9 | 38.21 (0.0056) | 2.70 (0.9517) | 1.18 (0.9469) | 11.39 (0.1806) | 3.71 (0.4461) | 1.17 (0.5575) | 4.50 (0.2124) |
| Category 2 x | |||||||
| Category 3 | 42.67 (0.7263) | 3.30 (1.0000) | 4.40 (0.9995) | 2.49 (1.0000) | 4.59 (0.9999) | 0.08 (0.7692) | 3.51 (0.3192) |
| Category 4 | 45.06 (0.8522) | 3.62 (1.0000) | 10.14 (0.9939) | 15.70 (0.6769) | 7.14 (0.9816) | 1.56 (0.4585) | 0.56 (0.4542) |
| Category 5 | 62.68 (0.6910) | 10.50 (1.0000) | 5.89 (0.9999) | 23.91 (0.7761) | 7.55 (1.0000) | 1.28 (0.7330) | 2.33 (0.3116) |
| Category 6 | 39.96 (0.8443) | 4.55 (0.9997) | 7.72 (0.9723) | 8.69 (0.9666) | 5.29 (0.9991) | 1.84 (0.6054) | 0.56 (0.4542) |
| Category 7 | 125.14 (0.0452) | 66.91 (0.4802) | 101.24 (0.0240) | 54.34 (0.079) * | 28.04 (0.7541) | 6.08 (0.8087) | 7.07 (0.3146) |
| Category 8 | 128.34 (0.0089) | 48.55 (0.1950) | 74.10 (0.0030) | 63.54 (0.0011) | 20.16 (0.7837) | 2.99 (0.3929) | 8.59 (0.2836) |
| Category 9 | 50.76 (0.3278) | 7.642 (0.9940) | 4.65 (0.9972) | 17.15 (0.5798) | 7.37 (0.9866) | 2.02 (0.3649) | 2.33 (0.3116) |
| Category 3 x | |||||||
| Category 4 | 18.50 (0.7782) | 1.32 (0.9703) | 4.62 (0.9482) | 4.38 (0.6261) | 6.01 (0.6463) | 0.63 (0.7302 | 3.40 (0.0652) * |
| Category 5 | 34.73 (0.5760) | 4.68 (1.0000) | 2.25 (0.9974) | 7.56 (0.9750) | 5.74 (0.9992) | 0.41 (0.9370) | 6.50 (0.0388) |
| Category 6 | 13.40 (0.7676) | 1.79 (0.7741) | 3.85 (0.4270) | 4.51 (0.4784) | 4.00 (0.9471) | 0.42 (0.9367) | 3.40 (0.0652) * |
| Category 7 | 74.39 (0.2780) | 24.38 (0.9996) | 44.78 (0.9513) | 17.37 (0.9409) | 22.94 (0.5813) | 3.14 (0.9778) | 13.833 (0.0316) |
| Category 8 | 75.65 (0.0982) * | 17.18 (0.9033) | 30.47 (0.4929) | 14.96 (0.7788) | 19.00 (0.3283) | 0.89 (0.8270) | 16.36 (0.0221) |
| Category 9 | 23.852 (0.0676) * | 3.03 (0.6952) | 1.551 (0.6706) | 5.93 (0.4305) | 6.11 (0.7285) | 0.31 (0.8566) | 6.50 (0.0388) |
| Category 4 x | |||||||
| Category 5 | 35.76 (0.8071) | 3.25 (1.0000) | 3.58 (0.9998) | 5.64 (0.9993) | 3.78 (0.9996) | 0.45 (0.9783) | - |
| Category 6 | 15.68 (0.9241) | 1.05 (0.9586) | 3.28 (0.9738) | 4.14 (0.8439) | 2.39 (0.9352) | 0.54 (0.9697) | - |
| Category 7 | 78.26 (0.3757) | 23.71 (0.9998) | 51.67 (0.9296) | 15.82 (0.9891) | 10.38 (0.9825) | 3.28 (0.9863) | 4.00 (0.4060) |
| Category 8 | 79.91 (0.1530) | 16.29 (0.9472) | 33.12 (0.6517) | 14.24 (0.9197) | 9.44 (0.8018) | 0.96 (0.9160) | 5.00 (0.4159) |
| Category 9 | 21.65 (0.4807) | 1.60 (0.9526) | 1.85 (0.9937) | 5.21 (0.8156) | 2.20 (0.9007) | 0.41 (0.9387) | - |
| Category 5 x | |||||||
| Category 6 | 30.237 (0.8110) | 3.52 (1.0000) | 3.72 (0.9592) | 6.77 (0.9953) | 2.31 (1.0000) | 0.16 (0.9995) | - |
| Category 7 | 97.849 (0.2218) | 42.31 (0.9964) | 61.55 (0.6963) | 15.52 (0.9999) | 13.26 (0.9995) | 3.04 (0.9953) | 5.00 (0.4159) |
| Category 8 | 100.01 (0.0746) * | 29.38 (0.9556) | 41.78 (0.2709) | 13.14 (0.9995) | 9.40 (0.9988) | 0.75 (0.9799) | 6.00 (0.4232) |
| Category 9 | 37.19 (0.3683) | 3.98 (1.0000) | 1.59 (0.9964) | 6.90 (0.9970) | 2.82 (1.0000) | 0.25 (0.9927) | - |
| Category 6 x | |||||||
| Category 7 | 68.32 (0.5005) | 18.46 (1.0000) | 28.06 (0.9999) | 14.965 (0.9899) | 8.48 (0.9985) | 2.15 (0.9981) | 4.00 (0.4060) |
| Category 8 | 69.42 (0.2417) | 12.22 (0.9847) | 13.95 (0.9945) | 11.99 (0.9576) | 6.54 (0.9811) | 0.41 (0.9951) | 5.00 (0.4159) |
| Category 9 | 15.53 (0.4859) | 1.32 (0.8571) | 0.49 (0.7843) | 5.57 (0.6953) | 1.13 (0.9973) | 0.07 (0.9994) | - |
| Category 7 x | |||||||
| Category 8 | 116.82 (0.3587) | 24.78 (1.0000) | 40.16 (1.0000) | 24.16 (0.9953) | 13.47 (0.9974) | 3.08 (0.9950) | 9.09 (0.5233) |
| Category 9 | 70.66 (0.3248) | 14.92 (1.0000) | 26.48 (0.9999) | 15.08 (0.9927) | 6.83 (0.9996) | 2.71 (0.9940) | 5.00 (0.4159) |
| Category 8 x | |||||||
| Category 9 | 71.66 (0.1248) | 9.42 (0.9988) | 12.39 (0.9970) | 10.67 (0.9863) | 5.88 (0.9816) | 0.48 (0.9750) | 6.00 (0.4232) |
| Length of service | |||||||
| Category 1 x | |||||||
| Category 2 | 50.68 (0.7096) | 3.27 (1.0000) | 4.30 (0.9998) | 3.54 (0.9989) | 3.80 (0.9998) | 0.07 (0.9644) | 0.93 (0.9198) |
| Category 3 | 39.49 (0.6652) | 3.66 (1.0000) | 4.72 (0.9999) | 2.92 (0.9999) | 4.45 (0.9995) | 0.07 (0.9644) | 5.41 (0.3682) |
| Category 4 | 54.10 (0.8306) | 6.00 (1.0000) | 10.62 (0.9980) | 21.68 (0.4789) | 9.16 (0.9954) | 1.89 (0.8636) | 4.67 (0.3224) |
| Category 5 | 51.51 (0.5710) | 7.57 (1.0000) | 5.46 (0.9997) | 16.95 (0.7662) | 7.85 (0.9996) | 1.91 (0.8618) | |
| Category 6 | 42.04 (0.8604) | 8.05 (0.9997) | 8.54 (0.9973) | 8.72 (0.9485) | 4.11 (0.9999) | 1.73 (0.7849) | 0.93 (0.8177) |
| Category 7 | 144.93 (0.0467) | 70.61 (0.7644) | 105.50 (0.1263) | 64.13 (0.0489) | 33.42 (0.7217) | 8.12 (0.8360) | 23.36 (0.0248) |
| Category 8 | 115.27 (0.0025) | 36.91 (0.1798) | 57.53 (0.0071) | 50.54 (0.0008) | 15.91 (0.8913) | 2.84 (0.8280) | 11.41 (0.0764) * |
| Category 9 | 47.96 (0.2786) | 14.52 (0.8463) | 3.96 (0.9995) | 15.15 (0.5846) | 8.22 (0.9751) | 0.07 (0.9644) | 0.93 (0.8177) |
| Category 2 x | |||||||
| Category 3 | 21.10 (0.5144) | 0.84 (0.9970) | 0.75 (0.9798) | 0.66 (0.9986) | 1.66 (0.8940) | - | 2.33 (0.3116) |
| Category 4 | 35.72 (0.7766) | 1.47 (0.9997) | 3.63 (0.9796) | 10.61 (0.5623) | 4.42 (0.9266) | 0.35 (0.8389) | 2.12 (0.1449) |
| Category 5 | 31.95 (0.4691) | 1.78 (1.0000) | 1.29 (0.9359) | 8.39 (0.7536) | 3.61 (0.9895) | 0.04 (0.9800) | - |
| Category 6 | 23.66 (0.8241) | 2.27 (0.9973) | 4.06 (0.7733) | 4.55 (0.7142) | 1.15 (0.9920) | 0.03 (0.8663) | - |
| Category 7 | 109.28 (16.73) | 28.57 (1.0000) | 47.64 (0.9926) | 31.39 (0.7290) | 20.02 (0.7905) | 0.02 (0.8663) | 11.61 (0.2359) |
| Category 8 | 80.93 (0.0103) | 12.73 (0.6234) | 22.57 (0.2076) | 24.67 (0.0256) | 9.49 (0.5766) | 2.88 (0.9841) | 6.18 (0.1033) |
| Category 9 | 29.45 (0.1037) | 4.92 (0.5535) | 0.22 (0.6384) | 7.29 (0.3991) | 5.56 (0.3515) | 0.04 (0.9979) | - |
| Category 3 x | |||||||
| Category 4 | 24.53 (0.7475) | 2.77 (0.9935) | 4.91 (0.9769) | 11.47 (0.6490) | 6.05 (0.8104) | - | 2.00 (0.3679) |
| Category 5 | 19.10 (0.4502) | 3.32 (0.9983) | 1.72 (0.9735) | 10.11 (0.7534) | 5.51 (0.9389) | 0.35 (0.8389) | 1.00 (0.3173) |
| Category 6 | 12.44 (0.8236) | 3.80 (0.9753) | 4.99 (0.8344) | 5.46 (0.7928) | 2.08 (0.9553) | 0.04 (0.9800) | 1.00 (0.3173) |
| Category 7 | 86.66 (0.3701) | 32.10 (0.9998) | 59.03 (0.9249) | 34.46 (0.6769) | 22.61 (0.6520) | 0.03 (0.8663) | 8.17 (0.6126) |
| Category 8 | 58.14 (0.0400) | 15.73 (0.4000) | 31.96 (0.0437) | 26.04 (0.0376) | 11.68 (0.3883) | 2.88 (0.9841) | 4.00 (0.4060) |
| Category 9 | 16.20 (0.0396) | 7.22 (0.3009) | 0.52 (0.9146) | 8.19 (0.5154) | 6.08 (0.2985) | 0.04 (0.9979) | 1.00 (0.3173) |
| Category 4 x | |||||||
| Category 5 | 33.84 (0.7430) | 2.43 (1.0000) | 3.14 (0.9974) | 6.14 (0.9976) | 3.89 (0.9996) | - | - |
| Category 6 | 26.98 (0.9272) | 2.68 (0.9998) | 4.28 (0.9967) | 5.46 (0.9784) | 2.52 (0.9981) | 0.50 (0.9920) | - |
| Category 7 | 115.03 (0.2162) | 31.91 (1.0000) | 58.61 (0.9763) | 21.86 (0.9979) | 13.03 (0.9981) | 0.53 (0.9701) | 8.09 (0.5250) |
| Category 8 | 85.18 (0.0271) | 14.50 (0.7538) | 25.98 (0.4644) | 13.39 (0.8602) | 4.76 (0.9968) | 4.05 (0.9906) | - |
| Category 9 | 28.72 (0.4797) | 5.24 (0.8747) | 1.77 (0.9946) | 4.81 (0.9883) | 2.31 (0.9933) | 0.67 (0.9950) | - |
| Category 5 x | |||||||
| Category 6 | 19.96 (0.8659) | 2.81 (1.0000) | 3.84 (0.9213) | 4.86 (0.9876) | 1.97 (0.9999) | 0.35 (0.8289) | - |
| Category 7 | 94.69 (0.4317) | 36.44 (0.9998) | 53.18 (0.9784) | 19.13 (0.9996) | 16.55 (0.9924) | 0.08 (0.9993) | 7.09 (0.5271) |
| Category 8 | 65.36 (0.0851) * | 16.82 (0.7732) | 26.25 (0.1576) | 9.73 (0.9728) | 6.59 (0.9932) | 2.85 (0.9984) | - |
| Category 9 | 19.10 (0.3856) | 5.81 (0.9527) | 0.66 (0.8819) | 4.17 (0.9943) | 3.36 (0.9925) | 0.11 (1.0000) | - |
| Category 6 x | |||||||
| Category 7 | 91.06 (0.5080) | 30.17 (1.0000) | 48.04 (0.9970) | 19.55 (0.9961) | 12.47 (0.9950) | 0.04 (0.9800) | 7.09 (0.5271) |
| Category 8 | 61.30 (0.1313) | 13.27 (0.8243) | 19.64 (0.6052) | 10.25 (0.8038) | 3.84 (0.9927) | 2.85 (0.9965) | - |
| Category 9 | 13.84 (0.6783) | 4.76 (0.9066) | 2.38 (0.7943) | 3.66 (0.9223) | 1.49 (0.9826) | 0.07 (0.9999) | - |
| Category 7 x | |||||||
| Category 8 | 123.24 (0.2828) | 24.40 (1.0000) | 40.06 (1.0000) | 26.28 (0.9884) | 13.26 (0.9986) | 0.03 (0.8663) | 10.09 (0.5219) |
| Category 9 | 82.62 (0.4600) | 19.46 (1.0000) | 32.72 (1.0000) | 17.52 (0.9988) | 10.50 (0.9969) | 3.16 (0.9987) | 7.09 (0.5271) |
| Category 8 x | |||||||
| Category 9 | 53.80 (0.0712) * | 5.43 (0.9788) | 6.06 (0.9874) | 7.81 (0.9310) | 2.58 (0.9952) | 2.88 (0.9841) | - |
| BMI | |||||||
| Category 1 x | |||||||
| Category 2 | 45.59 (0.6878) | 3.64 (1.0000) | 4.12 (0.9997) | 2.23 (0.9975) | 4.00 (0.9998) | 0.01 (0.9620) | 0.90 (0.8256) |
| Category 3 | 34.21 (0.5541) | 2.16 (0.9996) | 1.68 (0.9982) | 1.81 (1.0000) | 3.34 (0.9992) | 0.07 (0.9644) | 3.49 (0.6254) |
| Category 4 | 47.84 (0.7728) | 6.72 (0.9999) | 7.81 (0.9885) | 16.29 (0.7532) | 11.04 (0.9999) | 2.41 (0.6611) | 2.39 (0.4961) |
| Category 5 | 39.06 (0.6008) | 3.97 (0.9916) | 3.55 (0.9814) | 9.24 (0.6819) | 2.43 (0.9993) | 1.39 (0.8461) | 0.11 (0.9481) |
| Category 6 | 28.38 (0.6503) | 4.86 (0.9932) | 0.83 (0.9749) | 1.73 (0.9734) | 2.43 (0.9984) | 1.88 (0.5985) | 0.11 (0.9481) |
| Category 7 | 106.92 (0.0074) | 40.38 (0.4981) | 43.51 (0.1820) | 30.75 (0.0779) * | 14.48 (0.9124) | 3.06 (0.5485) | 6.67 (0.3523) |
| Category 8 | 98.42 (0.1188) | 35.47 (0.9516) | 43.83 (0.9299) | 37.02 (0.2888) | 31.99 (0.4669) | 6.66 (0.7575) | 8.60 (0.2823) |
| Category 9 | 70.75 (0.0010) | 12.27 (0.4245) | 16.92 (0.0762) * | 13.55 (0.3305) | 7.57 (0.9749) | 3.55 (0.4696) | 6.65 (0.2483) |
| Category 2 x | |||||||
| Category 3 | 31.47 (0.6837) | 2.04 (1.0000) | 3.79 (0.9996) | 2.87 (0.9993) | 2.69 (0.9520) | - | 5.62 (0.1315) |
| Category 4 | 45.06 (0.8522) | 6.65 (1.0000) | 10.18 (0.9977) | 17.49 (0.6812) | 10.04 (0.9988) | 0.11 (0.9471) | 4.86 (0.027 |
| Category 5 | 34.85 (0.7749) | 3.66 (0.9994) | 4.77 (0.9992) | 10.26 (0.5933) | 1.71 (0.9439) | 0.16 (0.9231) | - |
| Category 6 | 25.61 (0.7807) | 4.68 (0.9993) | 2.85 (0.9965) | 3.04 (0.8813) | 1.59 (0.9025) | 0.03 (0.8663) | - |
| Category 7 | 100.32 (0.0226) | 46.51 (0.3694) | 66.38 (0.0126) | 33.41 (0.0418) | 13.06 (0.6686) | 0.91 (0.6333) | 12.60 (0.0133) |
| Category 8 | 92.66 (0.2196) | 40.66 (0.9103) | 71.95 (0.2876) | 40.42 (0.1754) | 28.43 (0.2886) | 1.46 (0.9933) | 16.07 (0.0067) |
| Category 9 | 57.69 (0.0212) | 12.84 (0.6149) | 24.45 (0.1077) | 15.92 (0.1948) | 7.65 (0.6628) | 0.44 (0.8030) | 13.12 (0.0043) |
| Category 3 x | |||||||
| Category 4 | 33.72 (0.7831) | 3.82 (1.0000) | 9.21 (0.9547) | 19.37 (0.7320) | 5.94 (0.9999) | 0.70 (0.8737) | 6.20 (0.1024) |
| Category 5 | 22.84 (0.6934) | 1.80 (0.9701) | 3.43 (0.9694) | 11.38 (0.7253) | 0.46 (0.9281) | 0.34 (0.9524) | 3.58 (0.1667) |
| Category 6 | 14.27 (0.6482) | 2.58 (0.9787) | 0.43 (0.9795) | 2.66 (0.9883) | 0.54 (0.7619) | 0.35 (0.8417) | 3.58 (0.1667) |
| Category 7 | 78.18 (0.0480) | 23.86 (0.9228) | 54.96 (0.0171) | 35.87 (0.0565) * | 6.20 (0.9388) | 1.05 (0.7884) | 10.55 (0.1033) |
| Category 8 | 70.90 (0.3811) | 22.47 (0.9980) | 52.99 (0.6614) | 45.34 (0.1368) | 15.69 (0.8307) | 2.11 (0.9895) | 12.79 (0.0774) * |
| Category 9 | 45.44 (0.0035) | 7.86 (0.2489) | 23.70 (0.0048) | 15.75 (0.3986) | 3.52 (0.8332) | 0.89 (0.8270) | 11.30 (0.0457) |
| Category 4 x | |||||||
| Category 5 | 36.61 (0.8627) | 2.80 (1.0000) | 5.79 (0.9984) | 7.17 (0.9988) | 4.28 (1.0000) | 0.50 (0.9920) | - |
| Category 6 | 27.82 (0.8625) | 3.48 (1.0000) | 4.05 (0.9907) | 7.30 (0.9794) | 4.16 (1.0000) | 0.13 (0.9979) | - |
| Category 7 | 103.36 (0.0344) | 34.08 (0.9354) | 46.92 (0.3536) | 16.46 (0.9848) | 7.81 (1.0000) | 0.99 (0.8629) | 4.00 (0.4060) |
| Category 8 | 96.03 (0.2618) | 29.52 (0.9993) | 49.41 (0.9472) | 17.98 (0.9997) | 18.30 (0.9992) | 1.53 (0.9996) | 5.00 (0.4159) |
| Category 9 | 56.49 (0.0814) * | 8.10 (0.9856) | 16.56 (0.5534) | 8.92 (0.9937) | 5.42 (1.0000) | 0.50 (0.9922) | - |
| Category 5 x | |||||||
| Category 6 | 15.36 (0.8814) | 1.73 (0.9950) | 1.04 (0.9595) | 1.81 (0.9864) | - | 0.40 (0.9826) | - |
| Category 7 | 73.27 (0.2254) | 17.43 (0.9943) | 43.95 (0.1702) | 10.61 (0.9798) | 2.74 (0.9938) | 1.21 (0.9439) | 3.00 (0.3916) |
| Category 8 | 67.00 (0.7052) | 17.40 (0.9999) | 41.75 (0.9567) | 11.18 (0.9999) | 8.56 (0.9875) | 2.61 (0.9939) | 4.00 (0.4060) |
| Category 9 | 33.95 (0.2410) | 4.92 (0.5539) | 17.11 (0.0719) * | 3.48 (0.9956) | 1.31 (0.9341) | 1.07 (0.9564) | - |
| Category 6 x | |||||||
| Category 7 | 64.98 (0.1680) | 21.13 (0.9831) | 20.29 (0.9087) | 13.42 (0.7074) | 2.32 (0.9933) | 0.96 (0.9160) | 3.00 (0.3916) |
| Category 8 | 58.51 (0.6702) | 20.15 (0.9998) | 16.40 (1.0000) | 13.74 (0.9926) | 7.72 (0.9893) | 1.45 (0.9991) | 4.00 (0.4060) |
| Category 9 | 29.50 (0.0585) * | 6.15 (0.6300) | 3.91 (0.4182) | 4.14 (0.8447) | 1.03 (0.9055) | 0.43 (0.9801) | - |
| Category 7 x | |||||||
| Category 8 | 106.52 (0.4676) | 22.80 (1.0000) | 35.86 (1.0000) | 22.09 (0.9966) | 11.65 (0.9989) | 2.71 (0.9940) | 7.08 (0.5271) |
| Category 9 | 80.38 (0.0489) | 11.35 (0.9999) | 24.40 (0.9103) | 14.57 (0.8799) | 3.11 (0.9995) | 1.47 (0.9159 | 6.00 (0.4232) |
| Category 8 x | |||||||
| Category 9 | 72.99 (0.3800) | 13.74 (1.0000) | 20.57 (1.0000) | 14.37 (0.9987) | 9.94 (0.9948) | 1.94 (0.9987) | 7.00 (0.4289) |
| Note 1: For the sex factor, Category 1 (male healthcare professional), Category 2 (female healthcare professional), Category 3 (male healthcare professional), Category 4 (female healthcare professional), Category 5 (male professional in the footwear industry), and Category 6 (female professional in the footwear industry). Note 2: For the age factor, Category 1 (health professional <30 years old), Category 2 (health professional aged 30–49 years), Category 3 (health professional >50 years old), Category 4 (education professional <30 years old), Category 5 (education professional aged 30–49 years), Category 6 (education professional >50 years old), Category 7 (industry professional footwear industry <30 years old), Category 8 (footwear industry professional aged 30–49 years), and Category 9 (footwear industry professional >50 years old). Note 3: For the length of service factor, Category 1 (health professional with <10 months of service time), Category 2 (health professional with service time between 10 and 20 months), Category 3 (health professional with >20 months of service time), Category 4 (education professional with <10 months of service), Category 5 (education professional with service time between 10 and 20 months), Category 6 (education professional with >20 months of service time), Category 7 (footwear industry professional with <10 months of service time), Category 8 (footwear industry professional with service time between 10 and 20 months), and Category 9 (professional from the footwear industry with >20 months of service time). Note 4: For the BMI factor, Category 1 (underweight or normal weight healthcare professional), Category 2 (overweight healthcare professional), Category 3 (obese healthcare professional), Category 4 (underweight or normal weight education professional), Category 5 (overweight education professional), Category 6 (obese education professional), Category 7 (underweight or normal weight footwear industry professional), Category 8 (professional overweight footwear), and Category 9 (obese footwear industry professional). Note 5: Values with p-value < 0.05 are in bold; Values with * are close to statistical significance. The character—indicates the absence of individuals in the sample with a given characteristic at a given level of risk on the scale. | |||||||
References
- Gómez, M.M. Prediction of work-related musculoskeletal discomfort in the meat processing industry using statistical models. Int. J. Ind. Ergon. 2020, 75, 102876. [Google Scholar] [CrossRef]
- Bispo, L.G.M.; Moreno, C.F.; Silva, G.H.D.O.; de Albuquerque, N.L.B.; da Silva, J.M.N. Risk factors for work-related musculoskeletal disorders: A study in the inner regions of Alagoas and Bahia. Saf. Sci. 2022, 153, 105804. [Google Scholar] [CrossRef]
- Rathore, B.; Pundir, A.K.; Iqbal, R. Ergonomic risk factors in glass artware industries and prevalence of musculoskeletal disorder. Int. J. Ind. Ergon. 2020, 80, 103043. [Google Scholar] [CrossRef]
- Veisi, H.; Choobineh, A.; Ghaem, H. Musculoskeletal Problems in Iranian Hand- woven Shoe- Sole Making Operation and Developing Guidelines for Workstation Design. Int. J. Occup. Environ. Med. 2016, 7, 87–97. [Google Scholar] [CrossRef] [Green Version]
- Davis, K.G.; Kotowski, S.E. Prevalence of Musculoskeletal Disorders for Nurses in Hospitals, Long-Term Care Facilities, and Home Health Care: A Comprehensive Review. Hum. Factors 2015, 57, 754–792. [Google Scholar] [CrossRef]
- Vega-Fernández, G.; Lera, L.; Leyton, B.; Cortés, P.; Lizana, P.A. Musculoskeletal Disorders Associated with Quality of Life and Body Composition in Urban and Rural Public School Teachers. Front. Public Health 2021, 9, 607318. [Google Scholar] [CrossRef]
- Asghari, E.; Dianat, I.; Abdollahzadeh, F.; Mohammadi, F.; Asghari, P.; Jafarabadi, M.A.; Castellucci, H.I. Musculoskeletal pain in operating room nurses: Associations with quality of work life, working posture, socio-demographic and job characteristics. Int. J. Ind. Ergon. 2019, 72, 330–337. [Google Scholar] [CrossRef]
- Coledam, D.H.C.; Júnior, R.P.; Ribeiro, E.A.G.; de Oliveira, A.R. Factors associated with musculoskeletal disorders and disability in elementary teachers: A cross-sectional study. J. Bodyw. Mov. Ther. 2019, 23, 658–665. [Google Scholar] [CrossRef]
- Cici, R.; Yilmazel, G. Musculoskeletal disorders increases the insomnia severity in nurses. Sleep Sci. 2022, 15, 1–6. [Google Scholar] [CrossRef]
- Menegon, L.D.S.; Vincenzi, S.L.; de Andrade, D.F.; Barbetta, P.A.; Vink, P.; Merino, E.A.D. An aircraft seat discomfort scale using item response theory. Appl. Ergon. 2019, 77, 1–8. [Google Scholar] [CrossRef]
- Anatchkova, M.D.; Saris-Baglama, R.N.; Kosinski, M.; Bjorner, J.B. Development and Preliminary Testing of a Computerized Adaptive Assessment of Chronic Pain. J. Pain 2009, 10, 932–943. [Google Scholar] [CrossRef] [PubMed] [Green Version]
- da Silva, J.M.N.; Gontijo, L.A.; Bornia, A.C.; da Silva, L.B.; Leite, W.K.D.S.; Vieira, E.M.D.A.; Torres, M.G.L. Construction of an osteomuscular discomfort scale for the upper region of the body of footwear industry workers. Int. J. Ind. Ergon. 2020, 80, 103048. [Google Scholar] [CrossRef]
- Tirloni, A.S.; Dos Reis, D.C.; Bornia, A.C.; De Andrade, D.F.; Borgatto, A.F.; Moro, A.R.P. Development and validation of instrument for ergonomic evaluation of tablet arm chairs. EXCLI J. 2016, 15, 671–686. [Google Scholar] [CrossRef] [PubMed]
- Da Silva, J.M.N.; Gontijo, L.A.; Bornia, A.C.; Da Silva, L.B.; Leite, W.K.D.S.; Vieira, E.M.D.A. Evaluation of musculoskeletal discomfort using item response theory: Creation of a scale based on the self-reported pain symptoms. Ergonomics 2020, 64, 241–252. [Google Scholar] [CrossRef]
- O’Connor, D.P. Comparison of two psychometric scaling methods for ratings of acute musculoskeletal pain. Pain 2004, 110, 488–494. [Google Scholar] [CrossRef]
- Gorter, R.; Fox, J.-P.; Twisk, J.W.R. Why item response theory should be used for longitudinal questionnaire data analysis in medical research data analysis, statistics and modelling. BMC Med. Res. Methodol. 2015, 15, 55. [Google Scholar] [CrossRef] [Green Version]
- Saltychev, M.; Vastamäki, H.; Mattie, R.; McCormick, Z.; Vastamäki, M.; Laimi, K. Psychometric Properties of the Pain Numeric Rating Scale When Applied to Multiple Body Regions among Professional Musicians. PLoS ONE 2016, 11, e0161874. [Google Scholar] [CrossRef] [Green Version]
- da Silva, O.F.; da Silva, J.M.N.; Silva, L.K.D.; Lima, T.D.F.M.; Bornia, A.C.; de Souza, L.A.H.; Leite, W.K.D.S.; Vieira, E.M.D.A. Do men and women have different musculoskeletal symptoms at the same musculoskeletal discomfort level? Ergonomics 2022, 65, 1486–1508. [Google Scholar] [CrossRef]
- Corlett, E.N.; Bishop, R.P. A Technique for Assessing Postural Discomfort. Ergonomics 1976, 19, 175–182. [Google Scholar] [CrossRef]
- Zinbarg, R.E.; Revelle, W.; Yovel, I.; Li, W. Cronbach’s α, Revelle’s β, and Mcdonald’s ωH: Their relations with each other and two alternative conceptualizations of reliability. Psychometrika 2005, 70, 123–133. [Google Scholar] [CrossRef]
- Hair, J.F., Jr.; Black, W.C.; Babin, B.B.; Anderson, R.E. Análise Multivariada de Dados, 6th ed.; Bookman Editora: Bala Cynwyd, PA, USA, 2009. [Google Scholar]
- Samejima, F. Estimation of latent ability using a response pattern of graded scores. Psychometrika 1969, 34, 1–97. [Google Scholar] [CrossRef]
- Bock, R.D.; Zimowski, M.F. Multiple Group IRT. In Handbook of Modern Item Response Theory; Springer: New York, NY, USA, 1997; pp. 433–448. [Google Scholar]
- Barbosa, A.d.S.; da Silva, L.B.; Morioka, S.N.; da Silva, J.M.N.; de Souza, V.F. Item response theory-based validation of an integrated management system measurement instrument. J. Clean. Prod. 2021, 328, 129546. [Google Scholar] [CrossRef]
- Vincenzi, S.L.; Possan, E.; de Andrade, D.F.; Pituco, M.M.; De Oliveira Santos, T.; Jasse, E.P. Assessment of environmental sustainability perception through item response theory: A case study in Brazil. J. Clean. Prod. 2018, 170, 1369–1386. [Google Scholar] [CrossRef]
- R Core Team. R: A Language and Environment for Statistical Computing; R Foundation for Statistical Computing: Vienna, Austria, 2022. [Google Scholar]
- Tezza, R.; Bornia, A.C.; De Andrade, D.F. Measuring web usability using item response theory: Principles, features and opportunities. Interact. Comput. 2011, 23, 167–175. [Google Scholar] [CrossRef] [Green Version]
- Chernyshenko, O.S.; Stark, S.; Chan, K.-Y.; Drasgow, F.; Williams, B. Fitting Item Response Theory Models to Two Personality Inventories: Issues and Insights. Multivar. Behav. Res. 2001, 36, 523–562. [Google Scholar] [CrossRef]
- Melzack, R.; Raja, S.N. The McGill Pain Questionnaire. Anesthesiology 2005, 103, 199–202. [Google Scholar] [CrossRef] [Green Version]
- Liu, Y.; Salvendy, G. Effects of measurement errors on psychometric measurements in ergonomics studies: Implications for correlations, ANOVA, linear regression, factor analysis, and linear discriminant analysis. Ergonomics 2009, 52, 499–511. [Google Scholar] [CrossRef]
- Croft, P.; Dunn, K.M.; Von Korff, M. Chronic pain syndromes: You can’t have one without another. Pain 2007, 131, 237–238. [Google Scholar] [CrossRef]
- Reenen, H.H.H.-V.; Van Der Beek, A.J.; Blatter, B.M.; Van Der Grinten, M.P.; Van Mechelen, W.; Bongers, P.M. Does musculoskeletal discomfort at work predict future musculoskeletal pain? Ergonomics 2008, 51, 637–648. [Google Scholar] [CrossRef]
- Zheng, X.; Yang, J.S. Multiple Group Item Response Theory Applications Using Stata irt Package. Measurement 2021, 19, 190–198. [Google Scholar] [CrossRef]
- Menegon, L.D.S.; Vincenzi, S.L.; de Andrade, D.F.; Barbetta, P.A.; Merino, E.A.D.; Vink, P. Design and validation of an aircraft seat comfort scale using item response theory. Appl. Ergon. 2017, 62, 216–226. [Google Scholar] [CrossRef] [PubMed]
- de Andrade, D.F.; Tavares, H.R.; da Cunha Valle, R. Teoria de Resposta Ao Item: Conceitos e Aplicações, 1st ed.; ABE: São Paulo, Brazil, 2022. [Google Scholar]
- Richardson, A.; McNoe, B.; Derrett, S.; Harcombe, H. Interventions to prevent and reduce the impact of musculoskeletal injuries among nurses: A systematic review. Int. J. Nurs. Stud. 2018, 82, 58–67. [Google Scholar] [CrossRef]
- Chiwaridzo, M.; Makotore, V.; Dambi, J.M.; Munambah, N.; Mhlanga, M. Work-related musculoskeletal disorders among registered general nurses: A case of a large central hospital in Harare, Zimbabwe. BMC Res. Notes 2018, 11, 315. [Google Scholar] [CrossRef] [PubMed] [Green Version]
- Trinkoff, A.M.; Lipscomb, J.A.; Geiger-Brown, J.; Storr, C.L.; Brady, B.A. Perceived physical demands and reported musculoskeletal problems in registered nurses. Am. J. Prev. Med. 2003, 24, 270–275. [Google Scholar] [CrossRef]
- de Araújo Vieira, E.M.; da Silva, J.M.N.; dos Santos Leite, W.K.; Lucas, R.E.C.; da Silva, L.B. Team Workload and Performance of Healthcare Workers with Musculoskeletal Symptoms. Int. J. Environ. Res. Public Health 2022, 20, 742. [Google Scholar] [CrossRef]
- Trinkoff, A.M.; Lipscomb, J.A.; Geiger-Brown, J.; Brady, B. Musculoskeletal problems of the neck, shoulder, and back and functional consequences in nurses. Am. J. Ind. Med. 2002, 41, 170–178. [Google Scholar] [CrossRef] [PubMed]
- Attar, S.M. Frequency and risk factors of musculoskeletal pain in nurses at a tertiary centre in Jeddah, Saudi Arabia: A cross sectional study. BMC Res. Notes 2014, 7, 61. [Google Scholar] [CrossRef] [PubMed] [Green Version]
- Ribeiro, N.F.; Fernandes, R.D.C.P.; Solla, D.; Junior, A.C.S.; Junior, A.S.D.S. Prevalência de distúrbios osteomusculares relacionados ao trabalho em profissionais de enfermagem. Rev. Bras. Epidemiol. 2012, 15, 429–438. [Google Scholar] [CrossRef] [PubMed] [Green Version]
- Engholm, G.; Holmström, E. Dose-Response Associations between Musculoskeletal Disorders and Physical and Psychosocial Factors among Construction Workers. Scand. J. Work Environ. Health 2005, 31, 57–67. [Google Scholar]
- Andersen, J.H.; Haahr, J.P.; Frost, P. Risk factors for more severe regional musculoskeletal symptoms: A two-year prospective study of a general working population. Arthritis Rheum. 2007, 56, 1355–1364. [Google Scholar] [CrossRef]
- Anderson, J.; Williams, A.E.; Nester, C. Musculoskeletal disorders, foot health and footwear choice in occupations involving prolonged standing. Int. J. Ind. Ergon. 2021, 81, 103079. [Google Scholar] [CrossRef]
- Smith, D.R.; Ohmura, K.; Yamagata, Z.; Minai, J. Musculoskeletal disorders among female nurses in a rural Japanese hospital. Nurs. Health Sci. 2003, 5, 185–188. [Google Scholar] [CrossRef] [PubMed]
- Jacquier-Bret, J.; Gorce, P. Prevalence of Body Area Work-Related Musculoskeletal Disorders among Healthcare Professionals: A Systematic Review. Int. J. Environ. Res. Public Health 2023, 20, 841. [Google Scholar] [CrossRef]
- Alhazim, S.S.; Al-Otaibi, S.T.; Herzallah, N.H. Knowledge, Attitudes, and Practices Regarding Ergonomic Hazards Among Healthcare Workers in a Saudi Government Hospital. J. Multidiscip. Healthc. 2022, 15, 1771–1778. [Google Scholar] [CrossRef] [PubMed]
- Mai, H.B.; Kim, J. The Role of Job Resources in the Relationship between Job Demands and Work-Related Musculoskeletal Disorders among Hospital Nurses in Thua Thien Hue Province, Vietnam. Int. J. Environ. Res. Public Health 2022, 19, 4774. [Google Scholar] [CrossRef] [PubMed]
- Bodin, J.; Garlantézec, R.; Costet, N.; Descatha, A.; Viel, J.-F.; Roquelaure, Y. Shoulder pain among male industrial workers: Validation of a conceptual model in two independent French working populations. Appl. Ergon. 2020, 85, 103075. [Google Scholar] [CrossRef] [PubMed]
- de Souza, D.S.F.; da Silva, J.M.N.; Santos, J.V.D.O.; Alcântara, M.S.B.; Torres, M.G.L. Influence of risk factors associated with musculoskeletal disorders on an inner population of northeastern Brazil. Int. J. Ind. Ergon. 2021, 86, 103198. [Google Scholar] [CrossRef]
- Lundberg, U.; Granqvist, M.; Hansson, T.; Magnusson, M.; Wallin, L. Psychological and physiological stress responses during repetitive work at an assembly line. Work Stress 1989, 3, 143–153. [Google Scholar] [CrossRef]
- Bathman, L.M.; Almond, J.; Hazi, A.; Wright, B.J. Effort–reward imbalance at work and pre-clinical biological indices of ill-health: The case for salivary immunoglobulin A. Brain Behav. Immun. 2013, 33, 74–79. [Google Scholar] [CrossRef]
- da Silva, J.M.N.; Vergara, L.L.; Gontijo, L.A.; Vieira, E.M.; dos Santos, W.K.; Torres, M.G.L. Analysis of the Impact of Stress Caused by Musculoskeletal Pain in the Development of New Work-Related Musculoskeletal Disorders (WRMDs). Rev. Espac. 2017, 38, 9. [Google Scholar]
- Tavakkol, R.; Karimi, A.; Hassanipour, S.; Gharahzadeh, A.; Fayzi, R. A Multidisciplinary Focus Review of Musculoskeletal Disorders Among Operating Room Personnel. J. Multidiscip. Healthc. 2020, 13, 735–741. [Google Scholar] [CrossRef] [PubMed]
- Mohan, V.; Justine, M.; Jagannathan, M.; Aminudin, S.B.; Johari, S.H.B. Preliminary study of the patterns and physical risk factors of work-related musculoskeletal disorders among academicians in a higher learning institute. J. Orthop. Sci. 2015, 20, 410–417. [Google Scholar] [CrossRef] [PubMed]
- Solis-Soto, M.T.; Schön, A.; Solis-Soto, A.; Parra, M.; Radon, K. Prevalence of musculoskeletal disorders among school teachers from urban and rural areas in Chuquisaca, Bolivia: A cross-sectional study. BMC Musculoskelet. Disord. 2017, 18, 12. [Google Scholar] [CrossRef] [PubMed]
- Alias, A.N.; Karuppiah, K.; How, V.; Perumal, V. Prevalence of musculoskeletal disorders (MSDS) among primary school female teachers in Terengganu, Malaysia. Int. J. Ind. Ergon. 2020, 77, 102957. [Google Scholar] [CrossRef]
- Erick, P.N.; Smith, D.R. A systematic review of musculoskeletal disorders among school teachers. BMC Musculoskelet. Disord. 2011, 12, 260. [Google Scholar] [CrossRef] [Green Version]
- Cardoso, J.P.; Ribeiro, I.D.Q.B.; de Araújo, T.M.; Carvalho, F.M.; dos Reis, E.J.F.B. Prevalência de dor musculoesquelética em professores. Rev. Bras. Epidemiol. 2009, 12, 604–614. [Google Scholar] [CrossRef] [Green Version]
- Vaghela, N.; Parekh, S. Prevalence of the musculoskeletal disorder among school teachers. Natl. J. Physiol. Pharm. Pharmacol. 2017, 8, 197–201. [Google Scholar] [CrossRef]
- Amit, L.M.; Malabarbas, G.T. Prevalence and Risk-Factors of Musculoskeletal Disorders Among Provincial High School Teachers in the Philippines. J. UOEH 2020, 42, 151–160. [Google Scholar] [CrossRef]
- Chiu, T.T.W.; Lam, P.K.W. The Prevalence of and Risk Factors for Neck Pain and Upper Limb Pain among Secondary School Teachers in Hong Kong. J. Occup. Rehabil. 2006, 17, 19–32. [Google Scholar] [CrossRef]
- Candan, S.A.; Sahin, U.K.; Akoğlu, S. The investigation of work-related musculoskeletal disorders among female workers in a hazelnut factory: Prevalence, working posture, work-related and psychosocial factors. Int. J. Ind. Ergon. 2019, 74, 102838. [Google Scholar] [CrossRef]
- Szczygieł, E.; Zielonka, K.; Mętel, S.; Golec, J. Musculo-skeletal and pulmonary effects of sitting position—A systematic review. Ann. Agric. Environ. Med. 2017, 24, 8–12. [Google Scholar] [CrossRef] [PubMed]
- Lizana, P.A.; Aballay, J.; Vicente-Rodríguez, G.; Gómez-Bruton, A. Low interest in physical activity and higher rates of obesity among rural teachers. Work 2020, 67, 1015–1022. [Google Scholar] [CrossRef] [PubMed]
- Shiri, R.; Karppinen, J.; Leino-Arjas, P.; Solovieva, S.; Viikari-Juntura, E. The Association Between Obesity and Low Back Pain: A Meta-Analysis. Am. J. Epidemiol. 2009, 171, 135–154. [Google Scholar] [CrossRef] [Green Version]
- Colim, A.; Arezes, P.; Flores, P.; Braga, A. Kinematics differences between obese and non-obese workers during vertical handling tasks. Int. J. Ind. Ergon. 2020, 77, 102955. [Google Scholar] [CrossRef]
- da Silva, I.L.; de Souza, E.R.M.; Silva, L.K.D.; da Silva, A.T.C.; da Silva, J.M.N. Effects of multiple risk factors on upper limb musculoskeletal disorders among workers in inner Brazil. Work 2022, 72, 885–900. [Google Scholar] [CrossRef] [PubMed]
- Smith, D.R. The Prevalence and Risk Factors for Musculoskeletal Disorders among School Teachers in Botswana. Occup. Med. Health Aff. 2014, 2, 29. [Google Scholar] [CrossRef] [Green Version]
- Leme, A.; Maia, I. Evaluation of Fatigue at Work in Teachers using Modern Resources in the Classroom. Procedia Manuf. 2015, 3, 4852–4859. [Google Scholar] [CrossRef]
- Elsherbeny, E.; Elhadidy, S.; El-Masry, R.; El-Bahnasawy, A. Prevalence and Associated Factors of Musculoskeletal Complaints among Nurses of Mansoura University Children Hospital. Egypt. J. Occup. Med. 2018, 42, 151–166. [Google Scholar] [CrossRef] [Green Version]
- Roja, Z.; Kalkis, H.; Roja, I. Measuring Muscle Fatigue in Relation to the Workload of Health Care Workers. Procedia Manuf. 2015, 3, 4189–4196. [Google Scholar] [CrossRef] [Green Version]
- Ono, Y.; Imaeda, T.; Shimaoka, M.; Hiruta, S.; Hattori, Y.; Ando, S.; Hori, F.; Tatsumi, A. Associations of Length of Employment and Working Conditions with Neck, Shoulder and Arm Pain among Nursery Scool Teachers. Ind. Health 2002, 40, 149–158. [Google Scholar] [CrossRef] [Green Version]
- Filho, J.C.; Nunhes, T.V.; Oliveira, O.J. Guidelines for cleaner production implementation and management in the plastic footwear industry. J. Clean. Prod. 2019, 232, 822–838. [Google Scholar] [CrossRef]
- Da Silva, J.M.N.; Da Silva, L.B.; Gontijo, L.A. Relationship between psychosocial factors and musculoskeletal disorders in footwear industry workers. Production 2017, 27, 1–13. [Google Scholar] [CrossRef] [Green Version]
- Leite, W.K.D.S.; Araújo, A.J.D.S.; da Silva, J.M.N.; Gontijo, L.A.; Vieira, E.M.D.A.; de Souza, E.L.; Colaço, G.A.; da Silva, L.B. Risk factors for work-related musculoskeletal disorders among workers in the footwear industry: A cross-sectional study. Int. J. Occup. Saf. Ergon. 2019, 27, 393–409. [Google Scholar] [CrossRef]
- dos Santos Leite, W.K.; da Silva Araújo, A.J.; da Silva, L.B.; da Silva, J.M.; de Souza, E.L.; da Silva, A.S.; da Fonseca Neves, R.; de Araujo Vieira, E.M. Presenteeism in the Footwear Industry: An Analysis of the Workloads. Rev. Psicol. Organ. Trab. (rPOT) 2022, 22, 1804–1814. [Google Scholar] [CrossRef]
- Bispo, L.G.M.; da Silva, J.M.N.; Bolis, I.; Leite, W.K.D.S.; Vieira, E.M.D.A.; Colaço, G.A.; de Souza, E.L.; Gontijo, L.A.; da Silva, L.B. Effects of a worksite physical activities program among men and women: An interventional study in a footwear industry. Appl. Ergon. 2019, 84, 103005. [Google Scholar] [CrossRef]
- Correia, L.M.A.D.M.; da Silva, J.M.N.; Leite, W.K.D.S.; Lucas, R.E.C.; Colaço, G.A. A multicriteria decision model to rank workstations in a footwear industry based on a FITradeoff-ranking method for ergonomics interventions. Oper. Res. 2022, 22, 3335–3371. [Google Scholar] [CrossRef]
- Lourinho, M.G.; Negreiros, G.R.; De Almeida, L.B.; Vieira, E.; Quemelo, P.R.V. Riscos de lesão musculoesquelética em diferentes setores de uma empresa calçadista. Fisioter. e Pesqui. 2011, 18, 252–257. [Google Scholar] [CrossRef] [Green Version]
- Govindu, N.K.; Babski-Reeves, K. Effects of personal, psychosocial and occupational factors on low back pain severity in workers. Int. J. Ind. Ergon. 2012, 44, 335–341. [Google Scholar] [CrossRef]
- Kanniappan, V.; Palani, V. Prevalence of Musculoskeletal Disorders among Sewing Machine Workers in a Leather Industry. J. Lifestyle Med. 2020, 10, 121–125. [Google Scholar] [CrossRef]
- Vieira, E.R.; Serra, M.V.G.B.; de Almeida, L.B.; Villela, W.V.; Scalon, J.D.; Quemelo, P.R.V. Symptoms and risks for musculoskeletal disorders among male and female footwear industry workers. Int. J. Ind. Ergon. 2015, 48, 110–116. [Google Scholar] [CrossRef]
- Guimarães, L.M.; Ribeiro, J.; Renner, J. Cost–benefit analysis of a socio-technical intervention in a Brazilian footwear company. Appl. Ergon. 2012, 43, 948–957. [Google Scholar] [CrossRef] [PubMed]


| Variable | G1 (N = 167) | G2 (N = 159) | G3 (N = 401) |
|---|---|---|---|
| n (%) | n (%) | n (%) | |
| Sex | |||
| Men | 33 (19.76) | 37 (23.27) | 350 (87.28) |
| Women | 134 (80.24) | 122 (76.73) | 51 (12.72) |
| Age | |||
| 18–20 | 2 (2.98) | 5 (3.14) | 28 (6.98) |
| 21–30 | 41 (22.79) | 41 (25.78) | 223 (55.61) |
| 31–40 | 51 (30.53) | 40 (25.15) | 98 (24.44) |
| 41–50 | 54 (32.33) | 54 (33.96) | 33 (8.23) |
| >50 | 19 (11.37) | 19 (11.97) | 19 (4.74) |
| BMI | |||
| Underweight | 4 (2.39) | 6 (3.77) | 16 (3.99) |
| Normal weight | 63 (37.72) | 98 (61.63) | 192 (47.88) |
| Overweight | 65 (38.92) | 40 (25.15) | 148 (36.91) |
| Grade I obesity | 24 (14.37) | 14 (8.80) | 33 (8.23) |
| Grade II obesity | 7 (4.21) | 1 (0.65) | 10 (2.49) |
| Grade III obesity | 4 (2.39) | 0 (0.00) | 2 (0.50) |
| Years at company | |||
| 1–5 | 70 (41.92) | 54 (33.96) | 203 (50.62) |
| 6–10 | 52 (31.14) | 13 (8.17) | 103 (25.69) |
| 11–15 | 12 (7.18) | 28 (17.62) | 59 (14.71) |
| 16–20 | 12 (7.18) | 29 (18.24) | 23 (5.74) |
| >20 | 21 (12.58) | 35 (22.01) | 13 (3.24) |
| Body Region | G1 (N = 167) | G2 (N = 159) | G3 (N = 401) |
|---|---|---|---|
| n (%) | n (%) | n (%) | |
| Left thigh | |||
| Never | 130 (77.84) | 110 (69.18) | 91 (22.69) |
| Rarely | 14 (8.38) | 14 (8.81) | 168 (41.90) |
| Often | 11 (6.59) | 13 (8.18) | 83 (20.70) |
| Daily | 12 (7.19) | 22 (13.84) | 59 (14.71) |
| Right thigh | |||
| Never | 136 (81.44) | 111 (69.81) | 115 (28.68) |
| Rarely | 9 (5.39) | 21 (13.21) | 161 (40.15) |
| Often | 12 (7.19) | 9 (5.66) | 77 (19.20) |
| Daily | 10 (5.99) | 18 (11.32) | 48 (11.97) |
| Left knee | |||
| Never | 107 (64.07) | 85 (53.46) | 183 (45.64) |
| Rarely | 26 (15.57) | 34 (21.38) | 94 (23.44) |
| Often | 12 (7.19) | 17 (10.69) | 61 (15.21) |
| Daily | 22 (13.17) | 23 (14.47) | 63 (15.71) |
| Right knee | |||
| Never | 109 (65.27) | 84 (52.83) | 181 (45.14) |
| Rarely | 27 (16.17) | 33 (20.75) | 94 (23.44) |
| Often | 15 (8.98) | 20 (12.58) | 64 (15.96) |
| Daily | 16 (9.58) | 22 (13.84) | 62 (15.46) |
| Left leg | |||
| Never | 108 (64.67) | 89 (55.97) | 222 (55.36) |
| Rarely | 25 (14.97) | 24 (15.09) | 81 (20.20) |
| Often | 14 (8.38) | 13 (8.18) | 59 (14.71) |
| Daily | 20 (11.98) | 33 (20.75) | 39 (9.73) |
| Right leg | |||
| Never | 106 (63.47) | 85 (53.46) | 225 (56.11) |
| Rarely | 24 (14.37) | 30 (18.87) | 76 (18.95) |
| Often | 19 (11.38) | 15 (9.43) | 62 (15.46) |
| Daily | 18 (10.78) | 29 (18.24) | 38 (9.48) |
| Hips | |||
| Never | 112 (67.07) | 78 (49.06) | 227 (56.61) |
| Rarely | 22 (13.17) | 26 (16.35) | 72 (17.96) |
| Often | 10 (5.99) | 24 (15.09) | 48 (11.97) |
| Daily | 23 (13.77) | 31 (19.50) | 54 (13.47) |
| Left foot | |||
| Never | 117 (70.06) | 103 (64.78) | 164 (40.90) |
| Rarely | 14 (8.38) | 22 (13.84) | 97 (24.19) |
| Often | 17 (10.18) | 12 (7.55) | 63 (15.71) |
| Daily | 19 (11.38) | 22 (13.84) | 77 (19.20) |
| Right foot | |||
| Never | 113 (67.66) | 101 (63.52) | 155 (38.65) |
| Rarely | 16 (9.58) | 20 (12.58) | 101 (25.19) |
| Often | 21 (12.57) | 12 (7.55) | 71 (17.71) |
| Daily | 17 (10.18) | 26 (16.35) | 74 (18.45) |
| Body Region | Parameters | |||||
|---|---|---|---|---|---|---|
| F | h2 | a | b1 | b2 | b3 | |
| Group 1 | ||||||
| Left thigh | 0.683 | 0.467 | 1.593 | 1.169 | 1.696 | 2.311 |
| Right thigh | 0.773 | 0.597 | 2.072 | 1.245 | 1.565 | 2.176 |
| Left knee | 0.741 | 0.548 | 1.875 | 0.511 | 1.177 | 1.593 |
| Right knee | 0.741 | 0.548 | 1.875 | 0.539 | 1.265 | 1.886 |
| Left leg | 0.751 | 0.563 | 1.932 | 0.527 | 1.170 | 1.675 |
| Right leg | 0.791 | 0.625 | 2.197 | 0.473 | 1.056 | 1.679 |
| Hips | 0.649 | 0.422 | 1.453 | 0.690 | 1.379 | 1.792 |
| Left foot | 0.737 | 0.544 | 1.858 | 0.741 | 1.121 | 1.750 |
| Right foot | 0.708 | 0.501 | 1.706 | 0.674 | 1.104 | 1.908 |
| Group 2 | ||||||
| Left thigh | 0.770 | 0.593 | 2.055 | 0.711 | 1.096 | 1.527 |
| Right thigh | 0.765 | 0.586 | 2.023 | 0.749 | 1.340 | 1.678 |
| Left knee | 0.668 | 0.446 | 1.527 | 0.093 | 0.994 | 1.625 |
| Right knee | 0.726 | 0.527 | 1.798 | 0.123 | 0.950 | 1.592 |
| Left leg | 0.764 | 0.584 | 2.014 | 0.200 | 0.792 | 1.172 |
| Right leg | 0.778 | 0.605 | 2.108 | 0.119 | 0.842 | 1.261 |
| Hips | 0.538 | 0.289 | 1.086 | −0.049 | 0.741 | 1.625 |
| Left foot | 0.730 | 0.533 | 1.817 | 0.549 | 1.148 | 1.581 |
| Right foot | 0.776 | 0.602 | 2.091 | 0.491 | 0.995 | 1.363 |
| Group 3 | ||||||
| Left thigh | 0.680 | 0.462 | 1.577 | −1.038 | 0.627 | 1.599 |
| Right thigh | 0.730 | 0.534 | 1.820 | −0.727 | 0.731 | 1.678 |
| Left knee | 0.857 | 0.735 | 2.835 | −0.112 | 0.568 | 1.202 |
| Right knee | 0.845 | 0.714 | 2.691 | −0.129 | 0.575 | 1.245 |
| Left leg | 0.819 | 0.671 | 2.433 | 0.161 | 0.850 | 1.660 |
| Right leg | 0.822 | 0.675 | 2.453 | 0.190 | 0.831 | 1.668 |
| Hips | 0.636 | 0.404 | 1.402 | 0.263 | 1.036 | 1.768 |
| Left foot | 0.880 | 0.775 | 3.161 | −0.250 | 0.438 | 1.003 |
| Right foot | 0.862 | 0.743 | 2.896 | −0.323 | 0.408 | 1.065 |
| Minimal | Mild | Low | Moderate | High | Severe | Maximum | |
|---|---|---|---|---|---|---|---|
| Body Regions | 45 | 50 | 55 | 60 | 65 | 70 | 75 |
| Group 1 | |||||||
| Left thigh | A2 | A3 | A4 | ||||
| Right thigh | A2 | A3 | A4 | ||||
| Left knee | A2 | A3 | A4 | ||||
| Right knee | A2 | A3 | A4 | ||||
| Left leg | A2 | A3 | A4 | ||||
| Right leg | A2 | A3 | A4 | ||||
| Hips | A2 | A3 | A4 | ||||
| Left foot | A2 | A3 | A4 | ||||
| Right foot | A2 | A3 | A4 | ||||
| Group 2 | |||||||
| Left thigh | A2 | A3 | A4 | ||||
| Right thigh | A2 | A3 | A4 | ||||
| Left knee | A2 | A3 | A4 | ||||
| Right knee | A2 | A3 | A4 | ||||
| Left leg | A2 | A3 | A4 | ||||
| Right leg | A2 | A3 | A4 | ||||
| Hips | A2 | A3 | A4 | ||||
| Left foot | A2 | A3 | A4 | ||||
| Right foot | A2 | A3 | A4 | ||||
| Group 3 | |||||||
| Left thigh | A2 | A3 | A4 | ||||
| Right thigh | A2 | A3 | A4 | ||||
| Left knee | A2 | A3 | A4 | ||||
| Right knee | A2 | A3 | A4 | ||||
| Left leg | A2 | A3 | A4 | ||||
| Right leg | A2 | A3 | A4 | ||||
| Hips | A2 | A3 | A4 | ||||
| Left foot | A2 | A3 | A4 | ||||
| Right foot | A2 | A3 | A4 |
Disclaimer/Publisher’s Note: The statements, opinions and data contained in all publications are solely those of the individual author(s) and contributor(s) and not of MDPI and/or the editor(s). MDPI and/or the editor(s) disclaim responsibility for any injury to people or property resulting from any ideas, methods, instructions or products referred to in the content. |
© 2023 by the authors. Licensee MDPI, Basel, Switzerland. This article is an open access article distributed under the terms and conditions of the Creative Commons Attribution (CC BY) license (https://creativecommons.org/licenses/by/4.0/).
Share and Cite
da Silva, J.G.; da Silva, J.M.N.; Bispo, L.G.M.; de Souza, D.S.F.; Serafim, R.S.; Torres, M.G.L.; Leite, W.K.d.S.; Vieira, E.M.d.A. Construction of a Musculoskeletal Discomfort Scale for the Lower Limbs of Workers: An Analysis Using the Multigroup Item Response Theory. Int. J. Environ. Res. Public Health 2023, 20, 5307. https://doi.org/10.3390/ijerph20075307
da Silva JG, da Silva JMN, Bispo LGM, de Souza DSF, Serafim RS, Torres MGL, Leite WKdS, Vieira EMdA. Construction of a Musculoskeletal Discomfort Scale for the Lower Limbs of Workers: An Analysis Using the Multigroup Item Response Theory. International Journal of Environmental Research and Public Health. 2023; 20(7):5307. https://doi.org/10.3390/ijerph20075307
Chicago/Turabian Styleda Silva, Joel Gomes, Jonhatan Magno Norte da Silva, Lucas Gomes Miranda Bispo, Deividson Sá Fernandes de Souza, Rômulo Silva Serafim, Manoel Gerônimo Lino Torres, Wilza Karla dos Santos Leite, and Elamara Marama de Araujo Vieira. 2023. "Construction of a Musculoskeletal Discomfort Scale for the Lower Limbs of Workers: An Analysis Using the Multigroup Item Response Theory" International Journal of Environmental Research and Public Health 20, no. 7: 5307. https://doi.org/10.3390/ijerph20075307