


Liver Function in Patients with Long-Term Coronavirus Disease 2019 of up to 20 Months: A Cross-Sectional Study
 , ,
, ,  and
and 
Abstract
:1. Introduction
2. Materials and Methods
2.1. Type of Study and Ethical Aspects
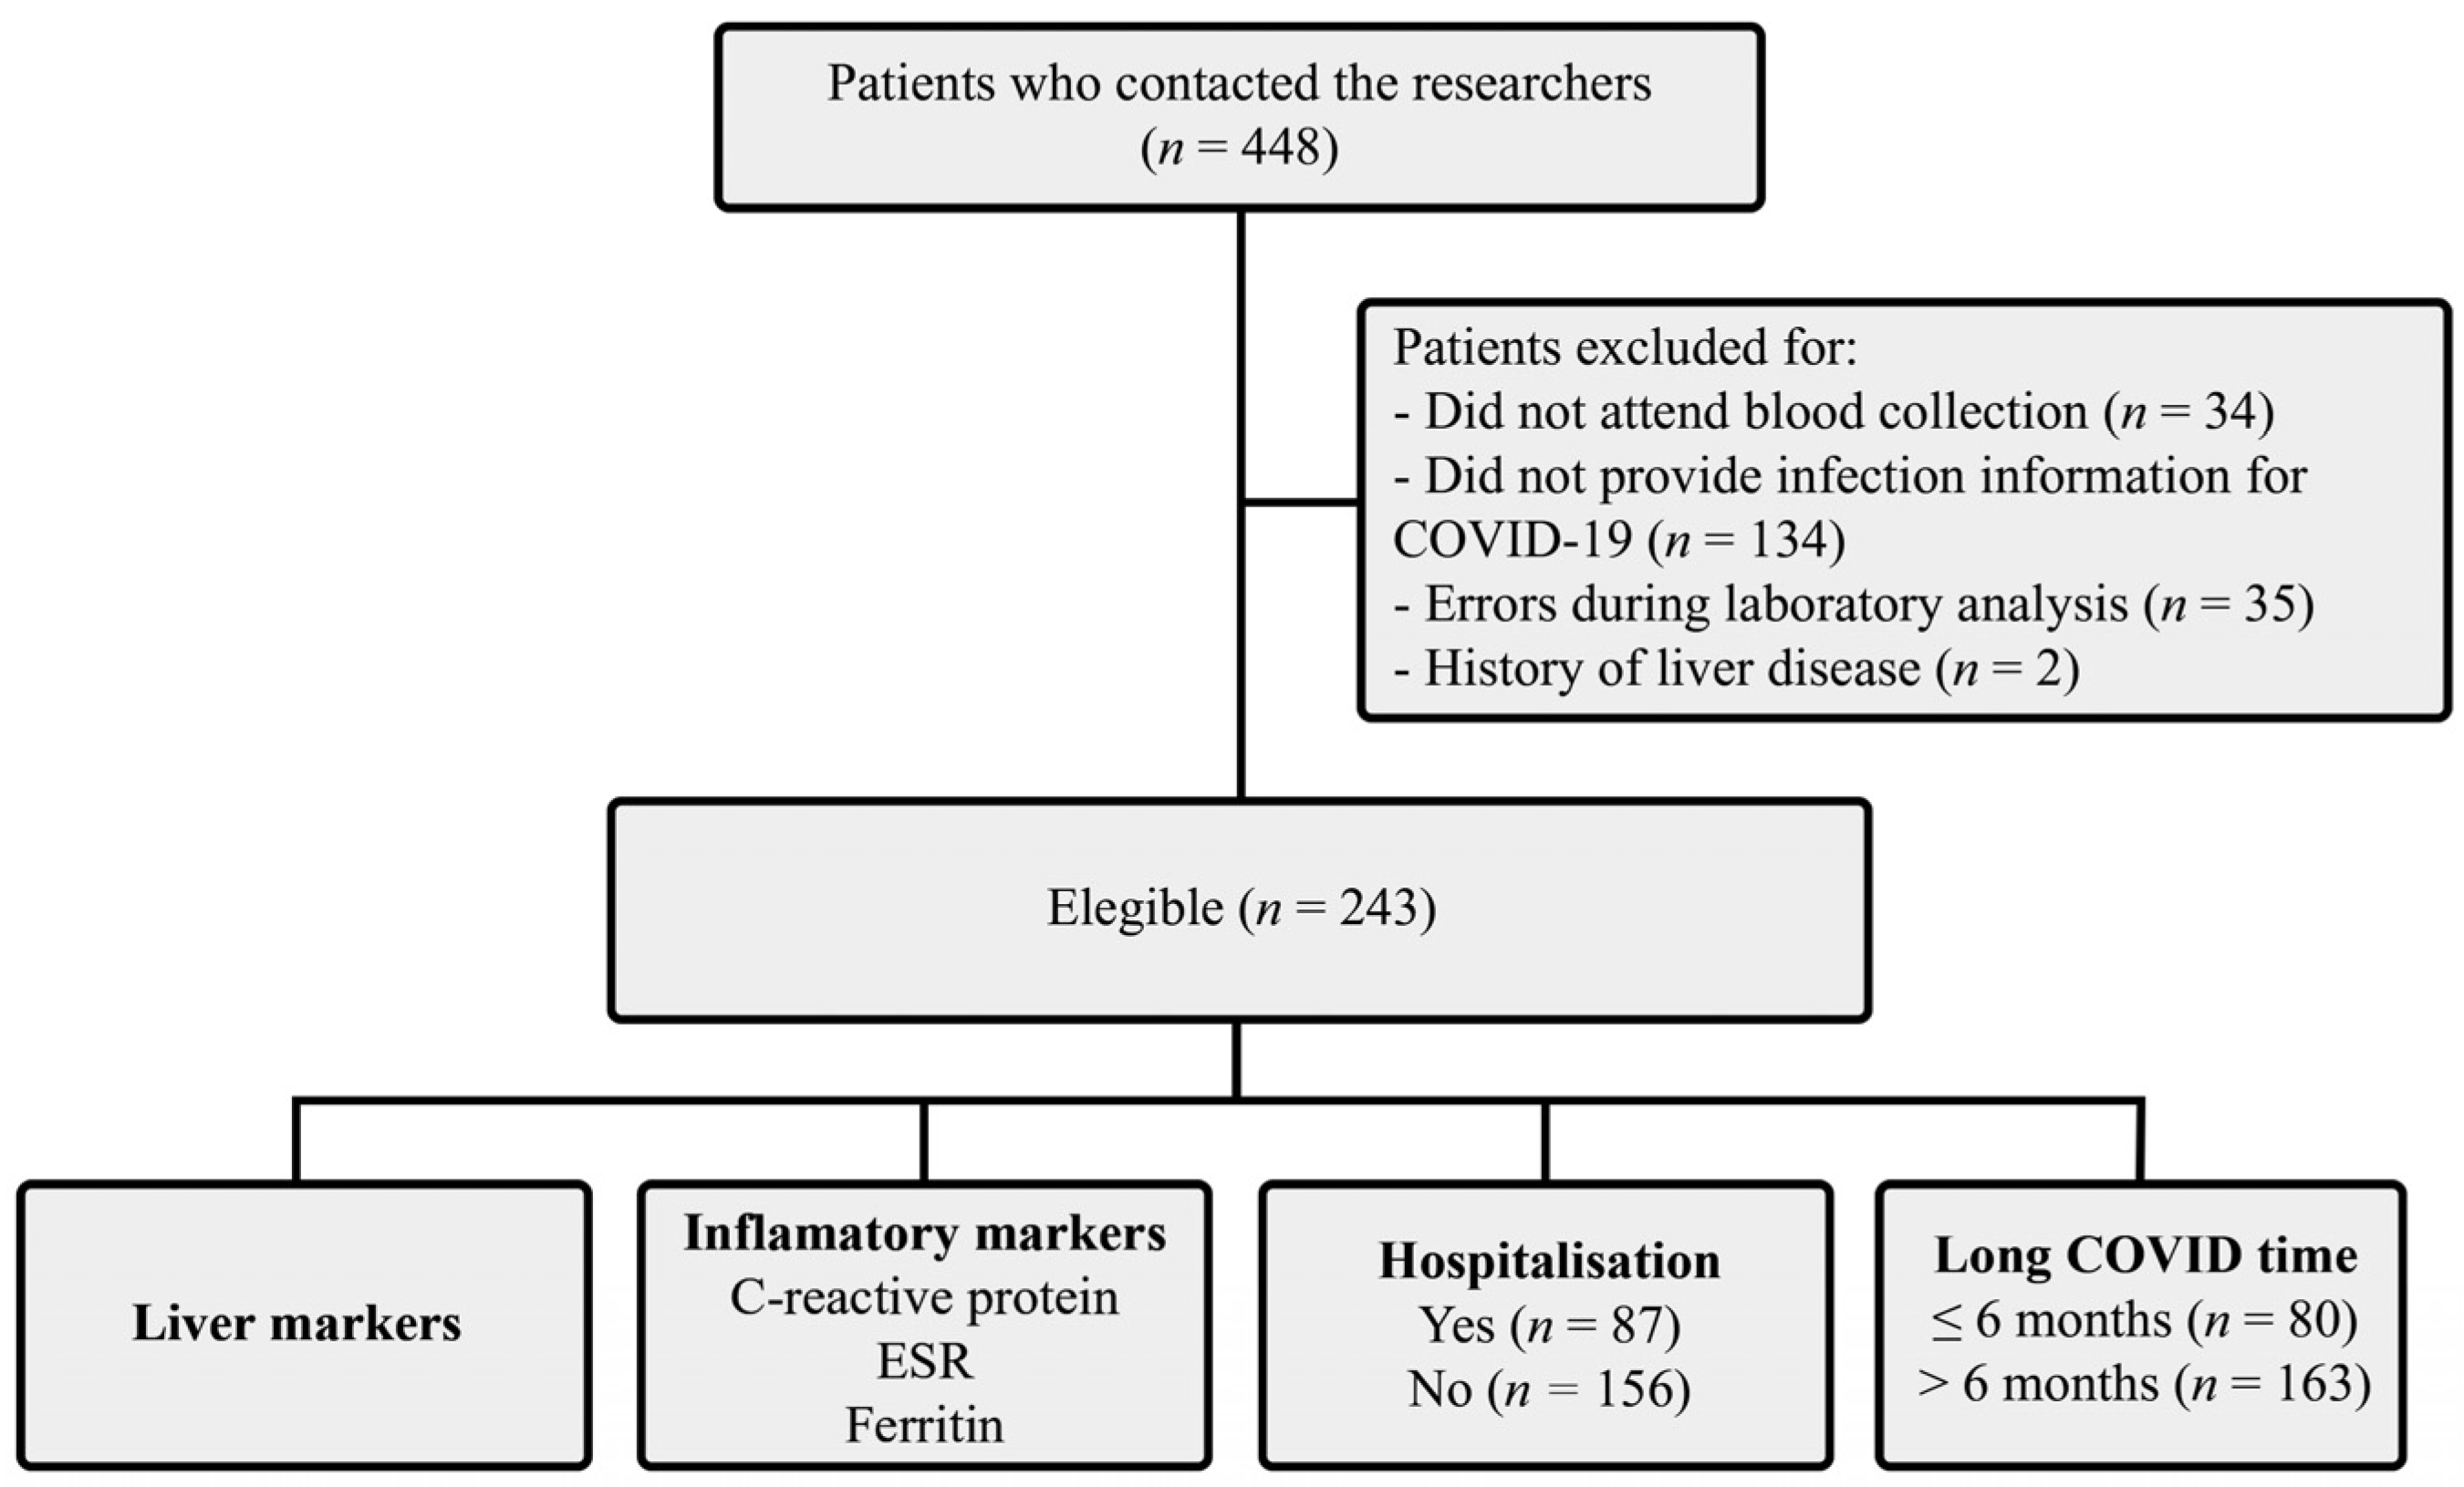
2.2. Sampling and Study Population
2.3. Clinical Data
2.4. Liver Function Data
2.5. Statistical Analysis
3. Results
4. Discussion
5. Conclusions
Supplementary Materials
Author Contributions
Funding
Institutional Review Board Statement
Informed Consent Statement
Data Availability Statement
Acknowledgments
Conflicts of Interest
References
- Greenhalgh, T.; Knight, M.; A’Court, C.; Buxton, M.; Husain, L. Management of post-acute COVID-19 in primary care. Brit. Med. J. 2020, 370, 1–8. [Google Scholar] [CrossRef] [PubMed]
- Wu, Z.; McGoogan, J.M. Characteristics of and important lessons from the coronavirus disease 2019 (COVID-19) outbreak in China: Summary of a report of 72,314 cases from the Chinese Center for Disease Control and Prevention. JAMA 2020, 323, 1239–1242. [Google Scholar] [CrossRef] [PubMed]
- Carfì, A.; Bernabei, R.; Landi, F. Persistent symptoms in patients after acute COVID-19. JAMA 2020, 324, 603–605. [Google Scholar] [CrossRef] [PubMed]
- Sudre, C.H.; Murray, B.; Varsavsky, T.; Graham, M.S.; Penfold, R.S.; Bowyer, R.C.; Pujol, J.C.; Klaser, K.; Antonelli, M.; Canas, L.S.; et al. Attributes and predictors of long COVID. Nat. Med. 2021, 27, 626–631. [Google Scholar] [CrossRef] [PubMed]
- Halpin, S.J.; McIvor, C.; Whyatt, G.; Adams, A.; Harvey, O.; McLean, L.; Walshaw, C.; Kemp, S.; Corrado, J.; Singh, R.; et al. Postdischarge symptoms and rehabilitation needs in survivors of COVID-19 infection: A cross-sectional evaluation. J. Med. Virol. 2021, 93, 1013–1022. [Google Scholar] [CrossRef]
- Kamal, M.; Abo Omirah, M.; Hussein, A.; Saeed, H. Assessment and characterisation of post-COVID-19 manifestations. Int. J. Clin. Pract. 2021, 75, e13746. [Google Scholar] [CrossRef]
- Schaefer, E.A.K.; Arvind, A.; Bloom, P.P.; Chung, R.T. Interrelationship between coronavirus infection and liver disease. Clin. Liver Dis. 2020, 21, 175–180. [Google Scholar] [CrossRef]
- Mehandru, S.; Merad, M. Pathological sequelae of long-haul COVID. Nat. Immunol. 2022, 23, 194–202. [Google Scholar] [CrossRef]
- Saviano, A.; Wrensch, F.; Ghany, M.G.; Baumert, T.F. Liver disease and coronavirus disease 2019: From pathogenesis to clinical care. Hepatology 2021, 74, 1088–1100. [Google Scholar] [CrossRef]
- Xu, L.; Liu, J.; Lu, M.; Yang, D.; Zheng, X. Liver injury during highly pathogenic human coronavirus infections. Liver Int. 2020, 40, 998–1004. [Google Scholar] [CrossRef] [Green Version]
- Roth, N.C.; Kim, A.; Vitkovski, T.; Xia, J.; Ramirez, G.; Bernstein, D.; Crawford, J.M. Post-COVID-19 cholangiopathy: A novel entity. Am. J. Gastroenterol. 2021, 116, 1077–1082. [Google Scholar] [CrossRef] [PubMed]
- Phetsouphanh, C.; Darley, D.R.; Wilson, D.B.; Howe, A.; Munier, C.M.L.; Patel, S.K.; Juno, J.A.; Burrell, L.M.; Kent, S.J.; Dore, G.J.; et al. Immunological dysfunction persists for 8 months following initial mild-to-moderate SARS-CoV-2 infection. Nat. Immunol. 2022, 23, 210–216. [Google Scholar] [CrossRef] [PubMed]
- Al-Aly, Z.; Xie, Y.; Bowe, B. High-dimensional characterization of post-acute sequelae of COVID-19. Nature 2021, 594, 259–264. [Google Scholar] [CrossRef] [PubMed]
- Higgins, V.; Sohaei, D.; Diamandis, E.P.; Prassas, I. COVID-19: From an acute to chronic disease? Potential long-term health consequences. Crit. Rev. Clin. Lab. Sci. 2021, 58, 297–310. [Google Scholar] [CrossRef]
- Lopez-Leon, S.; Wegman-Ostrosky, T.; Perelman, C.; Sepulveda, R.; Rebolledo, P.A.; Cuapio, A.; Villapol, S. More than 50 long-term effects of COVID-19: A systematic review and meta-analysis. Sci. Rep. 2021, 11, 16144. [Google Scholar] [CrossRef]
- Mandal, S.; Barnett, J.; Brill, S.E.; Brown, J.S.; Denneny, E.K.; Hare, S.S.; Heightman, M.; Hillman, T.E.; Jacob, J.; Jarvis, H.C.; et al. ‘Long-COVID’: A cross-sectional study of persisting symptoms, biomarker and imaging abnormalities following hospitalisation for COVID-19. Thorax 2021, 76, 396–398. [Google Scholar] [CrossRef]
- Bende, F.; Tudoran, C.; Sporea, I.; Fofiu, R.; Bâldea, V.; Cotrău, R.; Popescu, A.; Sirli, R.; Ungureanu, B.S.; Tudoran, M. A multidisciplinary approach to evaluate the presence of hepatic and cardiac abnormalities in patients with post-acute COVID-19 syndrome—A pilot study. J. Clin. Med. 2021, 10, 2507. [Google Scholar] [CrossRef]
- An, Y.W.; Song, S.; Li, W.X.; Chen, Y.X.; Hu, X.P.; Zhao, J.; Li, Z.W.; Jiang, G.Y.; Wang, C.; Wang, J.C.; et al. Liver function recovery of COVID-19 patients after discharge, a follow-up study. Int. J. Med. Sci. 2021, 18, 176–186. [Google Scholar] [CrossRef]
- Gameil, M.A.; Marzouk, R.E.; Elsebaie, A.H.; Rozaik, S.E. Long-term clinical and biochemical residue after COVID-19 recovery. Egypt Liver J. 2021, 11, 74. [Google Scholar] [CrossRef]
- Patterson, B.K.; Francisco, E.B.; Yogendra, R.; Long, E.; Pise, A.; Rodrigues, H.; Hall, E.; Herrera, M.; Parikh, P.; Guevara-Coto, J.; et al. Persistence of SARS CoV-2 S1 protein in CD16+ monocytes in post-acute sequelae of COVID-19 (PASC) up to 15 months post-infection. Front. Immunol. 2022, 12, 746021. [Google Scholar] [CrossRef]
- Kumar-M, P.; Mishra, S.; Jha, D.K.; Shukla, J.; Choudhury, A.; Mohindra, R.; Mandavdhare, H.S.; Dutta, U.; Sharma, V. Coronavirus disease (COVID-19) and the liver: A comprehensive systematic review and meta-analysis. Hepatol. Int. 2020, 14, 711–722. [Google Scholar] [CrossRef]
- Wu, Y.; Li, H.; Guo, X.; Yoshida, E.M.; Mendez-Sanchez, N.; Levi Sandri, G.B.; Teschke, R.; Romeiro, F.G.; Shukla, A.; Qi, X. Incidence, risk factors, and prognosis of abnormal liver biochemical tests in COVID-19 patients: A systematic review and meta-analysis. Hepatol. Int. 2020, 14, 621–637. [Google Scholar] [CrossRef] [PubMed]
- Bloom, P.P.; Meyerowitz, E.A.; Reinus, Z.; Daidone, M.; Gustafson, J.; Kim, A.Y.; Schaefer, E.; Chung, R.T. Liver biochemistries in hospitalized patients with COVID-19. Hepatology 2021, 73, 890–900. [Google Scholar] [CrossRef] [PubMed]
- Sugimoto, K.; Moriyasu, F.; Oshiro, H.; Takeuchi, H.; Yoshimasu, Y.; Kasai, Y.; Furuichi, Y.; Itoi, T. Viscoelasticity measurement in rat livers using shear-wave US elastography. Ultrasound Med. Biol. 2018, 44, 2018–2024. [Google Scholar] [CrossRef] [PubMed]
- Marjot, T.; Webb, G.J.; Barritt, A.S., IV; Moon, A.M.; Stamataki, Z.; Wong, V.W.; Barnes, E. COVID-19 and liver disease: Mechanistic and clinical perspectives. Nat. Rev. Gastroenterol. Hepatol. 2021, 18, 348–364. [Google Scholar] [CrossRef] [PubMed]
- Fan, B.E.; Chong, V.C.L.; Chan, S.S.W.; Lim, G.H.; Lim, K.G.E.; Tan, G.B.; Mucheli, S.S.; Kuperan, P.; Ong, K.H. Hematologic parameters in patients with COVID-19 infection. Am. J. Hematol. 2020, 95, E131–E134. [Google Scholar] [CrossRef] [Green Version]
- Shi, H.; Han, X.; Jiang, N.; Cao, Y.; Alwalid, O.; Gu, J.; Fan, Y.; Zheng, C. Radiological findings from 81 patients with COVID-19 pneumonia in Wuhan, China: A descriptive study. Lancet Infect. Dis. 2020, 20, 425–434. [Google Scholar] [CrossRef]
- Xu, Z.; Shi, L.; Wang, Y.; Zhang, J.; Huang, L.; Zhang, C.; Liu, S.; Zhao, P.; Liu, H.; Zhu, L.; et al. Pathological findings of COVID-19 associated with acute respiratory distress syndrome. Lancet Respir. Med. 2020, 8, 420–422. [Google Scholar] [CrossRef]
- Boeckmans, J.; Rodrigues, R.M.; Demuyser, T.; Piérard, D.; Vanhaecke, T.; Rogiers, V. COVID-19 and drug-induced liver injury: A problem of plenty or a petty point? Arch. Toxicol. 2020, 94, 1367–1369. [Google Scholar] [CrossRef] [Green Version]
- Olry, A.; Meunier, L.; Délire, B.; Larrey, D.; Horsmans, Y.; Le Louët, H. Drug-induced liver injury and COVID-19 infection: The rules remain the same. Drug Saf. 2020, 43, 615–617. [Google Scholar] [CrossRef]


| Variables | Patients |
|---|---|
| Women, n (%) | 159 (65.43) |
| Age (mean ± SD, years) | 49.33 ± 12.83 |
| Smoker/ex-smoker | 70 (28.80) |
| Long COVID symptoms (n, %) | |
| Fatigue | 184 (75.72) |
| Dyspnoea | 178 (73.25) |
| Muscle weakness | 164 (67.48) |
| Muscle and joint pain | 152 (62.55) |
| Loss of balance | 146 (52.51) |
| Insomnia | 118 (48.56) |
| Chest pain | 116 (47.73) |
| Cough | 97 (39.91) |
| Comorbidities (n, %) | |
| Arterial hypertension | 80 (32.92) |
| Respiratory disease | 39 (16.04) |
| DM | 19 (7.82) |
| Heart disease | 19 (7.82) |
| Kidney disease | 1 (0.41) |
| Hospital internment (n, %) | 87 (35.80) |
| Up to 30 days | 75 (30.86) |
| >30 days | 12 (4.93) |
| Long COVID time (n, %) | |
| ≤6 months | 80 (32.92) |
| >6 months | 163 (67.07) |
| Variables | Hospitalisation | Long COVID Time | ALT > 29 U/L | ||||||
|---|---|---|---|---|---|---|---|---|---|
| Yes | No | p Value | ≤6 Months | >6 Months | p Value | Yes | No | p Value | |
| ALT, M ± SD | 37.68 ± 37.84 | 27.73 ± 26.42 | 0.0182 & | 31.74 ± 26.86 | 31.07 ± 33.31 | 0.5740 | - | - | - |
| ALT > 29 U/L, n (%) | 33 (13.58) | 41 (16.87) | 0.0808 | 25 (10.28) | 49 (20.16) | 0.9674 | - | - | - |
| AST, M ± SD | 30.85 ± 37.55 | 22.79 ± 12.34 | 0.0042 & | 23.37 ± 9.79 | 26.80 ± 29.43 | 0.7790 | 39.43 ± 41.30 | 19.65 ± 4.76 | <0.0001 & |
| AST > 25 U/L, n (%) | 32 (13.16) | 31 (12.75) | 0.0063 ′ | 21 (8.64) | 42 (17.28) | 0.9402 | 49 (20.16) | 14 (5.76) | <0.0001 ′ |
| LDH, M ± SD | 348.01 ± 97.94 | 322.23 ± 66.78 | 0.1474 | 345.01 ± 92.30 | 324.81 ± 72.79 | 0.0873 | 343.11 ± 70.56 | 326.36 ± 83.64 | 0.0269 & |
| LDH > 460 U/L, n (%) | 10 (4.11) | 3 (1.23) | 0.0024 ′′ | 7 (2.88) | 6 (2.47) | 0.1289 | 3 (1.23) | 10 (4.11) | 0.7594 |
| ALP, M ± SD | 203.10 ± 64.25 | 201.74 ± 62.18 | 0.8535 | 201.81 ± 54.45 | 202.43 ± 66.67 | 0.7035 | 206.32 ± 67.17 | 200.44 ± 60.91 | 0.4821 |
| ALP > 190 µg/L, n (%) | 46 (18.93) | 84 (34.56) | 0.9908 | 47 (19.34) | 83 (34.15) | 0.3110 | 42 (17.28) | 88 (36.21) | 0.5932 |
| GGT *, M ± SD | 60.15 ± 61.14 | 37.07 ± 21.46 | 0.0024 & | 64.02 ± 64.78 | 35.68 ± 15.97 | 0.0013 & | 69.60 ± 68.45 | 35.04 ± 14.03 | 0.0004 & |
| GGT > 50 µg/L, n (%) | 17 (6.99) | 8 (3.29) | 0.1371 | 17 (6.99) | 8 (3.29) | 0.0192 | 18 (7.40) | 7 (2.88) | 0.0006 ′ |
| GGT **, M ± SD | 44.47 ± 34.94 | 39.09 ± 34.82 | 0.3912 | 37.02 ± 26.60 | 44.30 ± 36.46 | 0.5645 | 64.97 ± 45.70 | 32.56 ± 26.14 | <0.0001 & |
| GGT > 32 µg/L, n (%) | 19 (7.81) | 42 (17.28) | 0.3773 | 16(6.58) | 45 (18.51) | 0.9318 | 26 (10.70) | 35 (14.40) | <0.0001 ′ |
| PT, M ± SD | 12.29 ± 1.01 | 12.87 ± 5.63 | 0.2142 | 12.35 ± 1.18 | 12.82 ± 5.50 | 0.4390 | 13.20 ± 8.08 | 12.43 ± 1.17 | 0.3034 |
| PT > 15 s, n (%) | 1 (0.41) | 2 (0.82) | 1.0000 | 2 (0.82) | 1 (0.41) | 0.2528 | 1 (0.41) | 1 (0.41) | 0.2937 |
| Ferritin *, M ± SD | 338.11 ± 229.71 | 226.72 ± 155.61 | 0.0235 & | 368.02 ± 238.19 | 208.27 ± 146.69 | 0.0056 & | 352.28 ± 236.85 | 239.32 ± 166.66 | 0.0239 |
| Ferritin > 300 ng/mL, n (%) | 24 (9.87) | 11 (4.52) | 0.0350 ′ | 23 (9.46) | 13 (5.35) | 0.0084 ′ | 18 (7.40) | 17 (6.99) | 0.1904 |
| Ferritin **, M ± SD | 177.09 ± 154.13 | 119.38 ± 116.52 | 0.0048 & | 122.92 ± 110.85 | 175.07 ± 167.44 | 0.2090 | 161.74 ± 133.42 | 125.81 ± 127.60 | 0.0148 & |
| Ferritin > 300 ng/mL, n (%) | 6 (2.47) | 11 (4.52) | 0.3907 | 3 (1.23) | 14 (5.76) | 0.5628 | 6 (2.47) | 11 (4.52) | 0.3691 |
| CRP-positive ***, n (%) | 10 (4.11) | 23 (9.46) | 0.6076 | 9 (3.70) | 24 (9.87) | 0.5867 | 11 (4.52) | 22 (9.05) | 0.8545 |
| ESR *, M ± SD | 35.22 ± 23.63 | 33.10 ± 28.35 | 0.3698 | 33.95 ± 23.81 | 34.31 ± 27.72 | 0.8629 | 30.71 ± 21.07 | 36.75 ± 28.64 | 0.5343 |
| ESR > 20 mm. n (%) | 31 (12.75) | 22 (9.05) | 0.3394 | 26 (10.69) | 27 (11.11) | 0.6856 | 22 (9.05) | 31 (12.75) | 0.8484 |
| ESR **, M ± SD | 41.16 ± 28.33 | 43.93 ± 25.24 | 0.4544 | 51.24 ± 32.88 | 41.72 ± 26.49 | 0.1343 | 48.66 ± 33.94 | 41.42 ± 22.77 | 0.4176 |
| ESR > 30 mm, n (%) | 25 (10.29) | 77 (31.68) | 0.5882 | 27 (11.11) | 75 (30.86) | 0.9403 | 28 (11.52) | 74 (30.45) | 0.3403 |
| TB, M ± SD | 0.46 ± 0.23 | 0.47 ± 0.21 | 0.7087 | 0.48 ± 0.28 | 0.46 ± 0.18 | 0.7587 | 0.47 ± 0.25 | 0.47 ± 0.21 | 0.7099 |
| TB > 1.0 mg/dL | 2 (0.82) | 1 (0.41) | 0.5634 | 3 (1.23) | 0 | 0.0370 ′′ | 1 (0.41) | 2 (0.82) | 0.9756 |
| DB. M ± SD | 0.17 ± 0.05 | 0.17 ± 0.07 | 0.7317 | 0.17 ± 0.07 | 0.17 ± 0.06 | 0.8638 | 0.17 ± 0.07 | 0.17 ± 0.06 | 0.9341 |
| DB > 0.3 mg/dL, n (%) | 1 (0.41) | 7 (2.88) | 0.1369 | 3 (1.23) | 5 (2.05) | 0.9980 | 4 (1.64) | 4 (1.64) | 0.2326 |
| IB, M ± SD | 0.31 ± 0.21 | 0.31 ± 0.18 | 0.5453 | 0.3094 ± 0.23 | 0.3145 ± 0.17 | 0.3736 | 0.30 ± 0.18 | 0.31 ± 0.19 | 0.6345 |
| IB > 0.8 mg/dL, n (%) | 1 (0.41) | 1 (0.41) | 1.0000 | 2 (0.82) | 0 | 0.1135 | 0 | 2 (0.82) | 0.5772 |
| Albumin, M ± SD | 4.09 ± 0.34 | 4.12 ± 0.38 | 0.2321 | 3.9969 ± 0.37 | 4.1677 ± 0.35 | 0.6949 | 4.13 ± 0.34 | 4.10 ± 0.38 | 0.6542 |
| Albumin > 4.8 g/dL, n (%) | 0 | 0 | 1.0000 | 0 | 0 | 1.0000 | 0 | 0 | 1.0000 |
| Variables | CRP *** | ESR (mm/h) * | ESR (mm/h) ** | Ferritin * (ng/mL) | Ferritin ** (ng/mL) | ||||||||||
|---|---|---|---|---|---|---|---|---|---|---|---|---|---|---|---|
| + | − | p Value | >20 | ≤20 | p Value | >30 | ≤30 | p value | >300 | ≤300 | p Value | >300 | ≤300 | p Value | |
| ALT, M ± SD | 43.79 ± 59.36 | 29.33 ± 23.77 | 0.1145 | 35.04 ± 23.19 | 42.58 ± 41.21 | 0.7073 | 27.92 ± 28.78 | 27.70 ± 34.76 | 0.4037 | 49.48 ± 41.58 | 29.49 ± 16.52 | 0.0104 & | 25.88 ± 10.55 | 28.07 ± 32.56 | 0.2520 |
| ALT > 29 U/L n (%) | 11 (4.52) | 63 (25.92) | 0.8545 | 22 (9.05) | 13 (5.35) | 0.0370 ′ | 28 (11.52) | 11 (4.52) | 0.3403 | 18 (7.40) | 17 (6.99) | 0.1904 | 6 (24.69) | 33 (13.58) | 0.3691 |
| AST, M ± SD | 32.33 ± 52.94 | 24.63 ± 16.53 | 0.9236 | 24.37 ± 7.73 | 34.87 ± 36.62 | 0.6597 | 26.00 ± 31.27 | 21.30 ± 6.77 | 0.3626 | 31.83 ± 22.67 | 25.69 ± 23.82 | 0.0064 & | 24.06 ± 6.25 | 24.34 ± 26.83 | 0.0491 & |
| AST > 25 U/L n. (%) | 9 (3.70) | 54 (22.22) | 0.9811 | 18 (7.40) | 10 (4.11) | 0.9363 | 25 (10.29) | 10 (41.15) | 0.4139 | 17 (6.99) | 11 (4.52) | 0.0233 ′ | 4 (1.64) | 31 (12.75) | 0.9970 |
| LDH M ± SD | 332.06 ± 81.41 | 331.37 ± 80.10 | 0.8762 | 334.15 ± 100.17 | 331.13 ± 95.05 | 0.9078 | 333.13 ± 70.74 | 326.16 ± 67.18 | 0.4893 | 348.03 ± 107.76 | 322.32 ± 89.52 | 0.2968 | 343.76 ± 72.56 | 329.06 ± 69.06 | 0.4222 |
| LDH > 460 U/L n. (%) | 2 (0.82) | 11 (4.52) | 0.9803 | 3 (1.23) | 4 (1.64) | 0.4148 | 3 (1.23) | 3 (1.23) | 4 (1.64) | 3 (1.23) | 1 (0.42) | 5 (2.06) | 0.4817 | ||
| ALP M ± SD | 232.97 ± 84.13 | 197.40 ± 57.53 | 0.0092 & | 199.13 ± 63.82 | 193.77 ± 48.21 | 0.2808 | 210.38 ± 68.42 | 195.12 ± 57.88 | 0.3712 | 209.02 ± 53.64 | 188.67 ± 60.53 | 0.5312 | 225.41 ± 59.24 | 202.46 ± 65.49 | 0.1520 |
| ALP > 190 µg/L | 23 (9.46) | 107 (44.03) | 0.0689 | 30 (12.34) | 16 (6.58) | 0.8287 | 54 (22.22) | 30 (12.34) | 0.8980 | 23 (9.46) | 23 (9.46) | 0.1383 | 11 (4.52) | 73 (30.04) | 0.4349 |
| GGT * M ± SD | 49.80 ± 31.46 | 49.42 ± 49.24 | 0.9774 | 52.24 ± 57.38 | 44.64 ± 26.30 | 0.8457 | - | - | - | 66.31 ± 69.34 | 37.39 ± 16.17 | 0.0164 & | - | - | - |
| GGT > 50 µg/L | 2 (0.82) | 23 (9.46) | 0.6297 | 16 (6.58) | 9 (3.70) | 0.8923 | - | - | - | 14 (5.76) | 11 (4.52) | 0.1356 | - | - | - |
| GGT ** M ± SD | 46.25 ± 33.47 | 39.29 ± 35.11 | 0.0345 & | - | - | - | 40.65 ± 33.79 | 40.26 ± 36.91 | 0.3522 | - | - | - | 56.70 ± 53.14 | 38.57 ± 31.67 | 0.1226 |
| GGT > 32 µg/L | 15 (6.17) | 46 (18.93) | 0.1076 | - | - | - | 39 (16.05) | 22 (9.05) | 0.8980 | - | - | - | 9 (3.70) | 52 (21.40) | 0.2965 |
| PT M ± SD | 14.57 ± 11.98 | 12.36 ± 1.18 | 0.2444 | 12.33 ± 1.27 | 12.66 ± 0.99 | 0.3124 | 12.37 ± 1.26 | 13.50 ± 9.15 | 0.8224 | 12.42 ± 1.35 | 12.47 ± 1.06 | 0.6394 | 12.77 ± 1.20 | 12.78 ± 5.88 | 0.1465 |
| PT > 15 s | 1 (0.42) | 2 (0.82) | 0.3535 | 1 (0.42) | 0 | 1.0000 | 1 (0.42) | 1 (0.42) | 1.0000 | 1 (0.42) | 3 (1.23) | 0.6374 | 1 (0.42) | 2 (0.82) | 0.2883 |
| TB M ± SD | 0.45 ± 0.21 | 0.47 ± 0.22 | 0.8213 | 0.49 ± 0.26 | 0.50 ± 0.22 | 0.9049 | 0.42 ± 0.19 | 0.52 ± 0.22 | 0.0755 | 0.48 ± 0.27 | 0.50 ± 0.24 | 0.7357 | 0.41 ± 0.19 | 0.46 ± 0.21 | 0.4735 |
| TB > 1.0 mg/dL | 0 | 3 (1.23) | 1.0000 | 1 (0.42) | 1 (0.42) | 1.0000 | 0 | 1 (0.42) | 0.3390 | 1 (0.42) | 1 (0.42) | 1.0000 | 0 | 1 (0.42) | 1.0000 |
| DB M ± SD | 0.16 ± 0.06 | 0.17 ± 0.06 | 0.4465 | 0.17 ± 0.06 | 0.17 ± 0.06 | 1.0000 | 0.16 ± 0.06 | 0.18 ± 0.07 | 0.4565 | 0.16 ± 0.05 | 0.18 ± 0.06 | 0.4773 | 0.14 ± 0.05 | 0.17 ± 0.07 | 0.3428 |
| DB > 0.3 mg/dL | 1 (0.42) | 7 (2.88) | 1.0000 | 2 (0.82) | 1 (0.42) | 0.5508 | 3 (1.23) | 2 (0.82) | 0.9969 | 0 | 3 (1.23) | 0.5361 | 0 | 5 (2.06) | 0.5860 |
| IB M ± SD | 0.33 ± 0.20 | 0.31 ± 0.19 | 0.6692 | 0.31 ± 0.21 | 0.32 ± 0.19 | 0.7328 | 0.27 ± 0.17 | 0.37 ± 0.20 | 0.0537 | 0.32 ± 0.25 | 0.31 ± 0.19 | 0.7899 | 0.26 ± 0.15 | 0.33 ± 0.19 | 0.5066 |
| IB > 0.8 mg/dL | 0 | 2 (0.82) | 1.0000 | 1 (0.42) | 1 (0.42) | 1.0000 | 0 | 0 | 1.0000 | 1 (0.42) | 1 (0.42) | 1.0000 | 0 | 0 | 1.0000 |
| Albumin M ± SD | 4.17 ± 0.40 | 4.09 ± 0.36 | 0.4643 | 4.01 ± 0.34 | 4.13 ± 0.37 | 0.2978 | 4.17 ± 0.36 | 4.07 ± 0.39 | 0.2630 | 4.03 ± 0.41 | 4.06 ± 0.34 | 0.6314 | 4.08 ± 0.36 | 4.15 ± 0.37 | 0.5909 |
| Albumin > 4.8 g/dL | 0 | 0 | 1.0000 | 0 | 0 | 1.0000 | 0 | 0 | 1.0000 | 0 | 0 | 1.0000 | 0 | 0 | 1.0000 |
| Risk Variables | ALT > 29 U/L | AST > 25 U/L | Ferritin > 300 ng/mL | Long COVID Time ≤ 6 | >5 Long COVID Symptoms | Hospitalisation | ||||||
|---|---|---|---|---|---|---|---|---|---|---|---|---|
| Odds Ratio | p Value | Odds Ratio | p Value | Odds Ratio | p Value | Odds Ratio | p Value | Odds Ratio | p Value | Odds Ratio | p Value | |
| Hospitalisation, yes | 0.8948 | 0.8025 | 2.1662 | 0.0807 | 1.7693 | 0.1495 | 2.4271 | 0.0059 | 1.9802 | 0.0542 | - | - |
| Long COVID time ≤ 6 | 0.7877 | 0.5933 | 0.6341 | 0.3236 | 1.5344 | 0.2711 | - | - | 2.8343 | 0.0042 | 2.4542 | 0.0052 |
| Age ≥ 60 years | 0.2855 | 0.0214 | 1.1367 | 0.8038 | 2.4342 | 0.0331 | 1.5585 | 0.2126 | 0.9407 | 0.8678 | 1.4307 | 0.3218 |
| Male | 2.6959 | 0.0274 | 0.9369 | 0.8878 | 4.8173 | <0.0001 | 2.0594 | 0.0351 | 0.6988 | 0.3046 | 2.4365 | 0.0087 |
| >5 long COVID symptoms | 1.1528 | 0.7536 | 0.6118 | 0.2554 | 0.6997 | 0.3829 | 2.8768 | 0.0041 | - | - | 1.9906 | 0.0539 |
| ALT > 29 U/L | - | - | 21.3046 | <0.0001 | 1.7447 | 0.2720 | 0.8798 | 0.7707 | 1.0923 | 0.8321 | 0.8981 | 0.8054 |
| AST > 25 U/L | 21.5317 | <0.0001 | - | - | 1.2285 | 0.6807 | 0.7166 | 0.4531 | 0.6006 | 0.2344 | 2.2260 | 0.0670 |
| LDH ≥ 460 U/L | 0.2712 | 0.1577 | 5.4802 | 0.0266 | 1.3118 | 0.7063 | 1.2126 | 0.7673 | 2.0278 | 0.3957 | 4.6938 | 0.0370 |
| ALP ≥ 190 U/L | 0.7481 | 0.4745 | 1.0868 | 0.8380 | 1.9531 | 0.0852 | 1.3307 | 0.3638 | 0.7894 | 0.4398 | 0.7015 | 0.2669 |
| GGT ≥ 50 U/L * ou 32 U/L ** | 3.5989 | 0.0019 | 1.9687 | 0.1094 | 1.5007 | 0.3431 | 1.3967 | 0.3401 | 1.7849 | 0.1055 | 1.2841 | 0.4755 |
| Ferritin ≥ 300 ng/mL | 1.6449 | 0.3357 | 1.3499 | 0.5338 | - | - | 1.5394 | 0.2654 | 0.6965 | 0.3639 | 1.9245 | 0.0966 |
| ESR ≥ 20 mm/h * ou 30 mm/h ** | 1.1198 | 0.7887 | 1.2075 | 0.6576 | 1.9377 | 0.1069 | 1.3981 | 0.3084 | 0.6022 | 0.1178 | 1.0869 | 0.8008 |
| Positive C-reactive protein *** | 1.2672 | 0.6725 | 0.8917 | 0.8434 | 0.4243 | 0.1865 | 0.7255 | 0.5023 | 1.1572 | 0.7462 | 0.9796 | 0.9651 |
Disclaimer/Publisher’s Note: The statements, opinions and data contained in all publications are solely those of the individual author(s) and contributor(s) and not of MDPI and/or the editor(s). MDPI and/or the editor(s) disclaim responsibility for any injury to people or property resulting from any ideas, methods, instructions or products referred to in the content. |
© 2023 by the authors. Licensee MDPI, Basel, Switzerland. This article is an open access article distributed under the terms and conditions of the Creative Commons Attribution (CC BY) license (https://creativecommons.org/licenses/by/4.0/).
Share and Cite
de Lima, I.C.; de Menezes, D.C.; Uesugi, J.H.E.; Bichara, C.N.C.; da Costa Vasconcelos, P.F.; Quaresma, J.A.S.; Falcão, L.F.M. Liver Function in Patients with Long-Term Coronavirus Disease 2019 of up to 20 Months: A Cross-Sectional Study. Int. J. Environ. Res. Public Health 2023, 20, 5281. https://doi.org/10.3390/ijerph20075281
de Lima IC, de Menezes DC, Uesugi JHE, Bichara CNC, da Costa Vasconcelos PF, Quaresma JAS, Falcão LFM. Liver Function in Patients with Long-Term Coronavirus Disease 2019 of up to 20 Months: A Cross-Sectional Study. International Journal of Environmental Research and Public Health. 2023; 20(7):5281. https://doi.org/10.3390/ijerph20075281
Chicago/Turabian Stylede Lima, Igor Costa, Daniel Carvalho de Menezes, Juliana Hiromi Emin Uesugi, Cléa Nazaré Carneiro Bichara, Pedro Fernando da Costa Vasconcelos, Juarez Antônio Simões Quaresma, and Luiz Fábio Magno Falcão. 2023. "Liver Function in Patients with Long-Term Coronavirus Disease 2019 of up to 20 Months: A Cross-Sectional Study" International Journal of Environmental Research and Public Health 20, no. 7: 5281. https://doi.org/10.3390/ijerph20075281