
Assessment of Physical Tests in 6–11 Years Old Children: Findings from the Play Lifestyle and Activity in Youth (PLAY) Study
 , and
, and
Abstract
:1. Introduction
2. Materials and Methods
2.1. Study Design and Participants
2.2. Physical Tests
2.2.1. Strength: Hand Grip Test
2.2.2. Power: Vertical Jump Test
2.2.3. Flexibility: Sit and Reach Test
2.2.4. Balance: Y-Balance Test
2.2.5. Coordination: Obstacle Course
2.2.6. Lower Extremity Unilateral and Bilateral Function and Coordination: Hop Test
2.2.7. Lower Extremity Coordination through Generating Force: Kicking a Ball Test
2.2.8. Upper Extremity Function with Eye-Hand Coordination: Catching a Ball Test
2.2.9. Upper Extremity Coordination through Generating Force: Throwing a Ball Test
2.2.10. Overall Function and Coordination including Lower and Upper Extremities: Sliding Test
2.3. Main Outcome Measures
2.4. Statistical Analysis
3. Results
3.1. Participants Demographics
3.2. Physical Activity Levels
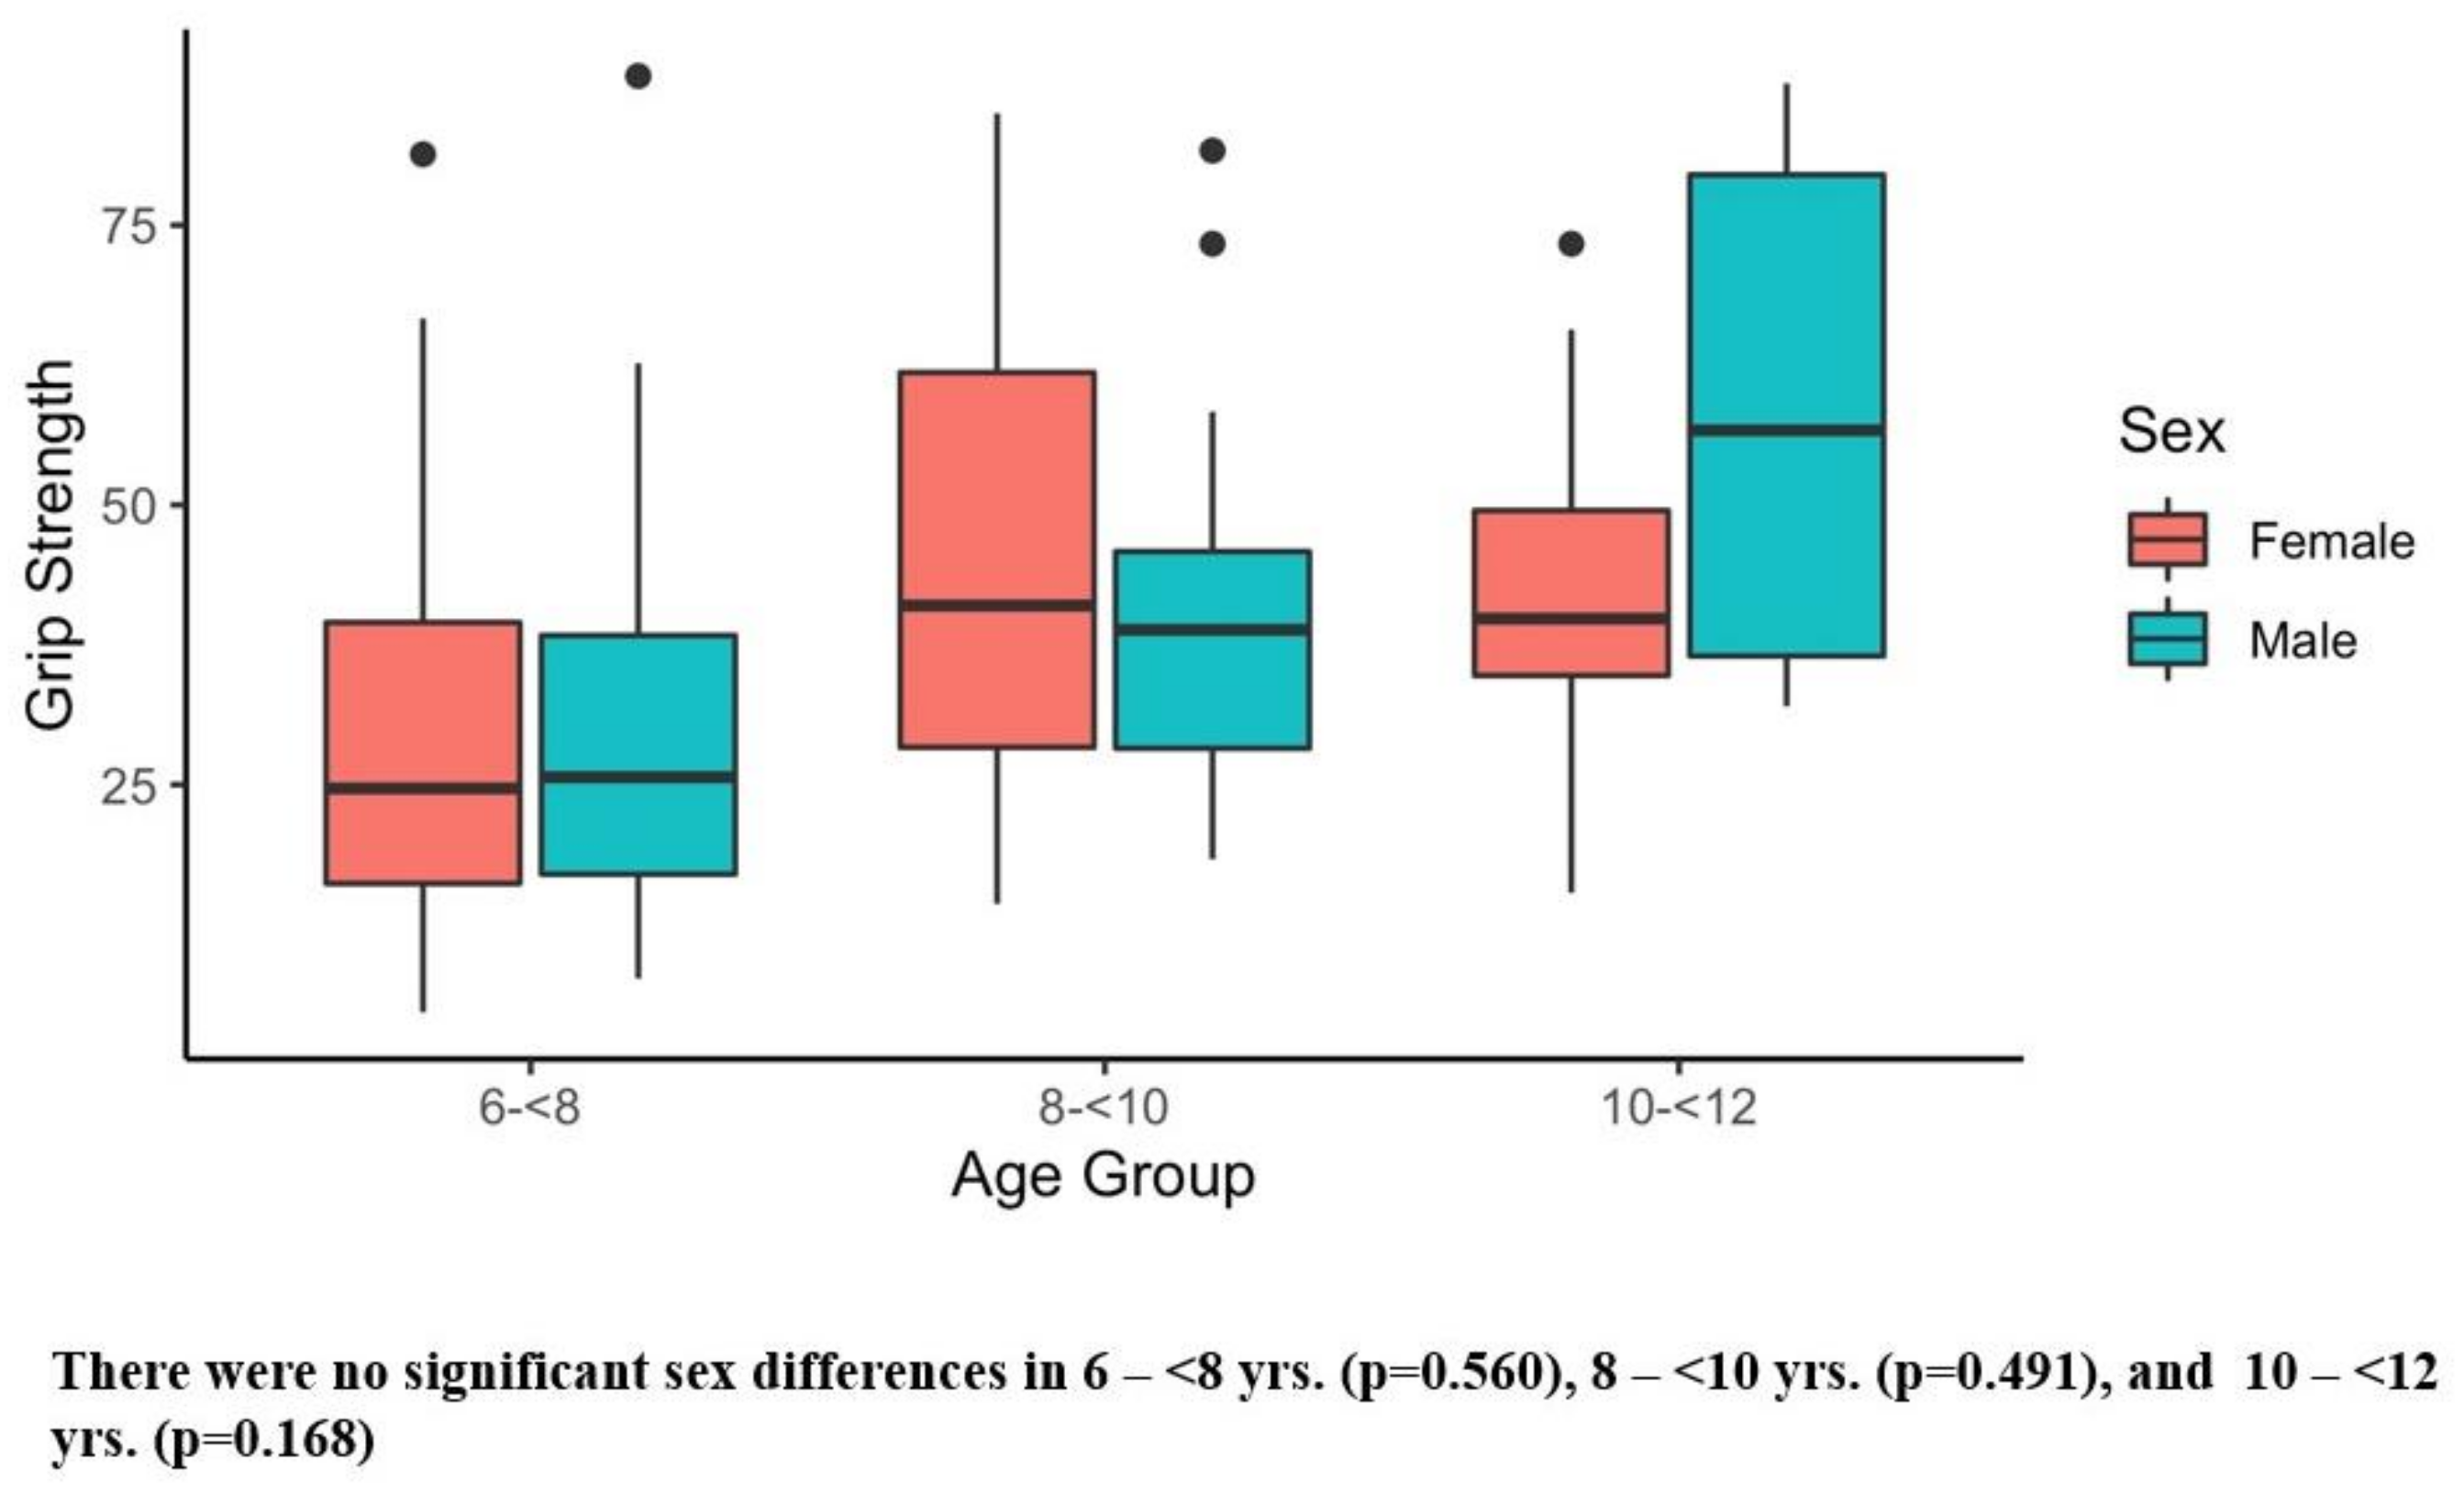
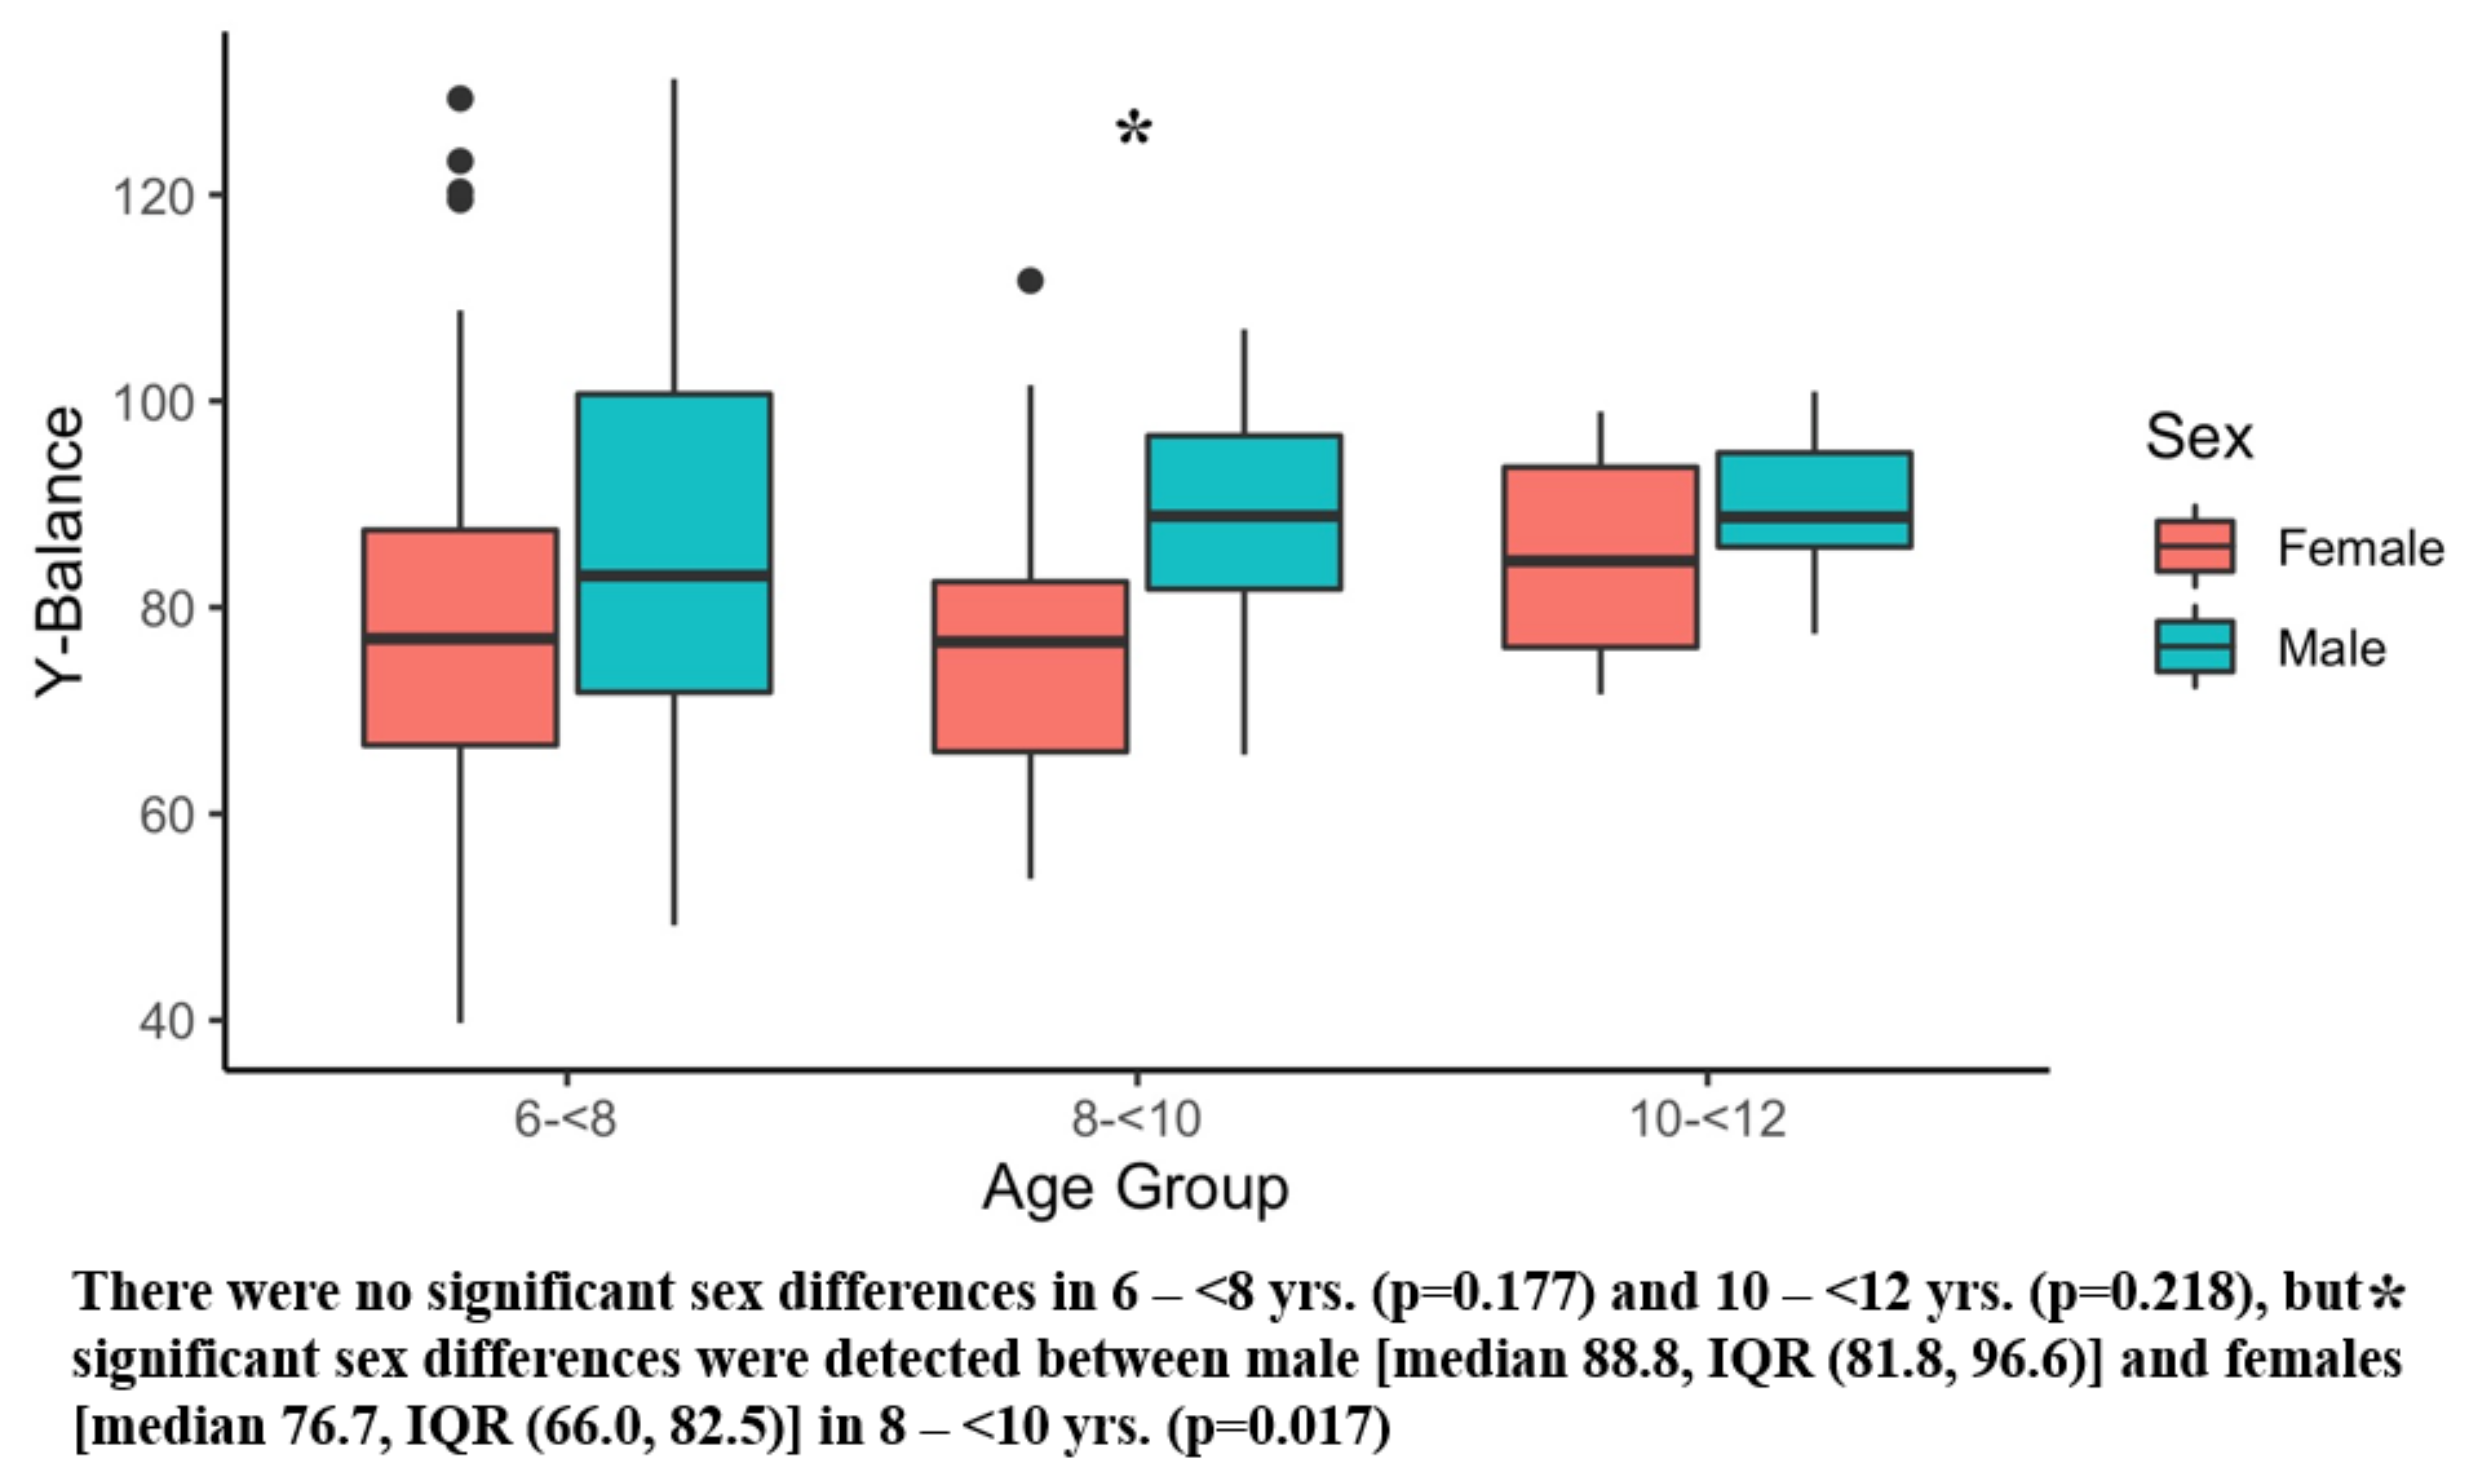
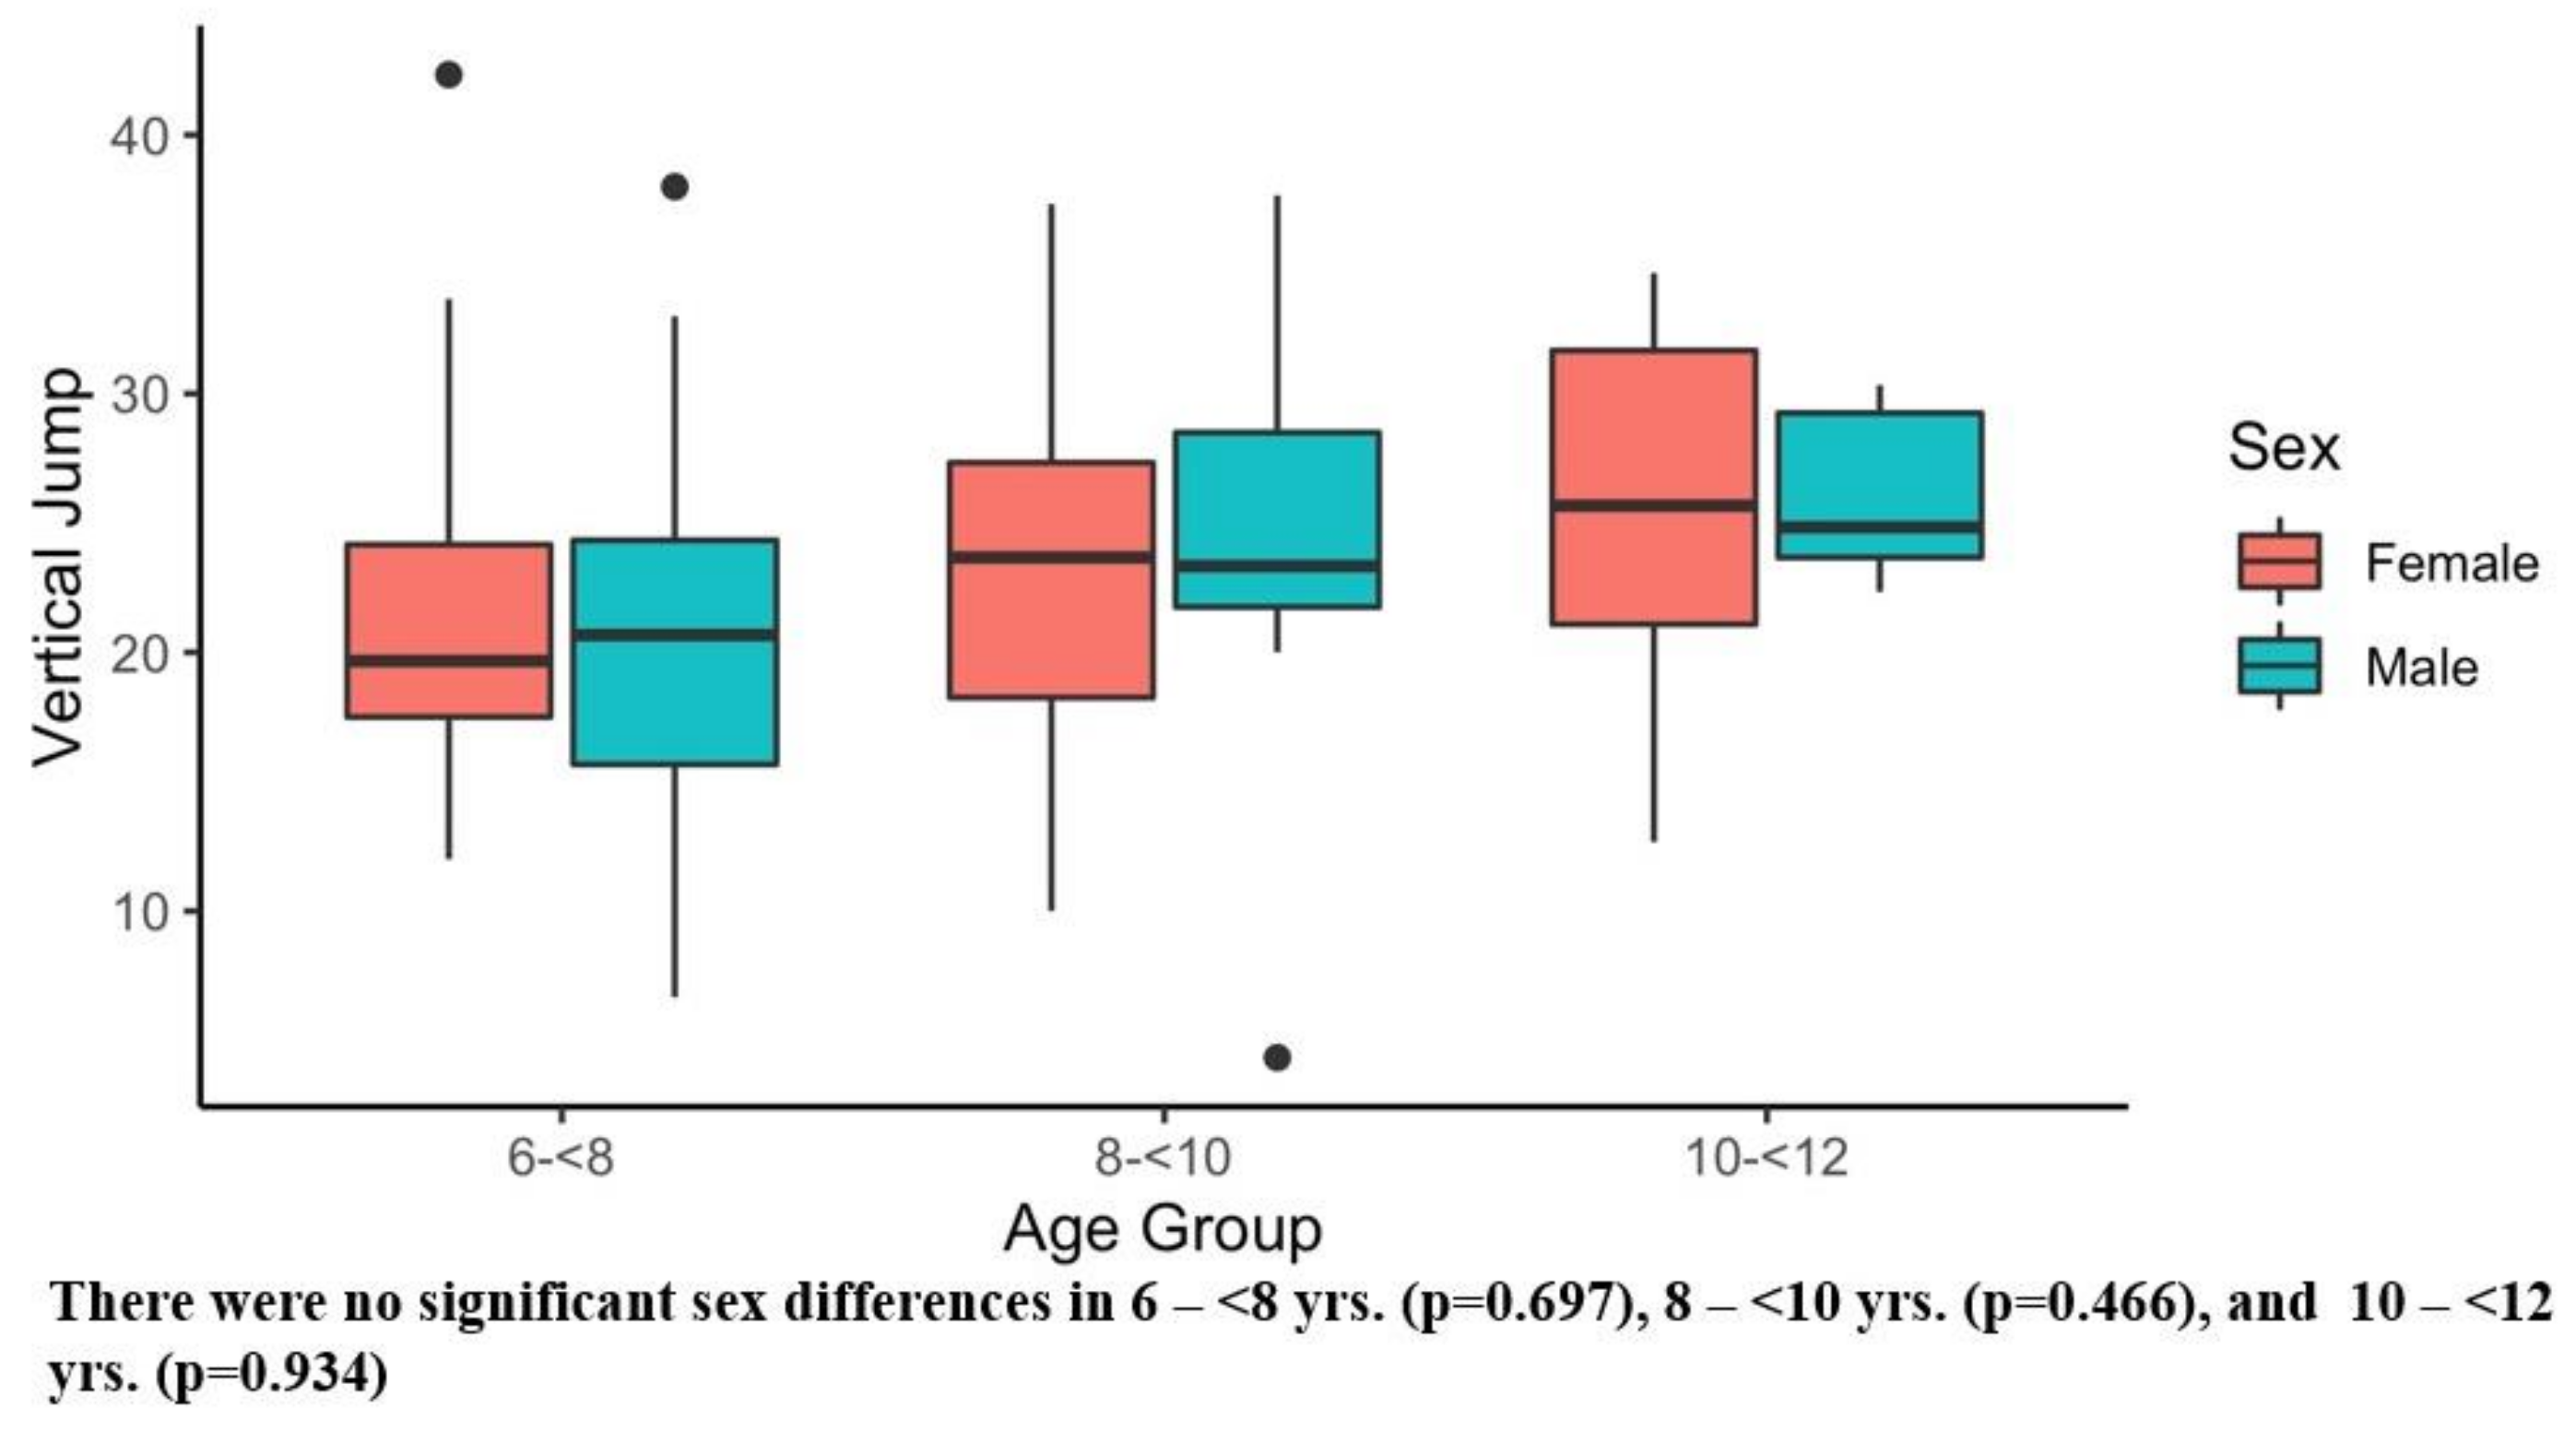
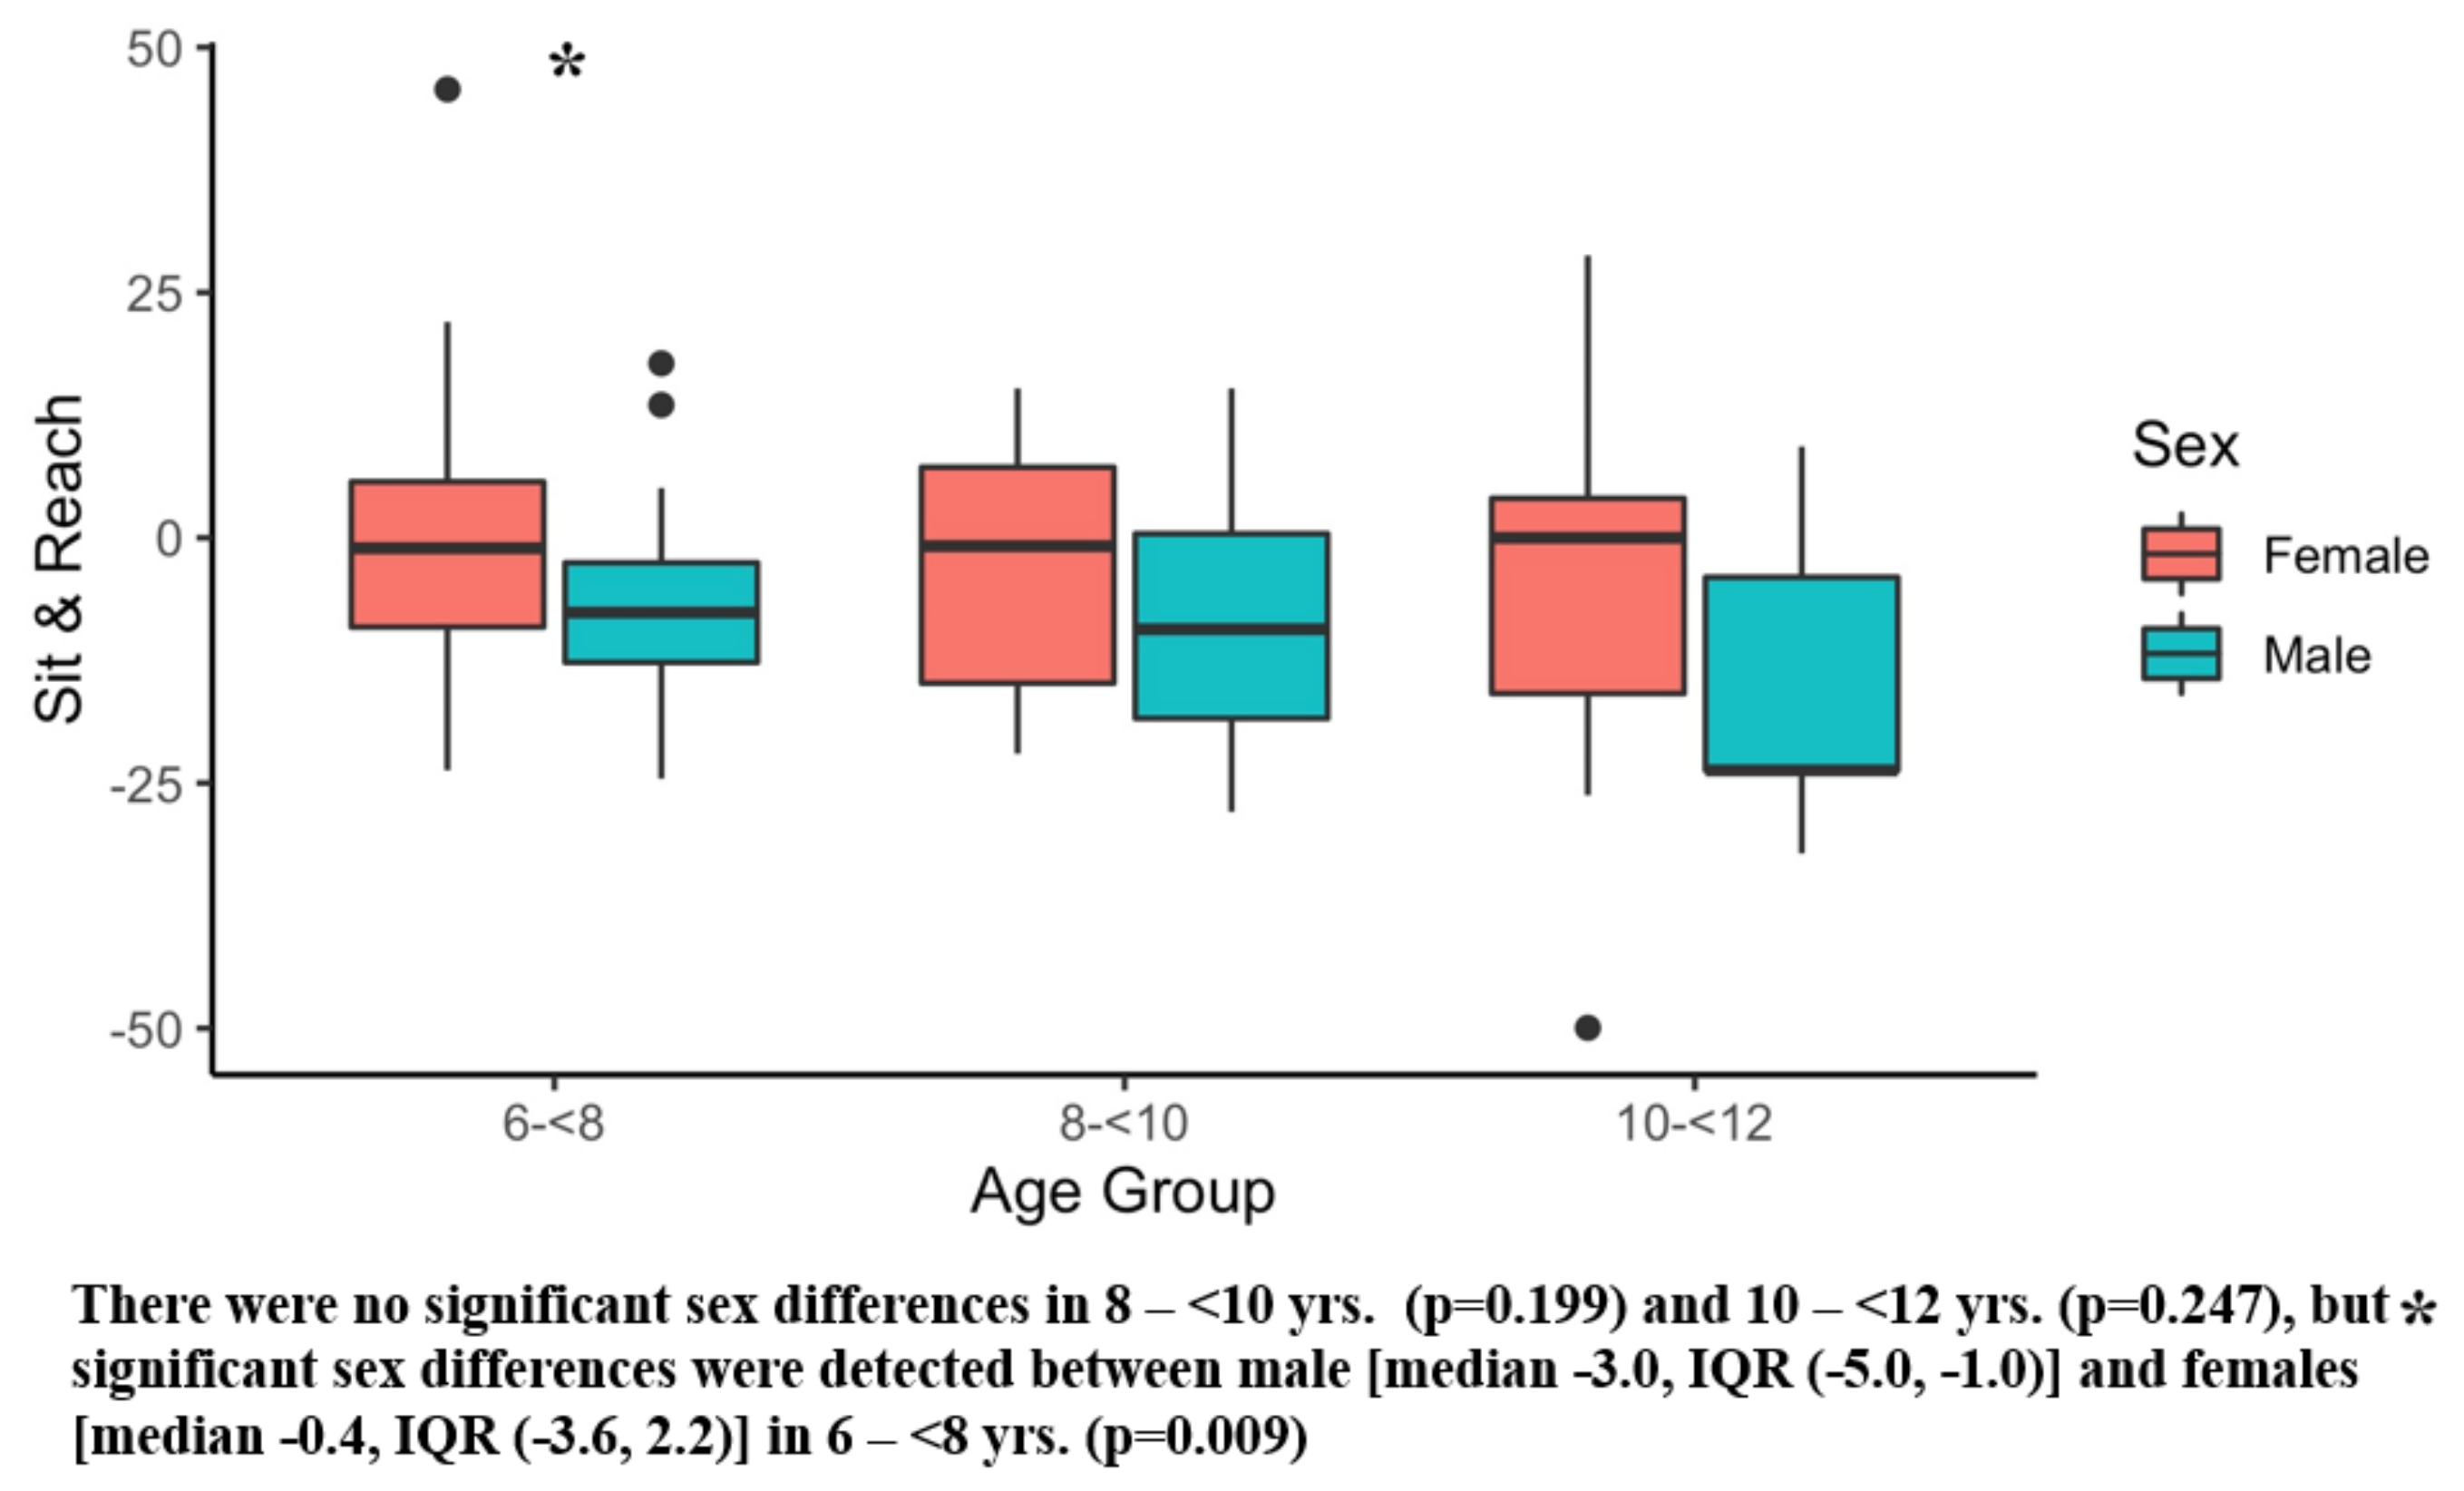
3.3. Physical Assessment and Comparisons by Sex
4. Discussion
5. Conclusions
Supplementary Materials
Author Contributions
Funding
Institutional Review Board Statement
Informed Consent Statement
Data Availability Statement
Acknowledgments
Conflicts of Interest
References
- Kohl, H.W., 3rd; Craig, C.L.; Lambert, E.V.; Inoue, S.; Alkandari, J.R.; Leetongin, G.; Kahlmeier, S. The pandemic of physical inactivity: Global action for public health. Lancet 2012, 380, 294–305. [Google Scholar] [CrossRef] [PubMed] [Green Version]
- Andersen, L.B.; Mota, J.; Di Pietro, L. Update on the global pandemic of physical inactivity. Lancet 2016, 388, 1255–1256. [Google Scholar] [CrossRef] [PubMed]
- Cliff, D.P.; Hesketh, K.D.; Vella, S.A.; Hinkley, T.; Tsiros, M.D.; Ridgers, N.D.; Carver, A.; Veitch, J.; Parrish, A.M.; Hardy, L.L.; et al. Objectively measured sedentary behaviour and health and development in children and adolescents: Systematic review and meta-analysis. Obes. Rev. 2016, 17, 330–344. [Google Scholar] [CrossRef] [Green Version]
- Aubert, S.; Barnes, J.D.; Abdeta, C.; Abi Nader, P.; Adeniyi, A.F.; Aguilar-Farias, N.; Andrade Tenesaca, D.S.; Bhawra, J.; Brazo-Sayavera, J.; Cardon, G.; et al. Global Matrix 3.0 Physical Activity Report Card Grades for Children and Youth: Results and Analysis from 49 Countries. J. Phys. Act. Health 2018, 15, S251–S273. [Google Scholar] [CrossRef] [Green Version]
- Burns, R.D.; Kim, Y.; Byun, W.; Brusseau, T. Associations of School Day Sedentary Behavior and Physical Activity with Gross Motor Skills: Use of Compositional Data Analysis. J. Phys. Act. Health 2019, 16, 811–817. [Google Scholar] [CrossRef] [PubMed]
- Webster, E.K.; Martin, C.K.; Staiano, A.E. Fundamental motor skills, screen-time, and physical activity in preschoolers. J. Sport Health Sci. 2019, 8, 114–121. [Google Scholar] [CrossRef]
- Iannotti, R.J.; Janssen, I.; Haug, E.; Kololo, H.; Annaheim, B.; Borraccino, A. Interrelationships of adolescent physical activity, screen-based sedentary behaviour, and social and psychological health. Int. J. Public Health 2009, 54 (Suppl. S2), 191–198. [Google Scholar] [CrossRef] [Green Version]
- Iannotti, R.J.; Kogan, M.D.; Janssen, I.; Boyce, W.F. Patterns of adolescent physical activity, screen-based media use, and positive and negative health indicators in the U.S. and Canada. J. Adolesc. Health 2009, 44, 493–499. [Google Scholar] [CrossRef] [Green Version]
- Prentice-Dunn, H.; Prentice-Dunn, S. Physical activity, sedentary behavior, and childhood obesity: A review of cross-sectional studies. Psychol. Health Med. 2012, 17, 255–273. [Google Scholar] [CrossRef]
- Leung, M.M.; Agaronov, A.; Grytsenko, K.; Yeh, M.C. Intervening to Reduce Sedentary Behaviors and Childhood Obesity among School-Age Youth: A Systematic Review of Randomized Trials. J. Obes. 2012, 2012, 685430. [Google Scholar] [CrossRef]
- Bull, F.C.; Al-Ansari, S.S.; Biddle, S.; Borodulin, K.; Buman, M.P.; Cardon, G.; Carty, C.; Chaput, J.P.; Chastin, S.; Chou, R.; et al. World Health Organization 2020 guidelines on physical activity and sedentary behaviour. Br. J. Sport. Med. 2020, 54, 1451–1462. [Google Scholar] [CrossRef] [PubMed]
- Philippaerts, R.M.; Vaeyens, R.; Janssens, M.; Van Renterghem, B.; Matthys, D.; Craen, R.; Bourgois, J.; Vrijens, J.; Beunen, G.; Malina, R.M. The relationship between peak height velocity and physical performance in youth soccer players. J. Sport. Sci. 2006, 24, 221–230. [Google Scholar] [CrossRef] [PubMed]
- Annear, M.; Lucas, P.; Wilkinson, T.; Shimizu, Y. Prescribing physical activity as a preventive measure for middle-aged Australians with dementia risk factors. Aust. J. Prim. Health 2019, 25, 108–112. [Google Scholar] [CrossRef]
- Rippe, J.M. Lifestyle Strategies for Risk Factor Reduction, Prevention, and Treatment of Cardiovascular Disease. Am. J. Lifestyle Med. 2019, 13, 204–212. [Google Scholar] [CrossRef]
- Umpierre, D.; Ribeiro, P.A.; Kramer, C.K.; Leitão, C.B.; Zucatti, A.T.; Azevedo, M.J.; Gross, J.L.; Ribeiro, J.P.; Schaan, B.D. Physical activity advice only or structured exercise training and association with HbA1c levels in type 2 diabetes: A systematic review and meta-analysis. JAMA 2011, 305, 1790–1799. [Google Scholar] [CrossRef] [PubMed] [Green Version]
- Rippe, J.M.; Angelopoulos, T.J. Lifestyle strategies for cardiovascular risk reduction. Curr. Atheroscler. Rep. 2014, 16, 444. [Google Scholar] [CrossRef] [PubMed]
- Archer, T.; Josefsson, T.; Lindwall, M. Effects of physical exercise on depressive symptoms and biomarkers in depression. CNS Neurol. Disord. Drug Targets 2014, 13, 1640–1653. [Google Scholar] [CrossRef] [PubMed]
- Janssen, I.; Leblanc, A.G. Systematic review of the health benefits of physical activity and fitness in school-aged children and youth. Int. J. Behav. Nutr. Phys. Act. 2010, 7, 40. [Google Scholar] [CrossRef] [Green Version]
- Myer, G.D.; Faigenbaum, A.D.; Edwards, N.M.; Clark, J.F.; Best, T.M.; Sallis, R.E. Sixty minutes of what? A developing brain perspective for activating children with an integrative exercise approach. Br. J. Sport. Med. 2015, 49, 1510–1516. [Google Scholar] [CrossRef]
- Caldwell, H.A.T.; Di Cristofaro, N.A.; Cairney, J.; Bray, S.R.; MacDonald, M.J.; Timmons, B.W. Physical Literacy, Physical Activity, and Health Indicators in School-Age Children. Int. J. Environ. Res. Public Health 2020, 17, 5367. [Google Scholar] [CrossRef]
- Faigenbaum, A.D.; Stracciolini, A.; Myer, G.D. Exercise deficit disorder in youth: A hidden truth. Acta Paediatr. 2011, 100, 1423–1425, discussion 1425. [Google Scholar] [CrossRef]
- Delisle Nyström, C.; Traversy, G.; Barnes, J.D.; Chaput, J.P.; Longmuir, P.E.; Tremblay, M.S. Associations between domains of physical literacy by weight status in 8- to 12-year-old Canadian children. BMC Public Health 2018, 18, 1043. [Google Scholar] [CrossRef] [PubMed] [Green Version]
- Roetert, E.P.; Ellenbecker, T.S.; Kriellaars, D. Physical literacy: Why should we embrace this construct? Br. J. Sport. Med. 2018, 52, 1291–1292. [Google Scholar] [CrossRef] [PubMed]
- Corbin, C.B. Implications of Physical Literacy for Research and Practice: A Commentary. Res. Q. Exerc. Sport 2016, 87, 14–27. [Google Scholar] [CrossRef]
- Longmuir, P.E.; Gunnell, K.E.; Barnes, J.D.; Belanger, K.; Leduc, G.; Woodruff, S.J.; Tremblay, M.S. Canadian Assessment of Physical Literacy Second Edition: A streamlined assessment of the capacity for physical activity among children 8 to 12 years of age. BMC Public Health 2018, 18, 1047. [Google Scholar] [CrossRef] [PubMed] [Green Version]
- Gunnell, K.E.; Longmuir, P.E.; Barnes, J.D.; Belanger, K.; Tremblay, M.S. Refining the Canadian Assessment of Physical Literacy based on theory and factor analyses. BMC Public Health 2018, 18, 1044. [Google Scholar] [CrossRef]
- Longmuir, P.E.; Boyer, C.; Lloyd, M.; Yang, Y.; Boiarskaia, E.; Zhu, W.; Tremblay, M.S. The Canadian Assessment of Physical Literacy: Methods for children in grades 4 to 6 (8 to 12 years). BMC Public Health 2015, 15, 767. [Google Scholar] [CrossRef] [Green Version]
- Lang, J.J.; Chaput, J.P.; Longmuir, P.E.; Barnes, J.D.; Belanger, K.; Tomkinson, G.R.; Anderson, K.D.; Bruner, B.; Copeland, J.L.; Gregg, M.J.; et al. Cardiorespiratory fitness is associated with physical literacy in a large sample of Canadian children aged 8 to 12 years. BMC Public Health 2018, 18, 1041. [Google Scholar] [CrossRef]
- Edwards, L.C.; Bryant, A.S.; Keegan, R.J.; Morgan, K.; Cooper, S.M.; Jones, A.M. ‘Measuring’ Physical Literacy and Related Constructs: A Systematic Review of Empirical Findings. Sport. Med. 2018, 48, 659–682. [Google Scholar] [CrossRef] [Green Version]
- Zuvela, F.; Bozanic, A.; Miletic, D. POLYGON—A New Fundamental Movement Skills Test for 8 Year Old Children: Construction and Validation. J. Sport. Sci. Med. 2011, 10, 157–163. [Google Scholar]
- Kudláček, M.; Frömel, K.; Jakubec, L.; Groffik, D. Compensation for Adolescents’ School Mental Load by Physical Activity on Weekend Days. Int. J. Environ. Res. Public Health 2016, 13, 308. [Google Scholar] [CrossRef] [PubMed]
- Carson, V.; Staiano, A.E.; Katzmarzyk, P.T. Physical activity, screen time, and sitting among U.S. adolescents. Pediatr. Exerc. Sci. 2015, 27, 151–159. [Google Scholar] [CrossRef] [PubMed] [Green Version]
- Saint-Maurice, P.F.; Welk, G.J.; Silva, P.; Siahpush, M.; Huberty, J. Assessing children’s physical activity behaviors at recess: A multi-method approach. Pediatr. Exerc. Sci. 2011, 23, 585–599. [Google Scholar] [CrossRef] [PubMed] [Green Version]
- McKay, M.J.; Baldwin, J.N.; Ferreira, P.; Simic, M.; Vanicek, N.; Wojciechowski, E.; Mudge, A.; Burns, J. Spatiotemporal and plantar pressure patterns of 1000 healthy individuals aged 3–101 years. Gait Posture 2017, 58, 78–87. [Google Scholar] [CrossRef]
- Santos, S.; Jiménez, S.; Sampaio, J.; Leite, N. Effects of the Skills4Genius sports-based training program in creative behavior. PLoS ONE 2017, 12, e0172520. [Google Scholar] [CrossRef] [Green Version]
- Bansal, A.; Diwan, S.; Diwan, J.; Vyas, N. Prevalance of obesity in children with cerebral palsy. J. Clin. Diagn. Res. JCDR 2014, 8, BC08–BC11. [Google Scholar] [CrossRef]
- Cairney, J.; Dudley, D.; Kwan, M.; Bulten, R.; Kriellaars, D. Physical Literacy, Physical Activity and Health: Toward an Evidence-Informed Conceptual Model. Sport. Med. 2019, 49, 371–383. [Google Scholar] [CrossRef]
- Stracciolini, A.; Berbert, L.; Nohelty, E.; Zwicker, R.; Weller, E.; Sugimoto, D.; Myer, G.D.; Faigenbaum, A.D. Attitudes and Behaviors of Physical Activity in Children: Findings from the Play, Lifestyle & Activity in Youth (PLAY) Questionnaire. PM&R 2022, 14, 535–550. [Google Scholar] [CrossRef]
- Lee, S.E.K.; Lira, C.A.B.; Nouailhetas, V.L.A.; Vancini, R.L.; Andrade, M.S. Do isometric, isotonic and/or isokinetic strength trainings produce different strength outcomes? J. Bodyw. Mov. Ther. 2018, 22, 430–437. [Google Scholar] [CrossRef]
- Frykholm, E.; Géphine, S.; Saey, D.; van Hees, H.; Lemson, A.; Klijn, P.; Maltais, F.; Nyberg, A. Inter-day test-retest reliability and feasibility of isokinetic, isometric, and isotonic measurements to assess quadriceps endurance in people with chronic obstructive pulmonary disease: A multicenter study. Chronic Respir. Dis. 2019, 16, 1479973118816497. [Google Scholar] [CrossRef]
- Webber, S.C.; Porter, M.M. Reliability of ankle isometric, isotonic, and isokinetic strength and power testing in older women. Phys. Ther. 2010, 90, 1165–1175. [Google Scholar] [CrossRef] [PubMed]
- Perkin, O.J.; McGuigan, P.M.; Thompson, D.; Stokes, K.A. Habitual physical activity levels do not predict leg strength and power in healthy, active older adults. PLoS ONE 2018, 13, e0200089. [Google Scholar] [CrossRef]
- Redden, J.; Stokes, K.; Williams, S. Establishing the Reliability and Limits of Meaningful Change of Lower Limb Strength and Power Measures during Seated Leg Press in Elite Soccer Players. J. Sport. Sci. Med. 2018, 17, 539–546. [Google Scholar]
- Liu, C.J.; Marie, D.; Fredrick, A.; Bertram, J.; Utley, K.; Fess, E.E. Predicting hand function in older adults: Evaluations of grip strength, arm curl strength, and manual dexterity. Aging Clin. Exp. Res. 2017, 29, 753–760. [Google Scholar] [CrossRef] [Green Version]
- Otero, M.; Esain, I.; González-Suarez, Á.M.; Gil, S.M. The effectiveness of a basic exercise intervention to improve strength and balance in women with osteoporosis. Clin. Interv. Aging 2017, 12, 505–513. [Google Scholar] [CrossRef] [PubMed] [Green Version]
- Haruyama, K.; Kawakami, M.; Otsuka, T. Effect of Core Stability Training on Trunk Function, Standing Balance, and Mobility in Stroke Patients. Neurorehabilit. Neural Repair. 2017, 31, 240–249. [Google Scholar] [CrossRef] [PubMed] [Green Version]
- Pagé, I.; Descarreaux, M. Trunk muscle fatigue during a lateral isometric hold test: What are we evaluating? Chiropr. Man. Ther. 2012, 20, 12. [Google Scholar] [CrossRef] [PubMed] [Green Version]
- Dekkers, K.; Janssen-Potten, Y.; Gordon, A.M.; Speth, L.; Smeets, R.; Rameckers, E. Reliability of maximum isometric arm, grip and pinch strength measurements in children (7–12 years) with unilateral spastic cerebral palsy. Disabil. Rehabil. 2020, 42, 1448–1453. [Google Scholar] [CrossRef]
- Johnsen, M.B.; Eitzen, I.; Moksnes, H.; Risberg, M.A. Inter- and intrarater reliability of four single-legged hop tests and isokinetic muscle torque measurements in children. Knee Surg. Sport. Traumatol. Arthrosc. 2015, 23, 1907–1916. [Google Scholar] [CrossRef] [Green Version]
- Schrama, P.P.; Stenneberg, M.S.; Lucas, C.; van Trijffel, E. Intraexaminer reliability of hand-held dynamometry in the upper extremity: A systematic review. Arch. Phys. Med. Rehabil. 2014, 95, 2444–2469. [Google Scholar] [CrossRef]
- IJspeert, J.; Kerstens, H.; Janssen, R.M.J.; Geurts, A.C.H.; van Alfen, N.; Groothuis, J.T. Validity and reliability of serratus anterior hand held dynamometry. BMC Musculoskelet. Disord. 2019, 20, 360. [Google Scholar] [CrossRef] [Green Version]
- Fredriksen, P.M.; Mamen, A.; Hjelle, O.P.; Lindberg, M. Handgrip strength in 6–12-year-old children: The Health Oriented Pedagogical Project (HOPP). Scand. J. Public Health 2018, 46, 54–60. [Google Scholar] [CrossRef]
- Li, S.; Zhang, R.; Pan, G.; Zheng, L.; Li, C. Handgrip strength is associated with insulin resistance and glucose metabolism in adolescents: Evidence from National Health and Nutrition Examination Survey 2011 to 2014. Pediatr. Diabetes 2018, 19, 375–380. [Google Scholar] [CrossRef] [PubMed]
- Ramírez-Vélez, R.; Peña-Ibagon, J.C.; Martínez-Torres, J.; Tordecilla-Sanders, A.; Correa-Bautista, J.E.; Lobelo, F.; García-Hermoso, A. Handgrip strength cutoff for cardiometabolic risk index among Colombian children and adolescents: The FUPRECOL Study. Sci. Rep. 2017, 7, 42622. [Google Scholar] [CrossRef]
- James, L.P.; Comfort, P.; Suchomel, T.J.; Kelly, V.G.; Beckman, E.M.; Haff, G.G. Influence of Power Clean Ability and Training Age on Adaptations to Weightlifting-Style Training. J. Strength Cond. Res. 2019, 33, 2936–2944. [Google Scholar] [CrossRef] [Green Version]
- Marriner, C.R.; Cronin, J.B.; Macadam, P.; Storey, A. Redistributing load using wearable resistance during power clean training improves athletic performance. Eur. J. Sport Sci. 2017, 17, 1101–1109. [Google Scholar] [CrossRef] [PubMed]
- Lee, S.; DeRosia, K.D.; Lamie, L.M. Evaluating the contribution of lower extremity kinetics to whole body power output during the power snatch. Sport. Biomech. 2018, 17, 554–556. [Google Scholar] [CrossRef] [PubMed]
- Winchester, J.B.; Porter, J.M.; McBride, J.M. Changes in bar path kinematics and kinetics through use of summary feedback in power snatch training. J. Strength Cond. Res. 2009, 23, 444–454. [Google Scholar] [CrossRef] [PubMed]
- Ammar, A.; Riemann, B.L.; Trabelsi, K.; Blaumann, M.; Abdelkarim, O.; Chtourou, H.; Driss, T.; Hökelmann, A. Comparison of 2- and 3-Minute Inter-Repetition Rest Periods on Maximal Jerk Technique and Power Maintenance. Res. Q. Exerc. Sport 2019, 90, 287–296. [Google Scholar] [CrossRef]
- Flores, F.J.; Sedano, S.; Redondo, J.C. Optimal Load and Power Spectrum During Jerk and Back Jerk in Competitive Weightlifters. J. Strength Cond. Res. 2017, 31, 809–816. [Google Scholar] [CrossRef]
- Ben Othman, A.; Chaouachi, A.; Chaouachi, M.; Makhlouf, I.; Farthing, J.P.; Granacher, U.; Behm, D.G. Dominant and nondominant leg press training induce similar contralateral and ipsilateral limb training adaptations with children. Appl. Physiol. Nutr. Metab. 2019, 44, 973–984. [Google Scholar] [CrossRef] [PubMed]
- Myer, G.D.; Kushner, A.M.; Brent, J.L.; Schoenfeld, B.J.; Hugentobler, J.; Lloyd, R.S.; Vermeil, A.; Chu, D.A.; Harbin, J.; McGill, S.M. The back squat: A proposed assessment of functional deficits and technical factors that limit performance. Strength Cond. J. 2014, 36, 4–27. [Google Scholar] [CrossRef] [PubMed]
- Kushner, A.M.; Brent, J.L.; Schoenfeld, B.J.; Hugentobler, J.; Lloyd, R.S.; Vermeil, A.; Chu, D.A.; Harbin, J.; McGill, S.M.; Myer, G.D. The Back Squat Part 2: Targeted Training Techniques to Correct Functional Deficits and Technical Factors that Limit Performance. Strength Cond. J. 2015, 37, 13–60. [Google Scholar] [CrossRef] [PubMed] [Green Version]
- Faigenbaum, A.D.; Ratamess, N.A.; McFarland, J.; Kaczmarek, J.; Coraggio, M.J.; Kang, J.; Hoffman, J.R. Effect of rest interval length on bench press performance in boys, teens, and men. Pediatr. Exerc. Sci. 2008, 20, 457–469. [Google Scholar] [CrossRef] [PubMed]
- Ford, K.R.; Myer, G.D.; Smith, R.L.; Byrnes, R.N.; Dopirak, S.E.; Hewett, T.E. Use of an overhead goal alters vertical jump performance and biomechanics. J. Strength Cond. Res. 2005, 19, 394–399. [Google Scholar] [CrossRef] [Green Version]
- Quatman, C.E.; Ford, K.R.; Myer, G.D.; Hewett, T.E. Maturation leads to gender differences in landing force and vertical jump performance: A longitudinal study. Am. J. Sport. Med. 2006, 34, 806–813. [Google Scholar] [CrossRef]
- Lees, A.; Vanrenterghem, J.; De Clercq, D. The energetics and benefit of an arm swing in submaximal and maximal vertical jump performance. J. Sport. Sci. 2006, 24, 51–57. [Google Scholar] [CrossRef]
- Lees, A.; Vanrenterghem, J.; De Clercq, D. The maximal and submaximal vertical jump: Implications for strength and conditioning. J. Strength Cond. Res. 2004, 18, 787–791. [Google Scholar] [CrossRef]
- González-Ravé, J.M.; Machado, L.; Navarro-Valdivielso, F.; Vilas-Boas, J.P. Acute effects of heavy-load exercises, stretching exercises, and heavy-load plus stretching exercises on squat jump and countermovement jump performance. J. Strength Cond. Res. 2009, 23, 472–479. [Google Scholar] [CrossRef]
- Janicijevic, D.; Knezevic, O.M.; Mirkov, D.M.; Pérez-Castilla, A.; Petrovic, M.; Samozino, P.; García-Ramos, A. The force-velocity relationship obtained during the squat jump exercise is meaningfully influenced by the initial knee angle. Sport. Biomech. 2020, 21, 1136–1145. [Google Scholar] [CrossRef]
- Petrigna, L.; Karsten, B.; Marcolin, G.; Paoli, A.; D’Antona, G.; Palma, A.; Bianco, A. A Review of Countermovement and Squat Jump Testing Methods in the Context of Public Health Examination in Adolescence: Reliability and Feasibility of Current Testing Procedures. Front. Physiol. 2019, 10, 1384. [Google Scholar] [CrossRef] [PubMed] [Green Version]
- Gillen, Z.M.; Jahn, L.E.; Shoemaker, M.E.; McKay, B.D.; Mendez, A.I.; Bohannon, N.A.; Cramer, J.T. Effects of Eccentric Preloading on Concentric Vertical Jump Performance in Youth Athletes. J. Appl. Biomech. 2019, 35, 327–335. [Google Scholar] [CrossRef] [PubMed]
- Jones, C.M.; McNarry, M.A.; Owen, N.J. The effect of body size on countermovement jump kinetics in children aged 7–11 years. Eur. J. Sport Sci. 2020, 20, 174–181. [Google Scholar] [CrossRef] [PubMed]
- Gomez-Bruton, A.; Gabel, L.; Nettlefold, L.; Macdonald, H.; Race, D.; McKay, H. Estimation of Peak Muscle Power from a Countermovement Vertical Jump in Children and Adolescents. J. Strength Cond. Res. 2019, 33, 390–398. [Google Scholar] [CrossRef]
- De Miguel-Etayo, P.; Gracia-Marco, L.; Ortega, F.B.; Intemann, T.; Foraita, R.; Lissner, L.; Oja, L.; Barba, G.; Michels, N.; Tornaritis, M.; et al. Physical fitness reference standards in European children: The IDEFICS study. Int. J. Obes. 2014, 38 (Suppl. S2), S57–S66. [Google Scholar] [CrossRef] [Green Version]
- Arena, S.; Riley, L.; Schilz, G.; Schultz, E.; Watterworth, B.; Peterson, E. Fitness Measures Among Boy Scouts Completing the Personal Fitness Merit Badge. Cureus 2018, 10, e2538. [Google Scholar] [CrossRef] [Green Version]
- Law, B.; Bruner, B.; Scharoun Benson, S.M.; Anderson, K.; Gregg, M.; Hall, N.; Lane, K.; MacDonald, D.J.; Saunders, T.J.; Sheehan, D.; et al. Associations between teacher training and measures of physical literacy among Canadian 8- to 12-year-old students. BMC Public Health 2018, 18, 1039. [Google Scholar] [CrossRef] [Green Version]
- Tremblay, M.S.; Longmuir, P.E.; Barnes, J.D.; Belanger, K.; Anderson, K.D.; Bruner, B.; Copeland, J.L.; Delisle Nyström, C.; Gregg, M.J.; Hall, N.; et al. Physical literacy levels of Canadian children aged 8–12 years: Descriptive and normative results from the RBC Learn to Play-CAPL project. BMC Public Health 2018, 18, 1036. [Google Scholar] [CrossRef] [Green Version]
- Mayorga-Vega, D.; Merino-Marban, R.; Viciana, J. Criterion-Related Validity of Sit-and-Reach Tests for Estimating Hamstring and Lumbar Extensibility: A Meta-Analysis. J. Sport. Sci. Med. 2014, 13, 1–14. [Google Scholar]
- Tucker, J.; Moore, M.; Rooy, J.; Wright, A.; Rothschild, C.; Werk, L.N. Reliability of Common Lower Extremity Biomechanical Measures of Children with and without Obesity. Pediatr. Phys. Ther. 2015, 27, 250–256. [Google Scholar] [CrossRef]
- An, M.H.; Yi, C.H.; Jeon, H.S.; Park, S.Y. Age-related changes of single-limb standing balance in children with and without deafness. Int. J. Pediatr. Otorhinolaryngol. 2009, 73, 1539–1544. [Google Scholar] [CrossRef] [PubMed] [Green Version]
- Davies, P.L.; Rose, J.D. Motor skills of typically developing adolescents: Awkwardness or improvement? Phys. Occup. Ther. Pediatr. 2000, 20, 19–42. [Google Scholar] [CrossRef] [PubMed]
- Eguchi, R.; Takada, S. Usefulness of the tri-axial accelerometer for assessing balance function in children. Pediatr. Int. 2014, 56, 753–758. [Google Scholar] [CrossRef] [PubMed]
- Ozinga, S.J.; Linder, S.M.; Koop, M.M.; Dey, T.; Figler, R.; Russman, A.N.; So, R.; Rosenthal, A.H.; Cruickshank, J.; Alberts, J.L. Normative Performance on the Balance Error Scoring System by Youth, High School, and Collegiate Athletes. J. Athl. Train. 2018, 53, 636–645. [Google Scholar] [CrossRef] [Green Version]
- Richmond, S.B.; Dames, K.D.; Shad, J.M.; Sutherlin, M.A.; Fling, B.W. Setting boundaries: Utilization of time to boundary for objective evaluation of the balance error scoring system. J. Sport. Sci. 2020, 38, 21–28. [Google Scholar] [CrossRef]
- Houston, M.N.; Hoch, M.C.; Malvasi, S.R.; Peck, K.Y.; Svoboda, S.J.; Cameron, K.L. Level of Agreement between Human-Rated and Instrumented Balance Error Scoring System Scores. Ann. Biomed. Eng. 2019, 47, 2128–2135. [Google Scholar] [CrossRef]
- Butz, S.M.; Sweeney, J.K.; Roberts, P.L.; Rauh, M.J. Relationships among age, gender, anthropometric characteristics, and dynamic balance in children 5 to 12 years old. Pediatr. Phys. Ther. 2015, 27, 126–133. [Google Scholar] [CrossRef]
- Erden, A.; Acar Arslan, E.; Dündar, B.; Topbaş, M.; Cavlak, U. Reliability and validity of Turkish version of pediatric balance scale. Acta Neurol. Belg. 2020, 121, 669–675. [Google Scholar] [CrossRef]
- Zhu, M.; Huang, Z.; Ma, C.; Li, Y. An Objective Balance Error Scoring System for Sideline Concussion Evaluation Using Duplex Kinect Sensors. Sensors 2017, 17, 2398. [Google Scholar] [CrossRef] [Green Version]
- Cushman, D.; Hendrick, J.; Teramoto, M.; Fogg, B.; Bradley, S.; Hansen, C. Reliability of the balance error scoring system in a population with protracted recovery from mild traumatic brain injury. Brain Inj. 2018, 32, 569–574. [Google Scholar] [CrossRef]
- King, L.A.; Mancini, M.; Fino, P.C.; Chesnutt, J.; Swanson, C.W.; Markwardt, S.; Chapman, J.C. Sensor-Based Balance Measures Outperform Modified Balance Error Scoring System in Identifying Acute Concussion. Ann. Biomed. Eng. 2017, 45, 2135–2145. [Google Scholar] [CrossRef] [PubMed]
- Faigenbaum, A.D.; Myer, G.D.; Fernandez, I.P.; Carrasco, E.G.; Bates, N.; Farrell, A.; Ratamess, N.A.; Kang, J. Feasibility and reliability of dynamic postural control measures in children in first through fifth grades. Int. J. Sport. Phys. Ther. 2014, 9, 140–148. [Google Scholar]
- Schwiertz, G.; Brueckner, D.; Schedler, S.; Kiss, R.; Muehlbauer, T. Performance and reliability of the Lower Quarter Y Balance Test in healthy adolescents from grade 6 to 11. Gait Posture 2019, 67, 142–146. [Google Scholar] [CrossRef] [PubMed]
- Read, P.J.; Oliver, J.L.; De Ste Croix, M.B.A.; Myer, G.D.; Lloyd, R.S. A Review of Field-Based Assessments of Neuromuscular Control and Their Utility in Male Youth Soccer Players. J. Strength Cond. Res. 2019, 33, 283–299. [Google Scholar] [CrossRef]
- Carbone, P.S.; Smith, P.J.; Lewis, C.; LeBlanc, C. Promoting the Participation of Children and Adolescents with Disabilities in Sports, Recreation, and Physical Activity. Pediatrics 2021, 148, e2021054664. [Google Scholar] [CrossRef]
- Wicks, L.J.; Telford, R.M.; Cunningham, R.B.; Semple, S.J.; Telford, R.D. Does physical education influence eye-hand coordination? The Lifestyles of our Kids intervention study. Scand. J. Med. Sci. Sport. 2017, 27, 1824–1832. [Google Scholar] [CrossRef]
- Rappelt, L.; Held, S.; Donath, L. Concentric not eccentric cycling sprint intervals acutely impair balance and jump performance in healthy active young adults: A randomized controlled cross-over study. Gait Posture 2021, 90, 55–60. [Google Scholar] [CrossRef]
- Castro-Piñero, J.; Chillón, P.; Ortega, F.B.; Montesinos, J.L.; Sjöström, M.; Ruiz, J.R. Criterion-related validity of sit-and-reach and modified sit-and-reach test for estimating hamstring flexibility in children and adolescents aged 6–17 years. Int. J. Sport. Med. 2009, 30, 658–662. [Google Scholar] [CrossRef]
- Han, Y.O.; Lee, B.S. Development of Physical Activity Competence Test Battery and Evaluation Standards for Korean Children. Children 2022, 9, 79. [Google Scholar] [CrossRef]
- Kasović, M.; Štefan, L.; Petrić, V.; Štemberger, V.; Blažević, I. Functional endurance capacity is associated with multiple other physical fitness components in 7–14-year-olds: A cross-sectional study. BMC Public Health 2021, 21, 669. [Google Scholar] [CrossRef]
- Malina, R.M. Early sport specialization: Roots, effectiveness, risks. Curr. Sport. Med. Rep. 2010, 9, 364–371. [Google Scholar] [CrossRef] [PubMed]
- Plisky, P.; Schwartkopf-Phifer, K.; Huebner, B.; Garner, M.B.; Bullock, G. Systematic Review and Meta-Analysis of the Y-Balance Test Lower Quarter: Reliability, Discriminant Validity, and Predictive Validity. Int. J. Sport. Phys. Ther. 2021, 16, 1190–1209. [Google Scholar] [CrossRef] [PubMed]
- Cairney, J.; Hay, J.A.; Veldhuizen, S.; Missiuna, C.; Faught, B.E. Developmental coordination disorder, sex, and activity deficit over time: A longitudinal analysis of participation trajectories in children with and without coordination difficulties. Dev. Med. Child Neurol. 2010, 52, e67–e72. [Google Scholar] [CrossRef] [PubMed]
- Sallis, J.F.; Prochaska, J.J.; Taylor, W.C.; Hill, J.O.; Geraci, J.C. Correlates of physical activity in a national sample of girls and boys in grades 4 through 12. Health Psychol. 1999, 18, 410–415. [Google Scholar] [CrossRef] [PubMed]
- Kimm, S.Y.; Glynn, N.W.; Obarzanek, E.; Kriska, A.M.; Daniels, S.R.; Barton, B.A.; Liu, K. Relation between the changes in physical activity and body-mass index during adolescence: A multicentre longitudinal study. Lancet 2005, 366, 301–307. [Google Scholar] [CrossRef] [PubMed]


| Variables | Missing | N | Count (%) or Median (IQR) [Min, Max] | |
|---|---|---|---|---|
| Sex | 0 (0.0%) | 133 | ||
| Male Female | 62 (46.6%) 71 (53.4%) | |||
| Race/Ethnic Background | 45 (33.8%) | 88 | ||
| African American/Black Asian/Pacific Islander Caucasian/White Other Unknown | 5 (5.7%) 4 (4.5%) 49 (55.7%) 5 (5.7%) 25 (28.4%) | |||
| Grades | 58 (43.6%) | 75 | ||
| Kindergarten First Second Third Fourth Fifth Sixth Seventh | 6 (8%) 18 (24%) 20 (26.7%) 14 (18.7%) 8 (10.7%) 7 (9.3%) 1 (1.3%) 1 (1.3%) | |||
| Physical Characteristics | ||||
| Age | 0 (0.0%) | 133 | 7.8 (6.8, 9.3) [6.0, 11.9] | |
| Height (cm) | 7 (5.3%) | 126 | 128.5 (123.0, 138.0) [105, 162] | |
| Weight (kg) | 13 (9.8%) | 120 | 27.2 (22.9, 35.8) [17.2, 95.3] | |
| BMI | 15 (11.3%) | 118 | 16.4 (15.2, 18.6) [12.4, 40.7] | |
| Handedness | 13 (9.8%) | 120 | ||
| Right Left | 108 (90.0%) 12 (10.0%) | |||
| Tests | Missing | N | Median (IQR) [Min, Max] |
|---|---|---|---|
| Hand Grip (kg) | 5 (3.8%) | 128 | 34.0 (20.9, 46.7) [4.7, 88.3] |
| Vertical Jump (cm) | 10 (7.5%) | 123 | 22.3 (18.0, 26.2) [4.3, 42.3] |
| Sit and Reach (cm) | 7 (5.3%) | 126 | −4.2 (−14.4, 2.0) [−19.7, 18.0] |
| Y Balance (composite score) | 6 (4.5%) | 127 | 165.3 (72.1, 93.9) [79.4, 262.4] |
| Obstacle Course Time (seconds) | 10 (7.5%) | 123 | 36.3 (32.4, 43.3) [23.7, 66.3] |
| Obstacle Course Points (max of 47 pts) | 11 (8.3%) | 122 | 29.0 (24.0, 33.0) [10.0, 42.0] |
| Tests | Missing | N | Males (IQR) [Min, Max] | Females (IQR) [Min, Max] | p-Values |
|---|---|---|---|---|---|
| Hand Grip (kg) | 5 (3.8%) | 128 | 33.3 (22.1, 47.1) [7.7, 88.3] | 36.8 (19.3, 46.7) [4.7, 85.0] | 0.784 |
| Vertical Jump (cm) | 10 (7.5%) | 123 | 22.7 (18.7, 26) [4.3, 38.0] | 21.7 (18.0, 26.3) [10.0, 42.3] | 0.881 |
| Sit and Reach (cm) | 7 (5.3%) | 126 | −3.3 (−6.8, −0.8) [−12.7, 7.0] | −0.3 (−4.8, 2.5) [−19.7, 18.0] | 0.002 * |
| Y Balance (composite score) | 6 (4.5%) | 127 | 87.7 (77.3, 97.2) [49.2, 131.2] | 77.3 (71.4, 88.1) [39.7, 129.3] | 0.007 * |
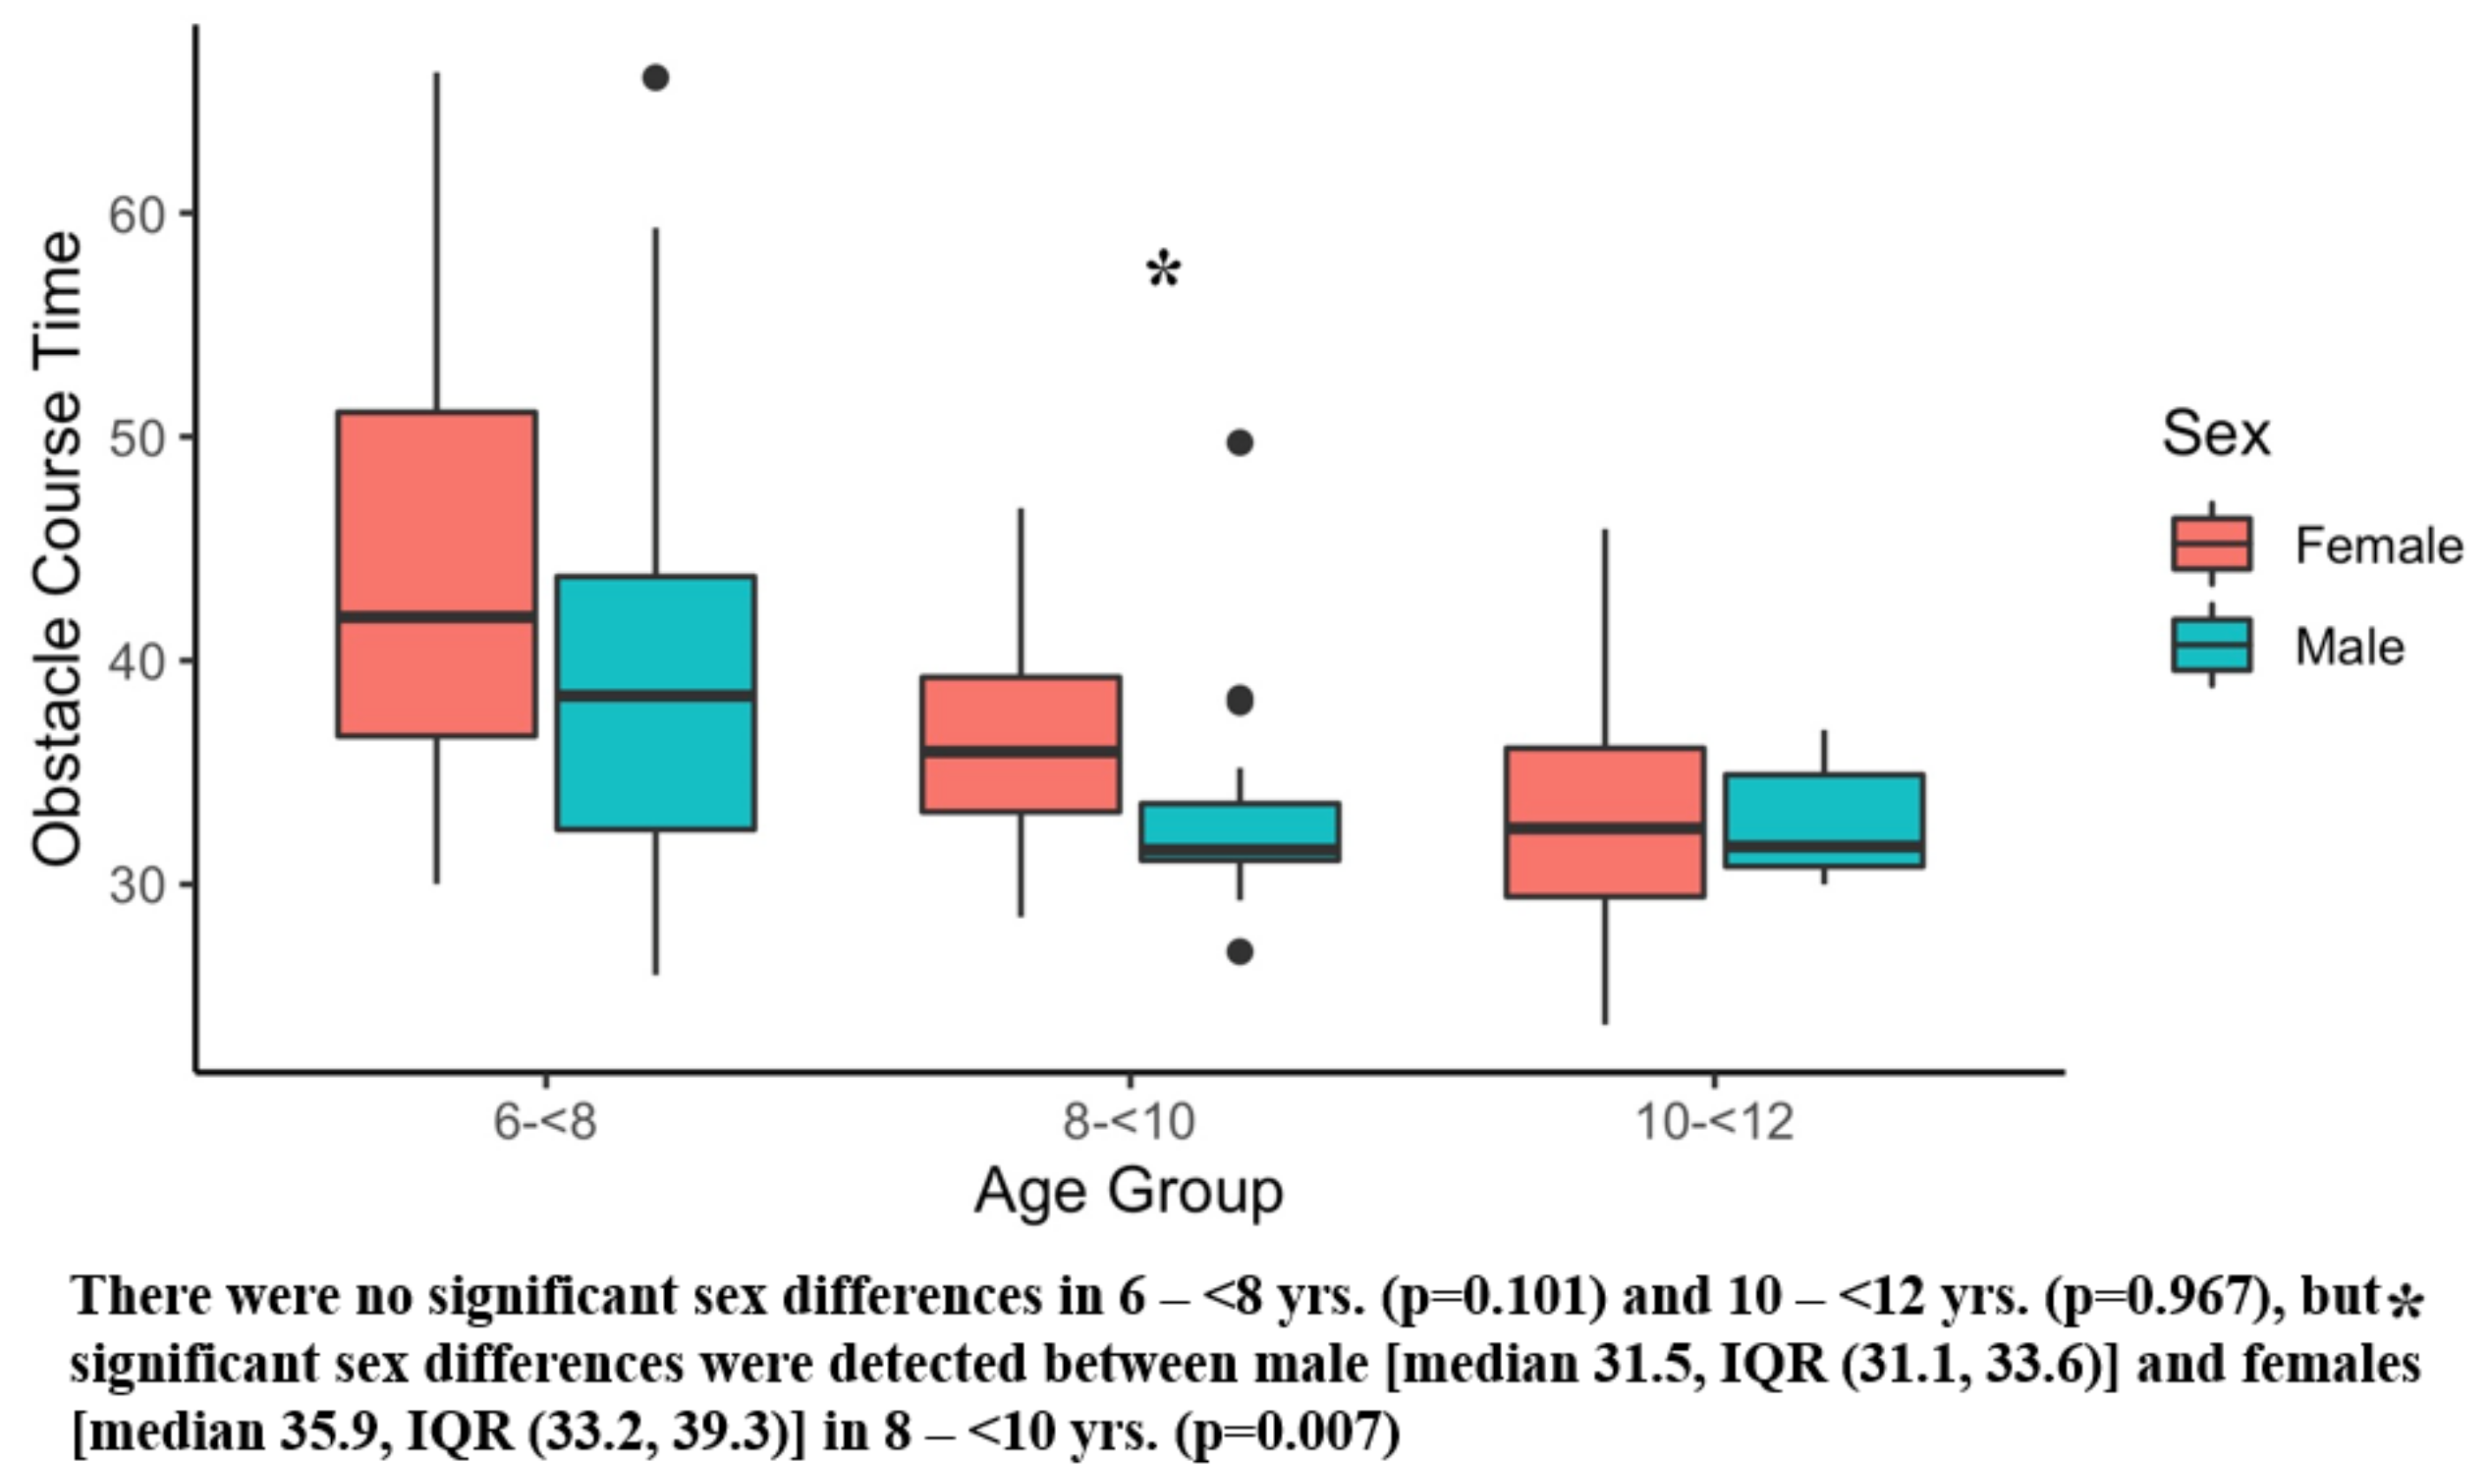
| Obstacle Course Time (seconds) | 10 (7.5%) | 123 | 35.1 (31.2, 41.1) [25.9, 66.0] | 37.3 (33.5, 44.3) [23.7, 66.3] | 0.042 * |
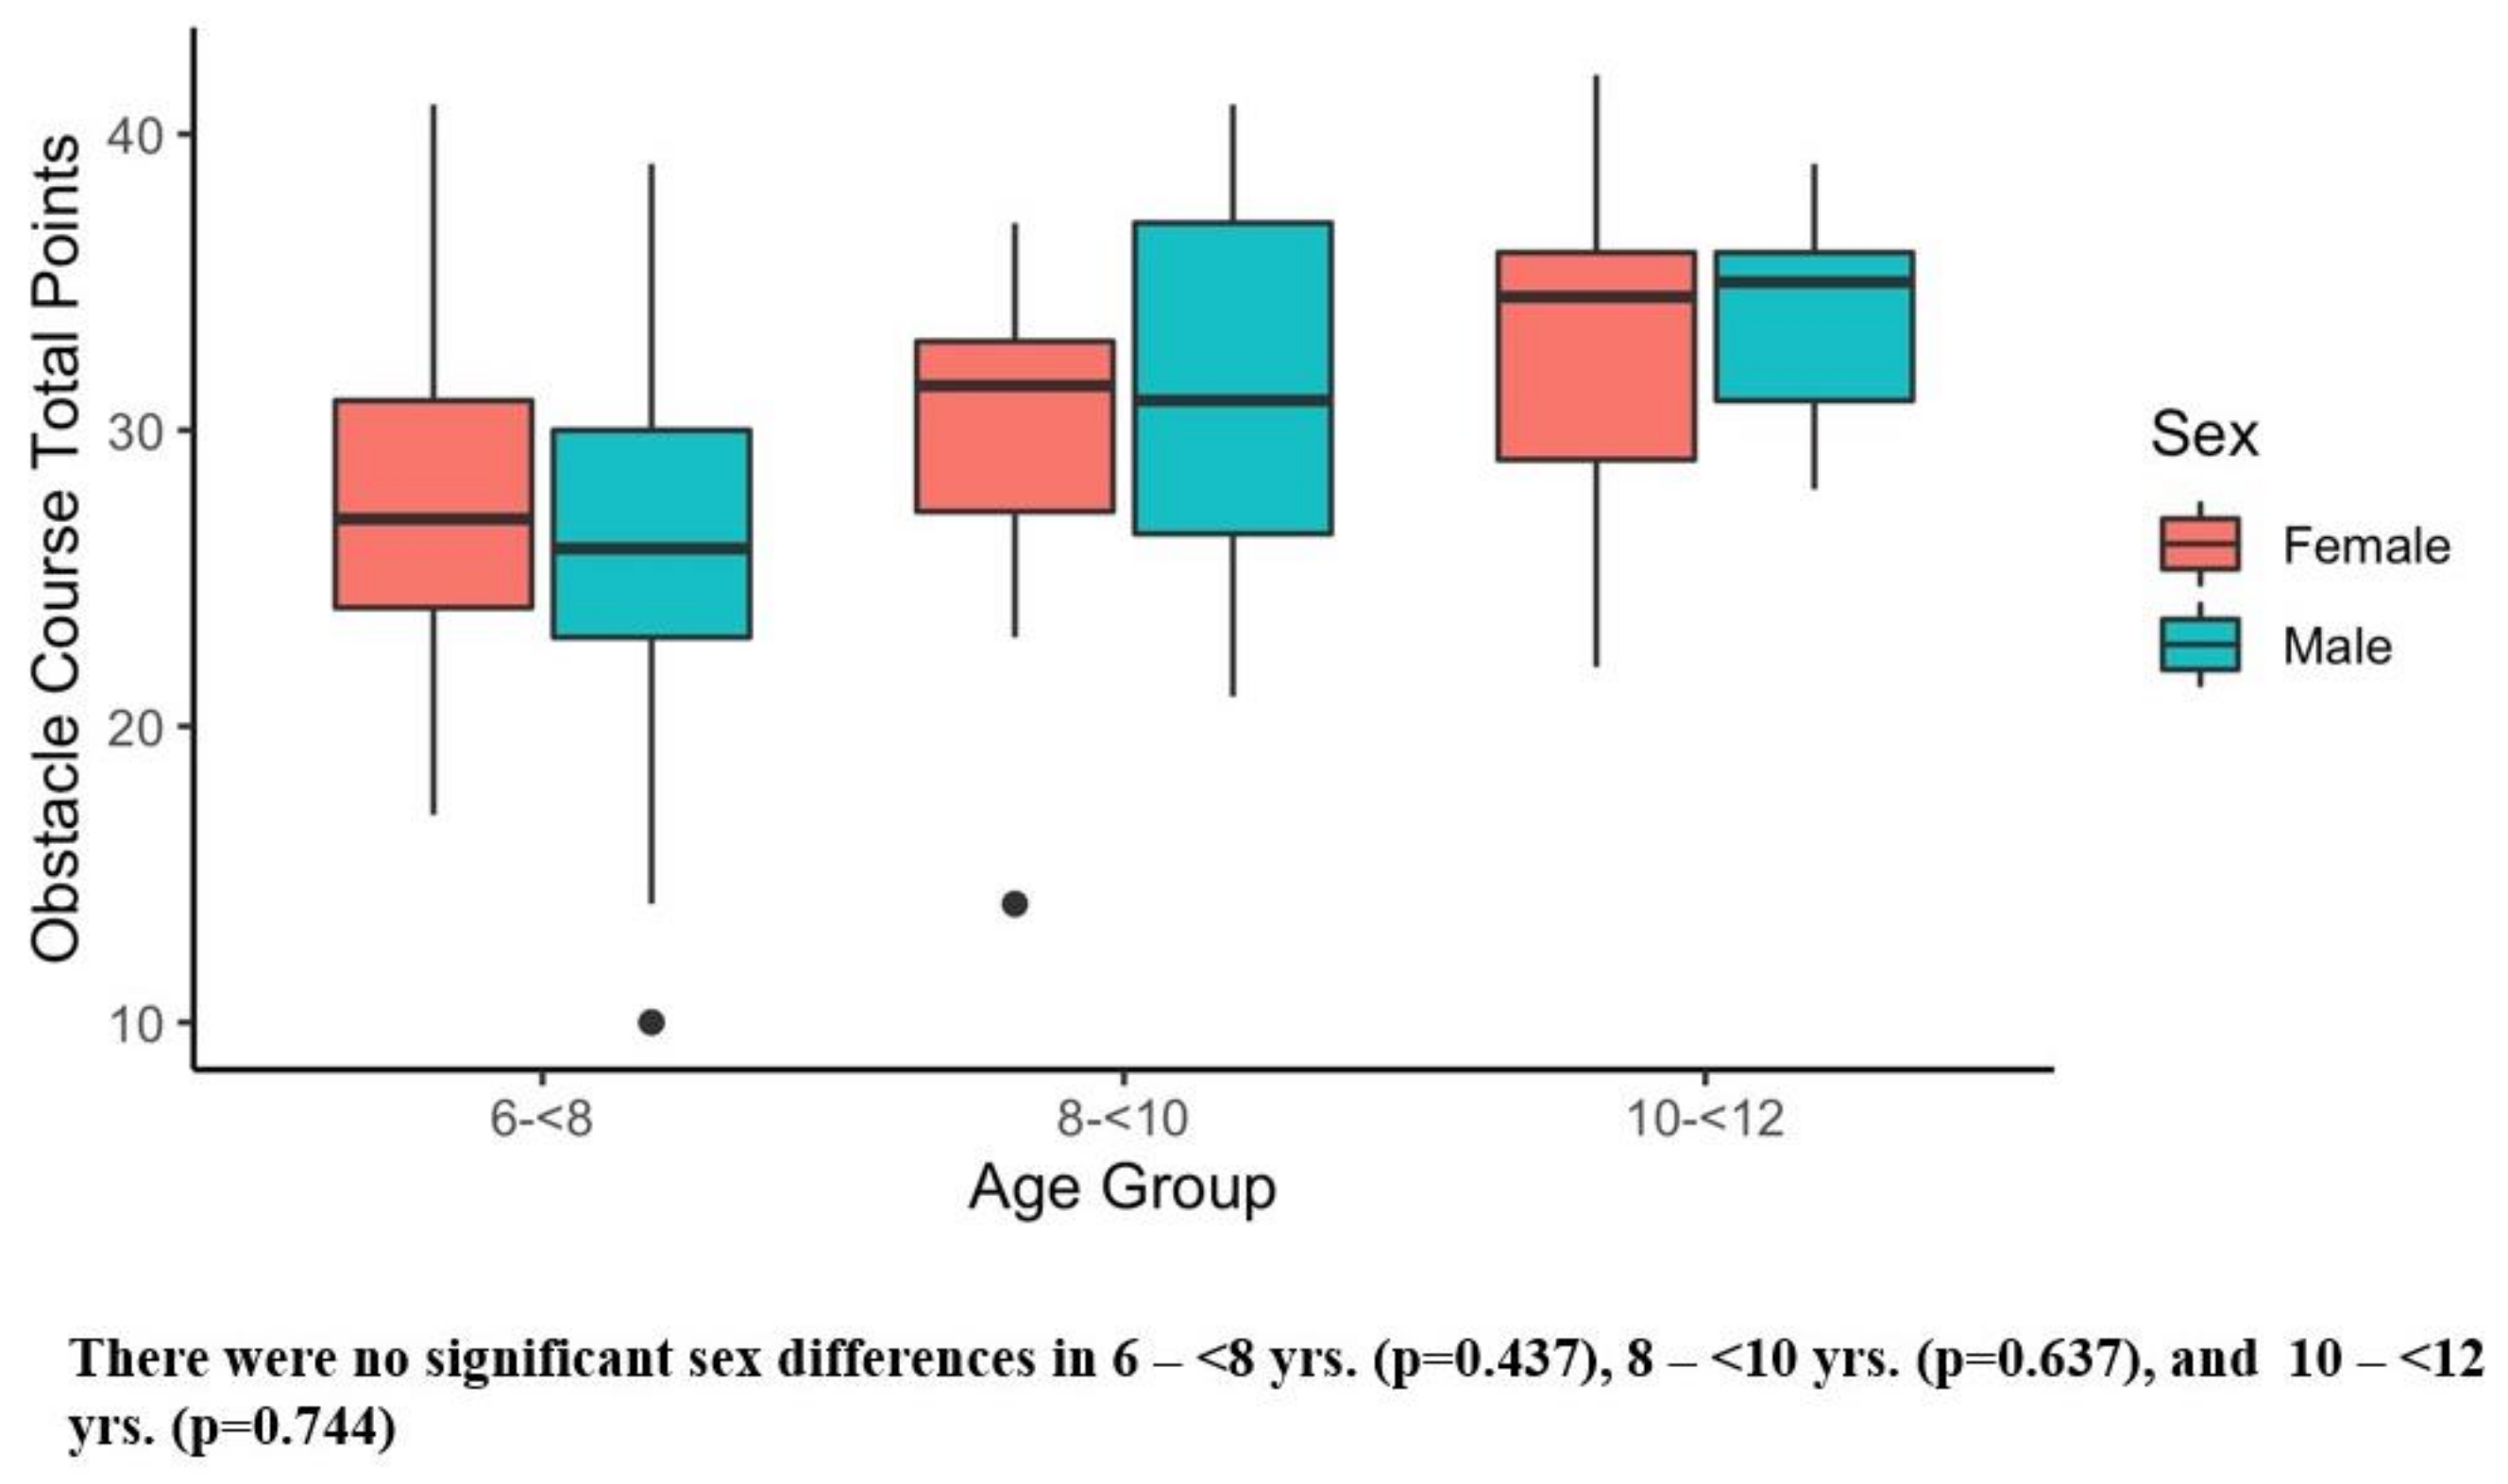
| Obstacle Course Points (max of 47 pts) | 11 (8.3%) | 122 | 29.0 (24.0, 32.0) [10.0, 41.0] | 29.0 (25.0, 34.0) [14.0, 42.0] | 0.424 |
Disclaimer/Publisher’s Note: The statements, opinions and data contained in all publications are solely those of the individual author(s) and contributor(s) and not of MDPI and/or the editor(s). MDPI and/or the editor(s) disclaim responsibility for any injury to people or property resulting from any ideas, methods, instructions or products referred to in the content. |
© 2023 by the authors. Licensee MDPI, Basel, Switzerland. This article is an open access article distributed under the terms and conditions of the Creative Commons Attribution (CC BY) license (https://creativecommons.org/licenses/by/4.0/).
Share and Cite
Sugimoto, D.; Stracciolini, A.; Berbert, L.; Nohelty, E.; Kobelski, G.P.; Parmeter, B.; Weller, E.; Faigenbaum, A.D.; Myer, G.D. Assessment of Physical Tests in 6–11 Years Old Children: Findings from the Play Lifestyle and Activity in Youth (PLAY) Study. Int. J. Environ. Res. Public Health 2023, 20, 2552. https://doi.org/10.3390/ijerph20032552
Sugimoto D, Stracciolini A, Berbert L, Nohelty E, Kobelski GP, Parmeter B, Weller E, Faigenbaum AD, Myer GD. Assessment of Physical Tests in 6–11 Years Old Children: Findings from the Play Lifestyle and Activity in Youth (PLAY) Study. International Journal of Environmental Research and Public Health. 2023; 20(3):2552. https://doi.org/10.3390/ijerph20032552
Chicago/Turabian StyleSugimoto, Dai, Andrea Stracciolini, Laura Berbert, Eric Nohelty, Greggory P. Kobelski, Becky Parmeter, Edie Weller, Avery D. Faigenbaum, and Gregory D. Myer. 2023. "Assessment of Physical Tests in 6–11 Years Old Children: Findings from the Play Lifestyle and Activity in Youth (PLAY) Study" International Journal of Environmental Research and Public Health 20, no. 3: 2552. https://doi.org/10.3390/ijerph20032552