
Physiological and Psychological Responses of Viewing a Waterfall Image: A Crossover Study


Abstract
:1. Introduction
2. Materials and Methods
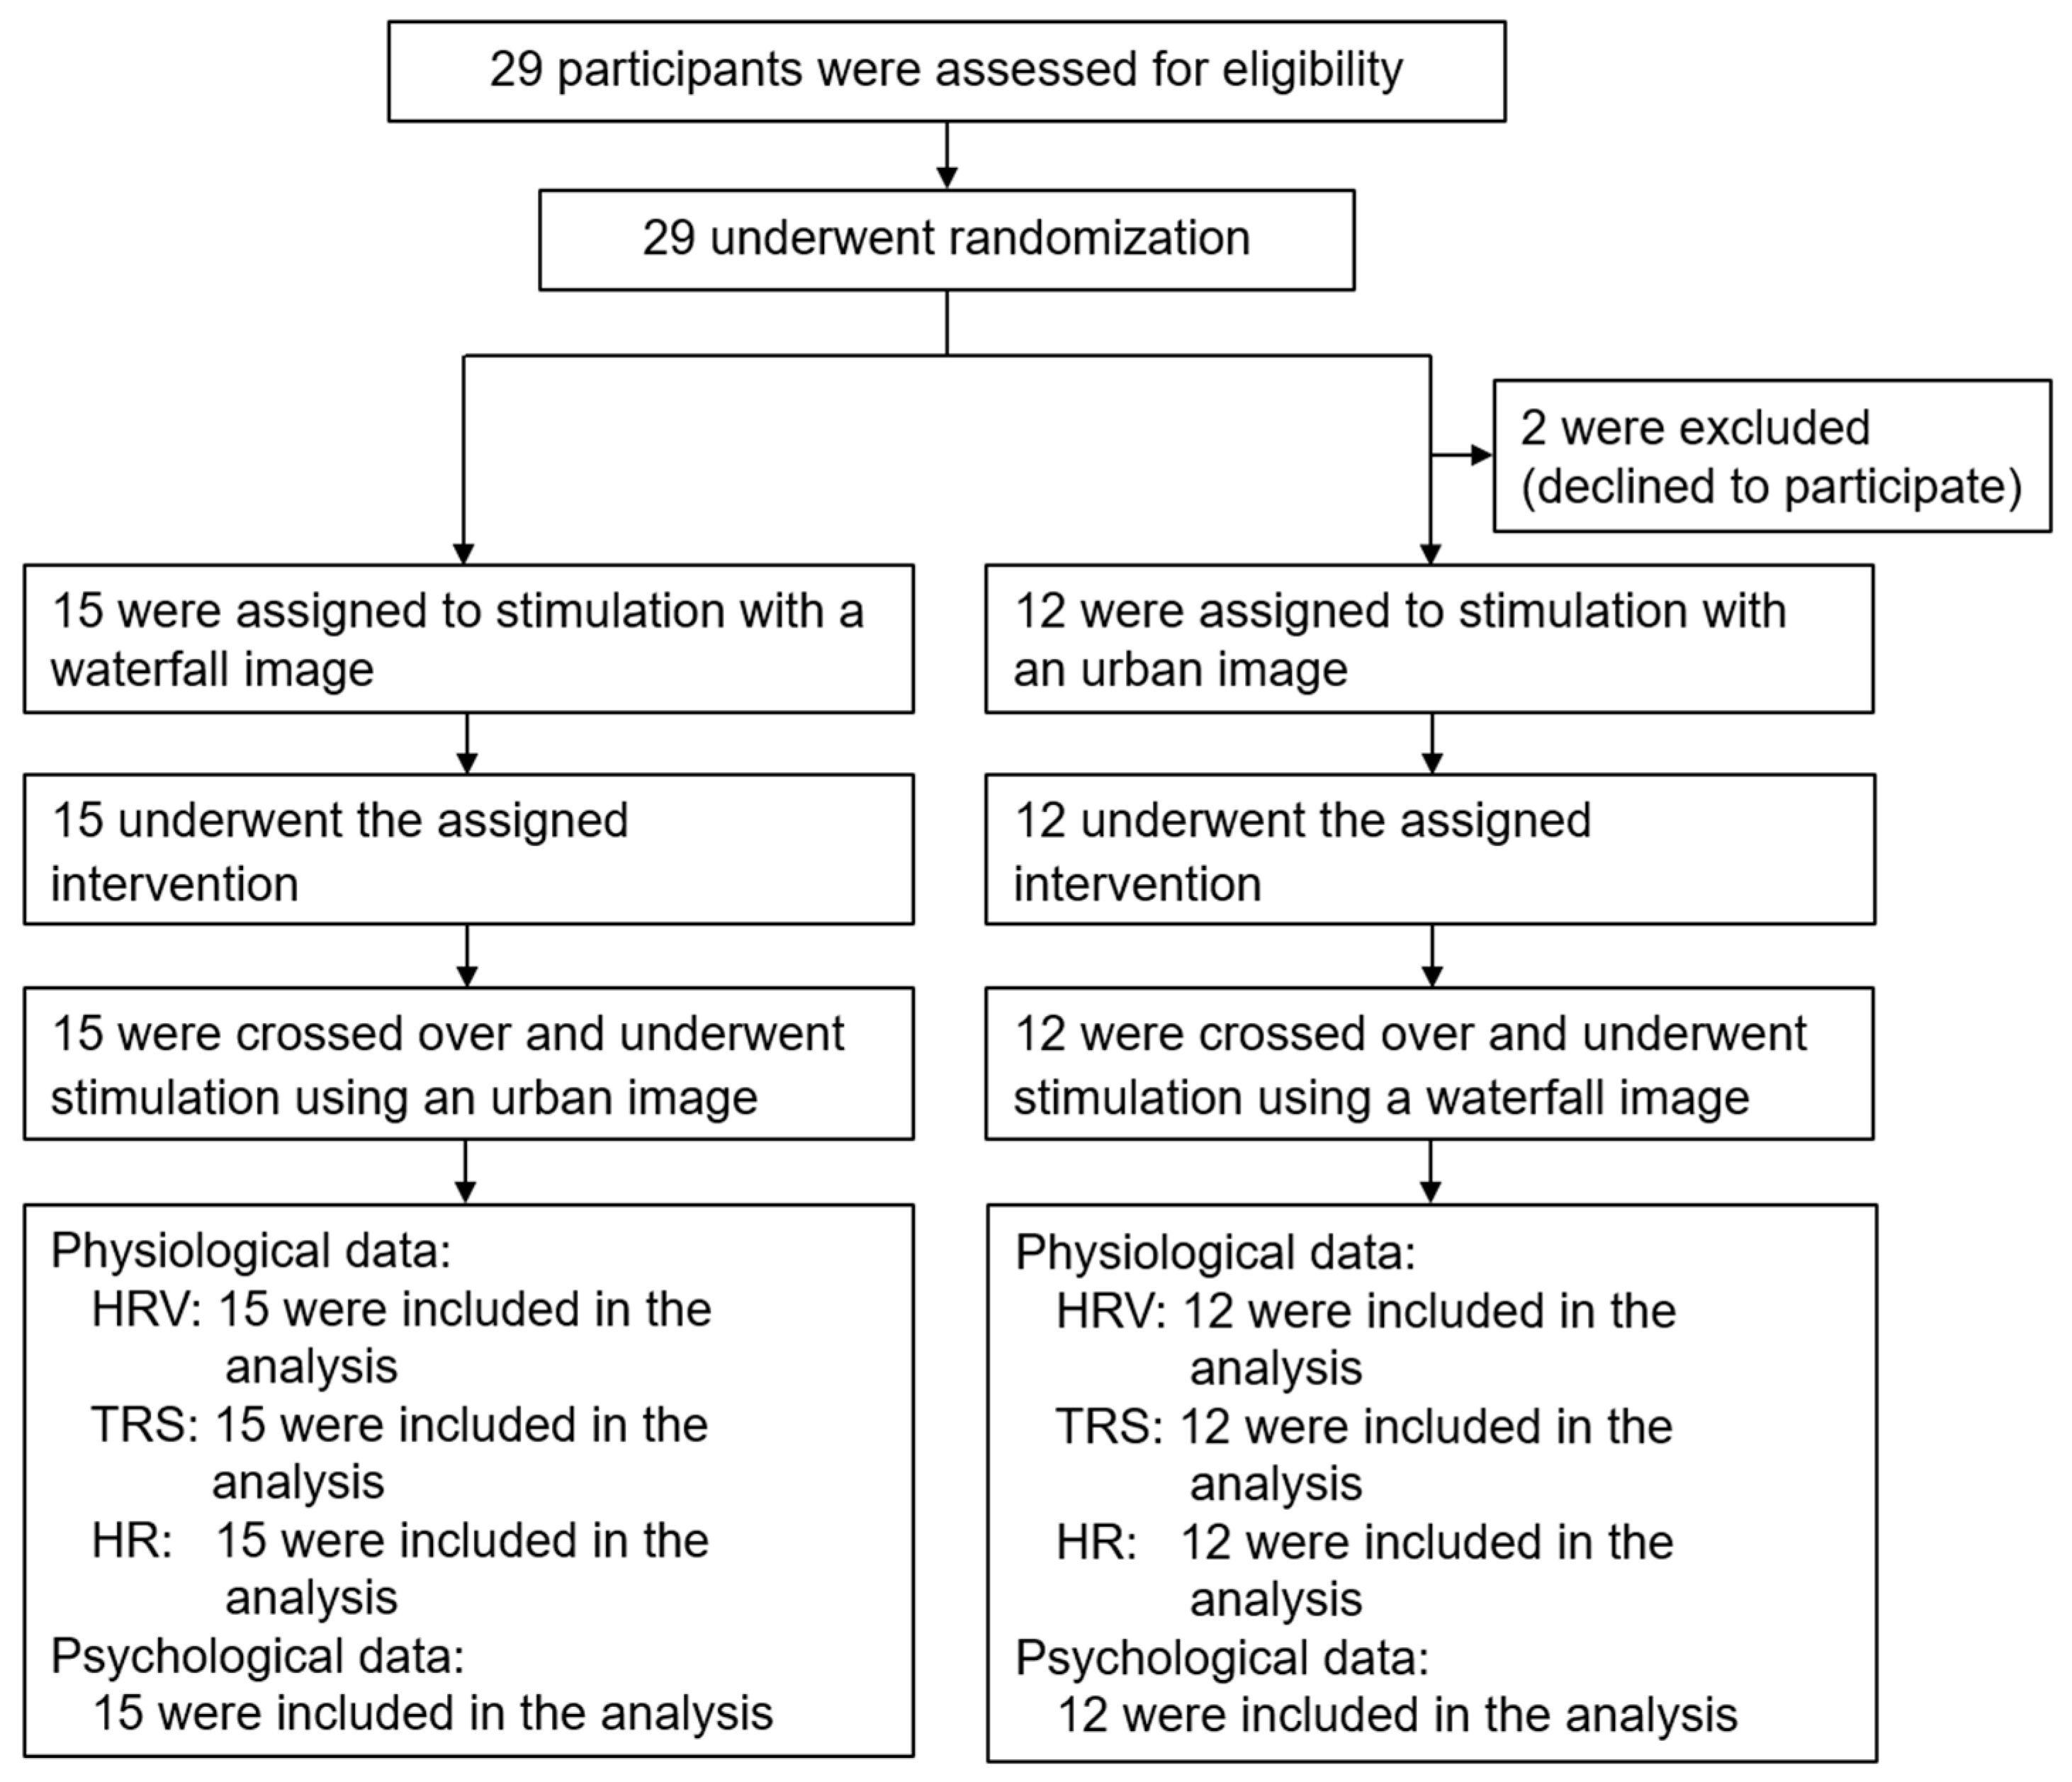
2.1. Participants
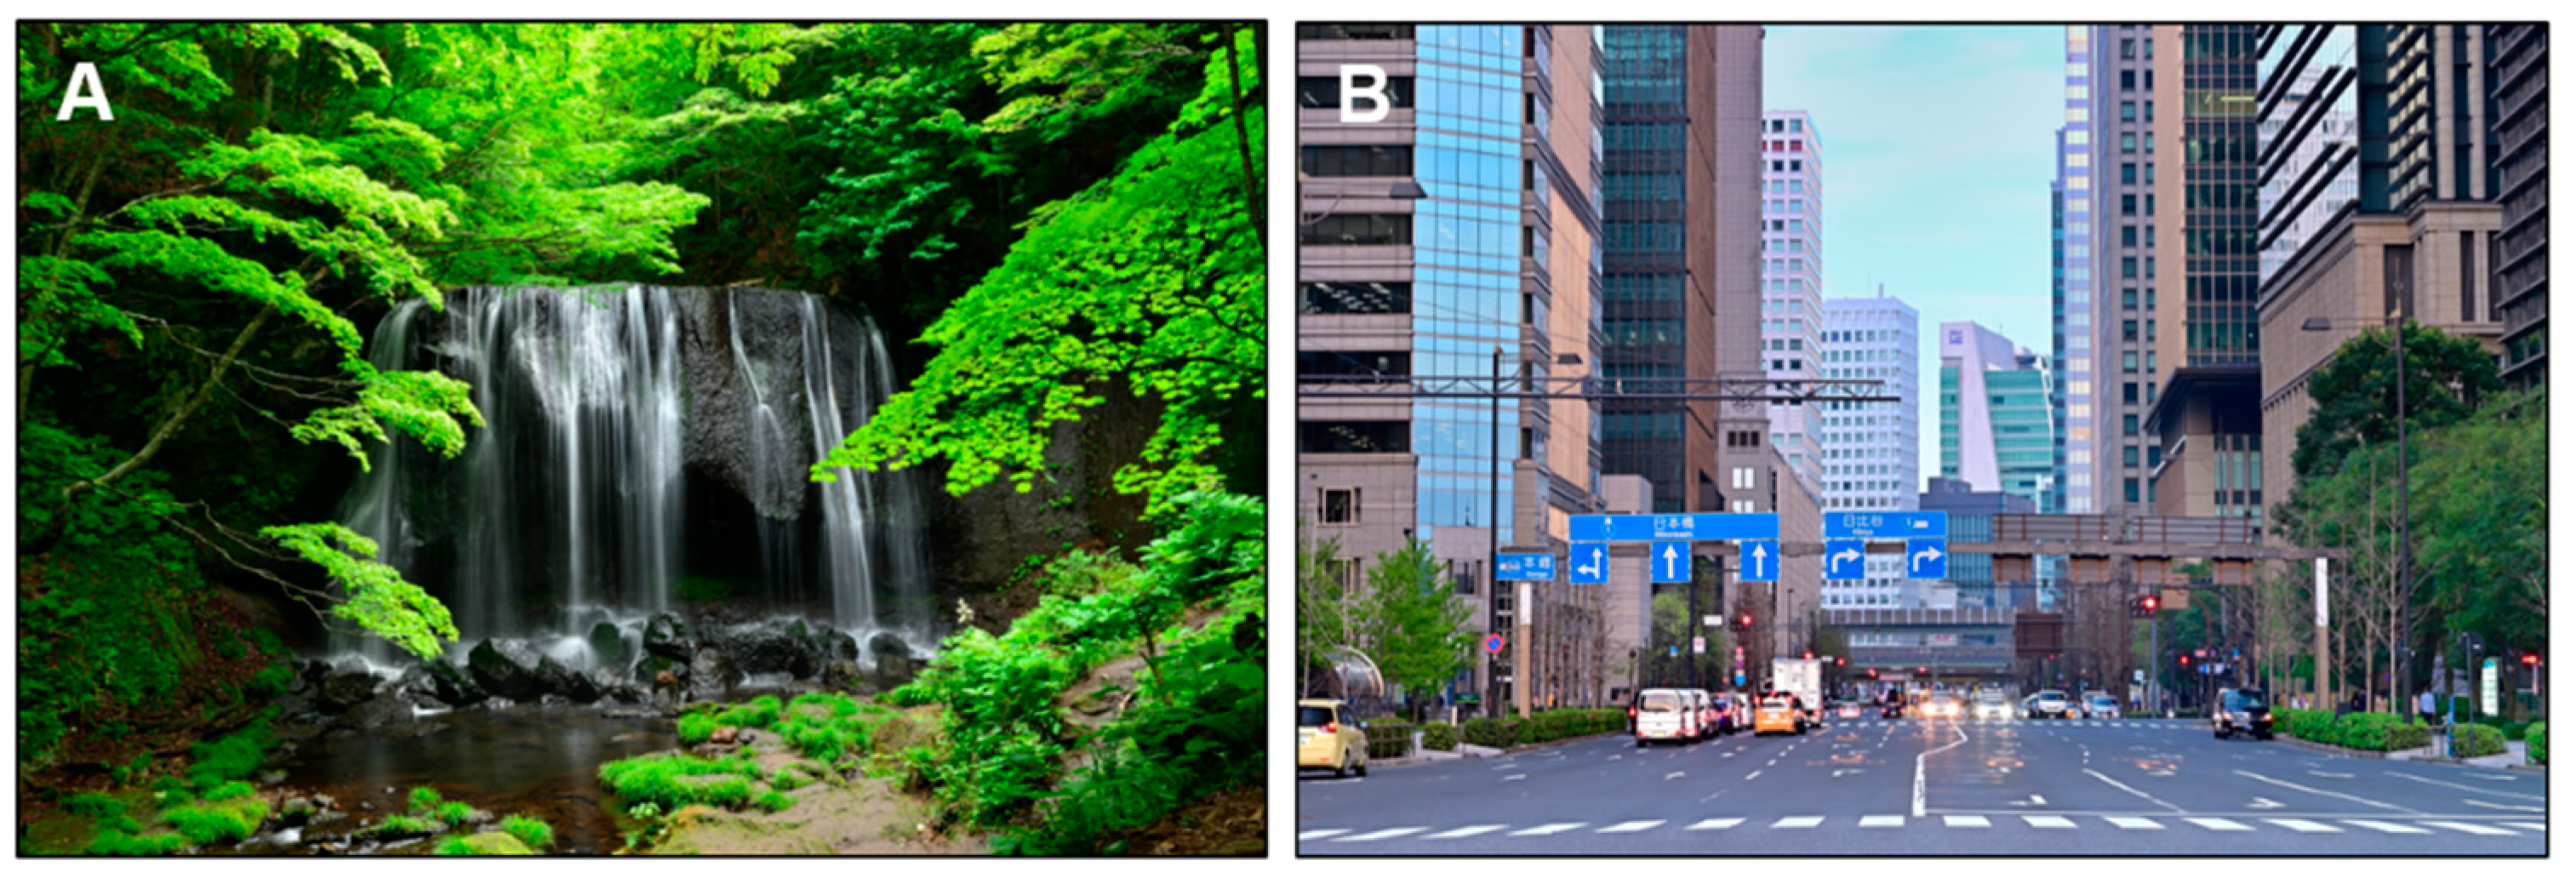
2.2. Stimuli
2.3. Procedure
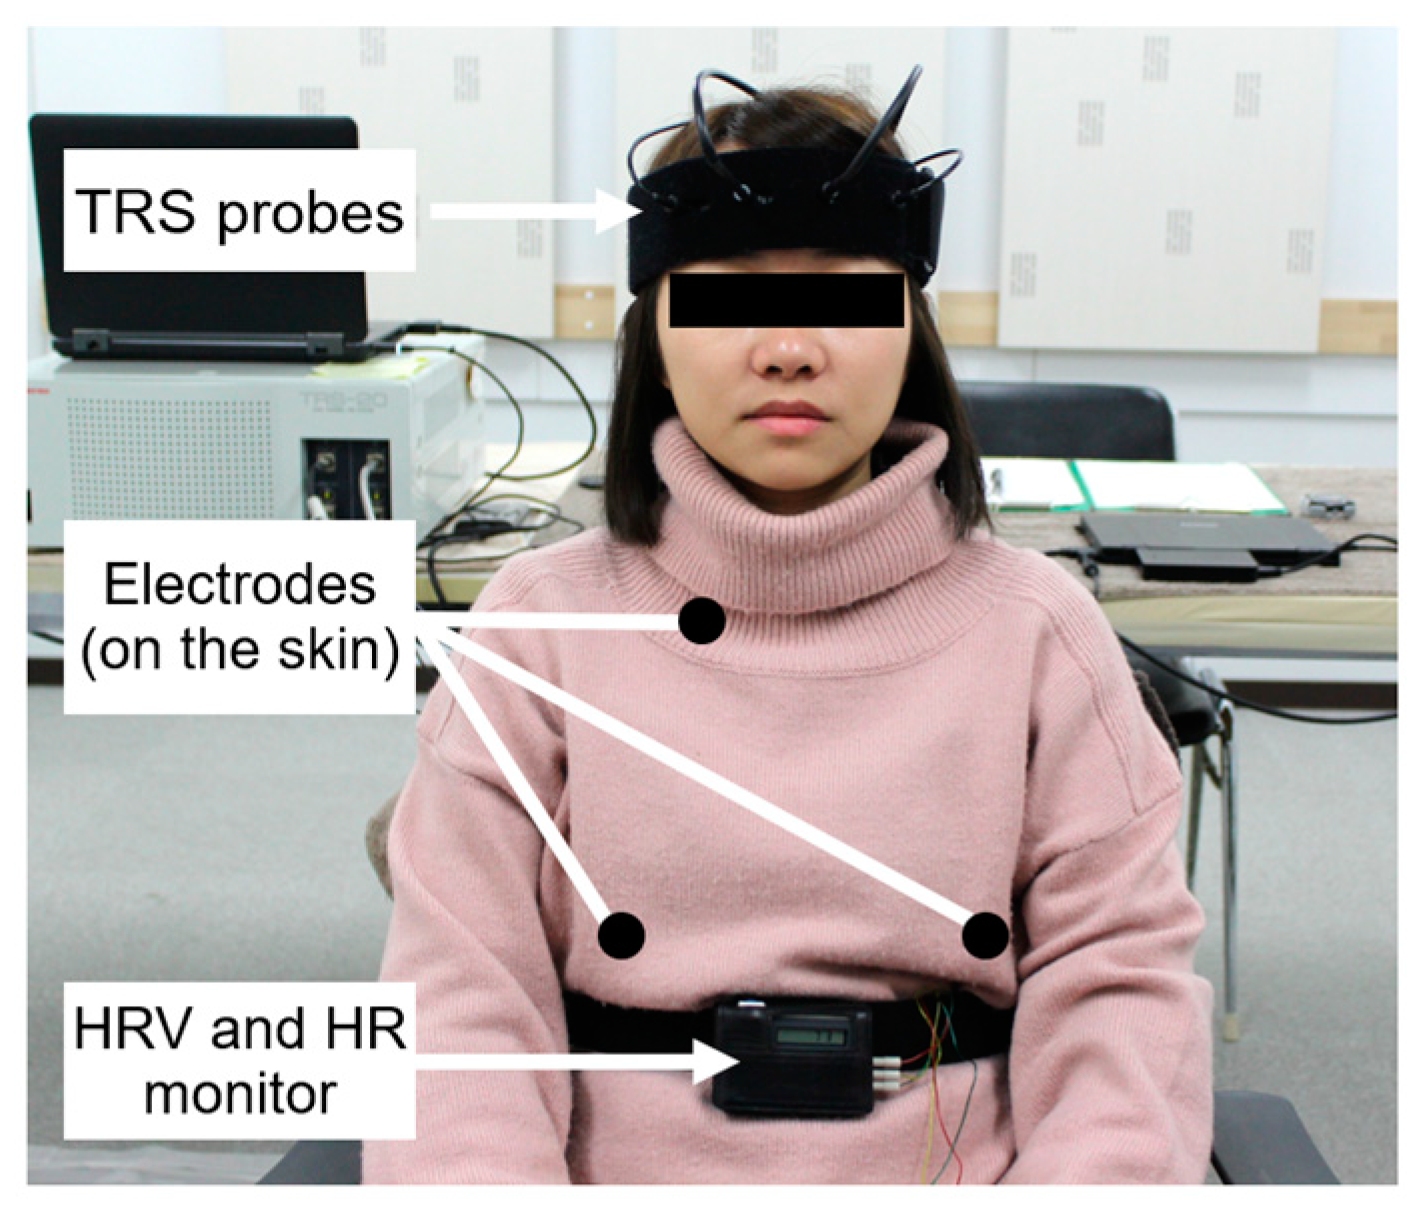
2.4. Physiological Indicators
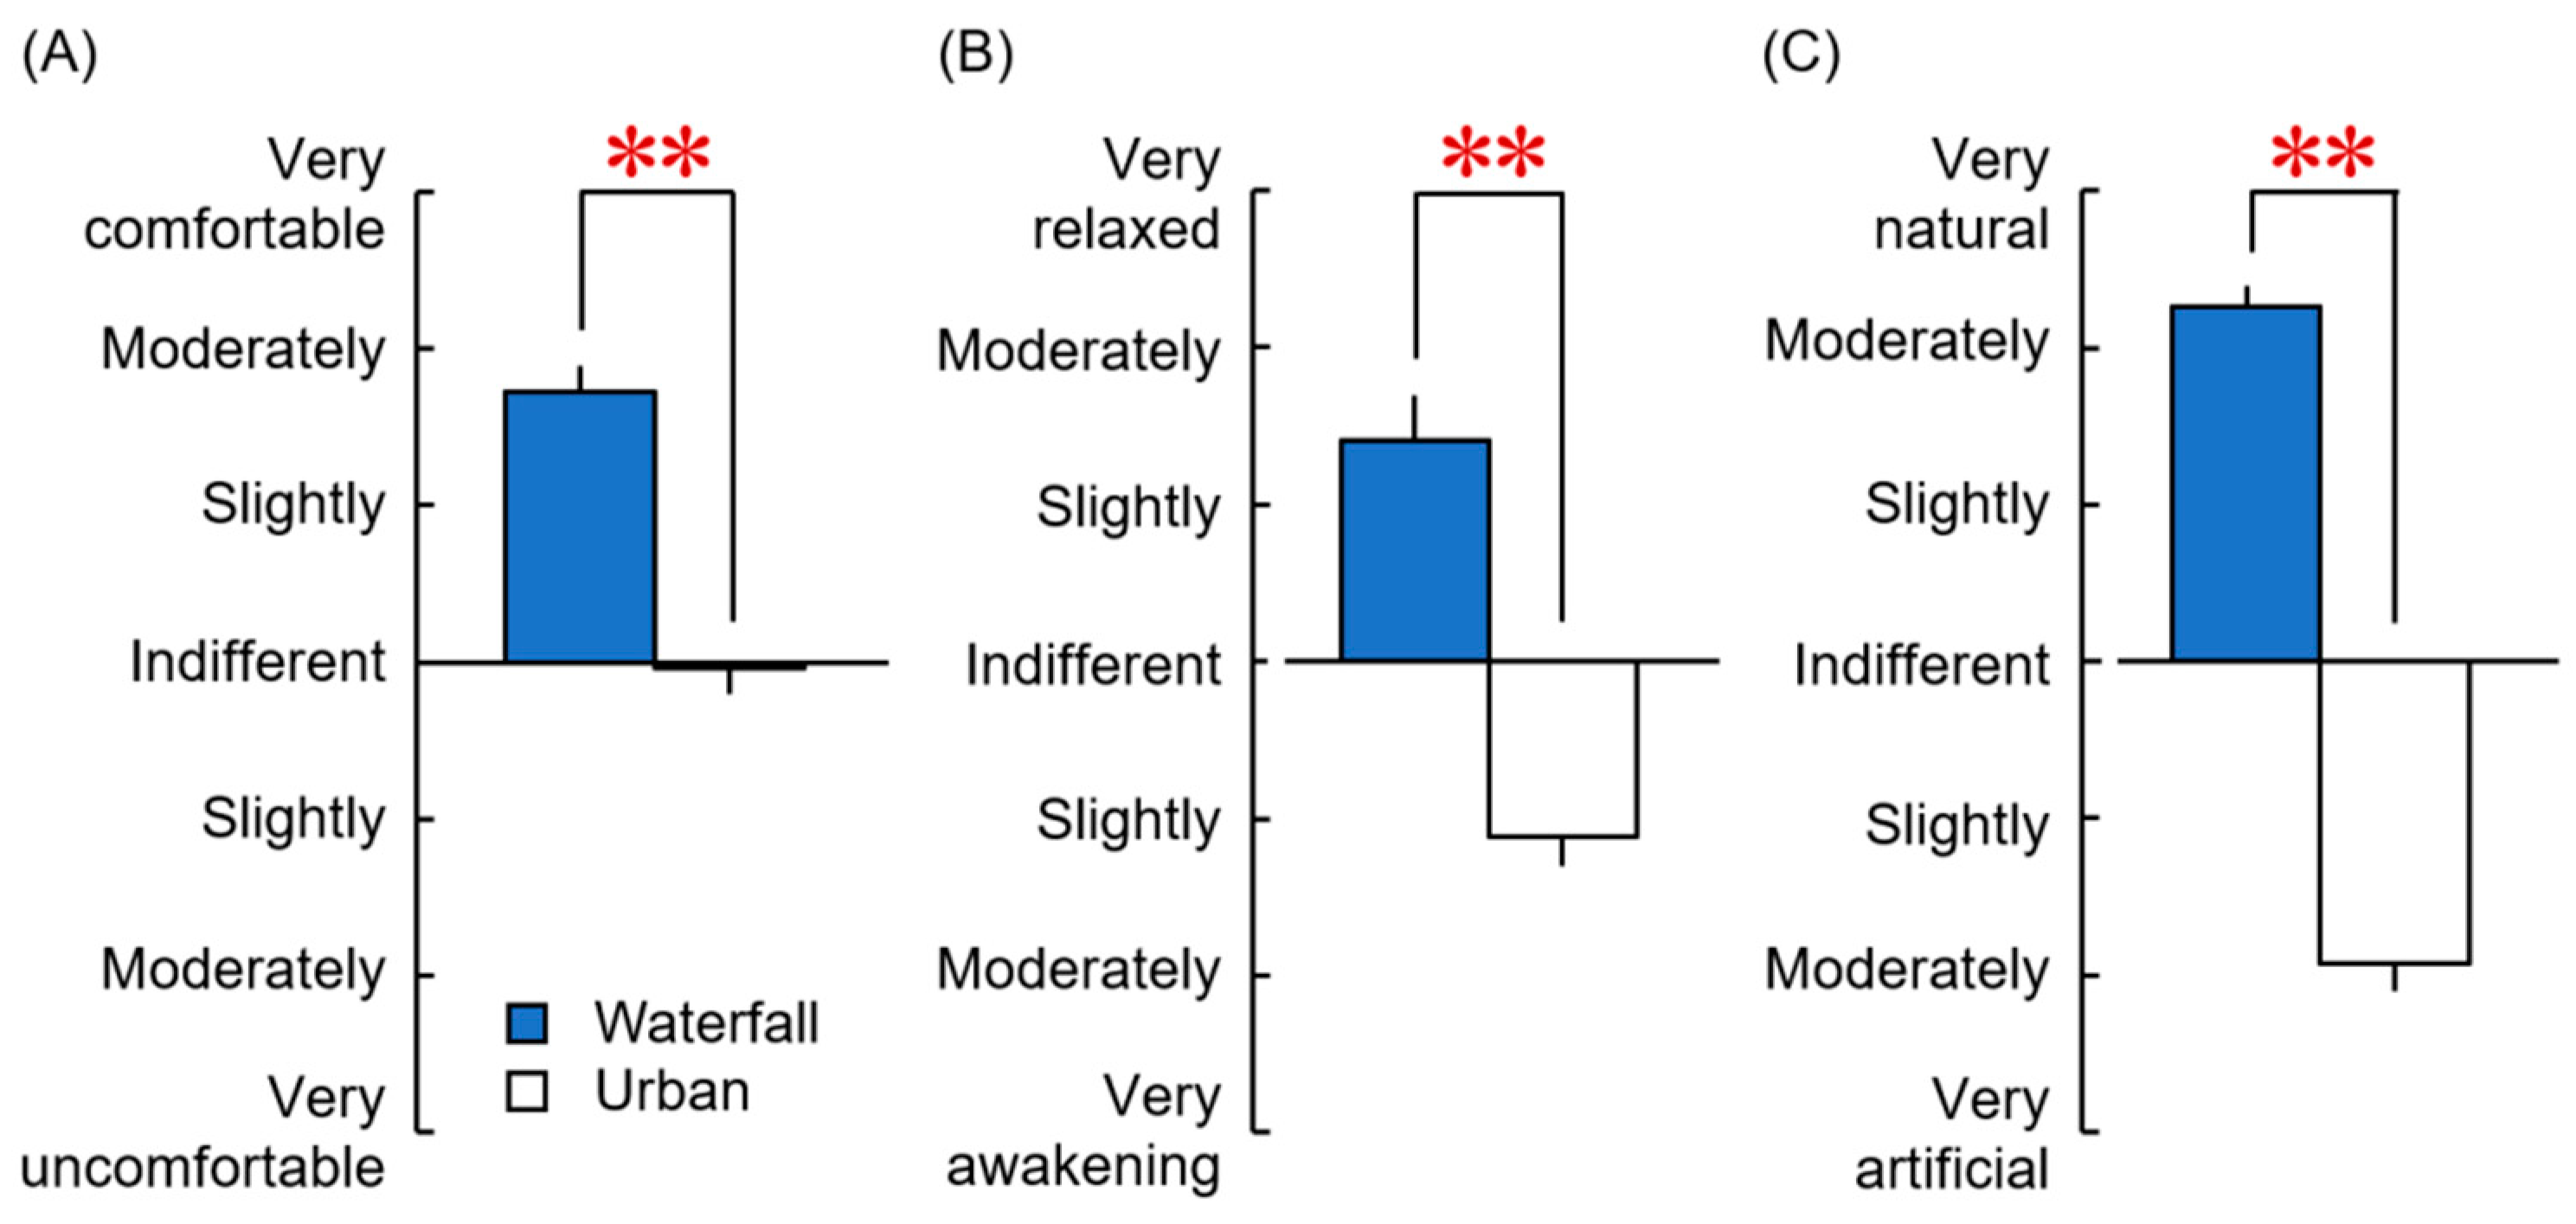
2.5. Psychological Indicators
2.6. Statistical Analysis
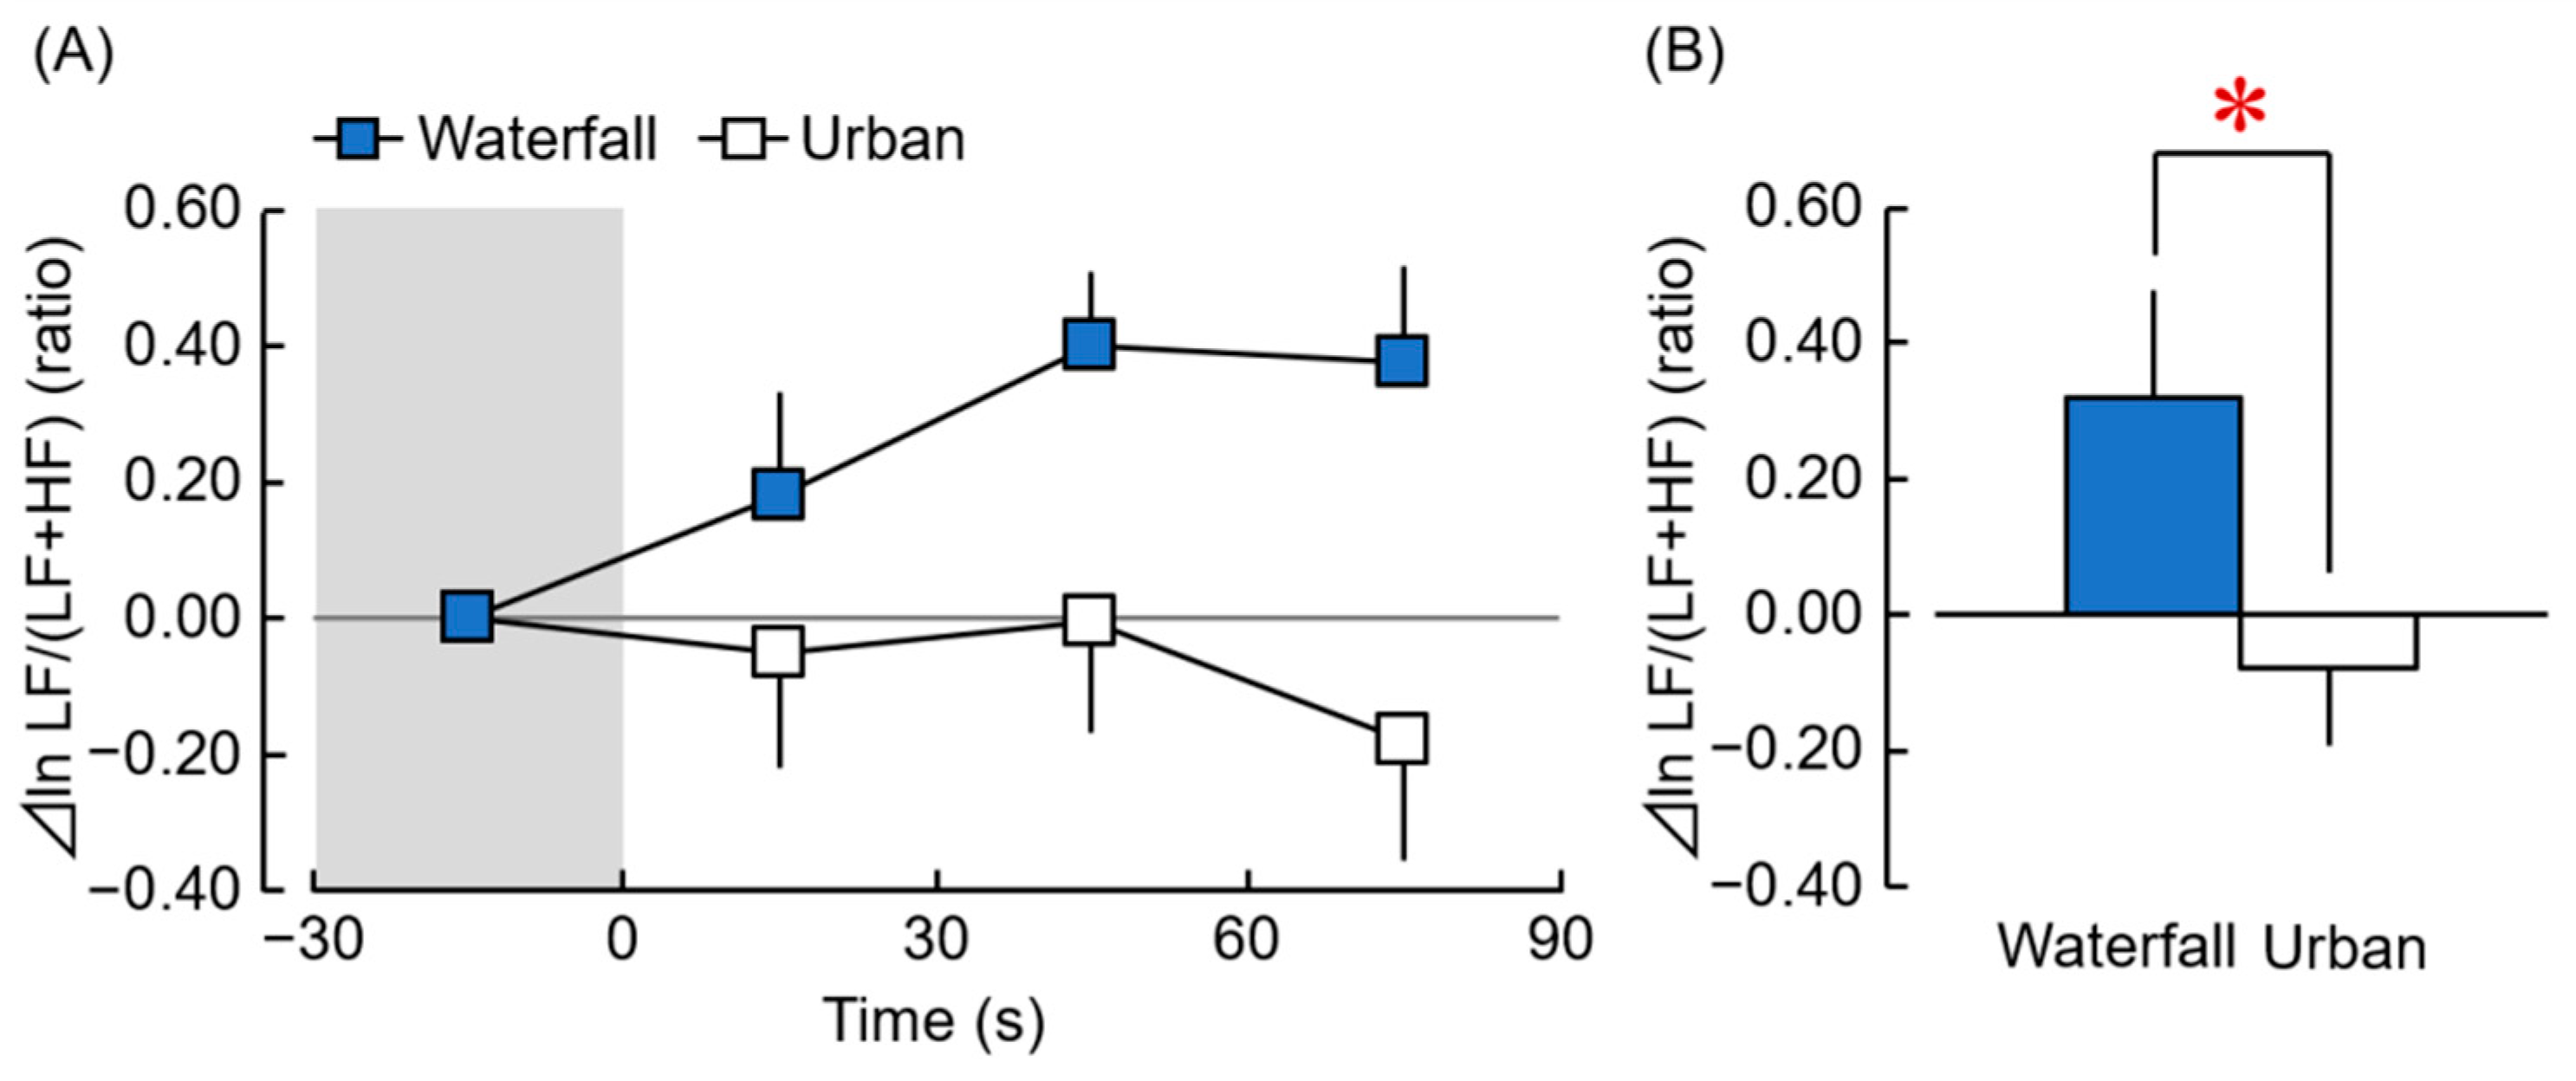
3. Results and Discussion
4. Conclusions
Author Contributions
Funding
Institutional Review Board Statement
Informed Consent Statement
Data Availability Statement
Acknowledgments
Conflicts of Interest
References
- Song, C.; Ikei, H.; Miyazaki, Y. Physiological effects of nature therapy: A review of the research in Japan. Int. J. Environ. Res. Public Health 2016, 13, 781. [Google Scholar] [CrossRef]
- Song, C.; Ikei, H.; Kagawa, T.; Miyazaki, Y. Effect of viewing real forest landscapes on brain activity. Sustainability 2020, 12, 6601. [Google Scholar] [CrossRef]
- Tsunetsugu, Y.; Park, B.J.; Ishii, H.; Hirano, H.; Kagawa, T.; Miyazaki, Y. Physiological effects of Shinrin-yoku (taking in the atmosphere of the forest) in an old-growth broadleaf forest in Yamagata Prefecture, Japan. J. Physiol. Anthropol. 2007, 26, 135–142. [Google Scholar] [CrossRef] [PubMed] [Green Version]
- Park, B.J.; Tsunetsugu, Y.; Kasetani, T.; Kagawa, T.; Miyazaki, Y. The physiological effects of Shinrin-yoku (taking in the forest atmosphere or forest bathing): Evidence from field experiments in 24 forests across Japan. Environ. Health Prev. Med. 2010, 15, 18. [Google Scholar] [CrossRef] [PubMed] [Green Version]
- Kobayashi, H.; Song, C.; Ikei, H.; Kagawa, T.; Miyazaki, Y. Analysis of individual variations in autonomic responses to urban and forest environments. Evid. Based Complement. Alternat. Med. 2015, 2015, 671094. [Google Scholar] [CrossRef] [PubMed] [Green Version]
- Song, C.; Ikei, H.; Kagawa, T.; Miyazaki, Y. Physiological and psychological effects of viewing forests on young women. Forests 2019, 10, 635. [Google Scholar] [CrossRef] [Green Version]
- Igarashi, M.; Yamamoto, T.; Lee, J.; Song, C.; Ikei, H.; Miyazaki, Y. Effects of stimulation by three-dimensional natural images on prefrontal cortex and autonomic nerve activity: A comparison with stimulation using two-dimensional images. Cogn. Process. 2014, 15, 551–556. [Google Scholar] [CrossRef]
- Song, C.; Ikei, H.; Miyazaki, Y. Physiological effects of visual stimulation with forest imagery. Int. J. Environ. Res. Public Health 2018, 15, 213. [Google Scholar] [CrossRef] [Green Version]
- Jo, H.; Ikei, H.; Miyazaki, Y. Physiological and psychological Benefits of viewing an autumn foliage mountain landscape image among young women. Forests 2022, 13, 1492. [Google Scholar] [CrossRef]
- Parsons, R.; Tassinary, L.G.; Ulrich, R.S.; Hebl, M.R.; Grossman-Alexander, M. The view from the road: Implications for stress recovery and immunization. J. Environ. Psychol. 1998, 18, 113–139. [Google Scholar] [CrossRef]
- ISO 8596:2017; Ophthalmic Optics—Visual Acuity Testing—Standard and Clinical Optotypes and Their Presentation. 3rd ed. The International Organization for Standardization (ISO): Geneva, Switzerland, 2017.
- Task Force of the European Society of Cardiology the North American Society of Pacing Electrophysiology. Heart rate variability: Standards of measurement, physiological interpretation, and clinical use. Circulation 1996, 93, 1043–1065. [Google Scholar] [CrossRef] [Green Version]
- Kobayashi, H.; Ishibashi, K.; Noguchi, H. Heart rate variability; an index for monitoring and analyzing human autonomic activities. J. Physiol. Anthropol. Appl. Human Sci. 1999, 18, 53–59. [Google Scholar] [CrossRef] [Green Version]
- Sawada, Y.; Ohtomo, N.; Tanaka, Y.; Tanaka, G.; Yamakoshi, K.; Terachi, S.; Shimamoto, K.; Nakagawa, M.; Satoh, S.; Kuroda, S.; et al. New technique for time series analysis combining the maximum entropy method and non-linear least squares method: Its value in heart rate variability analysis. Med. Biol. Eng. Comput. 1997, 35, 318–322. [Google Scholar] [CrossRef] [PubMed]
- Kanaya, N.; Hirata, N.; Kurosawa, S.; Nakayama, M.; Namiki, A. Differential effects of propofol and sevoflurane on heart rate variability. Anesthesiology 2003, 98, 34–40. [Google Scholar] [CrossRef] [PubMed]
- Ohmae, E.; Ouchi, Y.; Oda, M.; Suzuki, T.; Nobesawa, S.; Kanno, T.; Yoshikawa, E.; Futatsubashi, M.; Ueda, Y.; Okada, H. Cerebral hemodynamics evaluation by near-infrared time-resolved spectroscopy: Correlation with simultaneous positron emission tomography measurements. Neuroimage 2006, 29, 697–705. [Google Scholar] [CrossRef] [PubMed]
- Ohmae, E.; Oda, M.; Suzuki, T.; Yamashita, Y.; Kakihana, Y.; Matsunaga, A.; Kanmura, Y.; Tamura, M. Clinical evaluation of time-resolved spectroscopy by measuring cerebral hemodynamics during cardiopulmonary bypass surgery. J. Biomed. Opt. 2007, 12, 062112. [Google Scholar] [CrossRef] [Green Version]
- Osgood, C.; Suci, G.; Tannenbaum, P. The Measurement of Meaning; University of Illinois Press: Urbana, IL, USA, 1957; pp. 1–360. [Google Scholar]
- Heuchert, J.; McNair, D.M. The Profile of Mood States 2nd Edition (POMS2); Multi-Health Systems Inc.: New York, NY, USA, 2012. [Google Scholar]
- Heuchert, J.; McNair, D.M. Japanese Translation of POMS2: Profile of Mood States; Yokoyama, K., Watanabe, K., Eds.; Kaneko Shobo: Tokyo, Japan, 2015; pp. 1–156. [Google Scholar]
- Lin, S.; Hsiao, Y.-Y.; Wang, M. Test Review: The Profile of Mood States 2nd Edition. J. Psychoeduc. Assess. 2014, 32, 273–277. [Google Scholar] [CrossRef]
- Cohen, J. Statistical Power for the Behavioral Sciences, 2nd ed.; Erlbaum: Hillsdale, NJ, USA, 1988; pp. 1–579. ISBN 0-8058-0283-5. [Google Scholar]
- Grissom, R.J.; Kim, J.J. Effect Sizes for Research: Univariate and Multivariate Applications, 2nd ed.; Routledge: New York, NY, USA, 2012; pp. 1–456. [Google Scholar]
- Ikei, H.; Nakamura, M.; Miyazaki, Y. Physiological effects of visual stimulation using knotty and clear wood images among young women. Sustainability 2021, 12, 9898. [Google Scholar] [CrossRef]
- Nakamura, M.; Ikei, H.; Miyazaki, Y. Physiological effects of visual stimulation with full-scale wall images composed of vertically and horizontally arranged wooden elements. J. Wood. Sci. 2019, 65, 55. [Google Scholar] [CrossRef]
- Ochiai, H.; Song, C.; Ikei, H.; Imai, M.; Miyazaki, Y. Effects of visual stimulation with bonsai trees on adult male patients with spinal cord injury. Int. J. Environ. Res. Public Health 2017, 14, 1017. [Google Scholar] [CrossRef]
- Igarashi, M.; Aga, M.; Ikei, H.; Namekawa, T.; Miyazaki, T. Physiological and psychological effects on high school students of viewing real and artificial pansies. Int. J. Environ. Res. Public Health 2015, 12, 2521–2531. [Google Scholar] [CrossRef] [PubMed] [Green Version]
- Ikei, H.; Song, C.; Igarashi, M.; Namekawa, T.; Miyazaki, Y. Physiological and psychological relaxing effects of visual stimulation with foliage plants in high school students. Adv. Hortic. Sci. 2014, 28, 111–116. [Google Scholar]
- Selye, H. Stress without Distress; J.B. Lippincott: New York, NY, USA, 1974; pp. 137–146. [Google Scholar]
- Szabo, S.; Tache, Y.; Somogyi, A. The legacy of Hans Selye and the origins of stress research: A retrospective 75 years after his landmark brief "letter" to the editor# of nature. Stress 2012, 15, 472–478. [Google Scholar] [CrossRef] [PubMed]
- Ikei, H.; Song, C.; Miyazaki, Y. Physiological effects of wood on humans: A review. J. Wood Sci. 2017, 63, 1–23. [Google Scholar] [CrossRef]


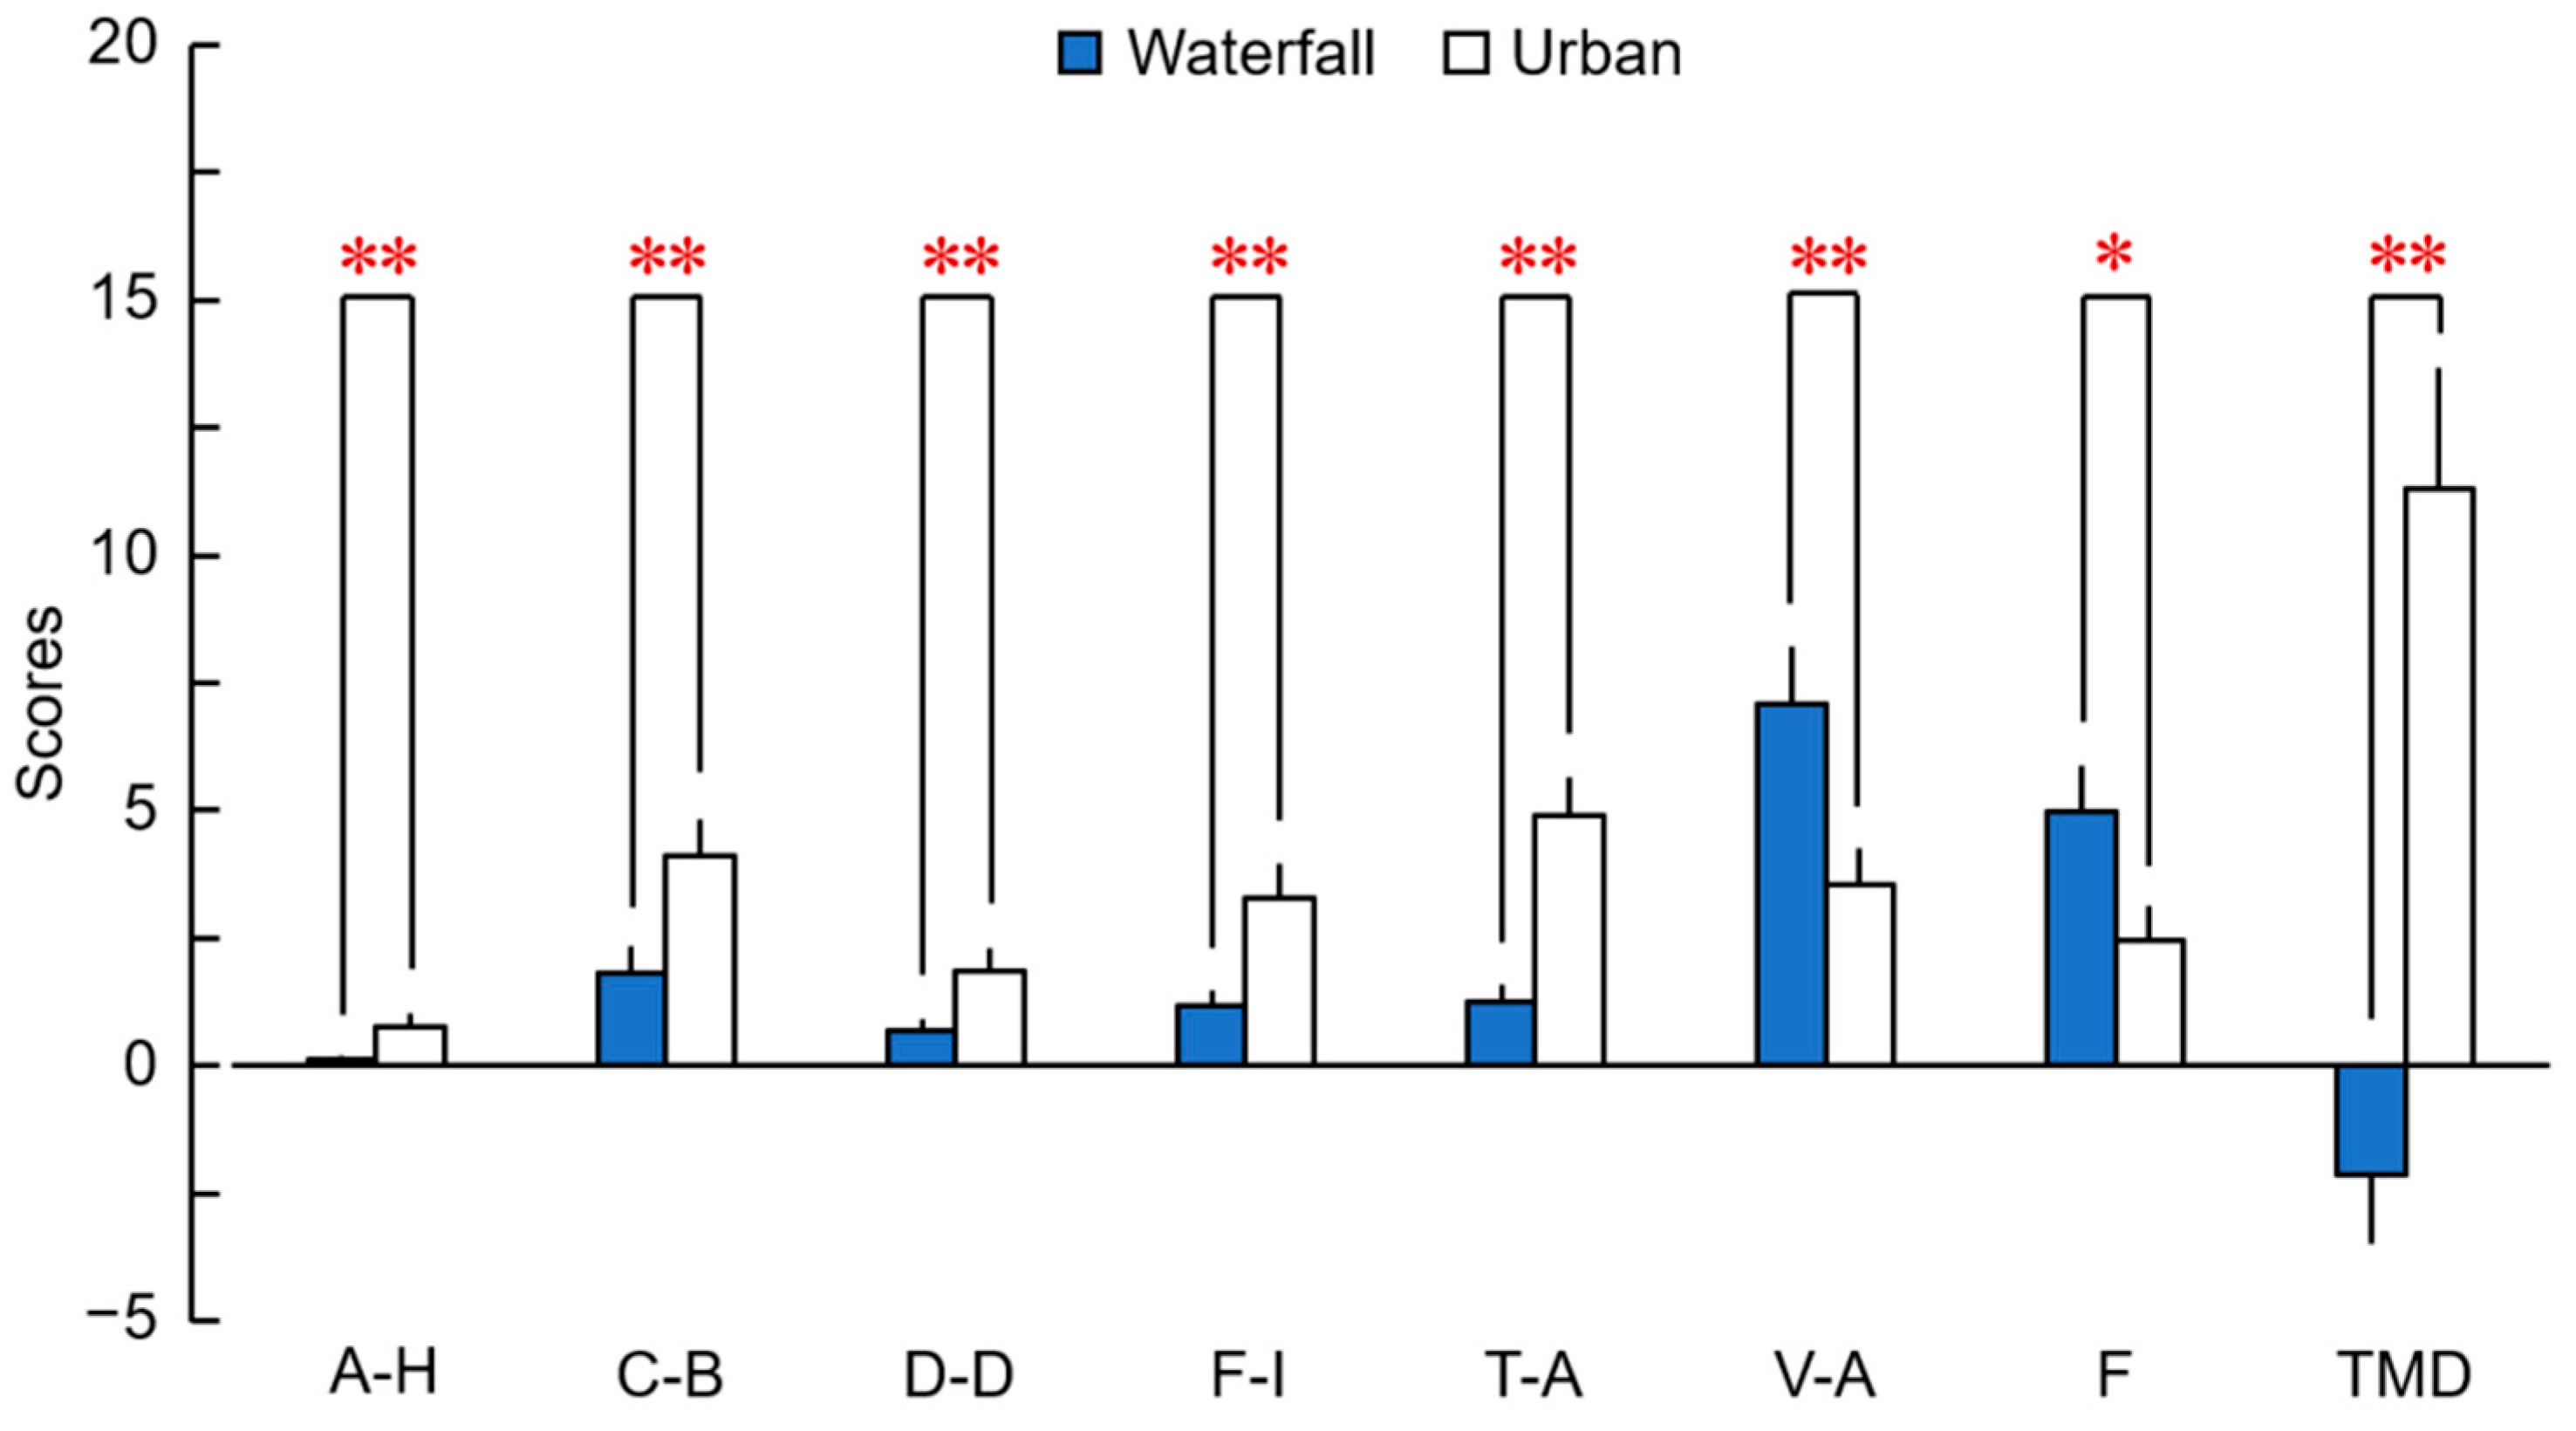
| A–H | C–B | D–D | F–I | T–A | V–A | F | TMD | ||
|---|---|---|---|---|---|---|---|---|---|
| Waterfall | Mean ± SE | 0.11 ± 0.06 | 1.78 ± 0.53 | 0.67 ± 0.24 | 1.15 ± 0.32 | 1.22 ± 0.35 | 7.07 ± 1.11 | 4.96 ± 0.90 | −2.15 ± 1.35 |
| Mountain | Mean ± SE | 0.22 ± 0.11 | 1.67 ± 0.49 | 0.89 ± 0.28 | 1.04 ± 0.41 | 1.52 ± 0.46 | 5.11 ± 0.77 | 4.33 ± 0.73 | 0.22 ± 1.49 |
Disclaimer/Publisher’s Note: The statements, opinions and data contained in all publications are solely those of the individual author(s) and contributor(s) and not of MDPI and/or the editor(s). MDPI and/or the editor(s) disclaim responsibility for any injury to people or property resulting from any ideas, methods, instructions or products referred to in the content. |
© 2022 by the authors. Licensee MDPI, Basel, Switzerland. This article is an open access article distributed under the terms and conditions of the Creative Commons Attribution (CC BY) license (https://creativecommons.org/licenses/by/4.0/).
Share and Cite
Jo, H.; Ikei, H.; Miyazaki, Y. Physiological and Psychological Responses of Viewing a Waterfall Image: A Crossover Study. Int. J. Environ. Res. Public Health 2023, 20, 565. https://doi.org/10.3390/ijerph20010565
Jo H, Ikei H, Miyazaki Y. Physiological and Psychological Responses of Viewing a Waterfall Image: A Crossover Study. International Journal of Environmental Research and Public Health. 2023; 20(1):565. https://doi.org/10.3390/ijerph20010565
Chicago/Turabian StyleJo, Hyunju, Harumi Ikei, and Yoshifumi Miyazaki. 2023. "Physiological and Psychological Responses of Viewing a Waterfall Image: A Crossover Study" International Journal of Environmental Research and Public Health 20, no. 1: 565. https://doi.org/10.3390/ijerph20010565