
Trends in Occupational Infectious Diseases in South Korea and Classification of Industries According to the Risk of Biological Hazards Using K-Means Clustering

Abstract
:1. Introduction
2. Materials and Methods
3. Results
4. Discussion
5. Conclusions
Author Contributions
Funding
Institutional Review Board Statement
Informed Consent Statement
Data Availability Statement
Conflicts of Interest
References
- Kim, T.J. COVID-19 news analysis using news big data: Focusing on topic modeling analysis. J. Korea Contents Assoc. 2020, 20, 457–466. [Google Scholar]
- Oh, M.A.; Jeon, J.A. Analysis of Major Issues Based on COVID-19 Social Big Data. In Health and Welfare Issue & Focus; Jo, H.S., Ed.; Korea Institute for Health and Social Affairs: Sejong, Korea, 2020; Volume 376, pp. 1–12. [Google Scholar]
- Lee, J.; Kim, M. Estimation of the number of working population at high-risk of COVID-19 Infection in Korea. Epidemiol. Health 2020, 42, e2020051. [Google Scholar] [CrossRef]
- Hong, J.; Choi, S.; Park, J. Vulnerable occupations to COVID-19 and measures for protecting workers from infectious biological hazards at workplaces. J. Korean Soc. Occup. Environ. Hyg. 2020, 30, 256–269. [Google Scholar]
- Baker, M.G.; Peckham, T.K.; Seixas, N.S. Estimating the burden of United States workers exposed to infection or disease: A key factor in containing risk of COVID-19 infection. PLoS ONE 2020, 15, e0232452. [Google Scholar] [CrossRef] [PubMed]
- Watterson, A. COVID-19 in the UK and occupational health and safety: Predictable not inevitable failures by government, and trade union and nongovernmental organization responses. New Solut. 2020, 30, 86–94. [Google Scholar] [CrossRef] [PubMed]
- Santos, J.; Ramos, C.; Vaz-Velho, M.; Vasconcelos Pinto, M. Occupational exposure to biological agents. Proceedings of International Conference on Applied Human Factors and Ergonomics, Orlando, FL, USA, 1 July 2020. [Google Scholar]
- Chung, Y.K.; Ahn, Y.S.; Jeong, J.S. Occupational infection in Korea. J. Korean Med. Sci. 2010, 25, S53–S61. [Google Scholar] [CrossRef] [PubMed]
- Su, C.P.; de Perio, M.A.; Cummings, K.J.; McCague, A.B.; Luckhaupt, S.E.; Sweeney, M.H. Case investigations of infectious diseases occurring in workplaces, United States, 2006–2015. Emerg. Infect. Dis. 2019, 25, 397–405. [Google Scholar] [CrossRef]
- Turner, S.; Lines, S.; Chen, Y.; Hussey, L.; Agius, R. Work-related infectious disease reported to the occupational disease intelligence network and the health and occupation reporting network in the UK (2000–2003). Occup. Med. 2005, 55, 275–281. [Google Scholar] [CrossRef]
- Haagsma, J.A.; Tariq, L.; Heederik, D.J.; Havelaar, A.H. Infectious disease risks associated with occupational exposure: A systematic review of the literature. Occup. Environ. Med. 2012, 69, 140–146. [Google Scholar] [CrossRef]
- Acke, S.; Couvreur, S.; Bramer, W.M.; Schmickler, M.N.; De Schryver, A.; Haagsma, J.A. Global infectious disease risks associated with occupational exposure among non-healthcare workers: A systematic review of the literature. Occup. Environ. Med. 2022, 79, 63–71. [Google Scholar] [CrossRef]
- Burzoni, S.; Duquenne, P.; Mater, G.; Ferrari, L. Workplace biological risk assessment: Review of existing and description of a comprehensive approach. Atmosphere 2020, 11, 741. [Google Scholar] [CrossRef]
- Park, D.; Choi, S.; Byun, H.; Kim, Y.; Kim, S.; Ha, K.; Kang, T. Comprehensive review of standard occupational classification (SOC) as used in the occupational safety and health field. J. Korean Soc. Occup. Environ. Hyg. 2013, 23, 11–19. [Google Scholar]
- EFSA Panel on Biological Hazards (BIOHAZ). Scientific opinion on the development of a risk ranking framework on biological hazards. EFSA J. 2012, 10, 2724. [Google Scholar] [CrossRef] [Green Version]
- Fosse, J.; Seegers, H.S.; Magras, C. Foodborne zoonoses due to meat: A quantitative approach for a comparative risk assessment applied to pig slaughtering in Europe. Vet. Res. 2008, 39, 1. [Google Scholar] [CrossRef]
- KOSIS; Ministry of Employment and Labor. Current State of Industrial Accidents, Total Accidents Status and Analysis—By Industry (Division). Available online: https://kosis.kr/statHtml/statHtml.do?orgId=118&tblId=DT_11806_N000&conn_path=I2 (accessed on 30 June 2022).
- KOSIS; Ministry of Employment and Labor. Current State of Industrial Accidents, Occupational Disease Incidence Status—By Detailed Disease Type. Vol. I2. Available online: https://kosis.kr/statHtml/statHtml.do?orgId=118&tblId=DT_11806_N038& conn _ path= (accessed on 30 June 2022).
- KOSIS; Ministry of Employment and Labor. Current State of Industrial Accidents, Occupational Disease Fatal Accident Status—By Detailed Disease Type. Available online: https://kosis.kr/statHtml/statHtml.do?orgId=118&tblId=DT_11806_N055 &conn_path=I2 (accessed on 30 June 2022).
- Sreedhar, C.; Kasiviswanath, N.; Chenna Reddy, P. Clustering large datasets using k-means modified inter and intra clustering(KM-I2C) in Hadoop. J. Big Data 2017, 4, 1–19. [Google Scholar] [CrossRef]
- Abdullah, D.; Susilo, S.; Ahmar, A.S.; Rusli, R.; Hidayat, R. The application of k-means clustering for province clustering in indonesia of the risk of the COVID-19 pandemic based on COVID-19 data. Qual. Quant. 2022, 56, 1283–1291. [Google Scholar] [CrossRef]
- Zhu, Z.; Liu, N. Early Warning of financial risk based on k-means clustering algorithm. Complexity 2021, 2021, 1–12. [Google Scholar] [CrossRef]
- Li, C.; Sun, L.; Jia, J.; Cai, Y.; Wang, X. Risk assessment of water pollution sources based on an integrated k-means clustering and set pair analysis method in the region of Shiyan, China. Sci. Total Environ. 2016, 557–558, 307–316. [Google Scholar] [CrossRef]
- Khorshidi, N.; Parsa, M.; Lentz, D.R.; Sobhanverdi, J. Identification of heavy metal pollution sources and its associated risk assessment in an industrial town using the k-means clustering technique. Appl. Geochem. 2021, 135, 105113. [Google Scholar] [CrossRef]
- Shi, W.; Zeng, W. Application of k-means clustering to environmental risk zoning of the chemical industrial area. Front. Environ. Sci. Eng. 2014, 8, 117–127. [Google Scholar] [CrossRef]
- Bholowalia, P.; Kumar, A. EBK-Means: A clustering technique based on elbow method and k-means in WSN. Int. J. Comput. Appl. 2014, 105, 17–24. [Google Scholar]
- Kodinariya, T.M.; Makwana, P.R. Review on determining number of cluster in k-means clustering. Int. J. Adv. Res. Comput. Sci. Manag. Stud. 2013, 1, 90–95. [Google Scholar]
- Ekwaru, J.P.; Veugelers, P.J. The overlooked importance of constants added in log transformation of independent variables with zero values: A proposed approach for determining an optimal constant. Stat. Biopharm. Res. 2018, 10, 26–29. [Google Scholar] [CrossRef]
- Kim, H.J.; Fay, M.P.; Feuer, E.J.; Midthune, D.N. Permutation tests for joinpoint regression with applications to cancer rates. Stat. Med. 2000, 19, 335–351. [Google Scholar] [CrossRef]
- Charrad, M.; Ghazzali, N.; Boiteau, V.; Niknafs, A. NbClust: An R package for determining the relevant number of clusters in a data set. J. Stat. Soft. 2014, 61, 1–36. [Google Scholar] [CrossRef] [Green Version]
- Duda, R.O.; Hart, P.E.; Stock, D.G. Pattern Classification and Scene Analysis, 2nd ed.; Wiley New York: Menlo Park, CA, USA, 1973; p. 15. [Google Scholar]
- Bielicki, J.A.; Duval, X.; Gobat, N.; Goossens, H.; Koopmans, M.; Tacconelli, E.; van der Werf, S. Monitoring approaches for health-care workers during the COVID-19 pandemic. Lancet Infect. Dis. 2020, 20, e261–e267. [Google Scholar] [CrossRef]
- Corrao, C.R.N.; Mazzotta, A.; La Torre, G.; De Giusti, M. Biological risk and occupational health. Ind. Health 2012, 50, 326–337. [Google Scholar] [CrossRef]
- Rim, K.T.; Lim, C.H. Biologically hazardous agents at work and efforts to protect workers’ health: A review of recent reports. Saf. Health Work. 2014, 5, 43–52. [Google Scholar] [CrossRef]
- Land, C.J.; Hult, K.; Fuchs, R.; Hagelberg, S.; Lundström, H. Tremorgenic mycotoxins from aspergillus fumigatus as a possible occupational health problem in sawmills. Appl. Environ. Microbiol. 1987, 53, 787–790. [Google Scholar] [CrossRef]
- Dias, M.; Gomes, B.; Cervantes, R.; Pena, P.; Viegas, S.; Viegas, C. Microbial occupational exposure assessments in sawmills—A review. Atmosphere 2022, 13, 266. [Google Scholar] [CrossRef]
- Straumfors, A.; Foss, O.A.H.; Fuss, J.; Mollerup, S.K.; Kauserud, H.; Mundra, S. The inhalable mycobiome of sawmill workers: Exposure characterization and diversity. Appl. Environ. Microbiol. 2019, 85, e01448-e19. [Google Scholar] [CrossRef] [PubMed]
- Terho, E.O.; Husman, K.; Kotimaa, M.; Sjöblom, T. Extrinsic allergic alveolitis in a sawmill worker. A Case Report. Scand. J. Work Environ. Health 1980, 6, 153–157. [Google Scholar] [CrossRef] [PubMed]
- Dutkiewicz, J.; Krysińska-Traczyk, E.; Prażmo, Z.; Skórska, C.; Sitkowska, J. Exposure to airborne microorganisms in Polish sawmills. Ann. Agric. Environ. Med. 2001, 8, 71–80. [Google Scholar] [PubMed]
- Klarić, M.Š.; Varnai, V.M.; Calušić, A.L.; Macan, J. Occupational exposure to airborne fungi in two Croatian sawmills and atopy in exposed workers. Ann. Agric. Environ. Med. 2012, 19, 213–219. [Google Scholar]
- Nadal, M.; Inza, I.; Schuhmacher, M.; Figueras, M.J.; Domingo, J.L. Health risks of the occupational exposure to microbiological and chemical pollutants in a municipal waste organic fraction treatment plant. Int. J. Hyg. Environ. Health 2009, 212, 661–669. [Google Scholar] [CrossRef] [PubMed]
- Malmros, P.; Sigsgaard, T.; Bach, B. Occupational health problems due to garbage sorting. Waste Manag. Res. 1992, 10, 227–234. [Google Scholar] [CrossRef]
- Szulc, J.; Okrasa, M.; Majchrzycka, K.; Sulyok, M.; Nowak, A.; Szponar, B.; Górczyńska, A.; Ryngajłło, M.; Gutarowska, B. Microbiological and toxicological hazard assessment in a waste sorting plant and proper respiratory protection. J. Environ. Manag. 2022, 303, 114257. [Google Scholar] [CrossRef]
- Anderson, J.M. Biological responses to materials. Annu. Rev. Mater. Res. 2001, 31, 81–110. [Google Scholar] [CrossRef]


| Condition of Legal Management | Basis Clause in Occupational Safety and Health Regulation | |
|---|---|---|
| Classification | Content | |
| Task | Medical practice | Article 593 paragraph 1 |
| Blood test | Article 593 paragraph 2 | |
| Handling of patient’s specimen | Article 593 paragraph 3 | |
| Handling of pathogens for research | Article 593 paragraph 4 | |
| Cattle-breeding | Article 593 paragraph 6 (citing article 592 paragraph 4 sub-paragraph c) | |
| Slaughtering | Article 593 paragraph 6 (citing article 592 paragraph 4 sub-paragraph c) | |
| Workplace | Group accommodation | Article 593 paragraph 5 |
| Field | Article 593 paragraph 6 (citing article 592 paragraph 4 sub-paragraph a) | |
| Work environment | Possibility of direct or indirect contact with wild rodents | Article 593 paragraph 6 (citing article 592 paragraph 4 sub-paragraph b) |
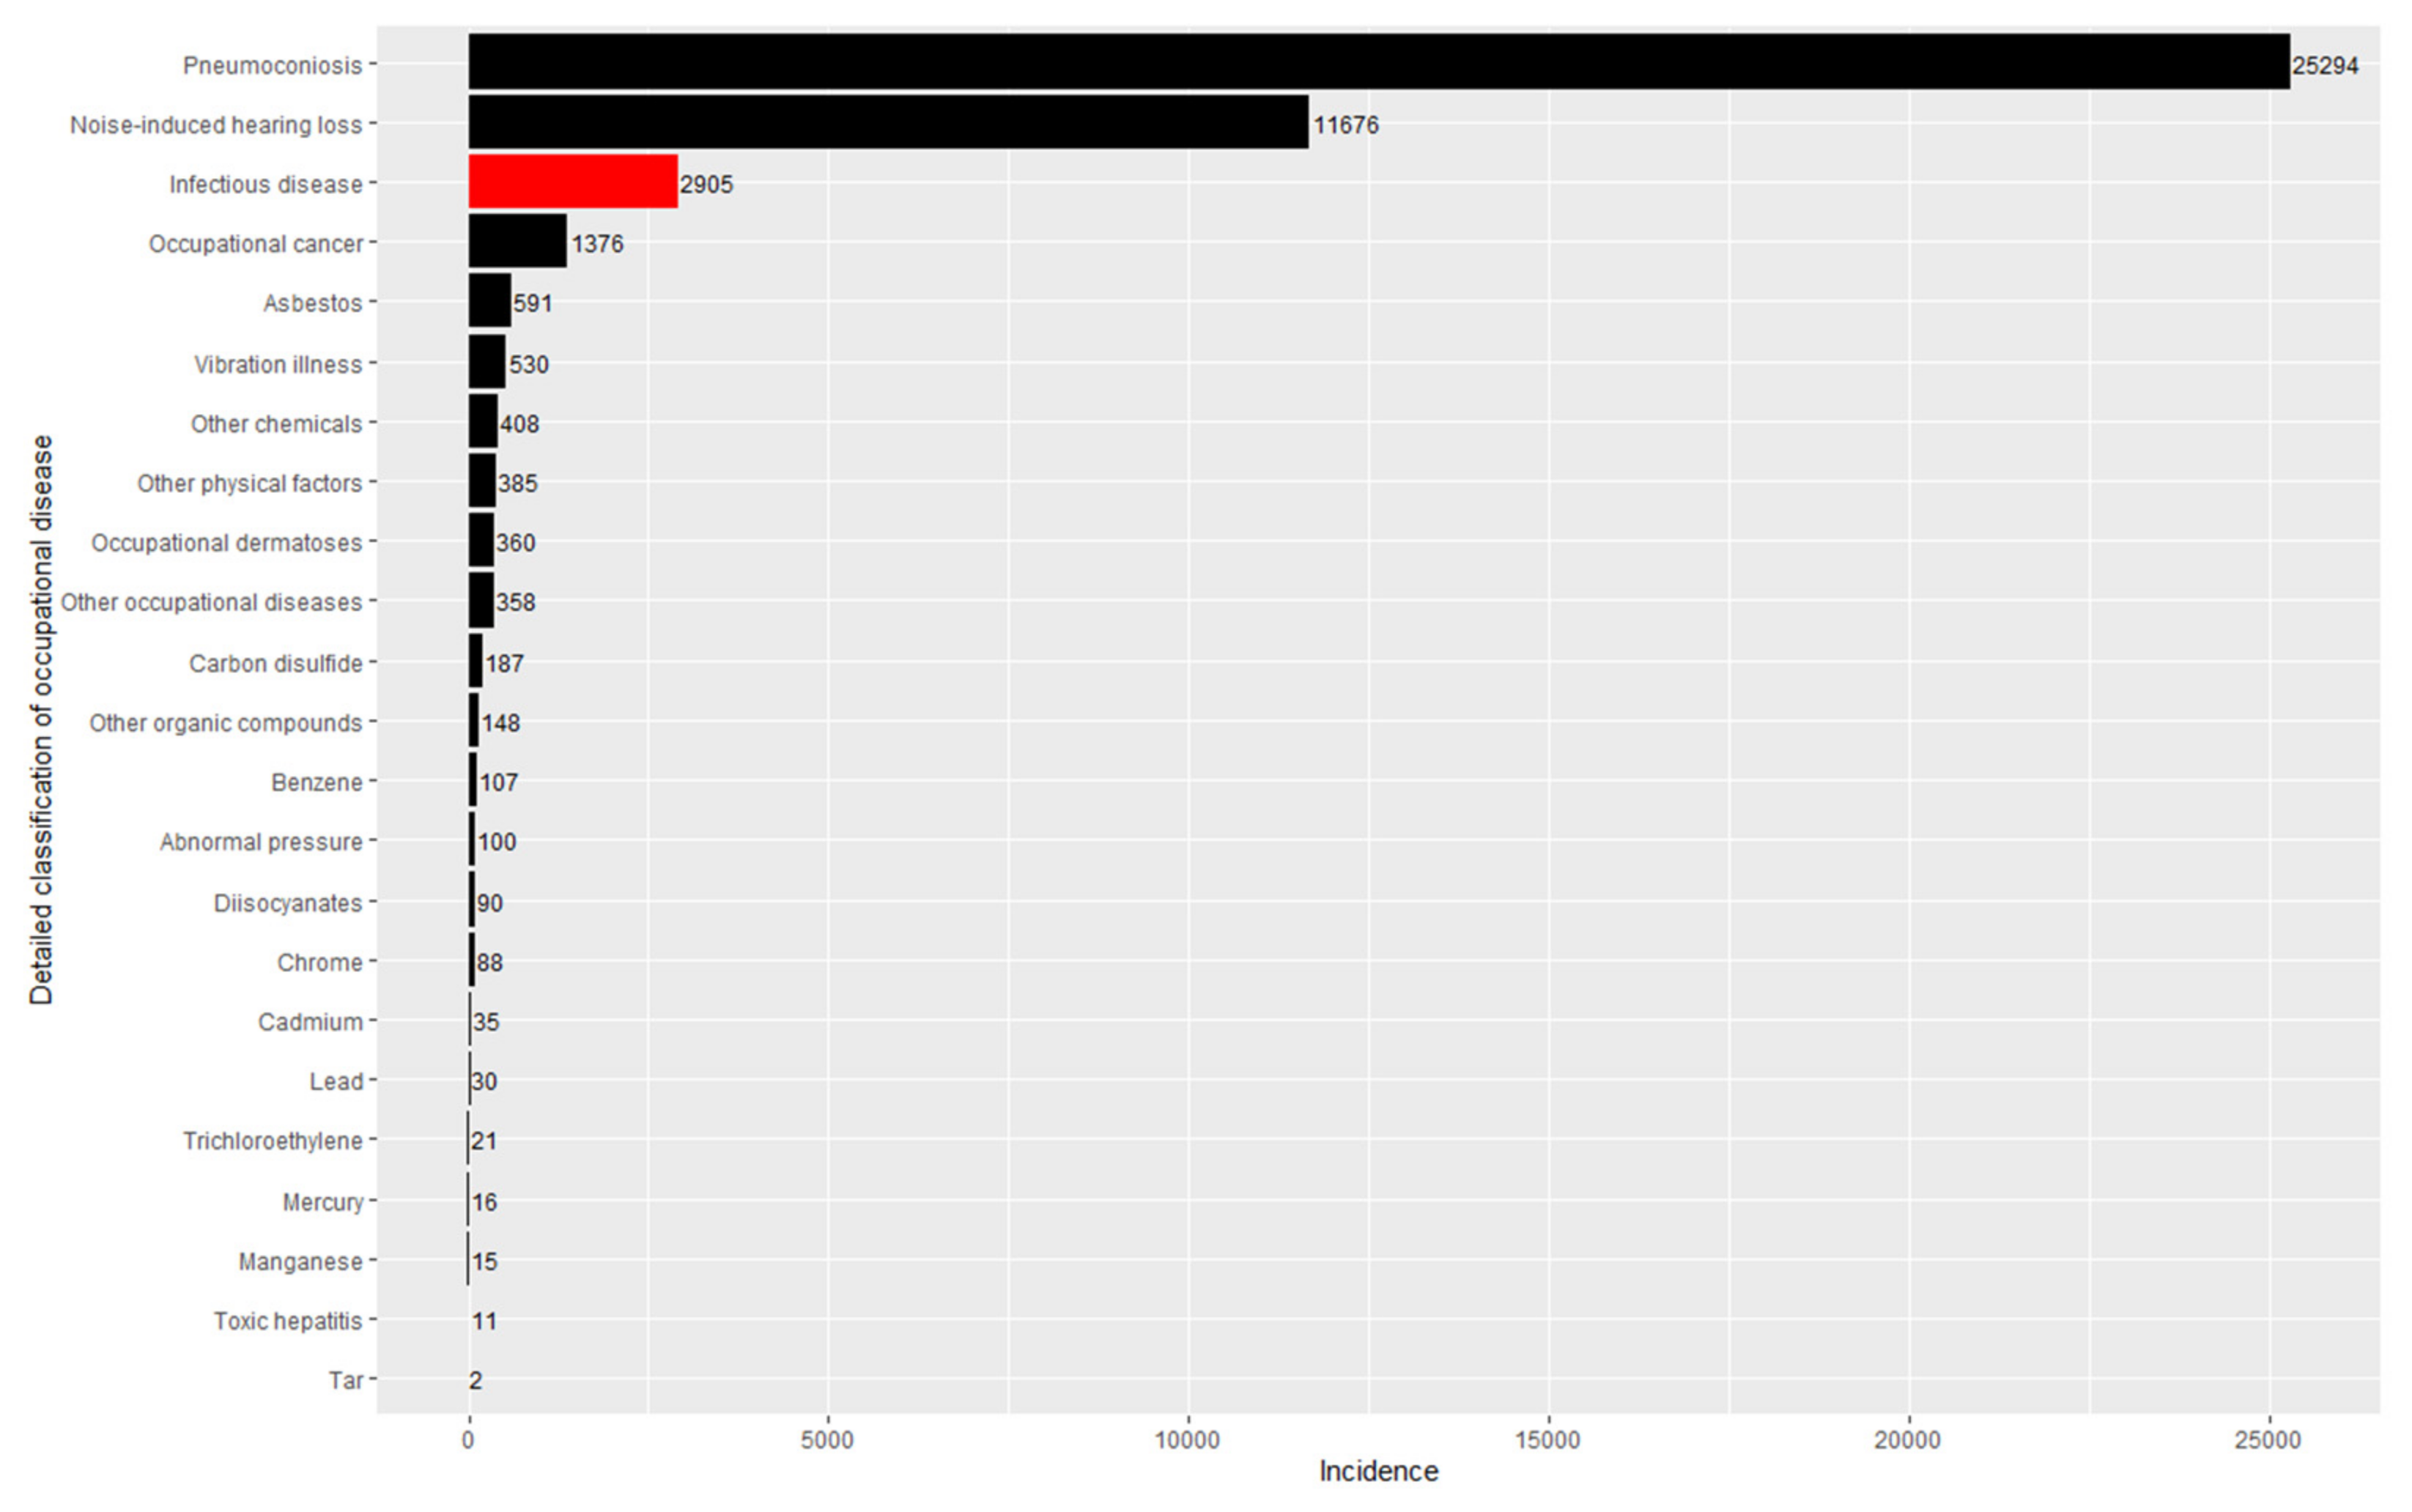
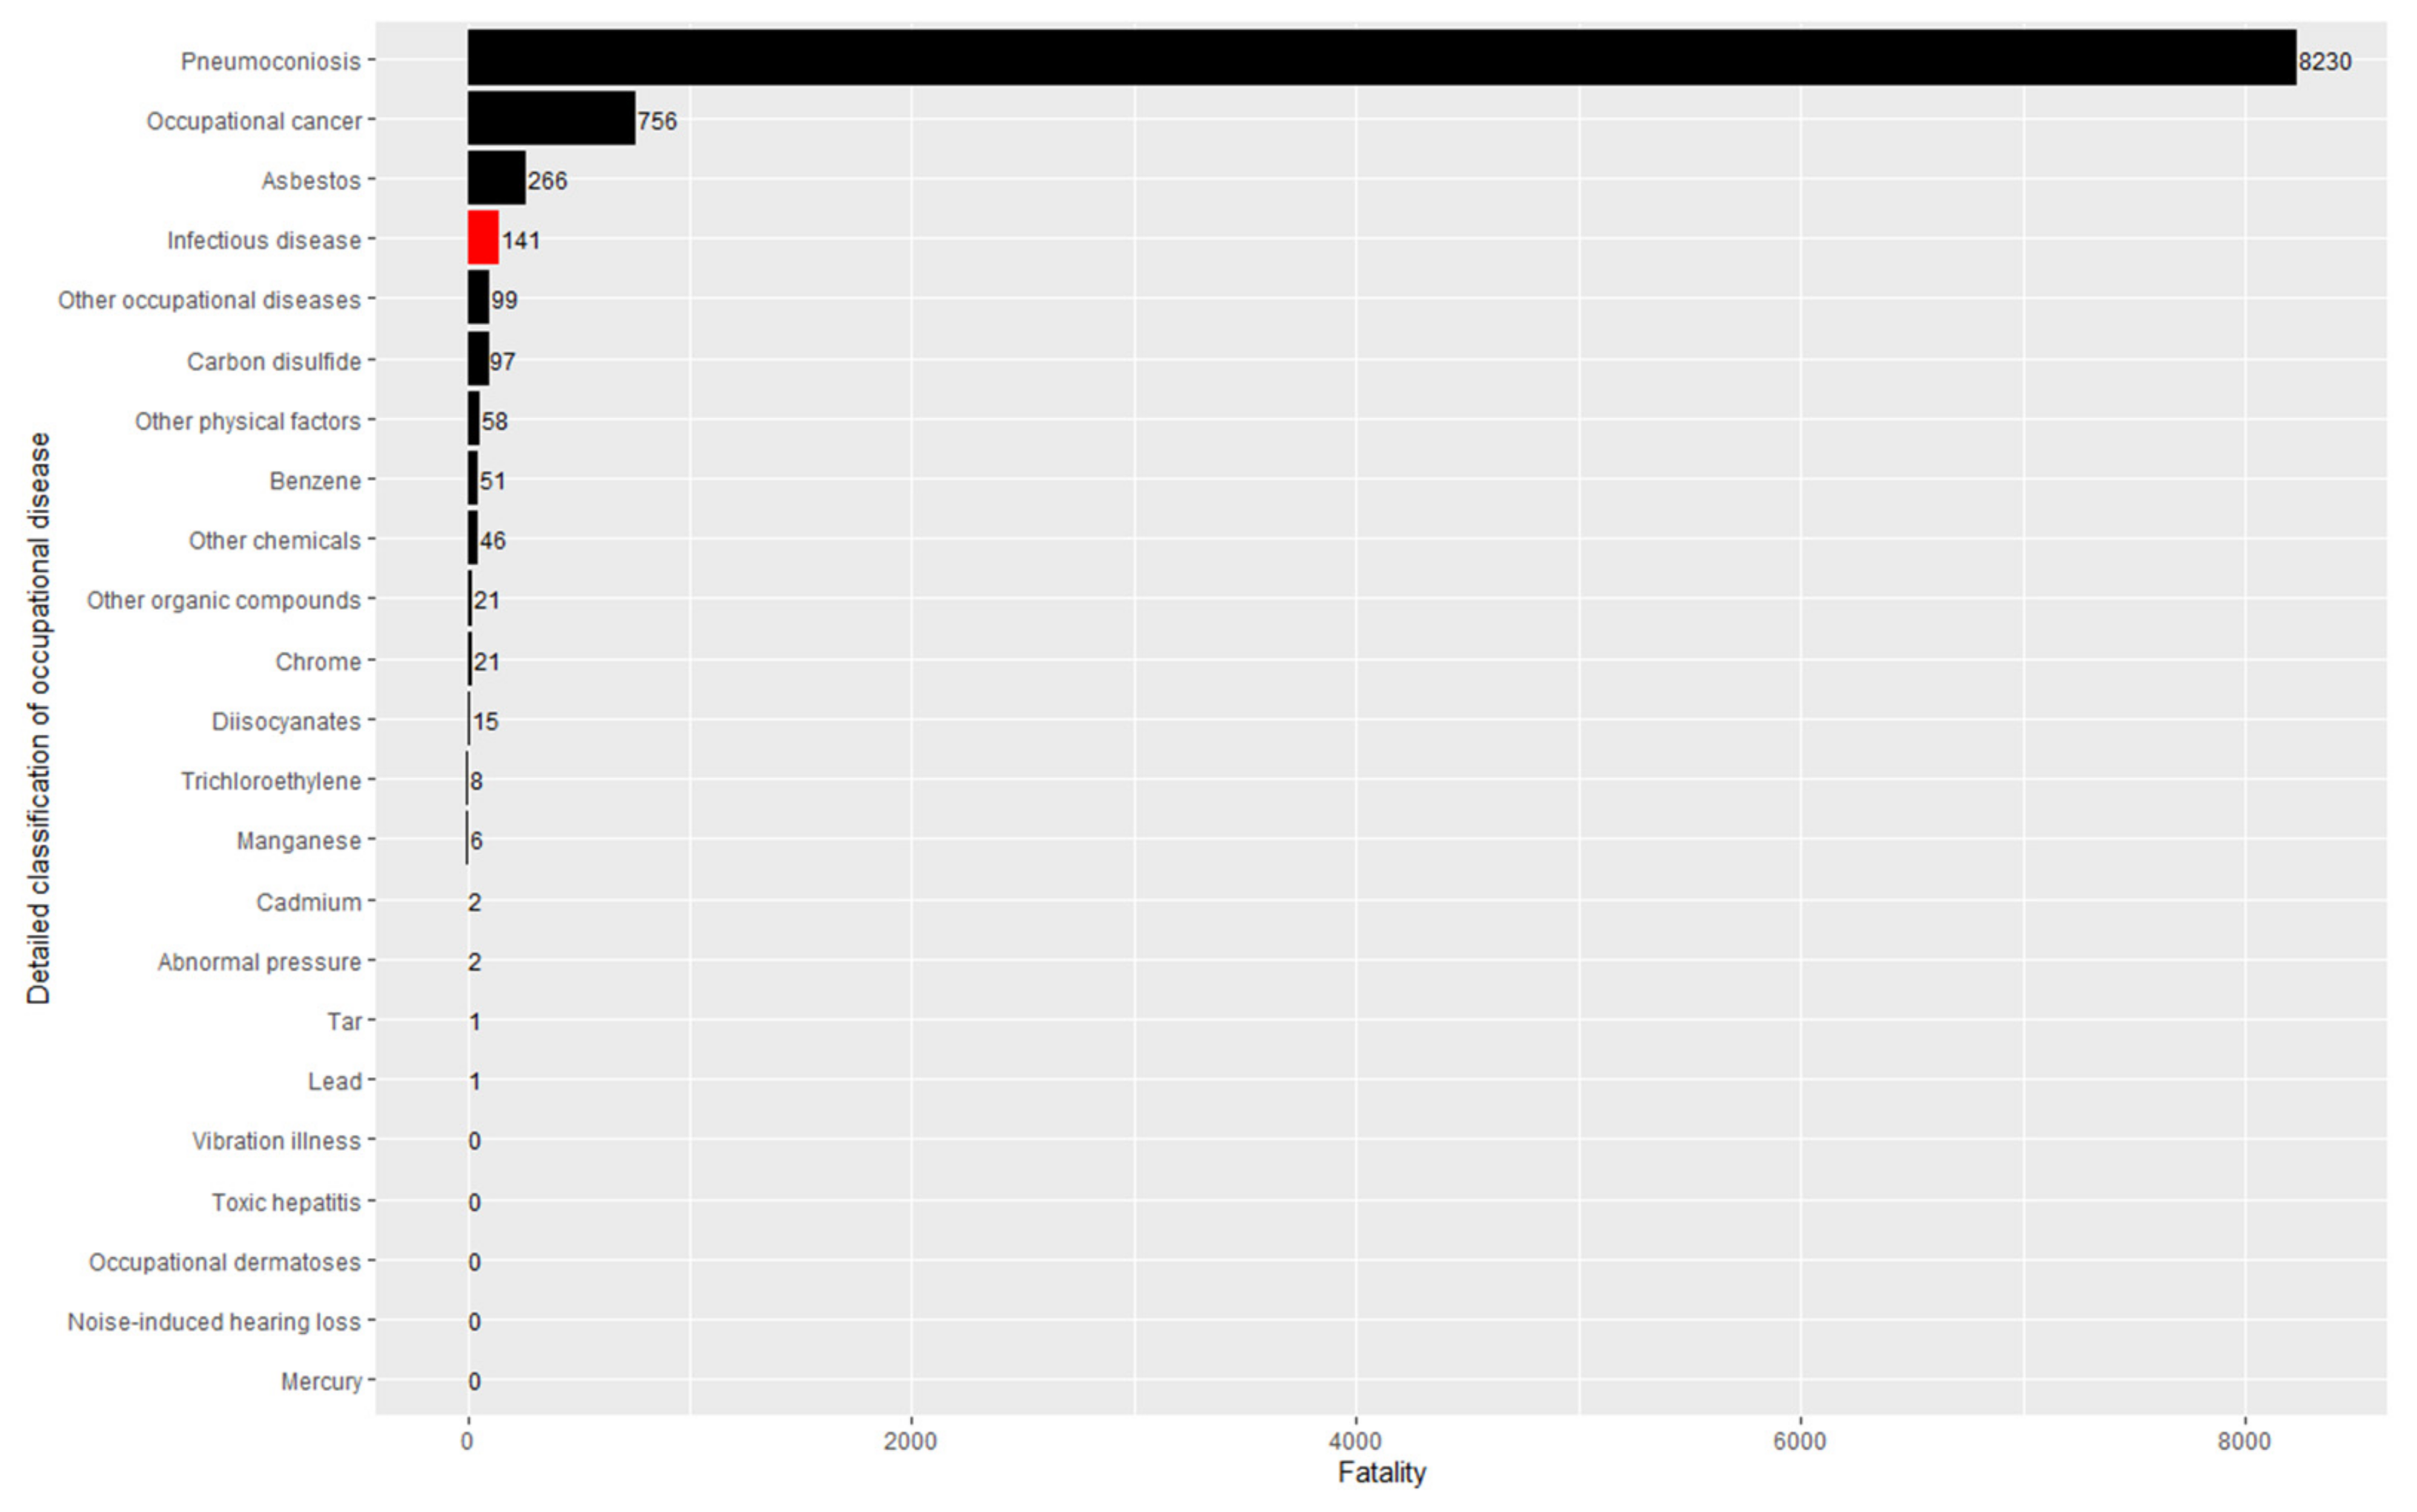
| Detailed Classification of Occupational Disease | Number | Rate | |||
|---|---|---|---|---|---|
| Name | Code of Korean Statistical Information Service | Illness | Fatality | Incidence (per 100,000) | Case Fatality (%) |
| Total occupational disease | 15118AC3BM | 44,733 | 9821 | 15.26 | 21.95 |
| Pneumoconiosis | 15118AC3BMAA | 25,294 | 8230 | 8.63 | 32.54 |
| Noise-induced hearing loss | 15118AC3BMAB | 11,676 | 0 | 3.98 | 0 |
| Abnormal pressure | 15118AC3BMAC | 100 | 2 | 3.41 × 10⁻² | 2.00 |
| Vibration illness | 15118AC3BMAD | 530 | 0 | 1.81 × 10⁻¹ | 0 |
| Other physical factors | 15118AC3BMAE | 385 | 58 | 1.31 × 10⁻¹ | 15.06 |
| Carbon disulfide | 15118AC3BMAF | 187 | 97 | 6.38 × 10⁻² | 51.87 |
| Trichloroethylene | 15118AC3BMAG | 21 | 8 | 7.16 × 10⁻³ | 38.10 |
| Other organic compounds | 15118AC3BMAH | 148 | 21 | 5.05 × 10⁻² | 14.19 |
| Benzene | 15118AC3BMAI | 107 | 51 | 3.65 × 10⁻² | 47.66 |
| Tar | 15118AC3BMAJ | 2 | 1 | 6.82 × 10⁻⁴ | 50.00 |
| Diisocyanates | 15118AC3BMAL | 90 | 15 | 3.07 × 10⁻² | 16.67 |
| Asbestos | 15118AC3BMAM | 591 | 266 | 2.02 × 10⁻¹ | 45.01 |
| Other chemicals | 15118AC3BMAN | 408 | 46 | 1.39 × 10⁻¹ | 11.27 |
| Lead | 15118AC3BMAO | 30 | 1 | 1.02 × 10⁻² | 3.33 |
| Mercury | 15118AC3BMAP | 16 | 0 | 5.46 × 10⁻³ | 0 |
| Chrome | 15118AC3BMAQ | 88 | 21 | 3.00 × 10⁻² | 3.86 |
| Cadmium | 15118AC3BMAR | 35 | 2 | 1.19 × 10⁻² | 5.71 |
| Manganese | 15118AC3BMAS | 15 | 6 | 5.12 × 10⁻³ | 40.00 |
| Infectious disease | 15118AC3BMAT | 2905 | 141 | 9.91 × 10⁻¹ | 4.85 |
| Toxic hepatitis | 15118AC3BMAV01 | 11 | 0 | 3.75 × 10⁻³ | 0 |
| Occupational dermatoses | 15118AC3BMAU | 360 | 0 | 1.23 × 10⁻¹ | 0 |
| Occupational cancer | 15118AC3BMAU00 | 1376 | 756 | 4.69 × 10⁻¹ | 54.95 |
| Other occupational diseases | 15118AC3BMAV | 358 | 99 | 1.22 × 10⁻¹ | 27.65 |
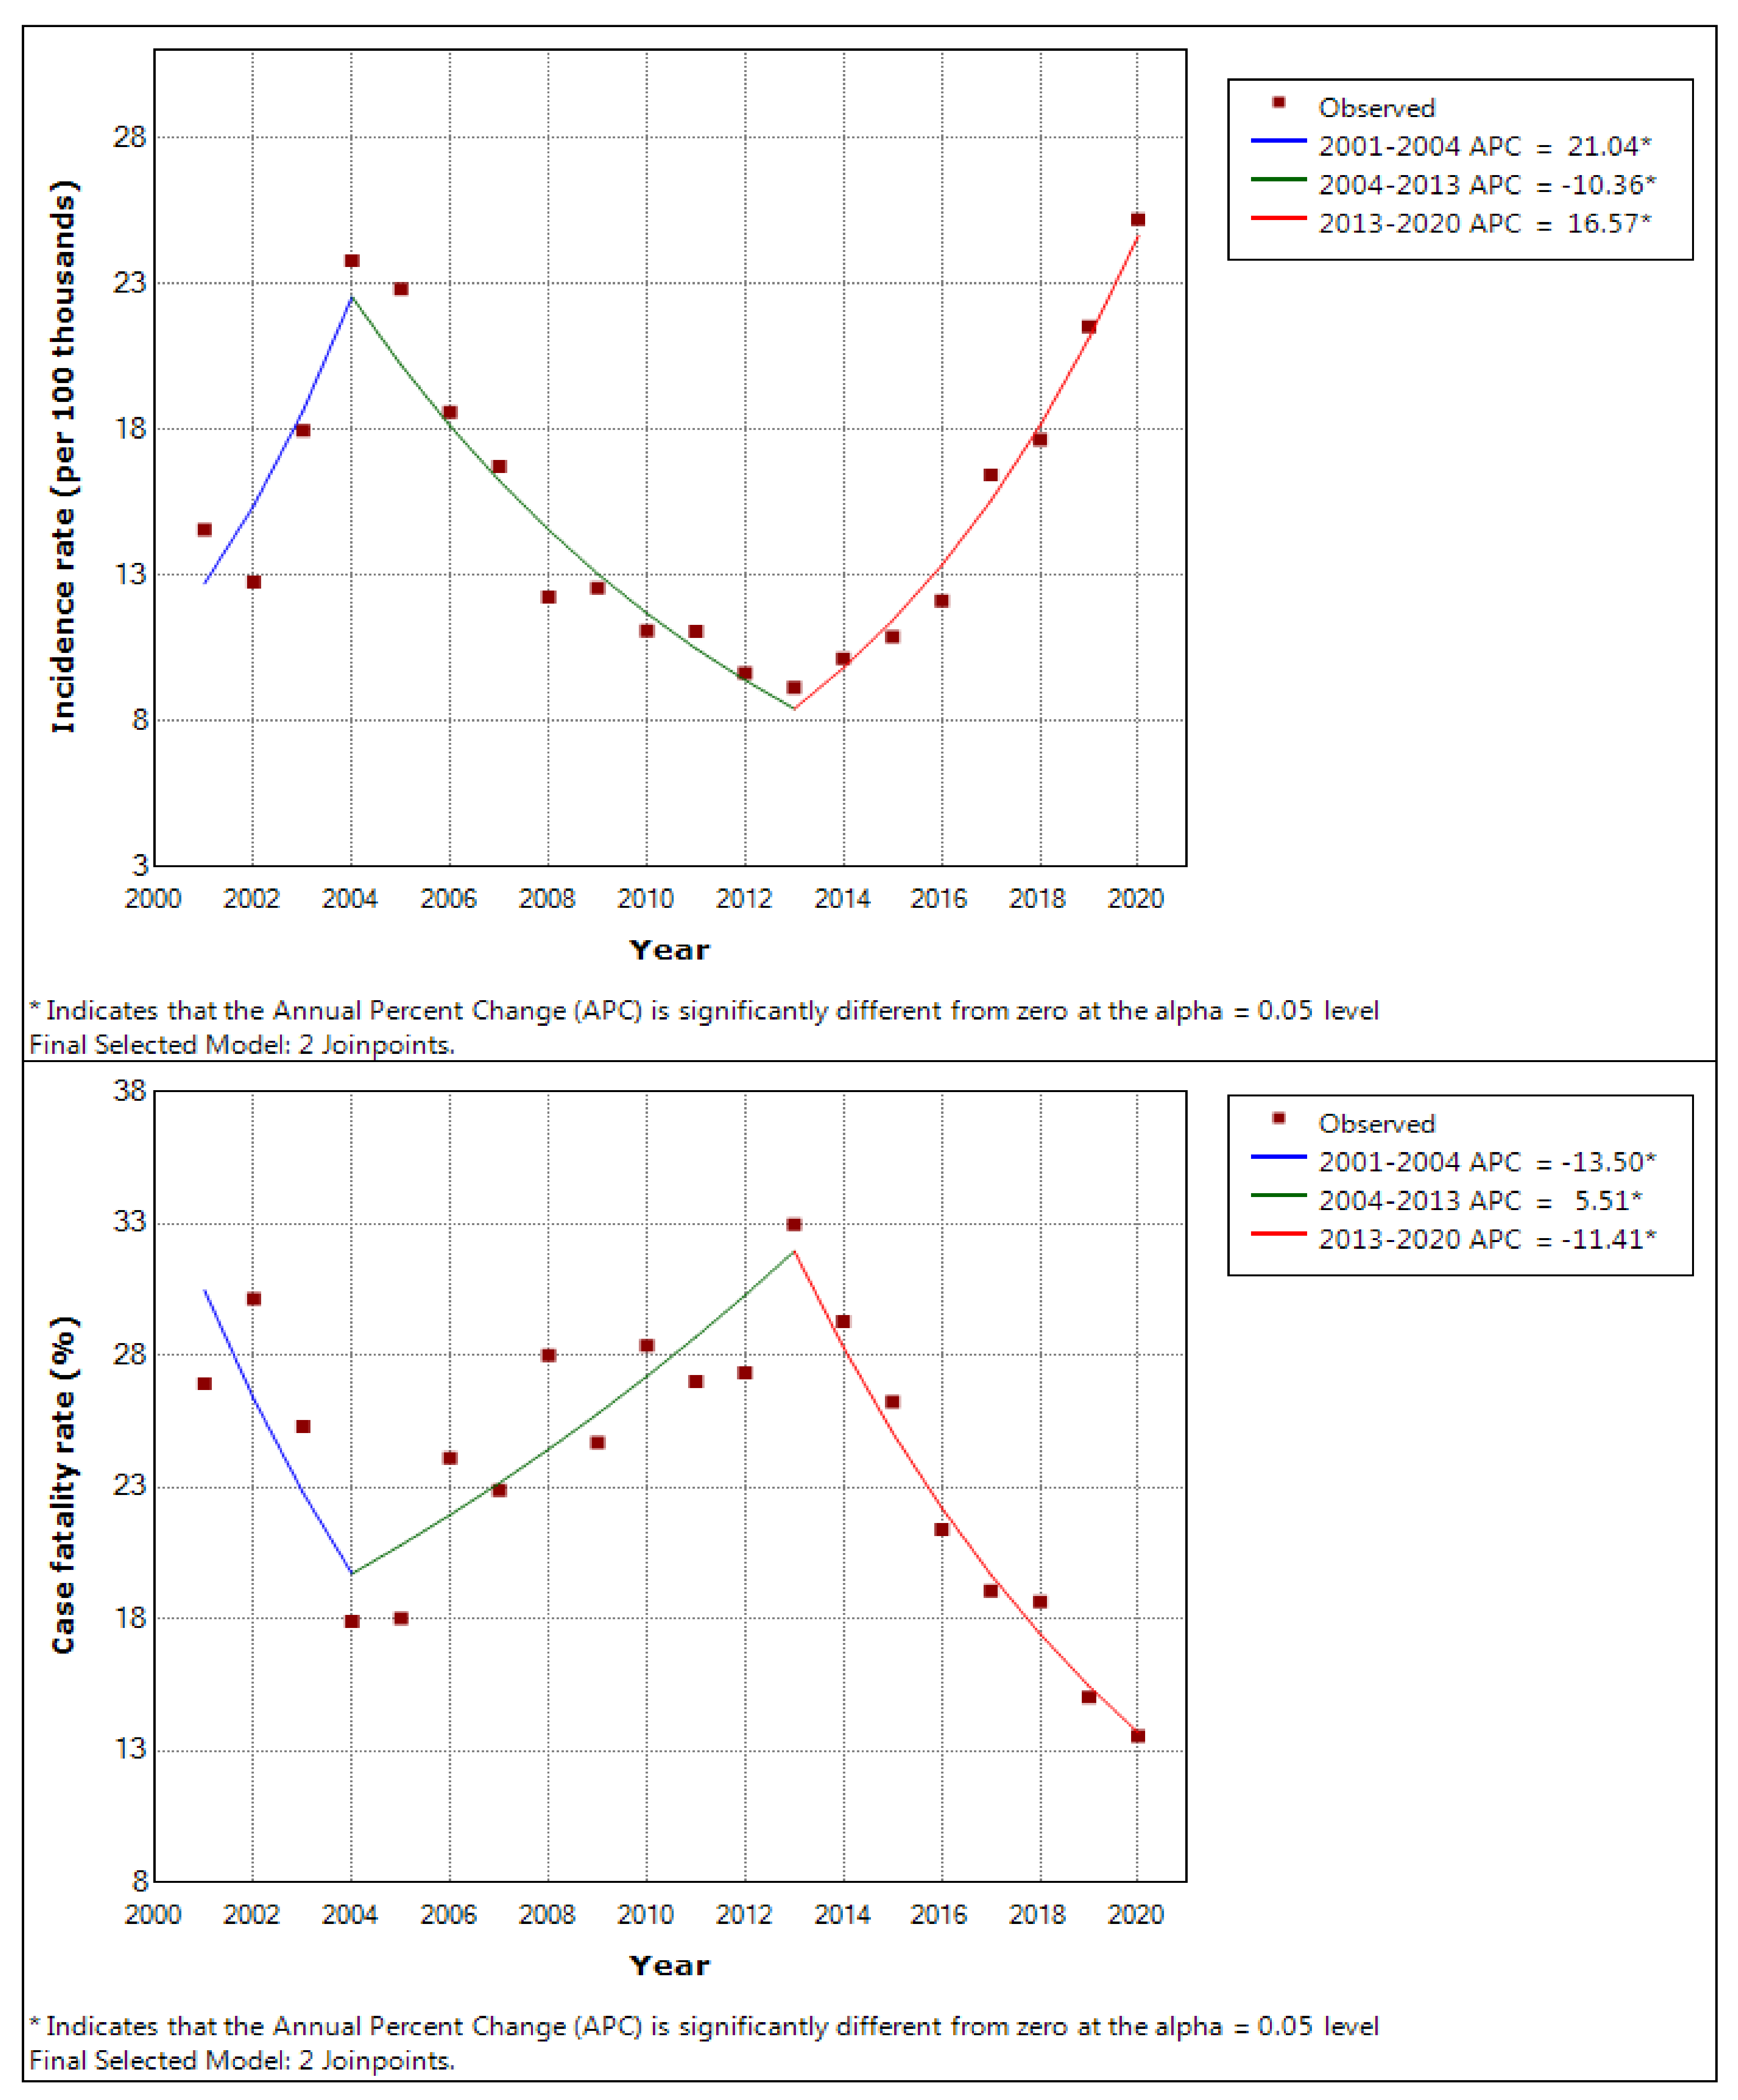
| Year | Illness | Fatality | Number of Workers | Incidence Rate (per 100,000) | Case Fatality Rate (%) | Change in Incidence Rate (%) | Change in Case Fatality Rate (%) |
|---|---|---|---|---|---|---|---|
| 2001 | 108 | 6 | 10,581,186 | 1.02 | 5.56 | - | - |
| 2002 | 93 | 7 | 10,571,279 | 8.80 × 10⁻¹ | 7.53 | −13.81 | 35.48 |
| 2003 | 132 | 5 | 10,599,345 | 1.25 | 3.79 | 41.56 | −49.68 |
| 2004 | 167 | 2 | 10,473,090 | 1.59 | 1.20 | 28.04 | −68.38 |
| 2005 | 100 | 1 | 11,059,193 | 9.04 × 10⁻¹ | 1.00 | −43.29 | −16.50 |
| 2006 | 131 | 6 | 11,688,797 | 1.12 | 4.58 | 23.94 | 358.02 |
| 2007 | 188 | 7 | 12,528,879 | 1.50 | 3.72 | 33.89 | −18.71 |
| 2008 | 134 | 5 | 13,489,986 | 9.93 × 10⁻¹ | 3.73 | −33.80 | 0.21 |
| 2009 | 427 | 8 | 13,884,927 | 3.08 | 1.87 | 209.59 | −49.79 |
| 2010 | 228 | 17 | 14,198,748 | 1.61 | 7.46 | −47.78 | 297.97 |
| 2011 | 168 | 11 | 14,362,372 | 1.17 | 6.55 | −27.16 | −12.18 |
| 2012 | 133 | 8 | 15,548,423 | 8.55 × 10⁻¹ | 6.02 | −26.87 | −8.13 |
| 2013 | 134 | 8 | 15,449,228 | 8.67 × 10⁻¹ | 5.97 | 1.40 | −0.75 |
| 2014 | 107 | 14 | 17,062,308 | 6.27 × 10⁻¹ | 13.08 | −27.70 | 119.16 |
| 2015 | 77 | 3 | 17,968,931 | 4.29 × 10⁻¹ | 3.90 | −31.67 | −70.22 |
| 2016 | 80 | 7 | 18,431,716 | 4.34 × 10⁻¹ | 8.75 | 1.29 | 124.58 |
| 2017 | 95 | 4 | 18,560,142 | 5.12 × 10⁻¹ | 4.21 | 17.93 | −51.88 |
| 2018 | 79 | 7 | 19,073,438 | 4.14 × 10⁻¹ | 8.86 | −19.08 | 110.44 |
| 2019 | 84 | 9 | 18,725,160 | 4.49 × 10⁻¹ | 10.71 | 8.31 | 20.92 |
| 2020 | 240 | 6 | 18,974,513 | 1.26 | 2.50 | 181.96 | −76.67 |
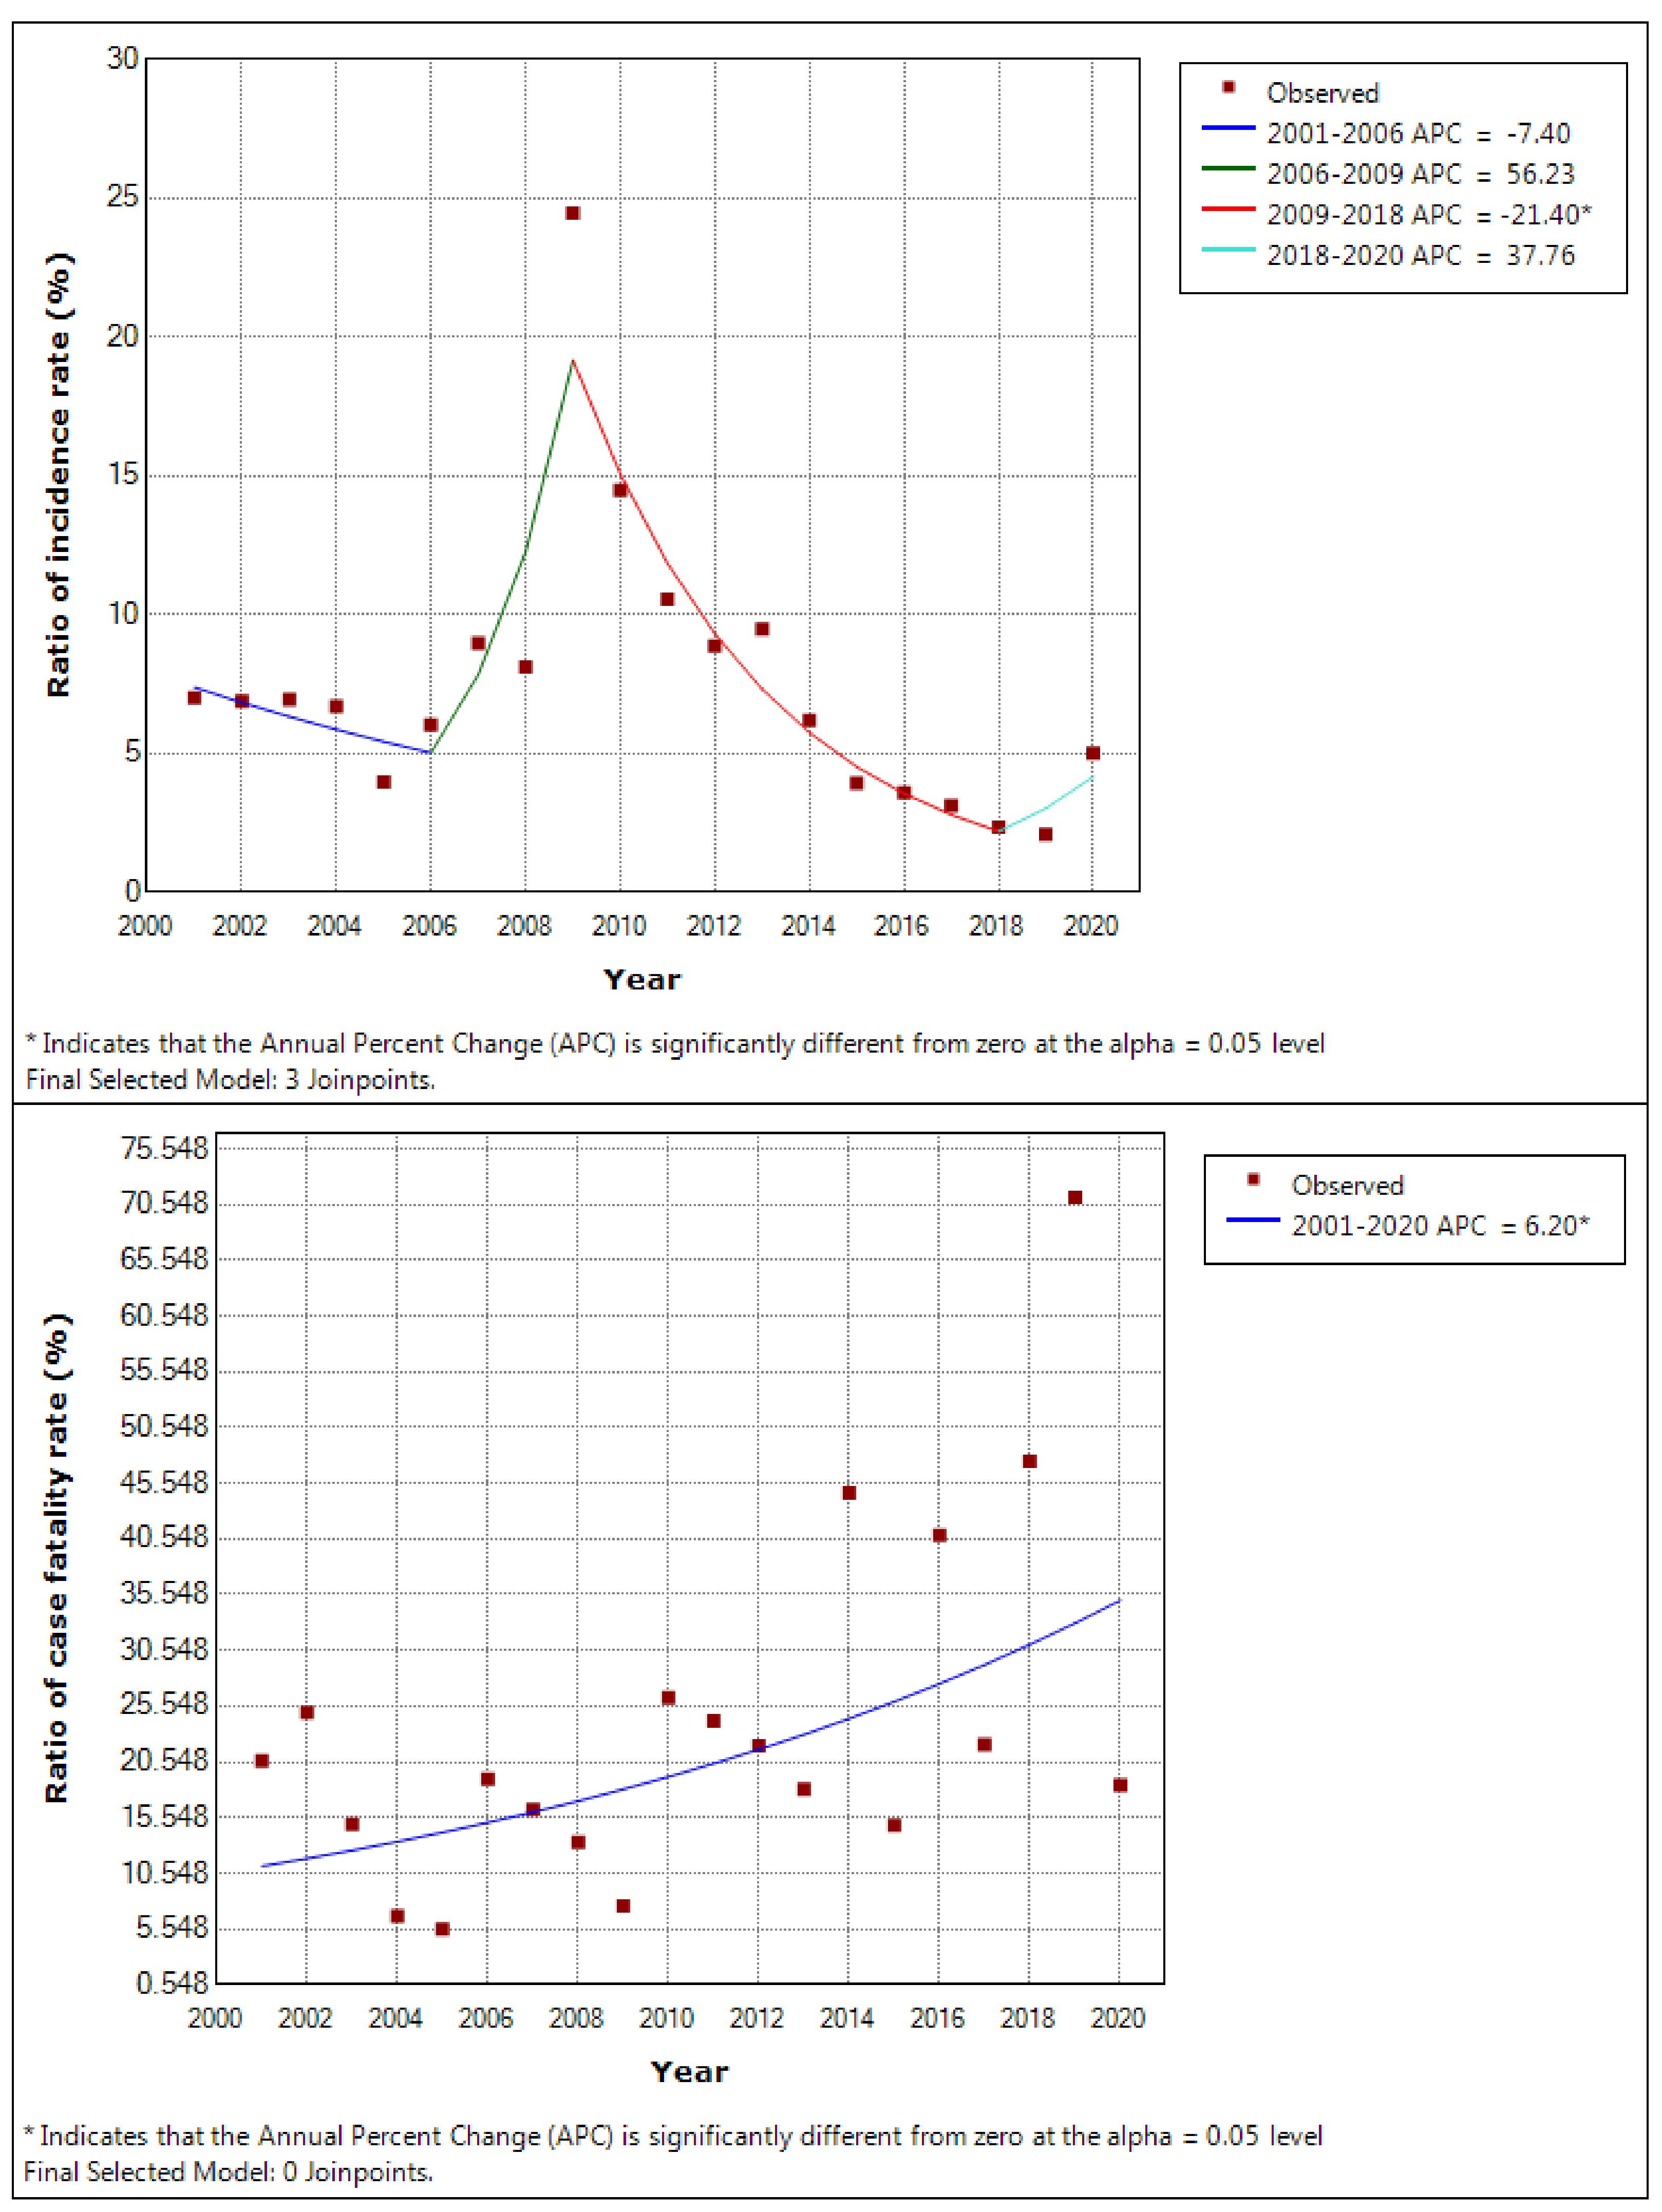
| Year | Illness | Fatality | Number of Workers | Incidence Rate (per 100,000) | Case Fatality Rate (%) | Incidence Ratio of Infectious Diseases to All Occupational Diseases (%) | Fatal Ratio of Infectious Diseases to All Occupational Diseases (%) |
|---|---|---|---|---|---|---|---|
| 2001 | 1542 | 415 | 10,581,186 | 14.57 | 26.91 | 7.00 | 1.45 |
| 2002 | 1351 | 407 | 10,571,279 | 12.78 | 30.13 | 6.88 | 1.72 |
| 2003 | 1905 | 482 | 10,599,345 | 17.97 | 25.30 | 6.93 | 1.04 |
| 2004 | 2492 | 446 | 10,473,090 | 23.79 | 17.90 | 6.70 | 0.45 |
| 2005 | 2524 | 455 | 11,059,193 | 22.82 | 18.03 | 3.96 | 0.22 |
| 2006 | 2174 | 524 | 11,688,797 | 18.60 | 24.10 | 6.03 | 1.15 |
| 2007 | 2098 | 480 | 12,528,879 | 16.75 | 22.88 | 8.96 | 1.46 |
| 2008 | 1653 | 463 | 13,489,986 | 12.25 | 28.01 | 8.11 | 1.08 |
| 2009 | 1746 | 431 | 13,884,927 | 12.57 | 24.68 | 24.46 | 1.86 |
| 2010 | 1576 | 447 | 14,198,748 | 11.10 | 28.36 | 14.47 | 3.80 |
| 2011 | 1592 | 430 | 14,362,372 | 11.10 | 27.01 | 10.55 | 2.56 |
| 2012 | 1500 | 410 | 15,548,423 | 9.65 | 27.33 | 8.87 | 1.95 |
| 2013 | 1414 | 466 | 15,449,228 | 9.15 | 32.96 | 9.48 | 1.72 |
| 2014 | 1732 | 507 | 17,062,308 | 10.15 | 29.27 | 6.18 | 2.76 |
| 2015 | 1959 | 514 | 17,968,931 | 10.90 | 26.24 | 3.93 | 0.58 |
| 2016 | 2234 | 478 | 18,431,716 | 12.12 | 21.40 | 3.58 | 1.46 |
| 2017 | 3054 | 582 | 18,560,142 | 16.45 | 19.06 | 3.11 | 0.69 |
| 2018 | 3368 | 628 | 19,073,438 | 17.66 | 18.65 | 2.35 | 1.11 |
| 2019 | 4035 | 607 | 18,725,160 | 21.55 | 15.04 | 2.08 | 1.48 |
| 2020 | 4784 | 649 | 18,974,513 | 25.21 | 13.57 | 5.02 | 0.92 |
| Group | Character | Incidence Rate (per 100,000) | Case Fatality Rate (%) | ||||
|---|---|---|---|---|---|---|---|
| Min. | Max. | Mean | Min. | Max. | Mean | ||
| 1 | (Almost) Risk zero | 0 | 5.46 × 10⁻² | 1.82 × 10⁻³ | 0 | 0 | 0 |
| 2 | Low incidence/low fatality | 9.65 × 10⁻² | 6.10 × 10⁻¹ | 2.39 × 10⁻¹ | 0 | 0 | 0 |
| 3 | Low incidence/high fatality | 4.58 × 10⁻² | 5.06 × 10⁻¹ | 2.52 × 10⁻¹ | 5.00 | 100 | 40.28 |
| 4 | High incidence/low fatality | 1.07 | 23.57 | 6.49 | 0 | 3.92 | 1.61 |
| 5 | High incidence/high fatality | 6.56 × 10⁻¹ | 8.63 | 2.54 | 7.69 | 100 | 35.02 |
| Group | Industry Division (Code Identifier of Korean Statistical Information Service, Survey Period) | Incidence Rate (per 100,000) | Case Fatality Rate (%) |
|---|---|---|---|
| 1 | Mining of limestone, metals, non-metals and other mining (AAG, 2017–2020) | 0 | 0 |
| Mining of metals and non-metals (AAB, 2001–2016) | 0 | 0 | |
| Quarrying (AAC, 2001–2016) | 0 | 0 | |
| Mining of limestone (AAD, 2001–2016) | 0 | 0 | |
| Tobacco manufacturing (BAn, 2001–2017) | 0 | 0 | |
| Wood and paper products manufacturing (BAC000, 2019–2020) | 0 | 0 | |
| Pulp and paper manufacturing and bookbinding and printed matter processing industry (BAp, 2001–2017) | 0 | 0 | |
| Pulp and paper manufacturing industry (BAp0, 2018–2018) | 0 | 0 | |
| Publishing, printing, bookbinding and print processing industry (BAD0, 2018–2020) | 0 | 0 | |
| Printing (BAE, 2001–2011) | 0 | 0 | |
| Chemical and rubber product manufacturing (BAF0, 2019–2020) | 0 | 0 | |
| Pharmaceuticals, cosmetics, briquettes and petroleum products manufacturing (BAH00, 2020–2020) | 0 | 0 | |
| Coke and coal gas manufacturing industry (BAJ, 2001–2011) | 0 | 0 | |
| Glass, porcelain and cement manufacturing (BAq0, 2019–2019) | 0 | 0 | |
| Ceramics, other ceramic products and cement manufacturing (BAK0, 2018–2018) | 0 | 0 | |
| Cement manufacturing (BAM, 2001–2017) | 0 | 0 | |
| Electric machine equipment, electronic products, meters, optical machinery, and other precision equipment manufacturing (BAQ0, 2020–2020) | 5.46 × 10⁻² | 0 | |
| Coke, briquettes and petroleum refineries manufacturing (BAZ00, 2012–2019) | 0 | 0 | |
| Briquette and coagulated solid fuel manufacturing (BAX, 2001–2011) | 0 | 0 | |
| Electricity, gas and water business (CAA, 2001–2011) | 0 | 0 | |
| Electricity, gas, steam and water business (CAA00, 2012–2020) | 0 | 0 | |
| Automobile transport, courier and quick service business (EAN, 2017–2018) | 0 | 0 | |
| Air transportation business (EAH, 2001–2017) | 0 | 0 | |
| Warehouse and transportation related service business (EAI0, 2019–2019) | 0 | 0 | |
| Small cargo transport, courier and quick service business (EAM, 2001–2016) | 0 | 0 | |
| Fishery, aquaculture and fishery related services (GAC, 2017–2018) | 0 | 0 | |
| Fishing (GAD, 2019–2020) | 0 | 0 | |
| Fishing (GAA, 2001–2016) | 0 | 0 | |
| Consignment sales of agricultural and marine products (JAP, dummy code) | 0 | 0 | |
| United States Forces Korea (JAJ, 2001–2020) | 0 | 0 | |
| 2 | Textile or textile product manufacturing business (A) (BAo, 2001–2018) | 1.49 × 10⁻¹ | 0 |
| Textile or textile product manufacturing business (BAoo, 2019–2020) | 2.83 × 10⁻¹ | 0 | |
| Newspaper/money issuance, publishing business and printing business (BAD, 2001–2017) | 1.85 × 10⁻¹ | 0 | |
| Pharmaceuticals, cosmetics, fragrances and tobacco manufacturing (BAH0, 2018–2019) | 6.10 × 10⁻¹ | 0 | |
| Rubber product manufacturing (BAG, 2001–2018) | 9.65 × 10⁻² | 0 | |
| Glass manufacturing (BAq, 2001–2018) | 1.93 × 10⁻¹ | 0 | |
| Ceramics and other ceramic products manufacturing (BAK, 2001–2017) | 1.36 × 10⁻¹ | 0 | |
| Machine tools, non-metallic mineral products, metal products manufacturing and metal processing (BAr0, 2018–2018) | 1.06 × 10⁻¹ | 0 | |
| Machine tools, non-metallic minerals and metal products manufacturing (BAr00, 2019–2019) | 2.05 × 10⁻¹ | 0 | |
| Machine tools, metal and non-metallic minerals products manufacturing (BAr000, 2020–2020) | 4.64 × 10⁻¹ | 0 | |
| Plating (BAO, 2001–2018) | 1.34 × 10⁻¹ | 0 | |
| Electric machine equipment, precision equipment, and electronic products manufacturing (BAQ00, 2020–2020) | 1.09 × 10⁻¹ | 0 | |
| Transportation machinery and equipment manufacturing, automobile and motorcycle repairing (BAT0, 2018–2018) | 2.02 × 10⁻¹ | 0 | |
| Handicraft manufacturing (BAV, 2001–2018) | 3.57 × 10⁻¹ | 0 | |
| Handicraft and other products manufacturing (BAV0, 2019–2020) | 3.66 × 10⁻¹ | 0 | |
| Automobile and motorcycle repairing (BAZ, 2001–2017) | 1.42 × 10⁻¹ | 0 | |
| Railroad, track and ropeway transportation business (EAA, 2001–2017) | 2.37 × 10⁻¹ | 0 | |
| Railroad, track, ropeway and air transportation business (EAA0, 2018–2019) | 4.13 × 10⁻¹ | 0 | |
| Land and water transport business (EAN0, 2019–2020) | 1.40 × 10⁻¹ | 0 | |
| Water transport, port unloading and cargo handling business (EAF, 2001–2018) | 1.63 × 10⁻¹ | 0 | |
| Warehousing business (EAJ, 2001–2018) | 1.78 × 10⁻¹ | 0 | |
| Education service business (JAG. 2001–2019) | 3.94 × 10⁻¹ | 0 | |
| 3 | Wood products manufacturing (BAC00, 2012–2018) | 2.47 × 10⁻¹ | 100.00 |
| Chemical manufacturing (BAF, 2001–2018) | 2.81 × 10⁻¹ | 25.00 | |
| Pharmaceutical and cosmetic fragrance manufacturing (BAH, 2001–2017) | 2.39 × 10⁻¹ | 100.00 | |
| Non-metallic mineral products and metal products manufacturing and metal processing industry (BAr, 2001–2017) | 4.43 × 10⁻¹ | 22.22 | |
| Metal smelting (BAL, 2001–2020) | 1.45 × 10⁻¹ | 100.00 | |
| Metal material manufacturing (BAN, 2001–2016) | 2.10 × 10⁻¹ | 50.00 | |
| Machine tool manufacturing (BAP, 2001–2017) | 2.94 × 10⁻¹ | 5.00 | |
| Electrical machinery manufacturing (BAQ, 2001–2017) | 1.72 × 10⁻¹ | 20.00 | |
| Electronics manufacturing (BAR, 2001–2017) | 4.58 × 10⁻² | 75.00 | |
| Shipbuilding and repairing (BAS, 2001–2020) | 2.20 × 10⁻¹ | 57.14 | |
| Transportation machinery and equipment manufacturing (BAT, 2001–2017) | 3.54 × 10⁻¹ | 9.52 | |
| Textile or textile product manufacturing (B) (BAY, 2001–2018) | 1.51 × 10⁻¹ | 33.33 | |
| Other manufacturing (BAs, 2001–2018) | 1.53 × 10⁻¹ | 66.67 | |
| Construction industry (DAB, 2001–2020) | 3.23 × 10⁻¹ | 7.18 | |
| Passenger car transport business (EAB, 2001–2016) | 1.76 × 10⁻¹ | 25.00 | |
| Freight car transportation business (EAC, 2001–2016) | 3.17 × 10⁻¹ | 100.00 | |
| Transportation-related service business (EAI, 2001–2018) | 3.75 × 10⁻¹ | 25.00 | |
| Telecommunications business (EAK, 2001–2020) | 4.97 × 10⁻¹ | 25.00 | |
| Finance and insurance (KAA, 2001–2020) | 9.52 × 10⁻² | 27.27 | |
| Professional technical service business (JAE, 2001–2019) | 1.74 × 10⁻¹ | 15.79 | |
| Wholesale, retail and consumer goods repairing business (JAH, 2001-2019) | 1.47 × 10⁻¹ | 20.51 | |
| Wholesale, retail, food and lodging business (JAH0, 2020–2020) | 4.54 × 10⁻¹ | 6.67 | |
| Real estate business and rental business (JAI, 2001–2020) | 1.16 × 10⁻¹ | 50.00 | |
| Business service (CAA03, 2018–2019) | 1.55 × 10⁻¹ | 33.33 | |
| Various other business (JAD, 2001–2020) | 5.06 × 10⁻¹ | 7.34 | |
| 4 | Wood product manufacturing (BAC, 2001–2011) | 3.42 | 0 |
| Railroad, air transportation, warehousing and transportation-related service business (EAA00, 2020–2020) | 2.90 | 0 | |
| Forestry (FAA, 2001–2020) | 23.57 | 2.06 | |
| Aquaculture and fishery related services (GAB, 2001–2016) | 1.80 | 0 | |
| Agriculture (HAA, 2001–2020) | 10.81 | 1.83 | |
| Comprehensive management of buildings, etc. business (JAA, 2001–2018) | 1.07 | 3.74 | |
| Facility management business and business service (JAA00, 2020–2020) | 1.57 | 0 | |
| Sanitation and similar service business (JAB, 2001–2018) | 13.90 | 3.24 | |
| Professional technical, health, education, recreation service business (JAE0, 2020–2020) | 3.38 | 1.63 | |
| Health and social welfare business (JAF, 2001–2019) | 4.64 | 1.23 | |
| Business of the state and local governments (CAA02, 2012–2020) | 4.36 | 3.92 | |
| 5 | Coal mining and quarrying (AAF, 2017–2020) | 8.63 | 100.00 |
| Coal mining (AAA, 2001–2016) | 1.29 | 100.00 | |
| Other mining (AAE, 2001–2016) | 3.78 | 25.00 | |
| Food manufacturing (BAA, 2001–2020) | 6.97 × 10⁻¹ | 12.50 | |
| Sawmill and veneer manufacturing (BAB, 2001–2011) | 4.32 | 25.00 | |
| Measuring instruments, optical instruments, and other precision instruments manufacturing (BAU, 2001–2017) | 6.70 × 10⁻¹ | 22.22 | |
| Comprehensive building management, sanitation and similar service business (JAA0, 2019–2019) | 8.39 × 10⁻¹ | 12.50 | |
| Golf course and racetrack operation business (JAC, 2001–2011) | 2.27 | 16.67 | |
| Overseas dispatcher (JAL, 2001–2020) | 2.26 | 28.57 | |
| Entertainment, culture and sports related business (CAA01, 2012–2019) | 6.56 × 10⁻¹ | 7.69 |
Publisher’s Note: MDPI stays neutral with regard to jurisdictional claims in published maps and institutional affiliations. |
© 2022 by the authors. Licensee MDPI, Basel, Switzerland. This article is an open access article distributed under the terms and conditions of the Creative Commons Attribution (CC BY) license (https://creativecommons.org/licenses/by/4.0/).
Share and Cite
Shin, S.; Yoon, W.S.; Byeon, S.-H. Trends in Occupational Infectious Diseases in South Korea and Classification of Industries According to the Risk of Biological Hazards Using K-Means Clustering. Int. J. Environ. Res. Public Health 2022, 19, 11922. https://doi.org/10.3390/ijerph191911922
Shin S, Yoon WS, Byeon S-H. Trends in Occupational Infectious Diseases in South Korea and Classification of Industries According to the Risk of Biological Hazards Using K-Means Clustering. International Journal of Environmental Research and Public Health. 2022; 19(19):11922. https://doi.org/10.3390/ijerph191911922
Chicago/Turabian StyleShin, Saemi, Won Suck Yoon, and Sang-Hoon Byeon. 2022. "Trends in Occupational Infectious Diseases in South Korea and Classification of Industries According to the Risk of Biological Hazards Using K-Means Clustering" International Journal of Environmental Research and Public Health 19, no. 19: 11922. https://doi.org/10.3390/ijerph191911922