
Study on Spatiotemporal Variation Pattern of Vegetation Coverage on Qinghai–Tibet Plateau and the Analysis of Its Climate Driving Factors

Abstract
:1. Introduction
2. Materials and Methods
2.1. Study Area
2.2. Data Sources and Pre-Processing
2.2.1. NDVI Data
2.2.2. Climatic and Auxiliary Data
2.3. Methods
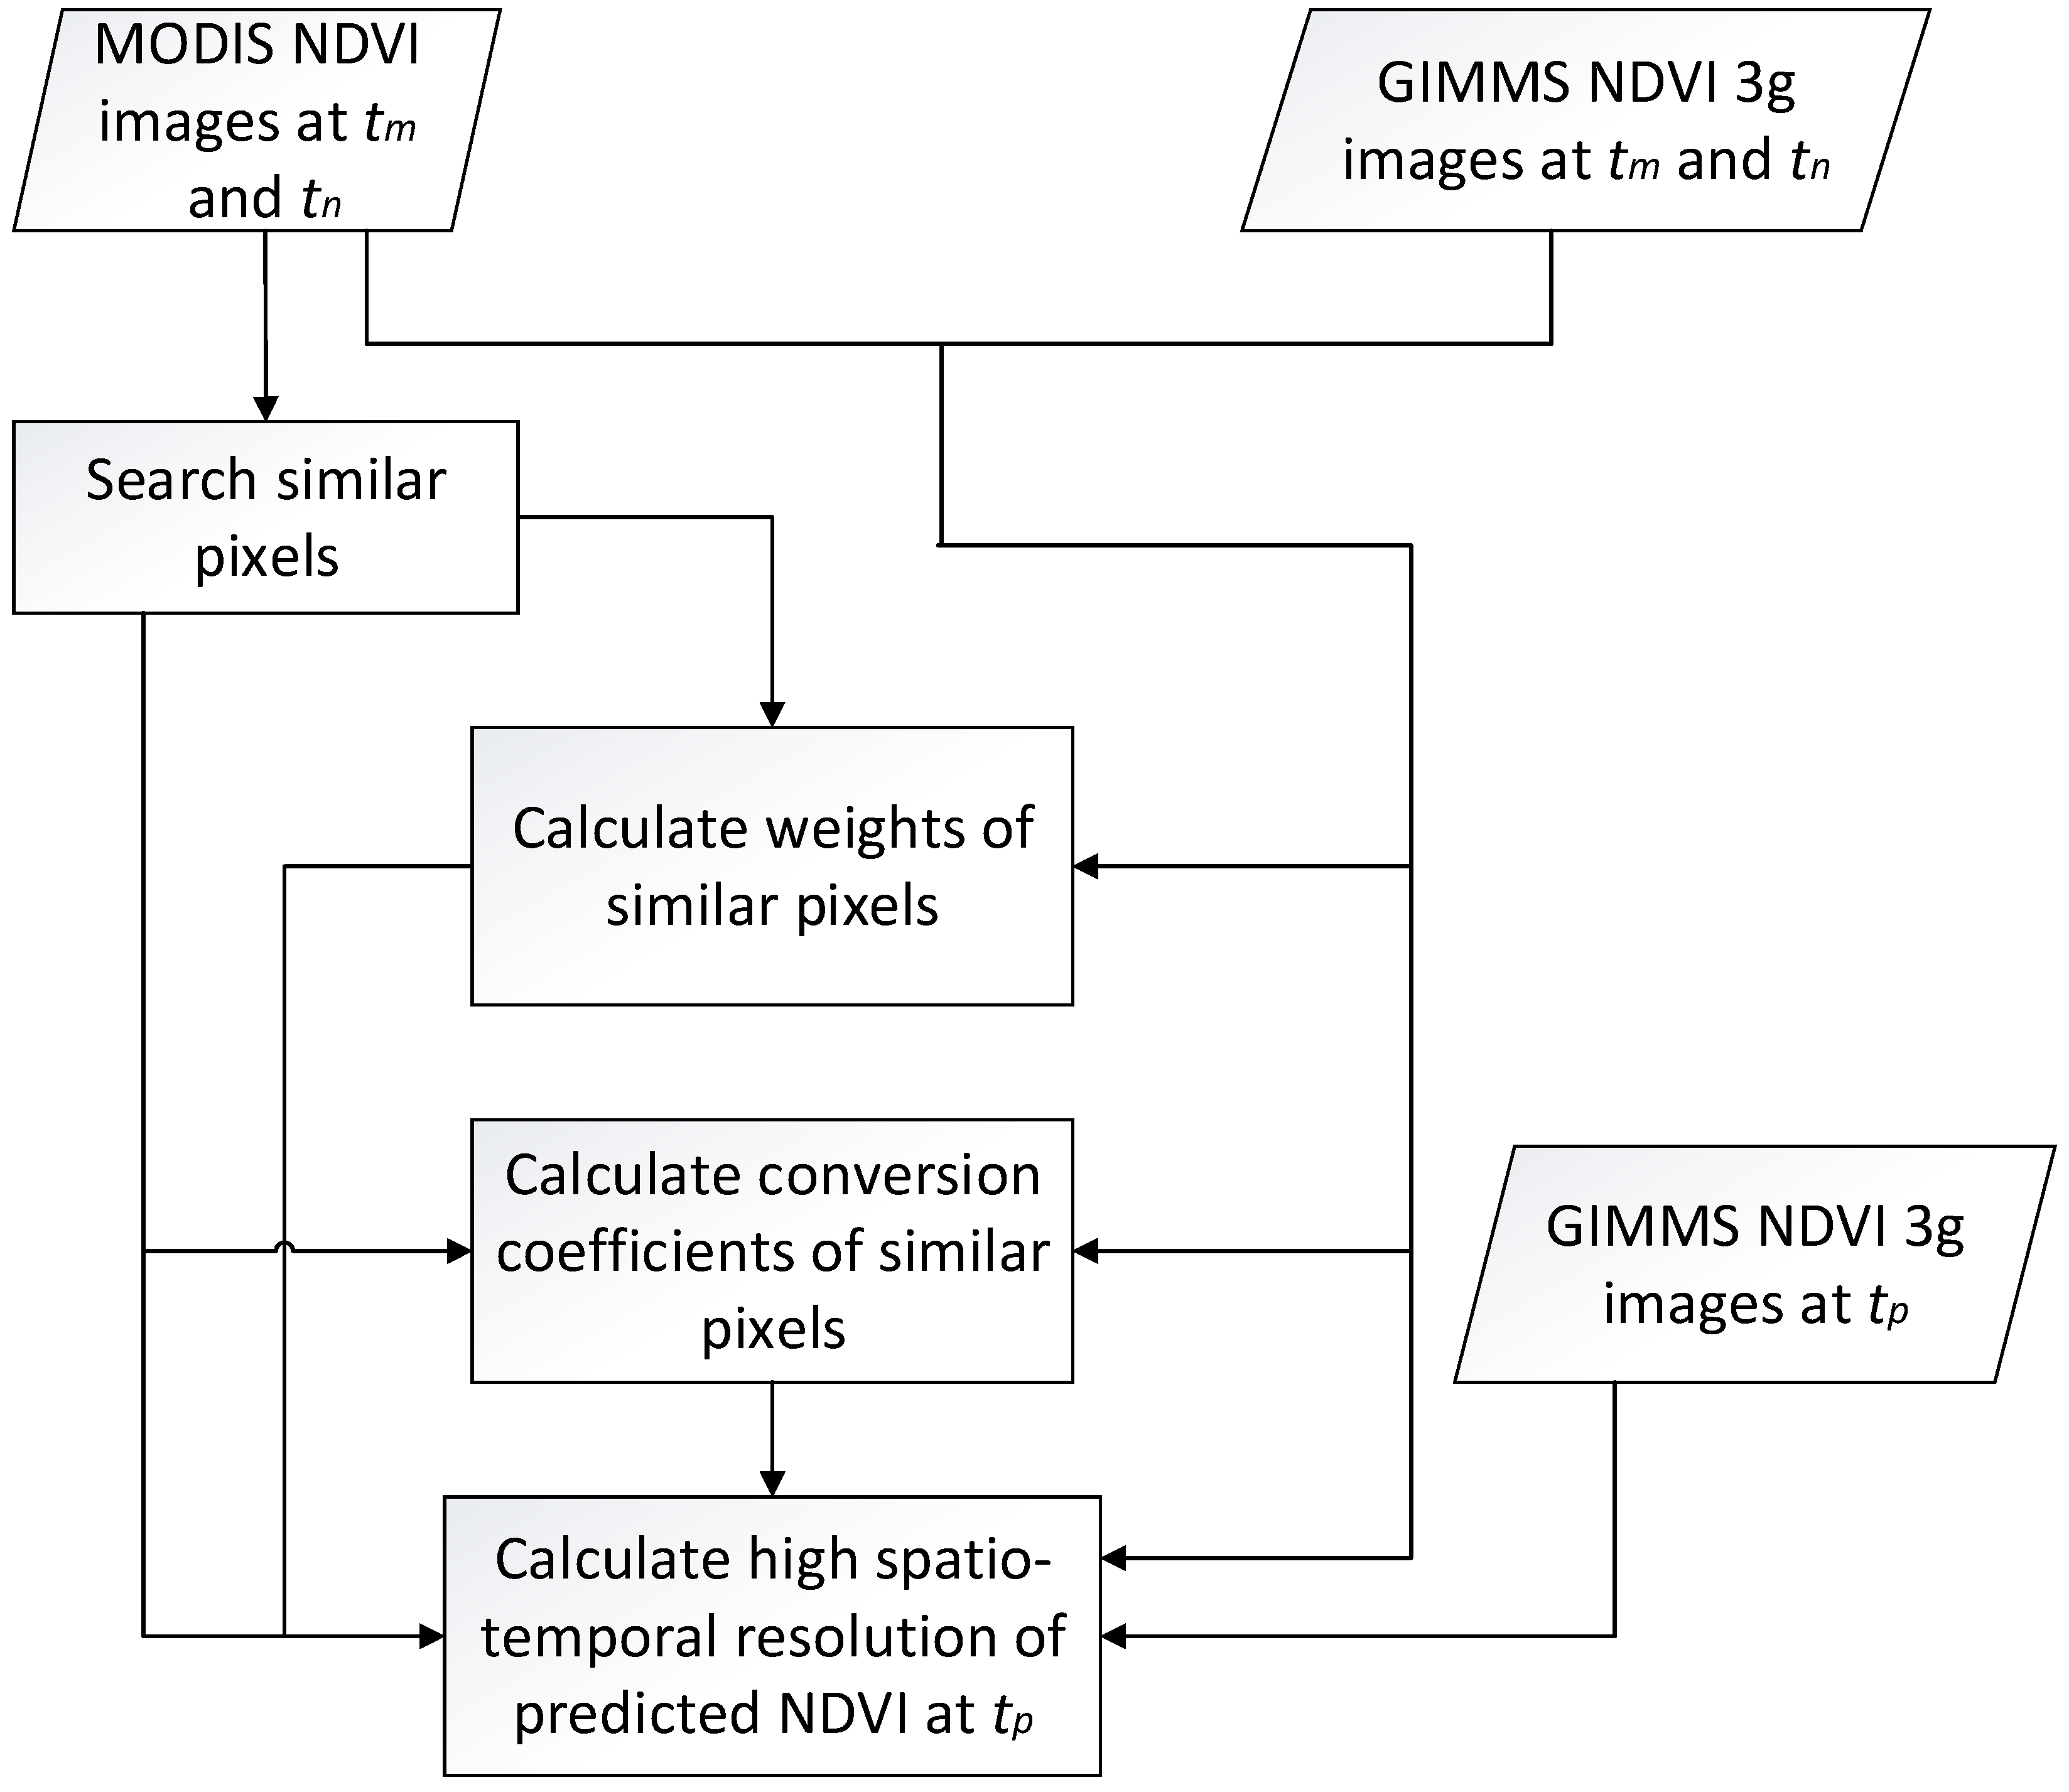
2.3.1. ESTARFM Spatiotemporal Fusion Algorithm
| Algorithm 1: Pseudocode of the ESTARFM |
| Input: two fine-resolution images at and , three coarse-resolution images at , and |
| Output: fine-resolution image at |
| 1: If : |
| 2: |
| 3: Then 4: |
| 5: Check convergence |
| 6: |
| 7: Compute average absolute difference (AAD) and average absolute (AD) |
2.3.2. The Calculation of Vegetation Coverage
2.3.3. Linear Regression Analysis
2.3.4. Hurst Index
2.3.5. Partial Correlation Analysis
3. Results
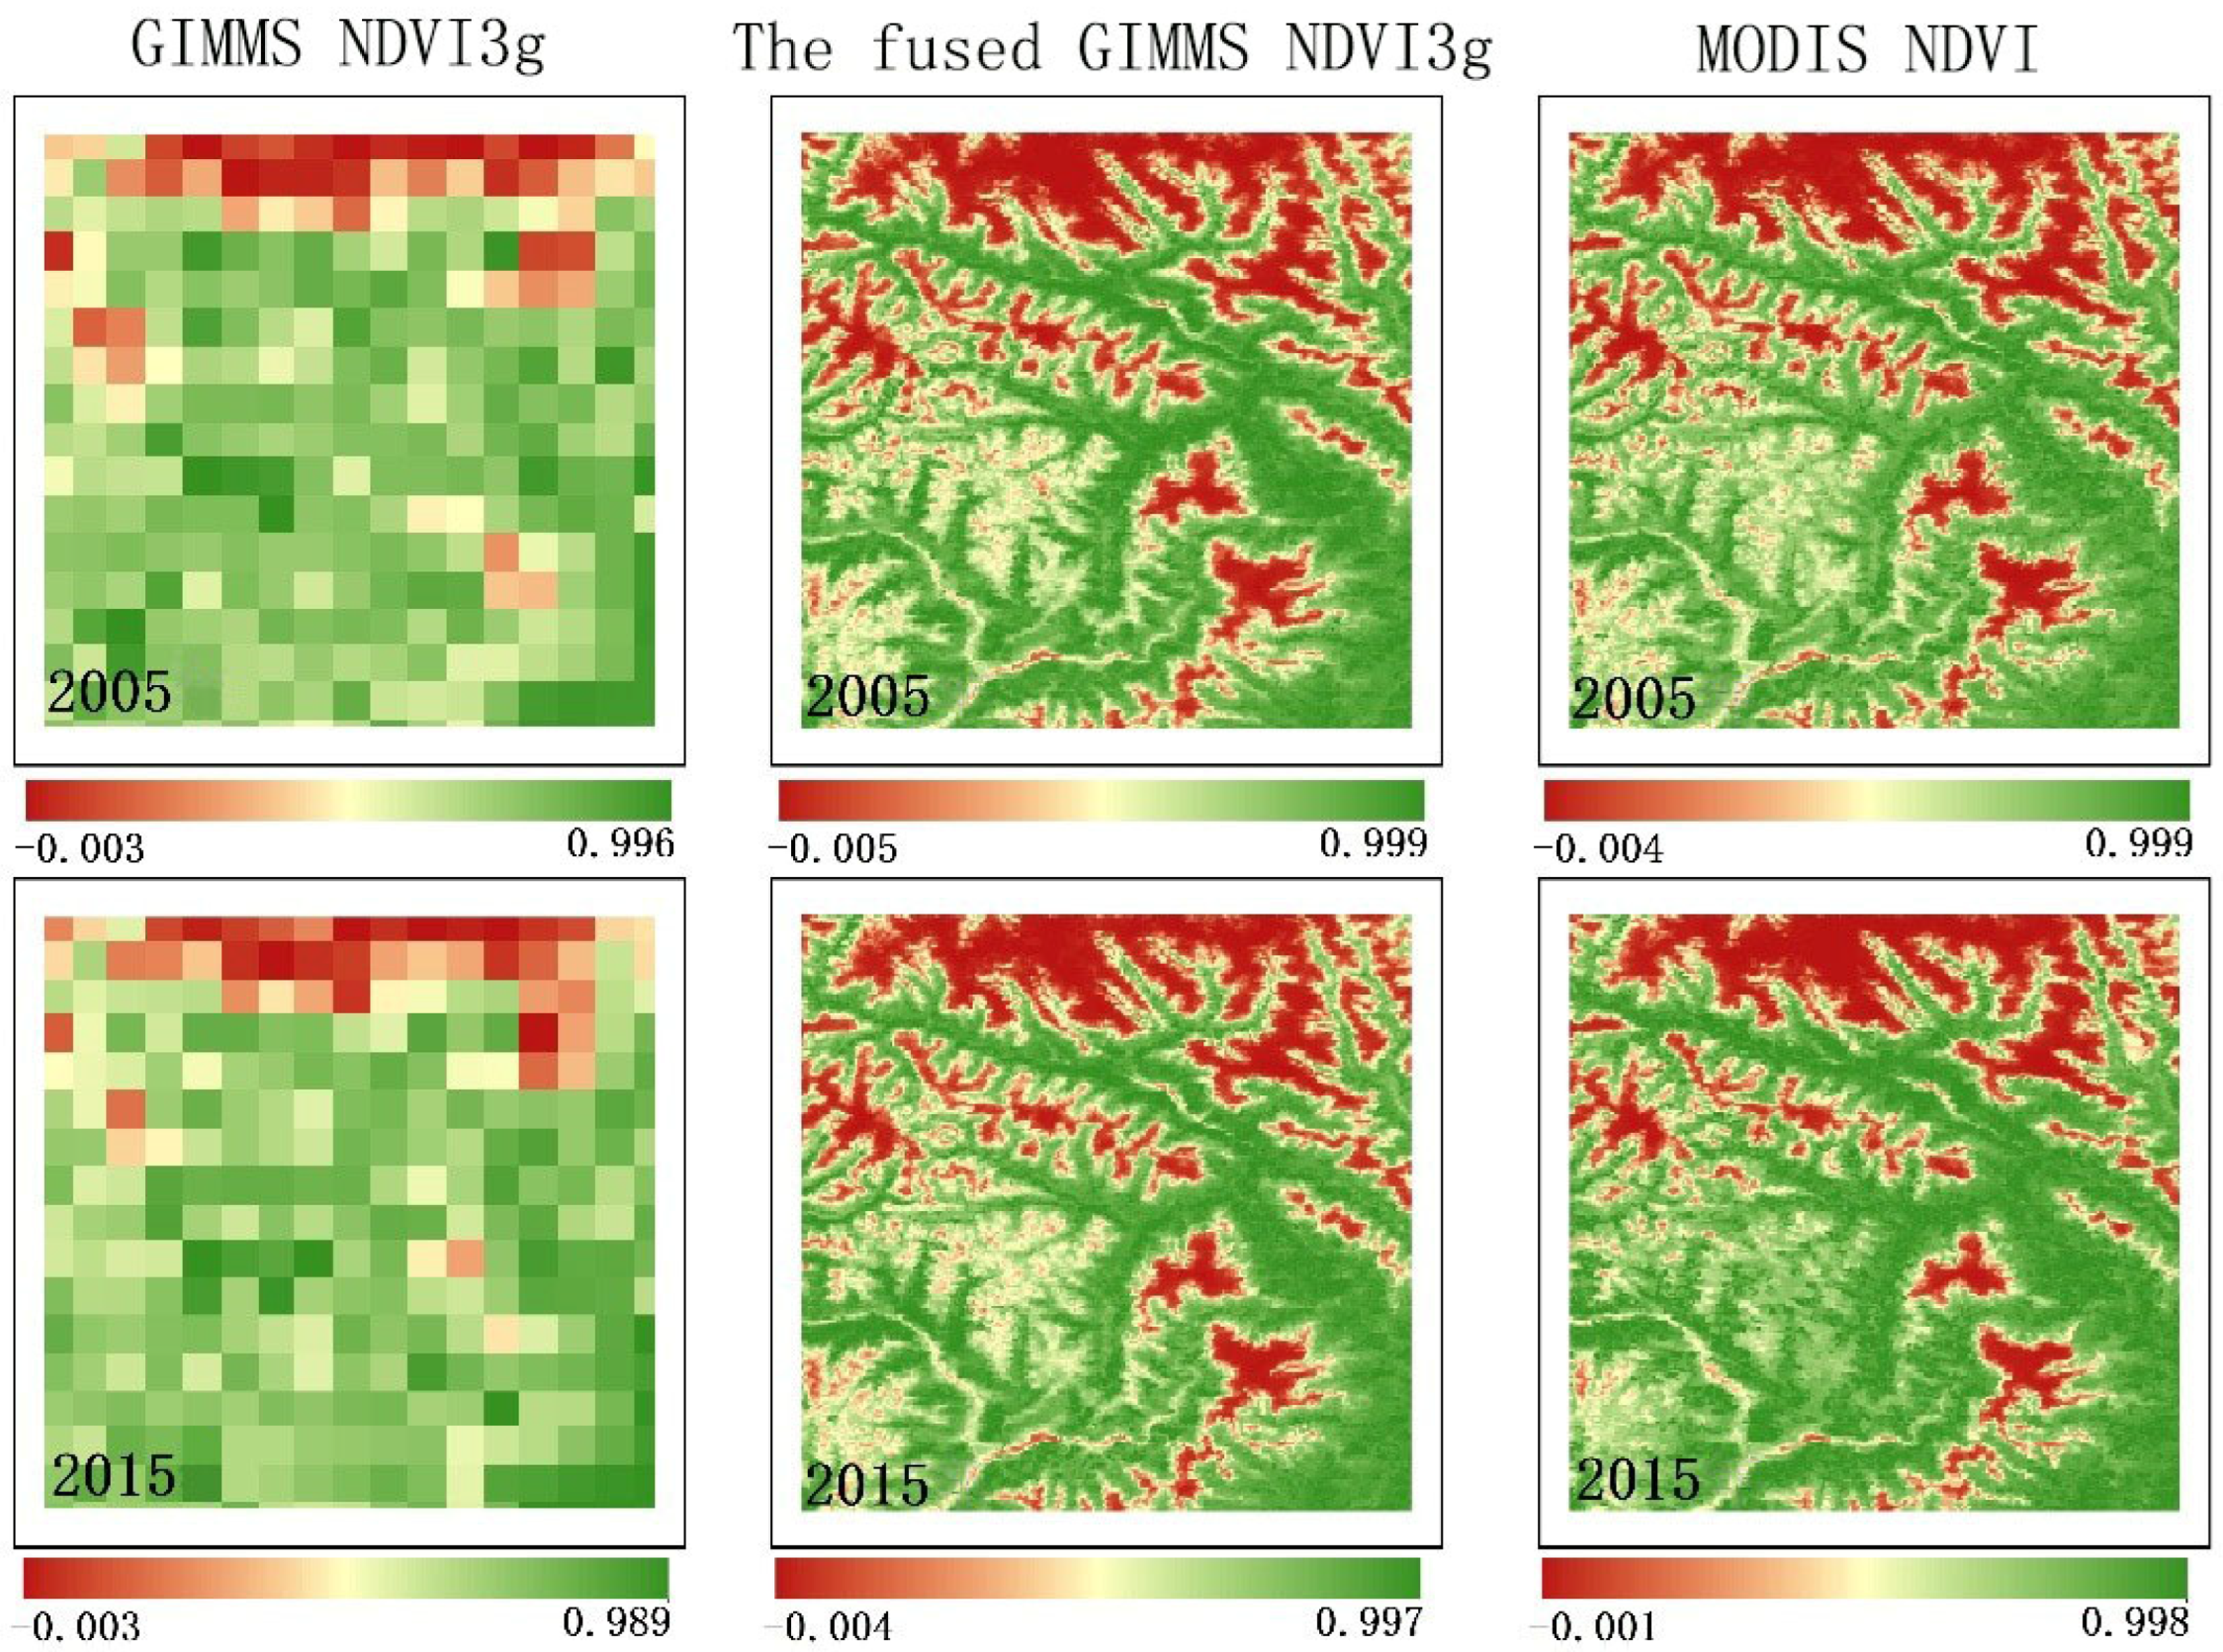
3.1. Data Fusion
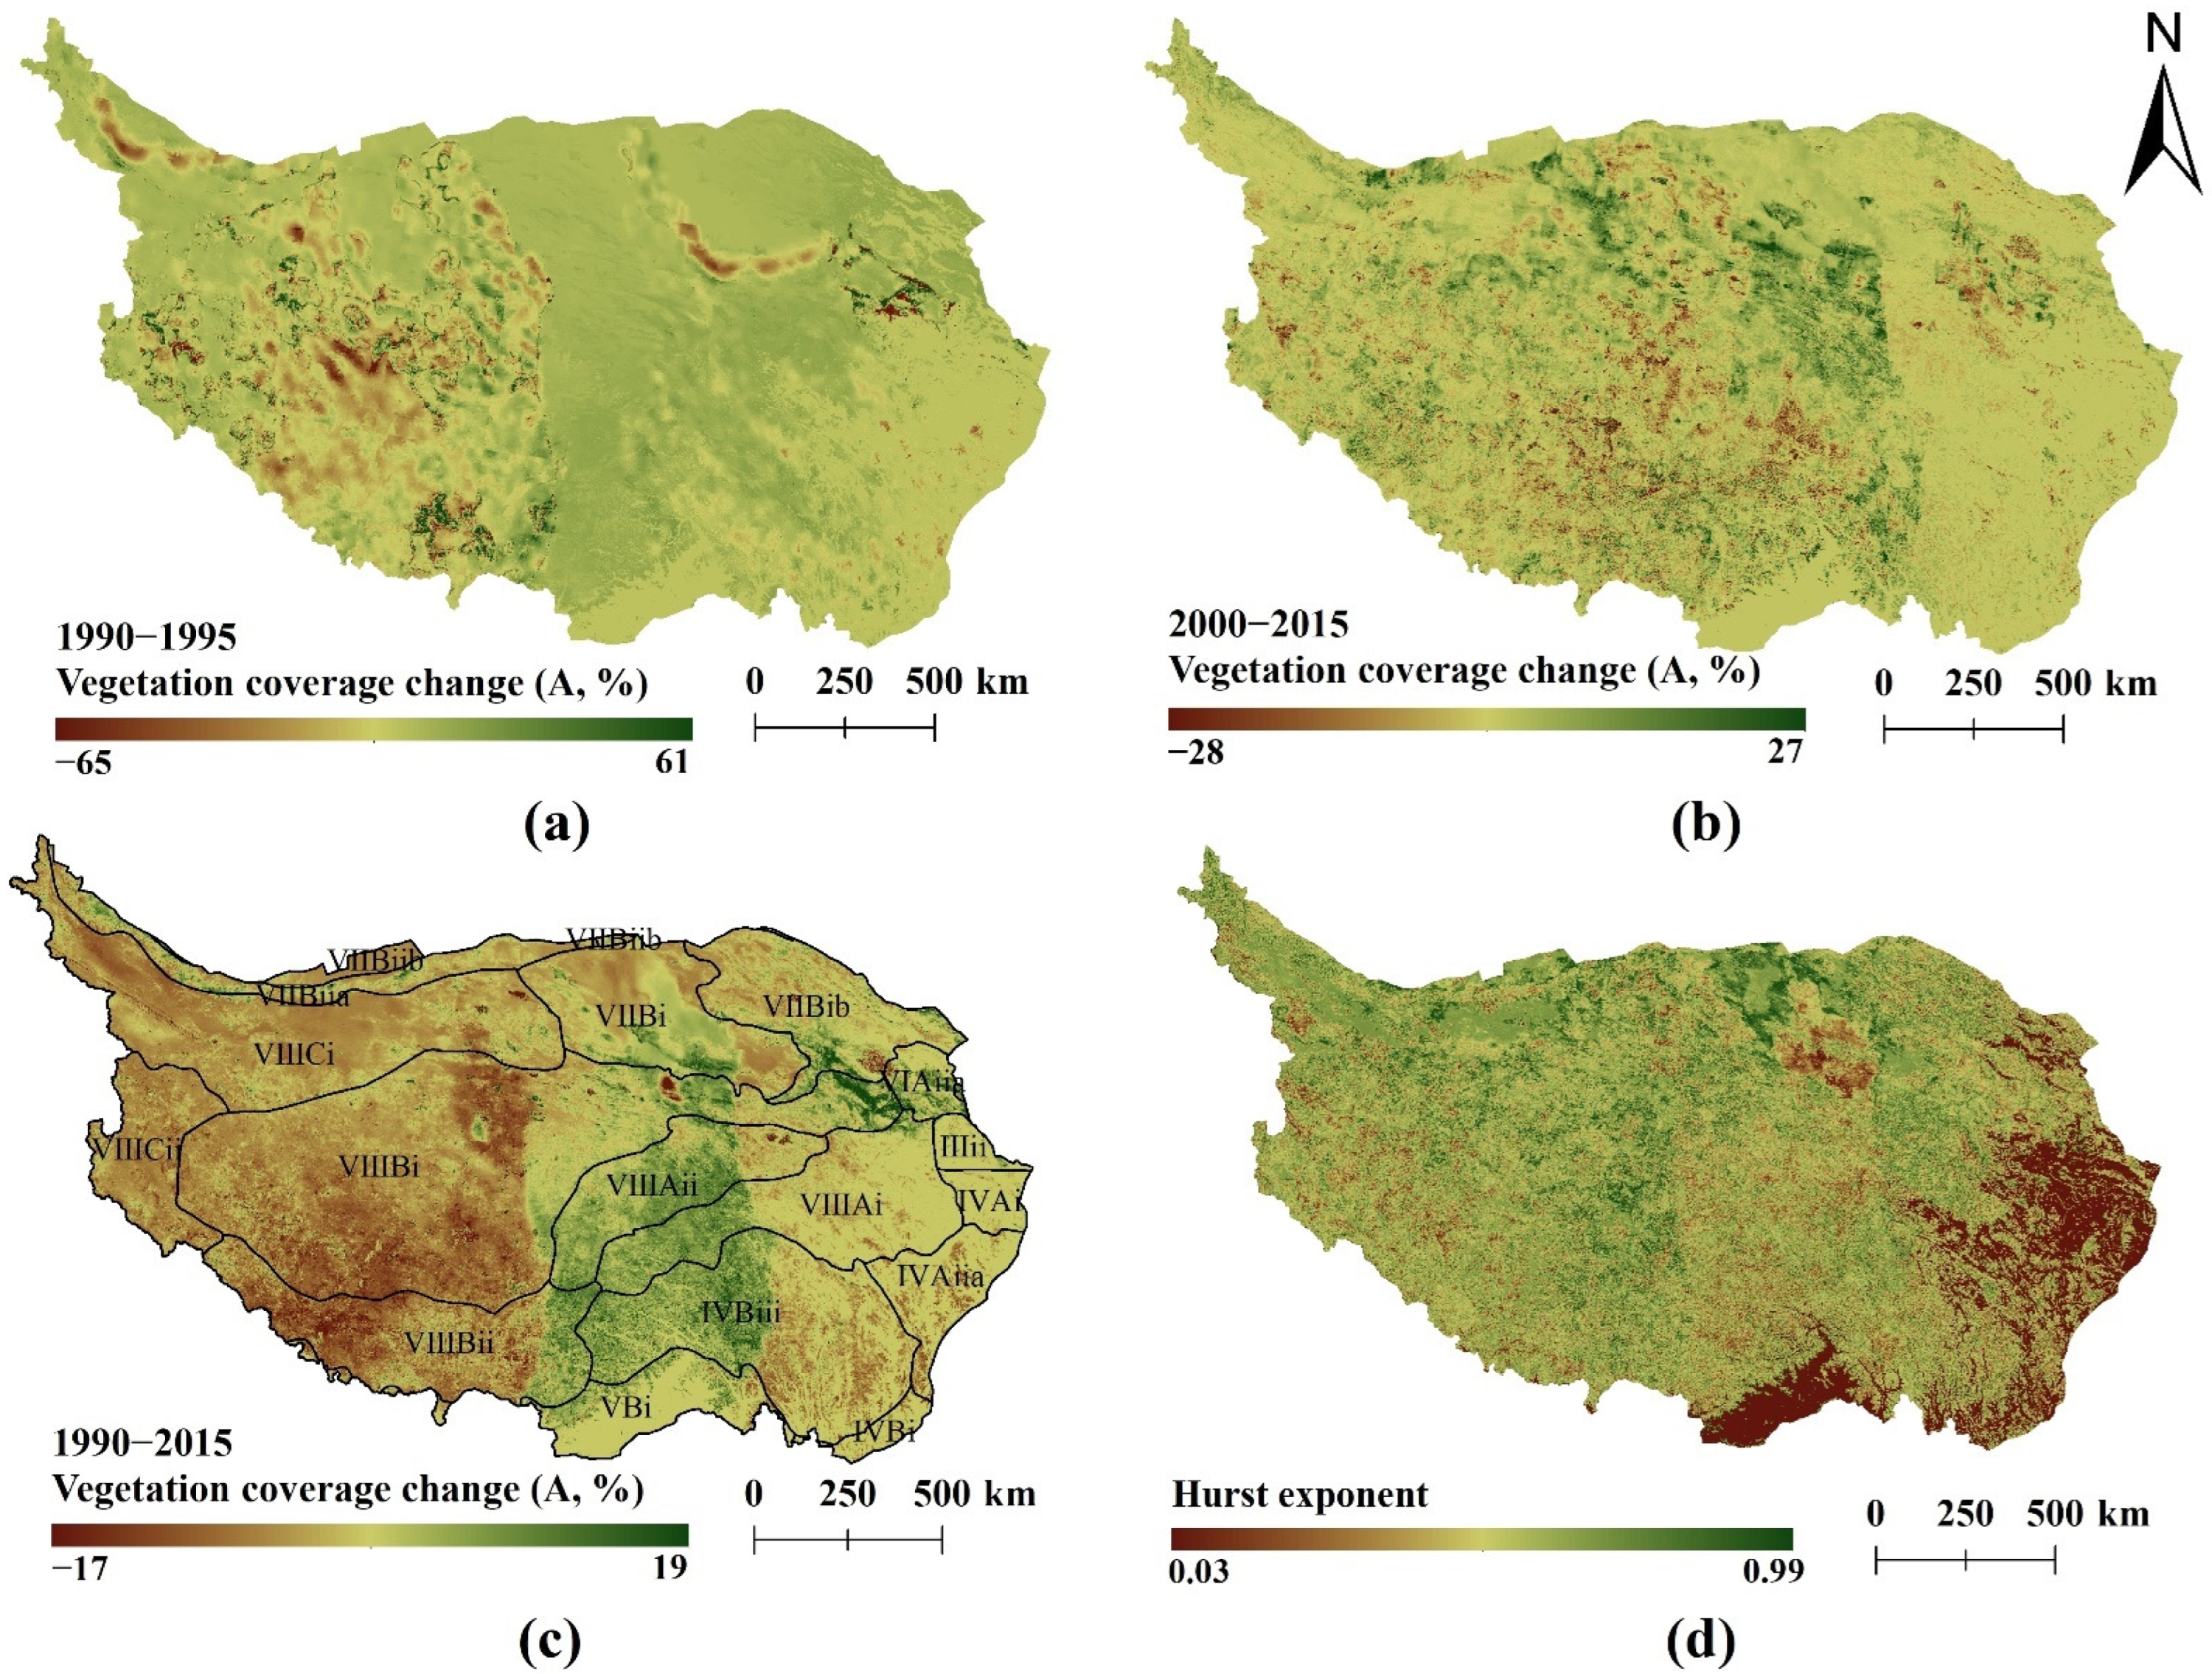
3.2. Analysis of Vegetation Coverage Characteristics
3.3. Impact of the Topographic on Vegetation Coverage
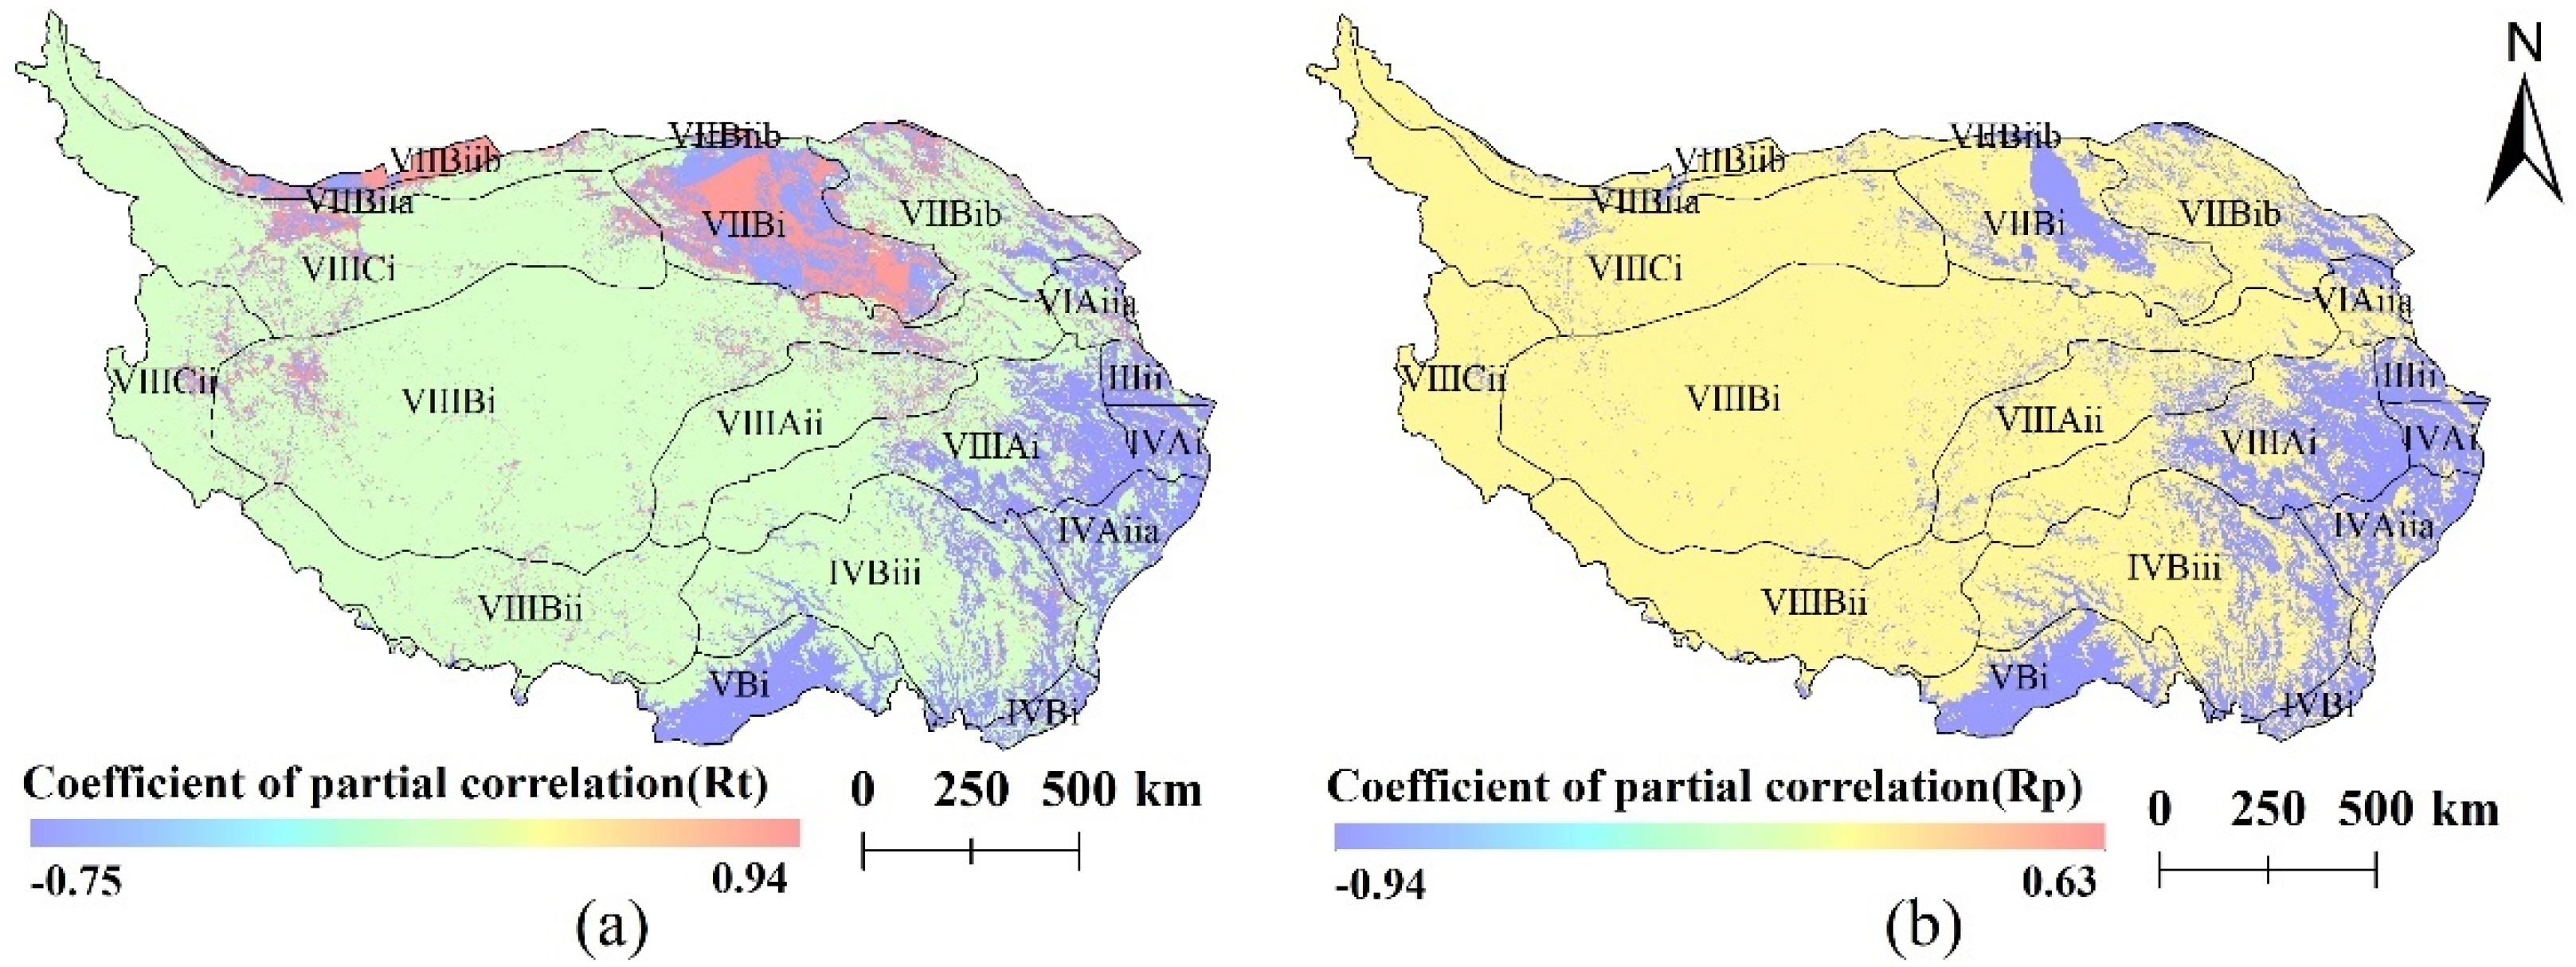
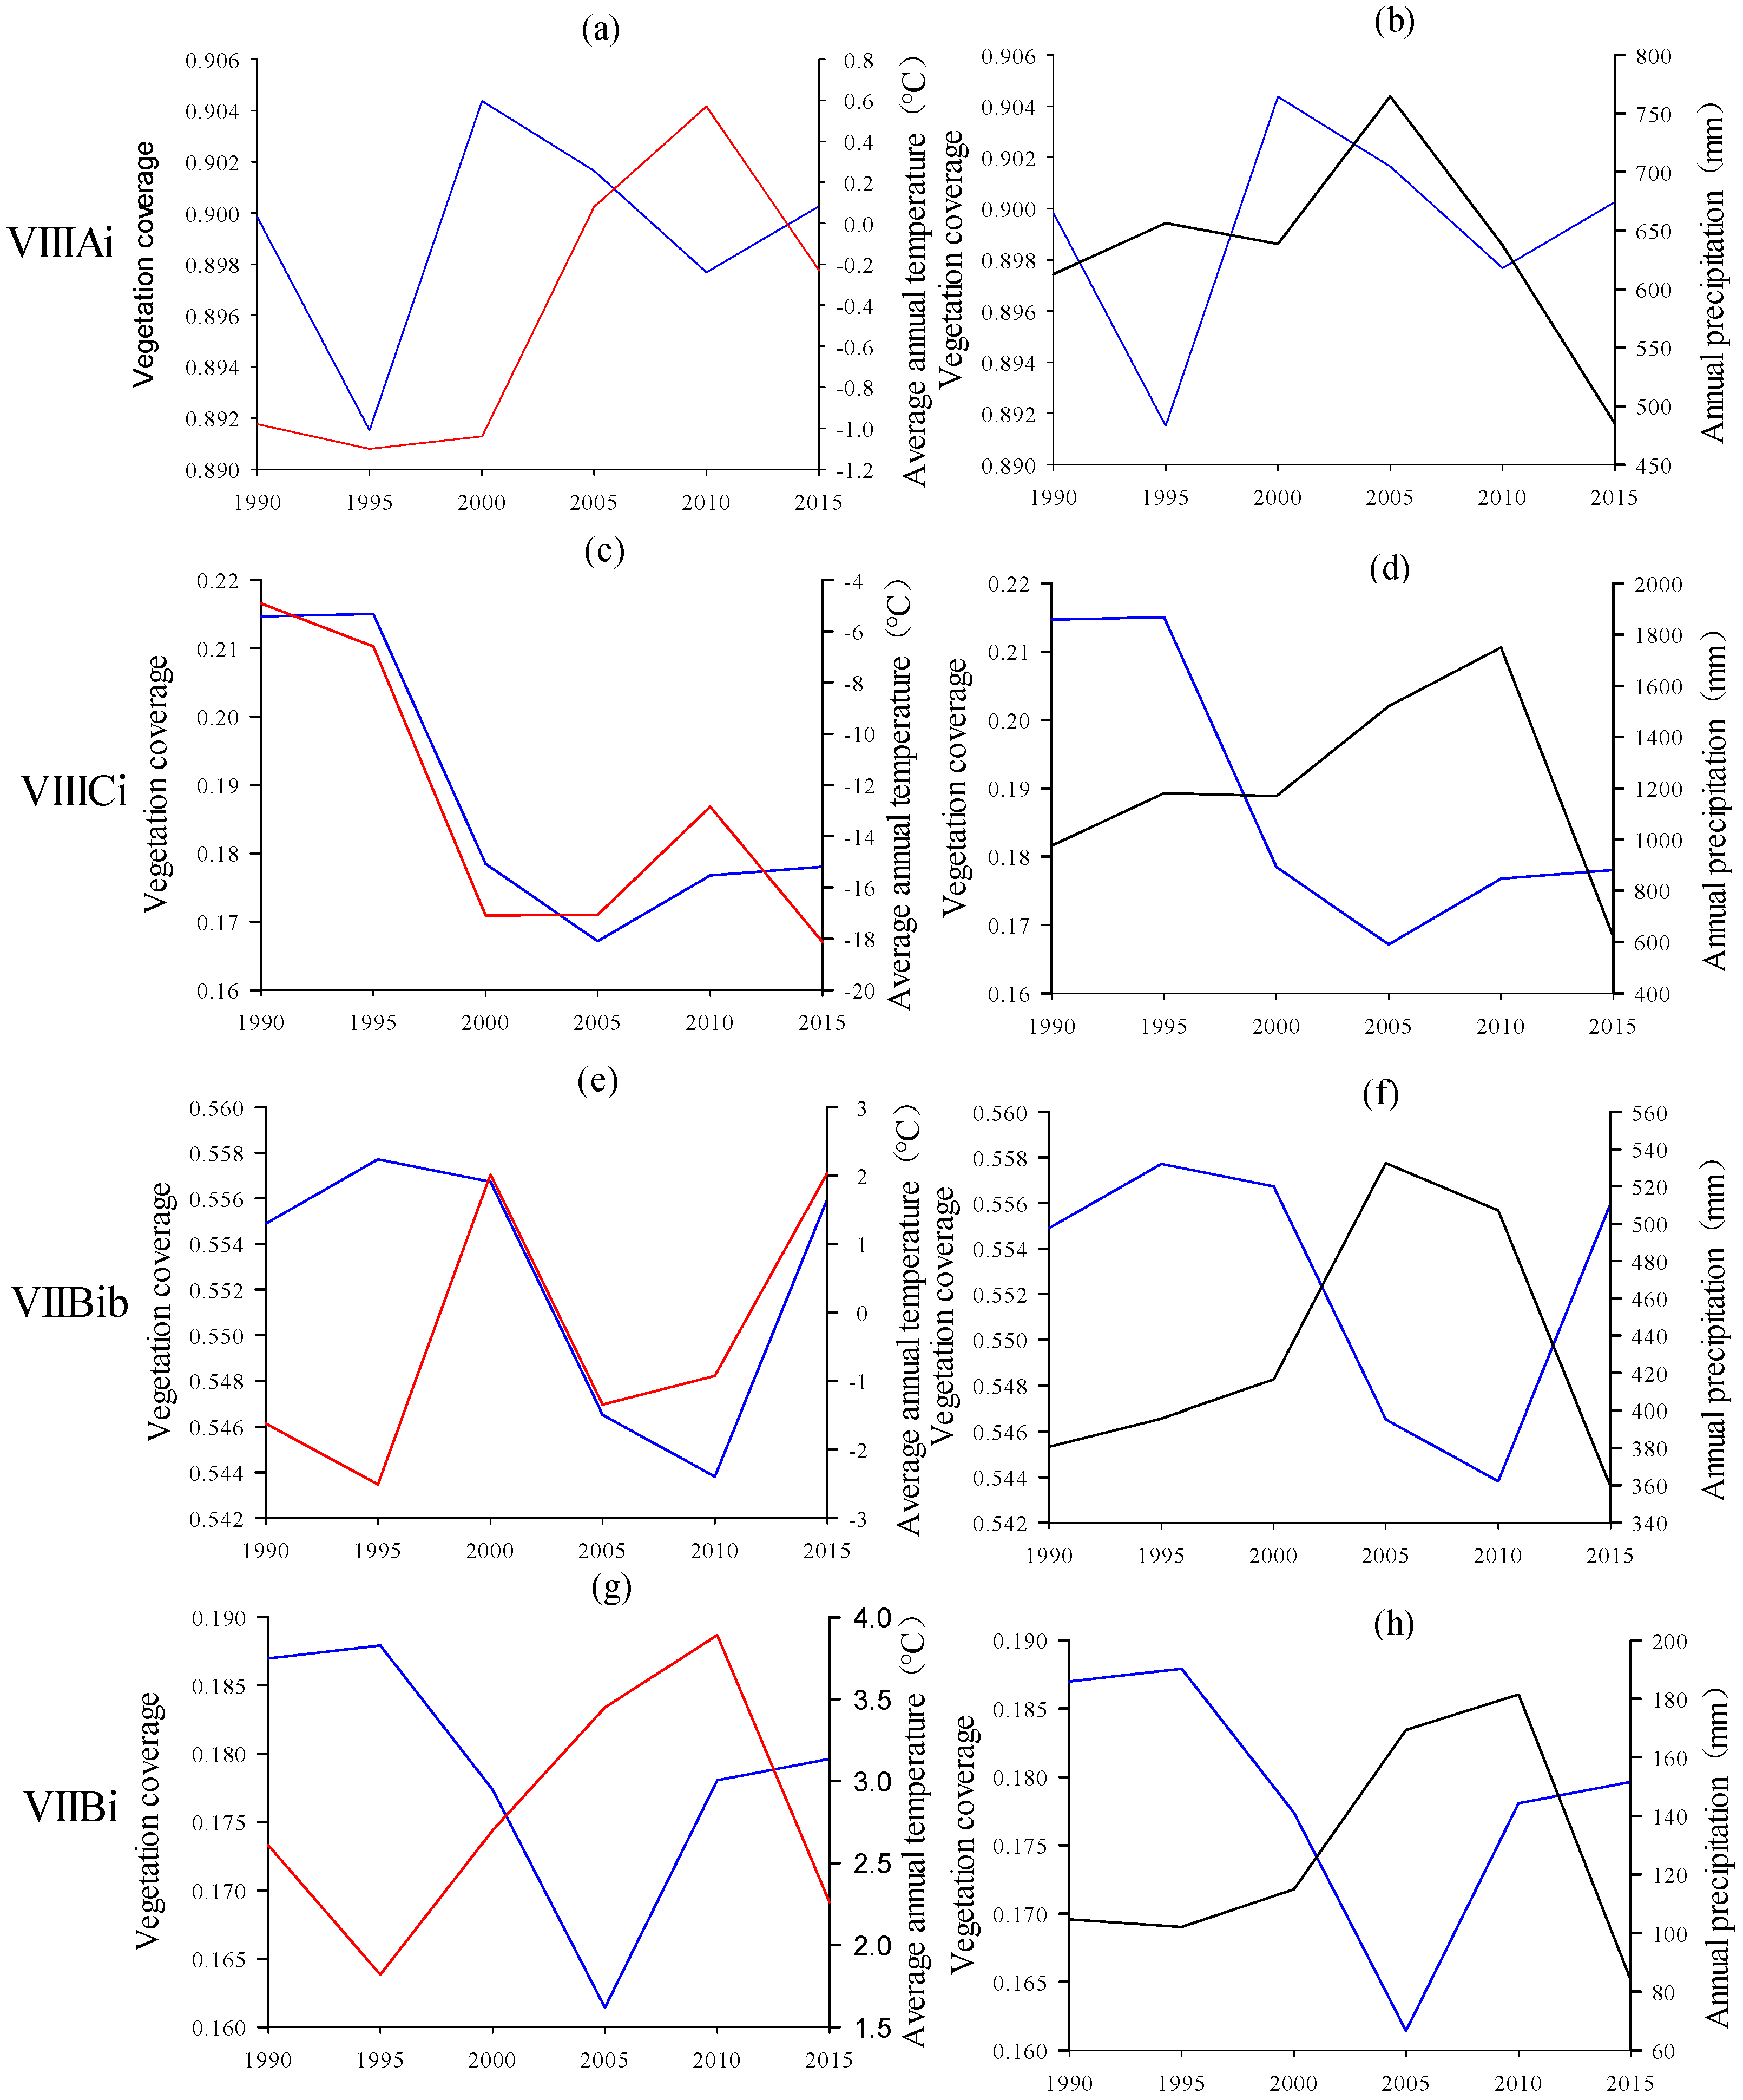
3.4. Link between Climate Change and Vegetation Coverage
4. Discussion
5. Conclusions
Author Contributions
Funding
Institutional Review Board Statement
Informed Consent Statement
Data Availability Statement
Acknowledgments
Conflicts of Interest
References
- Newbold, T.; Hudson, L.N.; Hill, S.; Contu, S.; Lysenko, I.; Al, E. Global effects of land use on local terrestrial biodiversity. Nature 2015, 520, 45–50. [Google Scholar] [CrossRef] [PubMed] [Green Version]
- Pielke, R.A., Sr. Atmospheric science. Land use and climate change. Science 2005, 310, 1625-6. [Google Scholar] [CrossRef] [PubMed] [Green Version]
- Sterling, S.M.; Ducharne, A.; Polcher, J. The impact of global land-cover change on the terrestrial water cycle. Nat. Clim. Chang. 2013, 3, 385–390. [Google Scholar] [CrossRef]
- Chen, M.L.; Cun-Jun, L.I.; Guan, Y.L.; Zhou, J.P.; Wang, D.Y.; Luo, Z.Q. Generation and application of high temporal and spatial resolution images of regional farmland based on ESTARFM model. Acta Agron. Sin. 2019, 45, 1099–1110. [Google Scholar] [CrossRef]
- Li, L.H.; Zhang, Y.L.; Liu, L.S.; Wu, J.S.; Wang, Z.F.; Li, S.C.; Zhang, H.M.; Zu, J.X.; Ding, M.J.; Paudel, B. Spatiotemporal Patterns of Vegetation Greenness Change and Associated Climatic and Anthropogenic Drivers on the Tibetan Plateau during 2000–2015. Remote Sens. 2018, 10, 1525. [Google Scholar] [CrossRef] [Green Version]
- Piao, S.L.; Fang, J.Y.; He, J.S. Variations in vegetation net primary production in the Qinghai-Xizang Plateau, China, from 1982 to 1999. Clim. Chang. 2006, 74, 253–267. [Google Scholar] [CrossRef]
- Zhou, Y.K.; Fan, J.F.; Wang, X.Y. Assessment of varying changes of vegetation and the response to climatic factors using GIMMS NDVI3g on the Tibetan Plateau. PLoS ONE 2020, 15, e0234848. [Google Scholar] [CrossRef]
- Xu, X.; Chen, H.; Levy, J.K. Spatiotemporal vegetation cover variations in the Qinghai-Tibet Plateau under global climate change. Chin. Sci. Bull. 2008, 53, 915–922. [Google Scholar] [CrossRef] [Green Version]
- Zhang, Y.; Song, C.; Band, L.E.; Sun, G.; Li, J. Reanalysis of global terrestrial vegetation trends from MODIS products: Browning or greening? Remote Sens. Environ. 2017, 191, 145–155. [Google Scholar] [CrossRef] [Green Version]
- Mao, D.H.; Wang, Z.M.; Luo, L.; Yang, G. Correlation Analysis between NDVI and Climate in Northeast China based on AVHRR and GIMMS Data Sources. Remote Sens. Technol. Appl. 2012, 27, 81–89. [Google Scholar]
- Bao, G.; Qin, Z.H.; Bao, Y.H.; Zhou, Y. Spatial-temporal Changes of Vegetation Cover in Mongolian Plateau during 1982–2006. J. Desert Res. 2013, 33, 918–927. [Google Scholar] [CrossRef]
- Liu, Y.; Li, C.Z.; Liu, Z.H.; Deng, X.Y. Assessment of spatio-temporal variations in vegetation cover in Xinjiang from 1982 to 2013 based on GIMMS-NDVI. Acta Ecol. Sin. 2016, 36, 6198–6208. [Google Scholar] [CrossRef]
- Ding, J.; Liu, X.Y.; Guo, Y.C.; Ren, H.R. Study on Vegetation Change in the Qinghai-Tibet Plateau from 1980 to 2015. Ecol. Environ. Sci. 2021, 30, 288–296. [Google Scholar] [CrossRef]
- Stellmes, M.; Udelhoven, T.; Röder, A.; Sonnenschein, R.; Hill, J. Dryland observation at local and regional scale—Comparison of Landsat TM/ETM+ and NOAA AVHRR time series. Remote Sens. Environ. 2010, 114, 2111–2125. [Google Scholar] [CrossRef]
- Hui, G.; Yue, H.; Li, X.; Bao, A.; Yang, S.; Meng, F. Dynamic Changes of Fractional Vegetation Cover along the Mainstream of the Tarim River. J. Desert Res. 2016, 36, 1472. [Google Scholar] [CrossRef]
- Bo, C.; Bo, Z.; Ma, B.; Wang, G.; Min, T.; Zhang, Y.; Jia, Y. Spatial and Temporal Variations of NDVI in Gansu, China from 2000 to 2014. J. Desert Res. 2018, 38, 418. [Google Scholar] [CrossRef]
- Sarmah, S.; Jia, G.; Zhang, A.; Singha, M. Assessing seasonal trends and variability of vegetation growth from NDVI3g, MODIS NDVI and EVI over South Asia. Remote Sens. Lett. 2018, 9, 1195–1204. [Google Scholar] [CrossRef]
- Wang, H.W.; Qi, Y.; Huang, C.L.; Li, X.Y.; Deng, X.H.; Zhan, J.L. Analysis of vegetation changes and dominant factors on the Qinghai-Tibet Plateau, China. Sci. Cold Arid Reg. 2019, 11, 150–158. [Google Scholar] [CrossRef]
- Duan, H.C.; Xue, X.; Wang, T.; Kang, W.P.; Liao, J.; Liu, S.L. Spatial and Temporal Differences in Alpine Meadow, Alpine Steppe and All Vegetation of the Qinghai-Tibetan Plateau and Their Responses to Climate Change. Remote Sens. 2021, 13, 669. [Google Scholar] [CrossRef]
- Li, H.; Zhang, C.G.; Wang, S.Z.; Ma, W.D.; Liu, F.G.; Chen, Q.; Zhou, Q.; Xia, X.S.; Niu, B.C. Response of vegetation dynamics to hydrothermal conditions on the Qinghai—Tibet Plateau in the last 40 years. Acta Ecol. Sin. 2022, 1–14. [Google Scholar] [CrossRef]
- Zhang, Y.; Zhang, C.B.; Wang, Z.Q.; Yang, Y.; Li, J.L. Spatiotemporal dynamics of grassland coverage in response to climate change from 1982 to 2012 in the Three Rivers Source Region, China. Pratacultural Sci. 2017, 34, 1977–1990. [Google Scholar] [CrossRef]
- Feng, G.; Masek, J.G.; Schwaller, M.R.; Hall, F.F. On the Blending of the Landsat and MODIS Surface Reflectance: Predicting Daily Landsat Surface Reflectance. IEEE Trans. Geosci. Remote Sens. 2006, 44, 2207–2218. [Google Scholar] [CrossRef]
- Semmens, K.A.; Anderson, M.C.; Kustas, W.P.; Gao, F.; Vélez, M. Monitoring daily evapotranspiration over two California vineyards using Landsat 8 in a multi-sensor data fusion approach. Remote Sens. Environ. 2016, 185, 155–170. [Google Scholar] [CrossRef] [Green Version]
- Singh, D. Evaluation of long-term NDVI time series derived from Landsat data through blending with MODIS data. Atmosfera 2011, 25, 43–63. [Google Scholar] [CrossRef]
- Gevaert, C.M.; García-Haro, F. A comparison of STARFM and an unmixing-based algorithm for Landsat and MODIS data fusion. Remote Sens. Environ. 2015, 156, 34–44. [Google Scholar] [CrossRef]
- Santosh, B.; Stuart, P.; Tony, G. Preparing Landsat Image Time Series (LITS) for Monitoring Changes in Vegetation Phenology in Queensland, Australia. Remote Sens. 2012, 4, 1856–1886. [Google Scholar] [CrossRef] [Green Version]
- Schmidt, M.; Udelhoven, T.; Gill, T.; Roeder, A. Long term data fusion for a dense time series analysis with MODIS and Landsat imagery in an Australian Savanna. J. Appl. Remote Sens. 2012, 6, 2240–2246. [Google Scholar] [CrossRef]
- Zhu, X.L.; Chen, J.; Gao, F.; Chen, X.H.; Masek, J.G. An enhanced spatial and temporal adaptive reflectance fusion model for complex heterogeneous regions. Remote Sens. Environ. 2010, 114, 2610–2623. [Google Scholar] [CrossRef]
- Hao, G.B.; Wu, B.; Zhang, L.F.; Fu, D.J.; Li, Y. Temporal and Spatial Variation Analysis of the Area of Siling Co Lake in Tibet Based on ESTARFM(1976–2014). J. Geo-Inf. Sci. 2016, 18, 14. [Google Scholar] [CrossRef]
- Kim, K.; Ursula, G.; Rasmus, F.; Claudia, K. An ESTARFM Fusion Framework for the Generation of Large-Scale Time Series in Cloud-Prone and Heterogeneous Landscapes. Remote Sens. 2016, 8, 425. [Google Scholar] [CrossRef] [Green Version]
- Yue, B.O.; Xiaolan, L.I.; Wang, C. Seasonal characteristics of the interannual variations centre of the Tibetan Plateau snow cover. J. Glaciol. Geocryol. 2014, 36, 1353–1362. [Google Scholar] [CrossRef]
- Huang, W.J.; Zeng, T.Y.; Huang, X.D. Spatiotemporal dynamics of alpine grassland phenology on the Tibetan Plateau. Pratacultural Sci. 2019, 36, 919, 1032–1043. [Google Scholar] [CrossRef]
- Li, J.; Peng, S.; Zhi, L. Detecting and attributing vegetation changes on China’s Loess Plateau. Agric. For. Meteorol. 2017, 247, 260–270. [Google Scholar] [CrossRef]
- Piao, S.; Wang, X.; Ciais, P.; Zhu, B.; Liu, J. Changes in satellite-derived vegetation growth trend in temperate and boreal Eurasia from 1982 to 2006. Glob. Chang. Biol. 2011, 17, 3228–3239. [Google Scholar] [CrossRef]
- Zheng, K.; Wei, J.Z.; Hua, C.; Zhang, X.L.; Huang, F.Q.; Li, F.M.; Ye, J.S. Impacts of climate change and human activities on grassland vegetation variation in the Chinese Loess Plateau. Sci. Total Environ. 2019, 660, 236–244. [Google Scholar] [CrossRef]
- Zhang, L.C.; Hu, L.J.; Zheng, Z.J.; Li, S.; Hou, X.G. Comparison of snow line elevation extraction method based on remote sensing image: A case of north slope of Tianshan Mountains. Arid Land Geogr. 2015, 38, 788–796. [Google Scholar] [CrossRef]
- Hutchinson, M.F. The Application of Thin Plate Smoothing Splines to Continent-Wide Data Assimilation. Bur. Meteorol. Res. Rep. 1991, 27, 104–113. [Google Scholar]
- Jong, R.D.; Bruin, S.D.; Wit, A.D.; Schaepman, M.E.; Dent, D.L. Analysis of monotonic greening and browning trends from global NDVI time-series. Remote Sens. Environ. 2011, 115, 692–702. [Google Scholar] [CrossRef] [Green Version]
- Zhao, L.; Dai, A.; Dong, B. Changes in global vegetation activity and its driving factors during 1982–2013. Agric. For. Meteorol. 2018, 249, 198–209. [Google Scholar] [CrossRef]
- Chen, C.D.; Niu, A.J. Application of R/S Method in the Tendency Prediction of Reservoir Water Inflow. J. Water Resour. Water Eng. 2010. [Google Scholar] [CrossRef]
- Koirala, S.R.; Gentry, R.W. Hurst Analysis of Hydrologic and Water Quality Signals. In Proceedings of the World Environmental & Water Resources Congress 2010, Providence, RI, USA, 16–20 May 2010; pp. 4537–4546. [Google Scholar]
- Kong, B.; Wang, E.; Li, Z. The effect of high temperature environment on rock properties—An example of electromagnetic radiation characterization. Environ. Sci. Pollut. Res. 2018, 25, 29104–29114. [Google Scholar] [CrossRef] [PubMed]
- Koutsoyiannis, D. Climate change, the Hurst phenomenon, and hydrological statistics. Int. Assoc. Sci. Hydrol. Bull. 2003, 48, 3–24. [Google Scholar] [CrossRef]
- Liu, Y.; Wang, Y.; Peng, J.; Wei, H.; Zhang, X. Land ecological suitability assessment for forest coupled with the resilience perspective: A case study in Wangqing county, Jilin province, China. Acta Geogr. Sin. 2015, 70, 476–487. [Google Scholar] [CrossRef]
- The State Council. Several Opinions on Doing a Good Job in Returning Cultivated Land to Forest and Grassland. For. China 2000, 10, 3–4. [Google Scholar]
- Xu, G.C.; Zhang, J.X.; Li, P.; Li, Z.B.; Lu, K.X.; Wang, X.K.; Wang, F.C.; Cheng, Y.T.; Wang, B. Vegetation restoration projects and their influence on runoff and sediment in China. Ecol. Indic. 2018, 95, 233–241. [Google Scholar] [CrossRef]
- Rao, Y.H.; Zhu, X.L.; Chen, J.; Wang, J.M. An Improved Method for Producing High Spatial-Resolution NDVI Time Series Datasets with Multi-Temporal MODIS NDVI Data and Landsat TM/ETM+ Images. Remote Sens. 2015, 7, 7865–7891. [Google Scholar] [CrossRef] [Green Version]
- Zhang, Y.L.; Qi, W.; Zhou, C.P.; Ding, M.J.; Liu, L.S.; Gao, J.G.; Bai, W.Q.; Wang, Z.F.; Zheng, D. Spatial and temporal variability in the net primary production of alpine grassland on the Tibetan Plateau since 1982. J. Geogr. Sci. 2014, 24, 269–287. [Google Scholar] [CrossRef]
- Lehnert, L.W.; Wesche, K.; Trachte, K.; Reudenbach, C.; Bendix, J. Climate variability rather than overstocking causes recent large scale cover changes of Tibetan pastures. Sci. Rep. 2016, 6, 24367. [Google Scholar] [CrossRef] [Green Version]
- Cong, N.; Shen, M.; Yang, W.; Yang, Z.; Zhang, G.; Piao, S. Varying responses of vegetation activity to climate changes on the Tibetan Plateau grassland. Int. J. Biometeorol. 2017, 61, 1433–1444. [Google Scholar] [CrossRef]
- Pang, G.; Wang, X.; Yang, M. Using the NDVI to identify variations in, and responses of, vegetation to climate change on the Tibetan Plateau from 1982 to 2012. Quat. Int. 2016, 444, 87–96. [Google Scholar] [CrossRef]


| Zones | Codes | Average Vegetation Coverage | Value(%) of 1990–2015 | |
|---|---|---|---|---|
| 1990 | 2015 | |||
| Warm temperate shrubbery, semi-shrubbery, and bare land zone | VIIBiib | 0.17 | 0.13 | −0.87 |
| Southern temperate sylvosteppe zone | VIAiia | 0.84 | 0.86 | 0.45 |
| Southern temperate desert steppe sub-zone | VIAiic | 0.75 | 0.8 | 1.03 |
| Alpine steppe zone | VIIIBi | 0.39 | 0.36 | −0.84 |
| Alpine shrub and meadow zone | VIIIAi | 0.89 | 0.9 | 0.19 |
| Alpine meadow zone | VIIIAii | 0.68 | 0.72 | 0.58 |
| Cold temperate coniferous forest zone in subtropical mountain | IVBiii | 0.8 | 0.81 | 0.2 |
| Warm temperate shrub, semi-shrub and desert sub−zone | VIIBiia | 0.3 | 0.29 | −0.38 |
| Alpine desert zone | VIIICi | 0.21 | 0.18 | −0.88 |
| Temperate desert zone | VIIICii | 0.3 | 0.25 | −1.08 |
| Temperate steppe zone | VIIIBii | 0.53 | 0.49 | −0.92 |
| Mid-subtropical evergreen broad-leaved forest zone | IVBi | 0.99 | 0.98 | −0.24 |
| North tropical seasonal rain forest, semi evergreen season | VBi | 0.87 | 0.87 | 0.1 |
| Northern mid-subtropical evergreen broad-leaved forest sub-zone | IVAiia | 0.95 | 0.94 | −0.35 |
| Northern subtropical mixed evergreen and deciduous broad-leaved zone | IVAi | 0.98 | 0.98 | −0.07 |
| Warm temperate deciduous oak forest zone | IIIii | 0.98 | 0.98 | 0.03 |
| Temperate shrub and semi-fruticous desert zone | VIIBib | 0.55 | 0.56 | −0.13 |
| Temperate semi-shrub and fruticous desert zone | VIIBi | 0.19 | 0.18 | −0.23 |
| Topographic Factors | Average Vegetation Coverage | Value (%) from 1990 to 2015 | Hurst Index from 1990 to 2015 | ||
|---|---|---|---|---|---|
| 1990 | 2015 | ||||
| Slope (°) | 0–3 | 0.38 | 0.36 | −0.58 | 0.67 |
| 3–8 | 0.5 | 0.5 | −0.51 | 0.67 | |
| 8–15 | 0.58 | 0.57 | −0.37 | 0.65 | |
| 12–25 | 0.63 | 0.62 | −0.23 | 0.65 | |
| ≥25 | 0.71 | 0.7 | −0.08 | 0.64 | |
| Aspect | Flat | 0.35 | 0.34 | −0.45 | 0.65 |
| Sunny slope | 0.52 | 0.5 | −0.4 | 0.66 | |
| Shady slope | 0.53 | 0.51 | −0.44 | 0.66 | |
Publisher’s Note: MDPI stays neutral with regard to jurisdictional claims in published maps and institutional affiliations. |
© 2022 by the authors. Licensee MDPI, Basel, Switzerland. This article is an open access article distributed under the terms and conditions of the Creative Commons Attribution (CC BY) license (https://creativecommons.org/licenses/by/4.0/).
Share and Cite
Deng, X.; Wu, L.; He, C.; Shao, H. Study on Spatiotemporal Variation Pattern of Vegetation Coverage on Qinghai–Tibet Plateau and the Analysis of Its Climate Driving Factors. Int. J. Environ. Res. Public Health 2022, 19, 8836. https://doi.org/10.3390/ijerph19148836
Deng X, Wu L, He C, Shao H. Study on Spatiotemporal Variation Pattern of Vegetation Coverage on Qinghai–Tibet Plateau and the Analysis of Its Climate Driving Factors. International Journal of Environmental Research and Public Health. 2022; 19(14):8836. https://doi.org/10.3390/ijerph19148836
Chicago/Turabian StyleDeng, Xiaoyu, Liangxu Wu, Chengjin He, and Huaiyong Shao. 2022. "Study on Spatiotemporal Variation Pattern of Vegetation Coverage on Qinghai–Tibet Plateau and the Analysis of Its Climate Driving Factors" International Journal of Environmental Research and Public Health 19, no. 14: 8836. https://doi.org/10.3390/ijerph19148836