
Diagnostic Accuracy of Various Immunochromatographic Tests for NS1 Antigen and IgM Antibodies Detection in Acute Dengue Virus Infection


 and
and
Abstract
:1. Introduction
2. Materials and Methods
2.1. Search Strategy
2.2. Study Selection Using Standardized Quality Assessment Criteria
2.3. Data Extraction
2.4. Statistical Analysis
3. Results
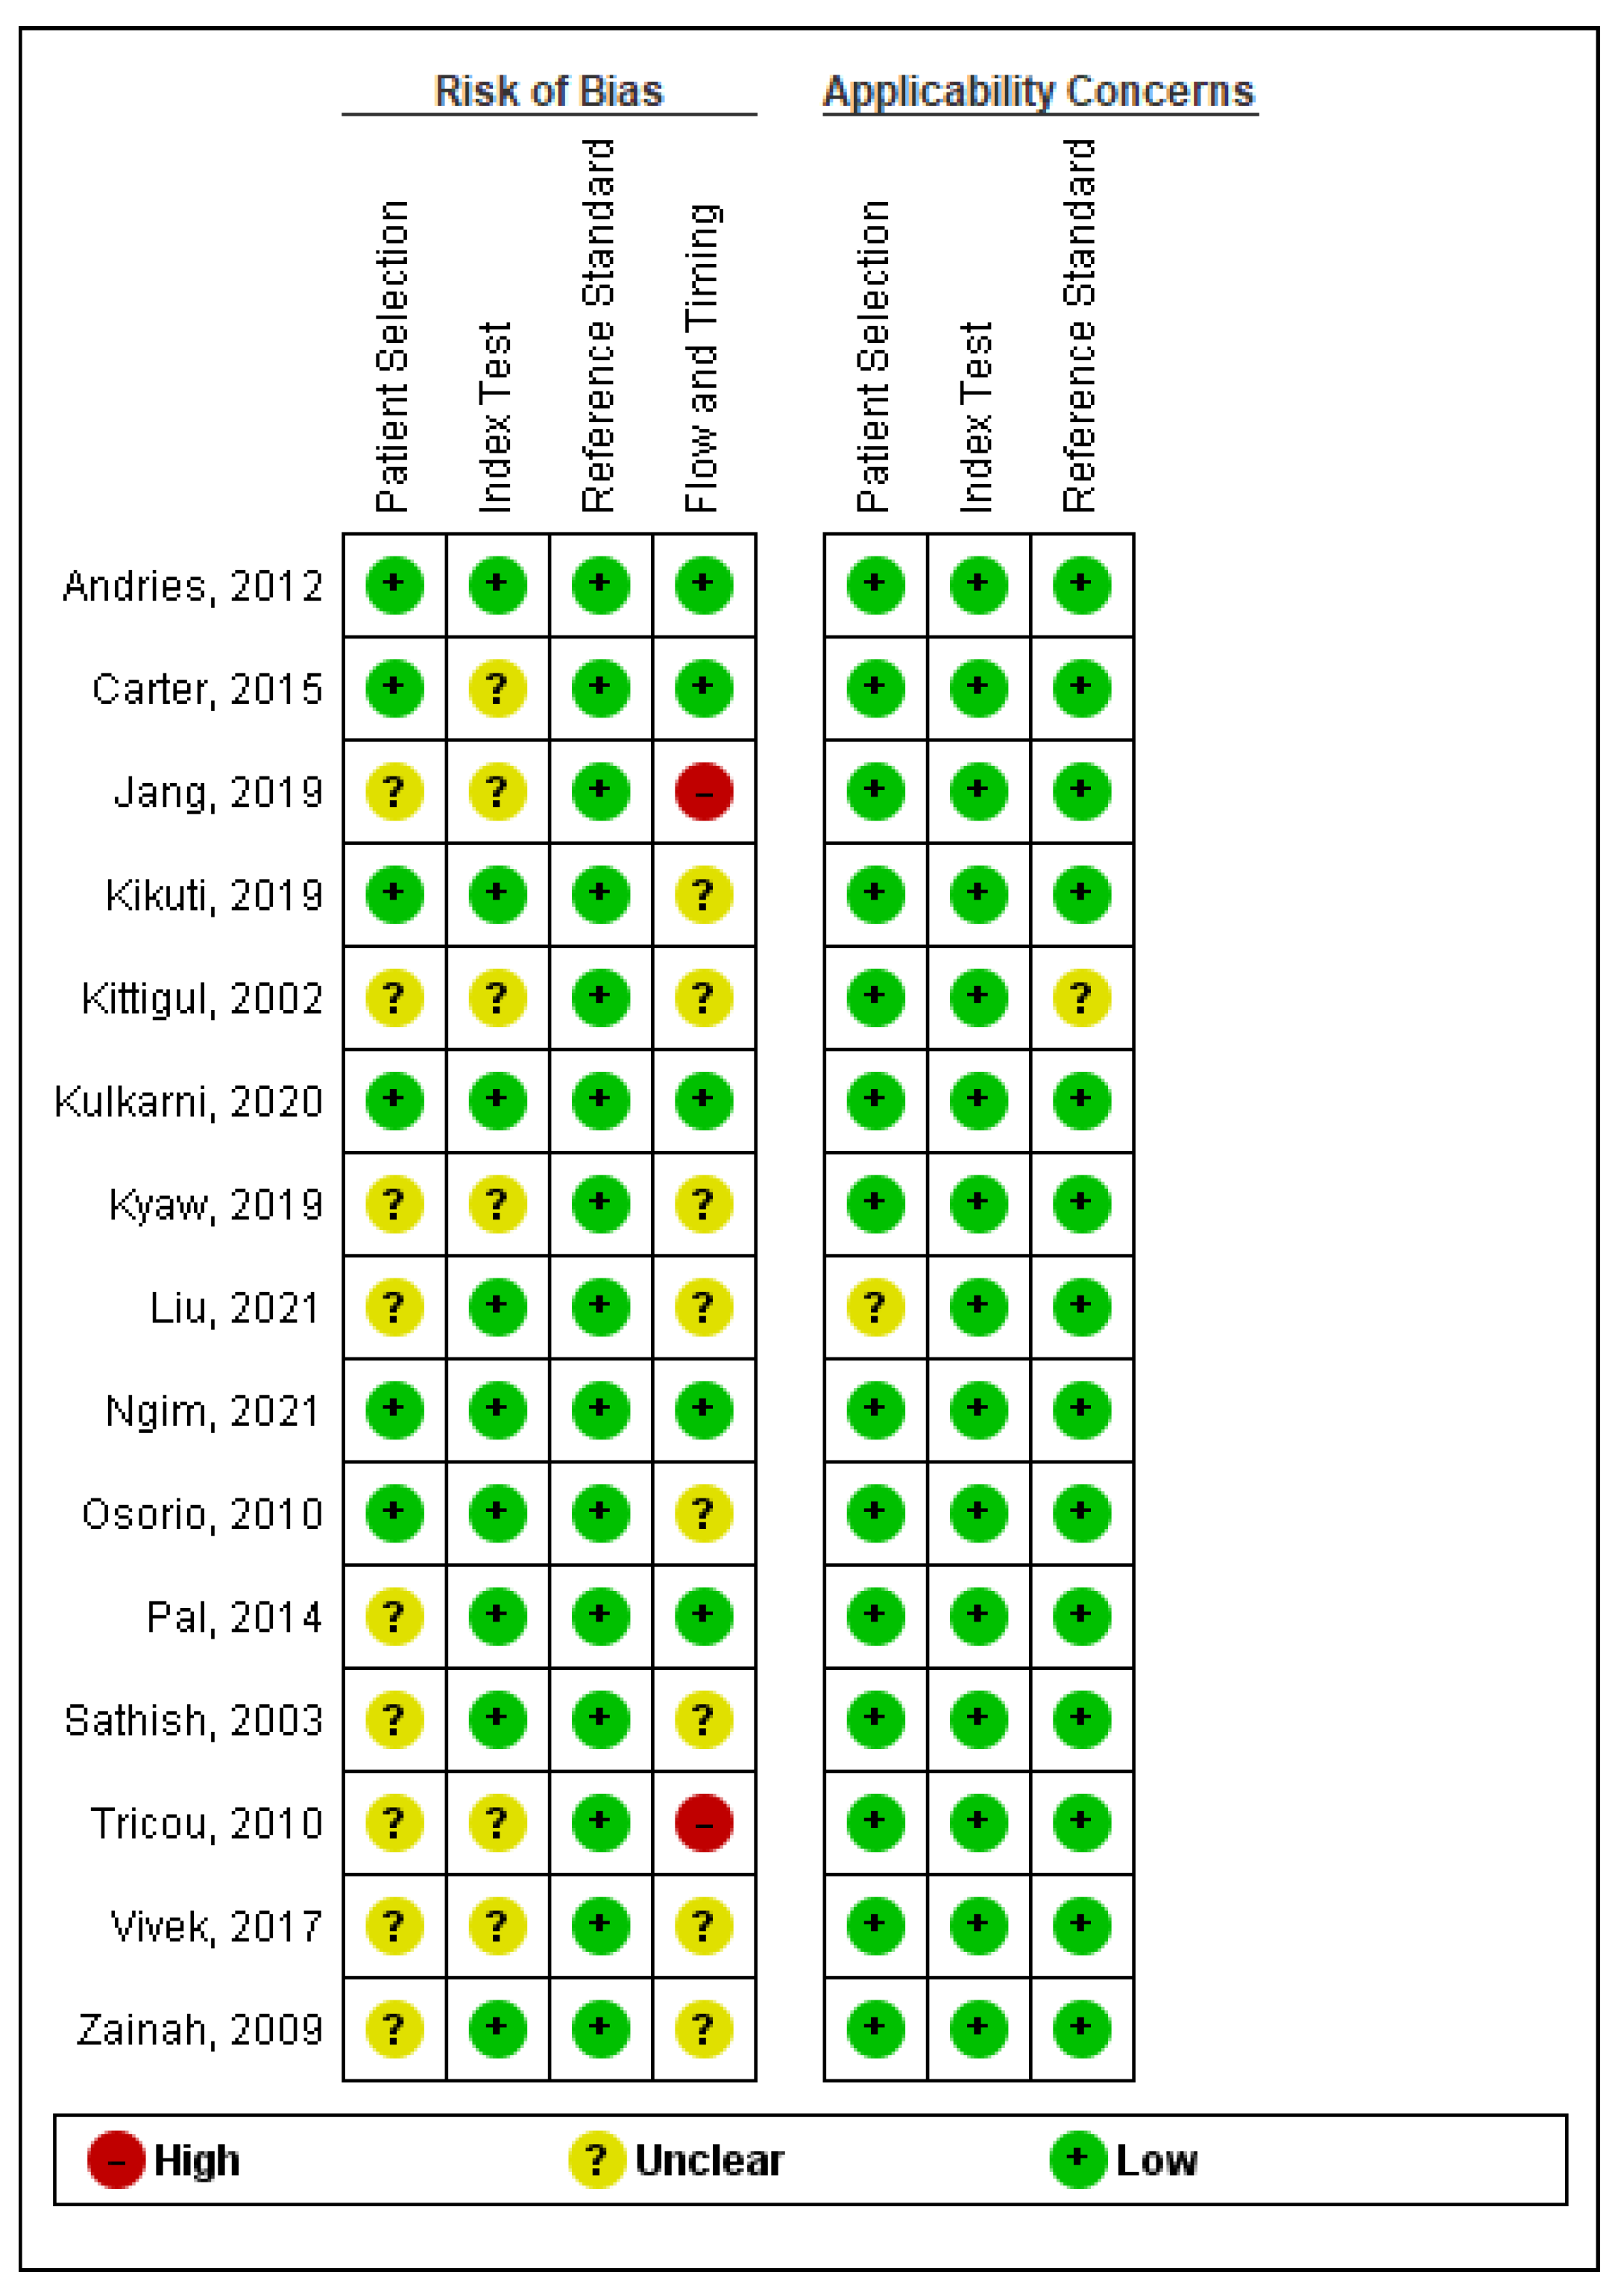
3.1. Quality of Included Studies
3.2. Narrative Review of Included Studies
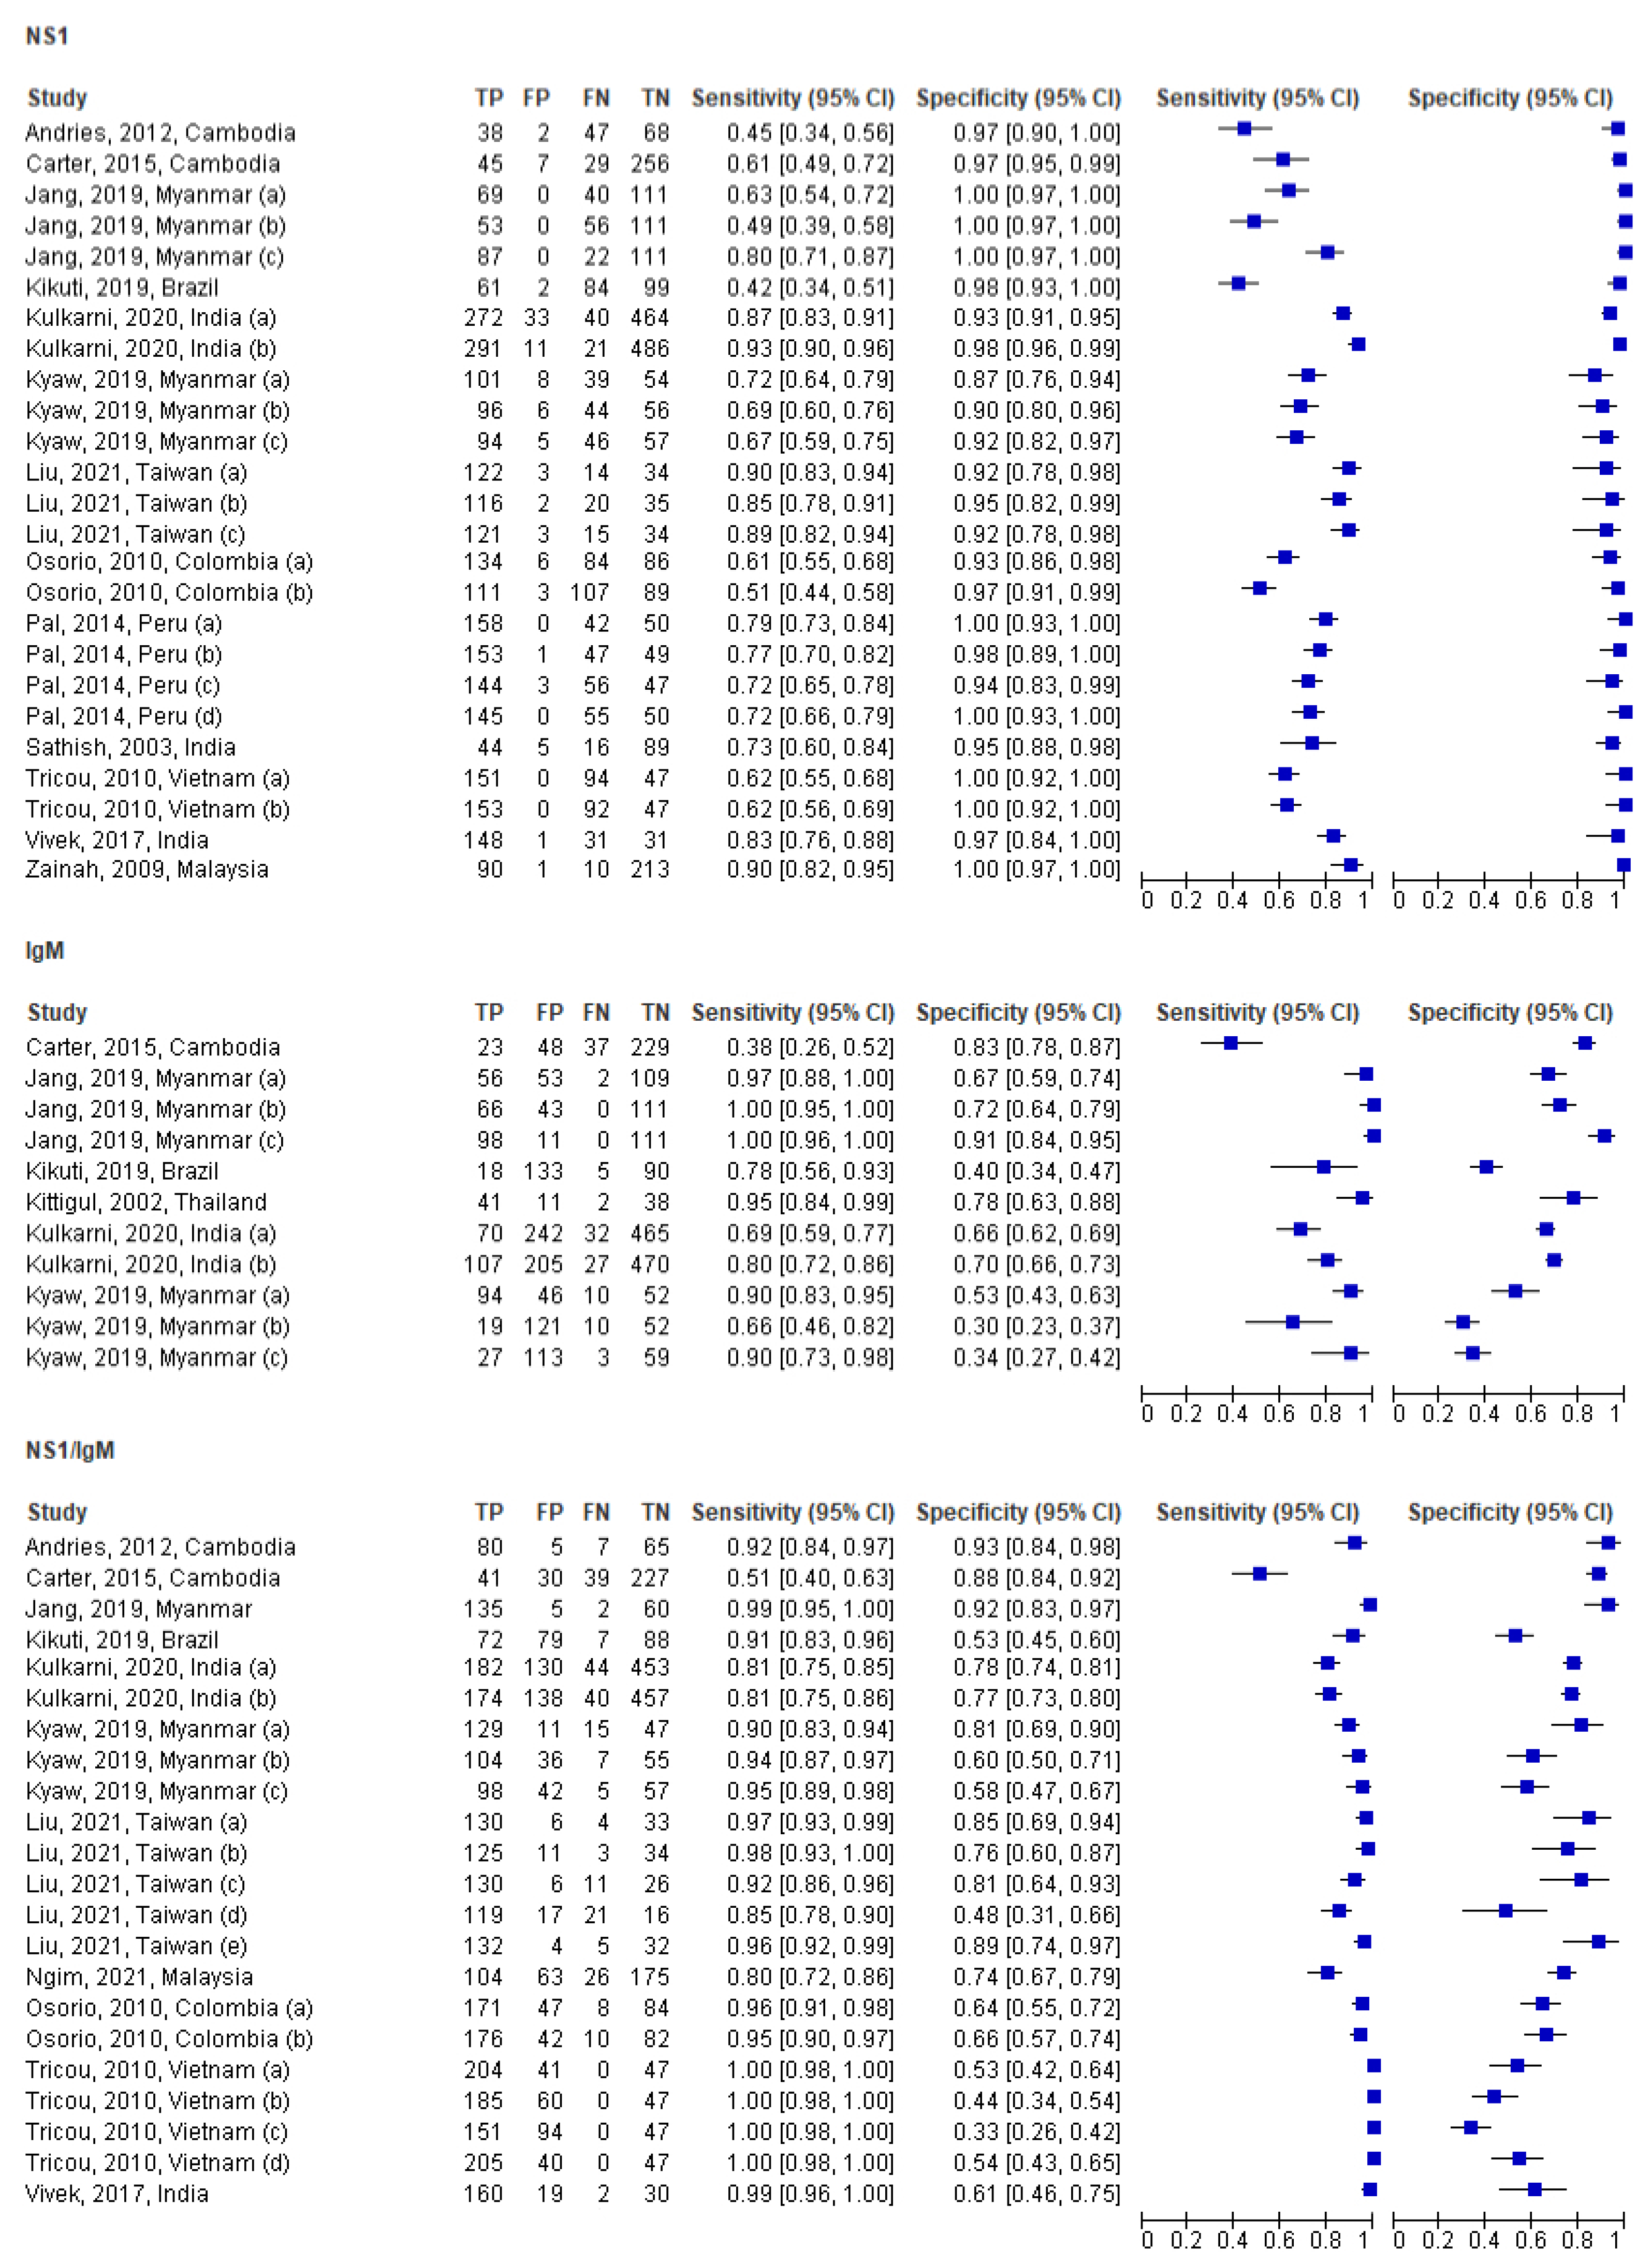
3.3. Individual and Pooled Study Diagnostic Accuracy Results
3.4. Subgroup Analysis by NS1 (Only) in the Acute Phase
3.5. Subgroup Analysis by IgM (Only) in the Acute Phase
3.6. Subgroup Analysis by NS1/IgM in the Acute Phase

| No | Author, Year, Country (ref) | Region | Cohort Size | Prevalence (as Confirmed by Reference Method) | Reference Method | Sample Type | ICT Manufacturer | SN% (95% CI) | SP% (95% CI) | TP, FN, FP, TN | PPV (95% CI) | NPV (95% CI) | Positive Likelihood Ratio (+LR) (95% CI) | Negative Likelihood Ratio (−LR) (95% CI) | Fisher Exact p–Value |
|---|---|---|---|---|---|---|---|---|---|---|---|---|---|---|---|
| 1 | Kikuti, 2019, Brazil [25] | Americas | 246 | 61.40% | NS1-ELISA, IgM-ELISA seroconversion (Abbott, Santa Clara, CA, USA; former Panbio Diagnostics, Brisbane, Australia), and/or RT-PCR | Acute serum | SD BIOLINE Dengue Duo RDT (Abbott, Santa Clara, CA, USA; former Alere Inc, Waltham, MA, USA) | NS1: 41.8% (35.1–48.7) | NS1: 98.0% (92.2–99.8) | 61, 84, 2, 99 | 0.968 (0.886–0.994) | 0.539 (0.511–0.548) | 20.9 (5.409–121.666) | 0.594 (0.573–0.664) | <0.0001 * |
| 2a | Osorio, 2010, Colombia [26] | Americas | 310 | 70.30% | RT-PCR, viral isolation and/or IgM seroconversion | Acute serum | Dengue NS1 Ag STRIP™ (Biorad Laboratories, Marnes–La–Coquette, France) | NS1: STRIP™ 61.5% (51.5–70.9) | NS1: STRIP™ 93.3% (84.2–99.4) | 134, 84, 6, 86 | 0.956 (0.911–0.981) | 0.506 (0.468–0.527) | 9.179 (4.298–22.199) | 0.413 (0.38–0.48) | <0.0001 * |
| 2b | Osorio, 2010, Colombia [26] | Americas | 310 | 70.30% | RT-PCR, viral isolation and/or IgM seroconversion | Acute serum | SD BIOLINE Dengue DUO® (Standard Diagnostic Inc., Seoul, Korea) | SD Bioline™ 51.0% (44.1–57.7) | SD Bioline™ 96.7% (90.8–99.3) | 111, 107, 3, 89 | 0.973 (0.924–0.993) | 0.455 (0.426–0.466) | 15.455 (5.139–59.676) | 0.507 (0.484–0.57) | <0.0001 * |
| 3a | Pal, 2014, Peru [27] | Americas | 250 | 80% | RT-PCR and/or viral isolation followed by indirect immunofluorescence assay (IFA) | Acute serum | Dengue NS1 Ag STRIP® (Bio–Rad, Marnes–La–Coquette, France) | NS1: Bio–Rad 79.1% (71.8–85.2) | NS1: Bio–Rad 100% (91.1–100.0) | 158, 42, 0, 50 | 1 (0.974–1) | 0.545 (0.5–0.545) | NE | 0.209 (0.209–0.25) | <0.0001 * |
| 3b | Pal, 2014, Peru [27] | Americas | 250 | 80% | RT-PCR and/or viral isolation followed by indirect immunofluorescence assay (IFA) | Acute serum | Dengue NS1 Detect Rapid Test (1st generation) (InBios International, Seattle, WA, USA) | NS1: InBios 76.5% (64.6–85.9) | NS1: InBios 97.3% (86.2–99.9) | 153, 47, 1, 49 | 0.991 (0.96–0.999) | 0.509 (0.459–0.521) | 28.333 (6.077–287.218) | 0.242 (0.23–0.295) | <0.0001 * |
| 3c | Pal, 2014, Peru [27] | Americas | 250 | 80% | RT-PCR and/or viral isolation followed by indirect immunofluorescence assay (IFA) | Acute serum | Panbio Dengue Early Rapid | Panbio 71.9% (64.1–78.9) | Panbio 95.0% (83.1–99.4) | 144, 56, 3, 47 | 0.983 (0.948–0.996) | 0.458 (0.408–0.477) | 14.38 (4.533–65.496) | 0.296 (0.274–0.362) | <0.0001 * |
| 3d | Pal, 2014, Peru [27] | Americas | 250 | 80% | RT-PCR and/or viral isolation followed by indirect immunofluorescence assay (IFA) | Acute serum | SD Bioline Dengue NS1 Ag Rapid Test (Alere, Waltham, MA, USA) | SD 72.4% (64.5–79.3) | SD 100% (91.1–100) | 145, 55, 0, 50 | 1 (0.971–1) | 0.475 (0.436–0.475) | NE | 0.276 (0.276–0.324) | <0.0001 * |
| 4 | Carter, 2015, Cambodia [28] | Asia | 337 | 22.10% | Panbio Dengue IgM Combo ELISA (Panbio, Australia; Cat. # E-JED01C; Lot # 110061 | Acute serum | SD BIOLINE Dengue DUO® (Standard Diagnostic Inc., Seoul, Korea) | NS1: 60.8% (46.1–74.2) | NS1: 97.5% (94.9–99) | 45, 29, 7, 256 | 0.873 (0.762–0.943) | 0.898 (0.877–0.91) | 24.32 (11.31–58.087) | 0.402 (0.348–0.492) | <0.0001 * |
| 5 | Andries, 2012, Cambodia [29] | Asia | 157 | 54.10% | NS1 capture ELISA, MAC-ELISA for IgM, indirect ELISA for IgG | Acute serum | SD BIOLINE Dengue DUO® (Standard Diagnostic Inc., Seoul, Korea | NS1: 45.2% (36.4–54.3) | NS1: 96.8% (83.3–99.9) | 38, 47, 2, 68 | 0.943 (0.825–0.988) | 0.6 (0.558–0.616) | 14.125 (3.989–71.882) | 0.566 (0.53–0.671) | <0.0001 * |
| 6a | Kulkarni, 2020, India [30] | Asia | 809 | 38.60% | Panbio ELISA | Acute serum | J. Mitra Dengue Day 1 Test | NS1: J. Mitra–87.3 (82.2–92.5) | NS1: J. Mitra–93.4 (91.5–95.3) | 272, 40, 33, 464 | 0.893 (0.862–0.917) | 0.921 (0.903–0.936) | 13.227 (9.968–17.687) | 0.136 (0.108–0.171) | <0.0001 * |
| 6b | Kulkarni, 2020, India [30] | Asia | 809 | 38.60% | Panbio ELISA | Acute serum | SD–BIOLINE–Dengue–Duo (SDB–RDT) | SD–93.1 (88.2–98.0) | SD–97.8 (96.1–99.5) | 291, 21, 11, 486 | 0.964 (0.941–0.979) | 0.958 (0.944–0.967) | 42.318 (25.505–74.766) | 0.071 (0.055–0.094) | <0.0001 * |
| 7 | Vivek, 2017, India [31] | Asia | 211 | 84.80% | RT-PCR | Acute serum | Dengue Day 1 Test (J. Mitra & Co) | NS1: 82.7% (76.3–87.9) | NS1: 96.9% (83.8–99.9) | 148, 31, 1, 31 | 0.993 (0.964–1) | 0.501 (0.431–0.516) | 26.677 (4.823–520.66) | 0.179 (0.168–0.237) | <0.0001 * |
| 8 | Sathish, 2003, India [32] | Asia | 154 | 38.90% | NIV capture ELISA (MACELISA) | Acute serum | Panbio Rapid Immuochromatographic Card Test (Brisbane, Australia) | NS1: 73% (65–80) | NS1: 95% (90–98) | 44, 16, 5, 89 | 0.903 (0.799–0.963) | 0.847 (0.799–0.874) | 14.6 (6.249–40.726) | 0.284 (0.226–0.395) | <0.0001 * |
| 9 | Zainah, 2009, Malaysia [34] | Asia | 314 | 31.80% | NS1 antigen-capture ELISA or RT-PCR | Acute serum | DENGUE NS1 Ag STRIP (Bio–Rad, Marnes–La–Coquette, France) | NS1: 90.4% | NS1: 99.5% | 90, 10, 1, 213 | 0.988 (0.942–0.999) | 0.957 (0.938–0.961) | 180.8 (34.896–2934.041) | 0.096 (0.086–0.142) | <0.0001 * |
| 10a | Kyaw, 2019, Myanmar [35] | Asia | 202 | 69.30% | DENV specific IgM capture ELISA or DENV RNA isolation | Acute serum | CareUs Dengue Combo, Korea | NS1: CareUs 72.1% (63.9–79.4) | NS1: CareUs 87.1% (76.1–94.3) | 101, 39, 8.54 | 0.927 (0.871–0.964) | 0.58 (0.515–0.624) | 5.589 (2.992–11.727) | 0.32 (0.267–0.417) | <0.0001 * |
| 10b | Kyaw, 2019, Myanmar [35] | Asia | 202 | 69.30% | DENV-specific IgM capture ELISA or DENV RNA isolation | Acute serum | Humasis Dengue Combo, Korea | NS1: Humasis 68.6% (60.2–76.1) | NS1: Humasis 90.3% (80.1–96.4) | 96, 44, 6, 56 | 0.941 (0.884–0.975) | 0.56 (0.502–0.595) | 7.072 (3.376–17.18) | 0.348 (0.302–0.439) | <0.0001 * |
| 10c | Kyaw, 2019, Myanmar [35] | Asia | 202 | 69.30% | DENV-specific IgM capture ELISA or DENV RNA isolation | Acute serum | Wondfo Dengue Combo, China | NS1: Wondfo 67.1% (58.7–74.8) | NS1: Wondfo 91.9% (82.2–97.3) | 94, 46, 5, 57 | 0.949 (0.892–0.981) | 0.553 (0.498–0.583) | 8.284 (3.656–22.319) | 0.358 (0.317–0.447) | <0.0001 * |
| 11a | Jang, 2019, Myanmar [36] | Asia | 220 | 49.50% | IgM/IgG ELISAs or qRT-PCR | Acute serum | Humasis Dengue Combo NS1, IgG/IgM (Humasis, Gyeonggi-do, Korea) | NS1: Humasis 63.3% (53.5–72.3) | NS1: 100% | 69, 40, 0, 111 | 1 (0.94–1) | 0.735 (0.708–0.735) | NE | 0.367 (0.367–0.421) | <0.0001 * |
| 11b | Jang, 2019, Myanmar [36] | Asia | 220 | 49.50% | IgM/IgG ELISAs or qRT-PCR | Acute serum | SD Bioline Dengue Duo NS1 Ag and IgG/IgM (SD Bioline, Korea) | NS1: SD Bioline 48.6% (38.9–58.4) | NS1: 100% | 53, 56, 0, 111 | 1 (0.921–1) | 0.665 (0.64–0.665) | NE | 0.514 (0.514–0.574) | <0.0001 * |
| 11c | Jang, 2019, Myanmar [36] | Asia | 220 | 49.50% | IgM/IgG ELISAs or qRT-PCR | Acute serum | CareUS Dengue Combo NS1 and IgM/IgG kits (WellsBio, Suwon, Korea) | NS1: CareUs 79.8% (71.1–86.9) | NS1: 100% | 87, 22, 0, 111 | 1 (0.954–1) | 0.835 (0.804–0.835) | NE | 0.202 (0.202–0.248) | <0.0001 * |
| 12a | Liu, 2021, Taiwan [37] | Asia | 173 | 78.60% | qRT-PCR | Acute serum | Dengue NS1 Ag Strip (Bio–Rad, France) | NS1: SD 89.7% | NS1: SD 91.9% | 122, 14, 3, 34 | 0.976 (0.939–0.993) | 0.708 (0.612–0.754) | 11.074 (4.201–41.603) | 0.112 (0.089–0.172) | <0.0001 * |
| 12b | Liu, 2021, Taiwan [37] | Asia | 173 | 78.60% | qRT-PCR | Acute serum | Dengue Ag Rapid Test–Cassette (CTK Biotech, Inc., Powey, CA, USA) | NS1: Bio–Rad 85.3% | NS1: Bio–Rad 94.6% | 116, 20, 2, 35 | 0.983 (0.945–0.997) | 0.637 (0.554–0.667) | 15.796 (4.641–90.748) | 0.155 (0.136–0.219) | <0.0001 * |
| 12c | Liu, 2021, Taiwan [37] | Asia | 173 | 78.60% | qRT-PCR | Acute serum | SD Dengue Duo (Standard Diagnostics, Inc., Seoul, Korea) | NS1: CTK 89% | NS1: CTK 73% | 121, 15, 3, 34 | 0.979 (0.942–0.995) | 0.697 (0.605–0.737) | 12.714 (4.434–54.867) | 0.118 (0.097–0.178) | <0.0001 * |
| 13a | Tricou, 2010, Vietnam [39] | Asia | 292 | 83.90% | RT-PCR | Acute serum | Bio-Rad NS1 Ag Strip | NS1 Bio–Rad: 61.6 (55.2–67.8) | 100% | 151, 94, 0, 47 | 1 (0.972–1) | 0.333 (0.303–0.333) | NE | 0.384 (0.384–0.441) | <0.0001 * |
| 13b | Tricou, 2010, Vietnam [39] | Asia | 292 | 83.90% | RT-PCR | Acute serum | SD Dengue Duo (NS1/IgM/IgG) lateral flow rapid tests | NS1 SD: 62.4 (56.1–68.5) | 100% | 153, 92, 0, 47 | 1 (0.972–1) | 0.338 (0.308–0.338) | NE | 0.376 (0.376–0.432) | <0.0001 * |
| No | Author, Year, Country (Ref) | Region | Cohort Size | Prevalence (as Confirmed by Reference Method) | Reference Method | Sample Type | ICT Manufacturer | SN% (95% CI) | SP% (95% CI) | TP, FN, FP, TN | PPV (95% CI) | NPV (95% CI) | Positive Likelihood Ratio (+LR) (95% CI) | Negative Likelihood Ratio (−LR) (95% CI) | Fisher Exact p–Value |
|---|---|---|---|---|---|---|---|---|---|---|---|---|---|---|---|
| 1 | Kikuti, 2019, Brazil [25] | Americas | 246 | 61.40% | NS1-ELISA, IgM-ELISA seroconversion (Abbott, Santa Clara, CA, USA; former Panbio Diagnostics, Brisbane, Australia), and/or RT-PCR | Acute serum | SD BIOLINE Dengue Duo RDT (Abbott, Santa Clara, CA, USA; former Alere Inc, Waltham, MA, USA) | IgM: 11.7% (7.7–16.8) | IgM: 94.6% (87.5–98.3) | 18, 133, 5, 90 | 0.775 (0.559–0.912) | 0.402 (0.38–0.416) | 2.167 (0.798–6.484) | 0.933 (0.881–1.024) | 0.105 |
| 2 | Carter, 2015, Cambodia [28] | Asia | 337 | 22.10% | Panbio Dengue IgM Combo ELISA (Panbio, Australia; Cat. # E-JED01C; Lot # 110061 | Acute serum | SD BIOLINE Dengue DUO® (Standard Diagnostic Inc., Seoul, Korea) | IgM: 32.7% (20.0–47.5) | IgM: 86.2% (81.5–90.0) | 23, 48, 37, 229 | 0.387 (0.279–0.502) | 0.828 (0.804–0.852) | 2.37 (1.447–3.771) | 0.781 (0.65–0.913) | <0.0001 * |
| 3a | Kulkarni, 2020, India [30] | Asia | 809 | 38.60% | Panbio ELISA | Acute serum | J. Mitra Dengue Day 1 Test | IgM: J. Mitra–22.5 (17.1–27.9) | IgM: J. Mitra–93.6 (91.6–95.6) | 70, 242, 32, 465 | 0.688 (0.595–0.77) | 0.658 (0.644–0.67) | 3.516 (2.335–5.344) | 0.828 (0.785–0.879) | <0.0001 * |
| 3b | Kulkarni, 2020, India [30] | Asia | 809 | 38.60% | Panbio ELISA | Acute serum | SD-BIOLINE-Dengue-Duo (SDB-RDT) | SD–34.4 (27.7–41.1) | SD 94.5 (91.2–97.8) | 107, 205, 27, 470 | 0.797 (0.724–0.857) | 0.696 (0.682–0.708) | 6.255 (4.177–9.522) | 0.694 (0.656–0.743) | <0.0001 * |
| 4a | Kyaw, 2019, Myanmar [35] | Asia | 202 | 69.30% | DENV specific IgM capture ELISA or DENV RNA isolation | Acute serum | CareUs Dengue Combo, Korea | IgM: CareUs 67.1% (58.7–74.8) | IgM: CareUs 83.9% (72.3–92.0) | 94, 46, 10, 52 | 0.904 (0.843–0.948) | 0.53 (0.466–0.577) | 4.168 (2.382–8.01) | 0.392 (0.325–0.507) | <0.0001 * |
| 4b | Kyaw, 2019, Myanmar [35] | Asia | 202 | 69.30% | DENV-specific IgM capture ELISA or DENV RNA isolation | Acute serum | Humasis Dengue Combo, Korea | IgM: Humasis 13.6% (8.4–20.4) | IgM: Humasis 83.9% (72.3–92.0) | 19, 121, 10, 52 | 0.656 (0.474–0.809) | 0.301 (0.27–0.326) | 0.845 (0.399–1.871) | 1.03 (0.914–1.196) | 0.658 |
| 4c | Kyaw, 2019, Myanmar [35] | Asia | 202 | 69.30% | DENV-specific IgM capture ELISA or DENV RNA isolation | Acute serum | Wondfo Dengue Combo, China | IgM: Wondfo 19.3% (13.1–26.8) | IgM: Wondfo 95.2% (86.5–98.9) | 27, 113, 3, 59 | 0.901 (0.738–0.974) | 0.343 (0.315–0.356) | 4.021 (1.246–16.543) | 0.848 (0.801–0.964) | 0.006 * |
| 5a | Jang, 2019, Myanmar [36] | Asia | 220 | 49.50% | IgM/IgG ELISAs or qRT-PCR | Acute serum | Humasis Dengue Combo NS1, IgG/IgM (Humasis, Gyeonggi-do, Korea) | IgM: Humasis 51.4% (41.6–61.1) | IgM: Humasis 98.2 (91.5–99.9) | 56, 53, 2, 109 | 0.966 (0.879–0.994) | 0.673 (0.642–0.683) | 28.556 (7.419–168.217) | 0.495 (0.472–0.568) | <0.0001 * |
| 5b | Jang, 2019, Myanmar [36] | Asia | 220 | 49.50% | IgM/IgG ELISAs or qRT-PCR | Acute serum | SD Bioline Dengue Duo NS1 Ag and IgG/IgM (SD Bioline, Korea) | IgM: SD Bioline 60.6% (50.7–69.8) | IgM: SD Bioline: 100% | 66, 43, 0, 111 | 1 (0.937–1) | 0.721 (0.694–0.721) | NE | 0.394 (0.394–0.449) | <0.0001 * |
| 5c | Jang, 2019, Myanmar [36] | Asia | 220 | 49.50% | IgM/IgG ELISAs or qRT-PCR | Acute serum | CareUS Dengue Combo NS1 and IgM/IgG kits (WellsBio, Suwon, Korea) | IgM: CareUs 89.9% (82.7–94.9) | IgM: CareUs 100% | 98, 11, 0, 111 | 1 (0.961–1) | 0.91 (0.879–0.91) | NE | 0.101 (0.101–0.141) | <0.0001 * |
| 6 | Kittigul, 2002, Thailand [38] | Asia | 92 | 56.50% | 4x increased titers on hemagglutination inhibition test | 1–6 days | Panbio Duo cassette IgM/IgG (Inverness, Australia) | IgM/IgG: 79% | IgM/IgG: 95% | 41, 11, 2, 38 | 0.954 (0.857–0.992) | 0.777 (0.692–0.81) | 15.8 (4.601–91.658) | 0.221 (0.18–0.343) | <0.0001 * |
| No. | Author, Year, Country (Ref) | Region | Cohort Size (N) | Prevalence (as Confirmed by Reference Method) | Reference Method | Days Post Fever Onset | ICT Manufacturer | SN% (95% CI) | SP% (95% CI) | TP, FN, FP, TN | PPV (95% CI) | NPV (95% CI) | Positive Likelihood Ratio (+LR) (95% CI) | Negative Likelihood Ratio (−LR) (95% CI) | Fisher Exact p–Value |
|---|---|---|---|---|---|---|---|---|---|---|---|---|---|---|---|
| 1 | Kikuti, 2019, Brazil [25] | Americas | 246 | 61.40% | NS1-ELISA, IgM-ELISA seroconversion (Abbott, Santa Clara, CA, USA; former Panbio Diagnostics, Brisbane, Australia), and/or RT–PCR | 1–4 days | SD BIOLINE Dengue Duo RDT (Abbott, Santa Clara, CA, USA; former Alere Inc, Waltham, MA, USA) | NS1/IgM: 47.9% (41.0–54.8) | NS1/IgM: 92.6% (84.9–93.5) | 72, 79, 7, 88 | 0.911 (0.832–0.96) | 0.528 (0.49–0.551) | 6.473 (3.116–19.921) | 0.563 (0.513–0.655) | <0.0001 * |
| 2a | Osorio, 2010, Colombia [26] | Americas | 310 | 70.30% | RT-PCR, viral isolation, and/or IgM seroconversion | 1–7 days | (i) Dengue NS1 Ag STRIP™ (Biorad Laboratories, Marnes–La–Coquette, France), (ii) SD BIOLINE Dengue DUO® (Standard Diagnostic Inc., Korea) | NS1/IgM: SD Bioline™ 78.4% (72.4–83.7) | NS1/IgM: SD Bioline™ 91.3% (83.6–96.2) | 171, 47, 8, 84 | 0.955 (0.919–0.978) | 0.641 (0.591–0.672) | 9.011 (4.784–18.911) | 0.237 (0.206–0.292) | <0.0001 * |
| 2b | Osorio, 2010, Colombia [26] | Americas | 310 | 70.30% | RT–PCR, viral isolation, and/or IgM seroconversion | 1–7 days | (i) Dengue NS1 Ag STRIP™ (Biorad Laboratories, Marnes–La–Coquette, France), (ii) SD BIOLINE Dengue DUO® (Standard Diagnostic Inc., Seoul, Korea) | NS1/IgM/IgG: SD Bioline™ 80.7% (75–85.7) | NS1/IgM/IgG: SD Bioline™ 89.1% (81–94.7) | 176, 42, 10, 82 | 0.946 (0.91–0.971) | 0.661 (0.607–0.698) | 7.404 (4.266–14.041) | 0.217 (0.183–0.274) | <0.0001 * |
| 3 | Carter, 2015, Cambodia [28] | Asia | 337 | 21.10% | Panbio Dengue IgM Combo ELISA (Panbio, Australia; Cat. # E-JED01C; Lot # 110061 | 1–2 days | SD BIOLINE Dengue DUO® (Standard Diagnostic Inc., Seoul, Korea) | NS1/IgM: 57.8% (45.4–69.4) | NS1/IgM: 85.3% (80.3–89.5) | 41, 30, 39, 227 | 0.511 (0.42–0.595) | 0.884 (0.855–0.91) | 3.932 (2.721–5.527) | 0.495 (0.372–0.636) | <0.0001 * |
| 4a | Kulkarni, 2020, India [30] | Asia | 809 | 38.60% | Panbio ELISA | 1–7 days | J. Mitra Dengue Day 1 Test | NS1/IgM: J. Mitra–58.3 (52.9–63.8) | NS1/IgM: J. Mitra–91.1 (88.6–93.6) | 182, 130, 44, 453 | 0.804 (0.755–0.848) | 0.777 (0.757–0.794) | 6.551 (4.899–8.859) | 0.458 (0.414–0.51) | <0.0001 * |
| 4b | Kulkarni, 2020, India [30] | Asia | 809 | 38.60% | Panbio ELISA | 1–7 days | SD–BIOLINE–Dengue–Duo (SDB–RDT) | NS1/IgM: SD–55.7 (49.4–62.0) | NS1/IgM: SD–92.0 (87.5–96.5) | 174, 138, 40, 457 | 0.814 (0.762–0.858) | 0.768 (0.749–0.784) | 6.963 (5.107–9.617) | 0.482 (0.44–0.533) | <0.0001 * |
| 5 | Vivek, 2017, India [31] | Asia | 211 | 84.80% | RT-PCR | 1–5 days | Dengue Day 1 Test (J. Mitra & Co) | NS1/IgM: 89.4% (83.9–93.5) | NS1/IgM: 93.8% (79.2–99.2) | 160, 19, 2, 30 | 0.987 (0.959–0.998) | 0.612 (0.52–0.647) | 13.545 (4.207–72.433) | 0.113 (0.098–0.165) | <0.0001 * |
| 6 | Ngim, 2021, Malaysia [33] | Asia | 368 | 45.40% | ELISA and/or RT-PCR | 1–6 days | Dengue Combo Rapid Test–Cassette (Chembio Diagnostics, Inc., Medford, NY, USA) | NS1/IgM: 62.3% | NS1/IgM: 87.3% | 104, 63, 26, 175 | 0.803 (0.737–0.858) | 0.736 (0.7–0.766) | 4.906 (3.378–7.283) | 0.432 (0.368–0.515) | <0.0001 * |
| 7a | Kyaw, 2019, Myanmar [35] | Asia | 202 | 69.30% | DENV specific IgM capture ELISA or DENV RNA isolation | 1–7 days | CareUs Dengue Combo, Korea | NS1/IgM: CareUs 92.1% (86.4–96.0) | NS1/IgM: CareUs 75.8 (63.3 –85.8) | 129, 11, 15, 47 | 0.896 (0.856–0.926) | 0.809 (0.711–0.883) | 3.806 (2.631–5.505) | 0.104 (0.058–0.18) | <0.0001 * |
| 7b | Kyaw, 2019, Myanmar [35] | Asia | 202 | 69.30% | DENV-specific IgM capture ELISA or DENV RNA isolation | 1–7 days | Humasis Dengue Combo, Korea | NS1/IgM: Humasis 74.3% (66.2–88.2) | NS1/IgM: Humasis 88.7 (78.1– 95.3) | 104, 36, 7, 55 | 0.937 (0.884–0.971) | 0.605 (0.54–0.646) | 6.575 (3.368–14.647) | 0.29 (0.243–0.378) | <0.0001 * |
| 7c | Kyaw, 2019, Myanmar [35] | Asia | 202 | 69.30% | DENV-specific IgM capture ELISA or DENV RNA isolation | 1–7 days | Wondfo Dengue Combo, China | NS1/IgM: Wondfo 70.0% (61.7–77.4) | NS1/IgM: Wondfo 91.9 (82.2 –97.3) | 98, 42, 5, 57 | 0.951 (0.896–0.981) | 0.576 (0.519–0.607) | 8.642 (3.834–23.221) | 0.326 (0.287–0.411) | <0.0001 * |
| 8 | Jang, 2019, Myanmar [36] | Asia | 220 | 49.50% | IgM/IgG ELISAs or qRT-PCR | 3–7 days | CareUS Dengue Combo NS1 and IgM/IgG kits (WellsBio, Suwon, Korea) | NS1/IgM: CareUs 96.3% (90.9–99.0) | NS1/IgM: CareUs 96.3% (90.9–98.9) | 135, 5, 2, 60 | 0.983 (0.953–0.996) | 0.92 (0.856–0.948) | 26.027 (8.976–120.218) | 0.038 (0.024–0.074) | <0.0001 * |
| 9a | Liu, 2021, Taiwan [37] | Asia | 173 | 78.60% | qRT-PCR | 1–5 days | SD Dengue Duo (Standard Diagnostics, Inc., Seoul, Korea) | NS1/IgM: SD 95.6% | NS1/IgM: SD 89.2% | 130, 6, 4, 33 | 0.970 (0.938–0.989) | 0.847 (0.735–0.91) | 8.852 (4.099–23.755) | 0.049 (0.027–0.098) | <0.0001 * |
| 9b | Liu, 2021, Taiwan [37] | Asia | 173 | 78.60% | qRT-PCR | 1–5 days | Dengue NS1 Ag Strip (Bio-Rad, Marnes–La–Coquette, France) | NS1/IgM: Bio–Rad 91.9% | NS1/IgM: Bio–Rad 91.9% | 125, 11, 3, 34 | 0.977 (0.941–0.994) | 0.755 (0.656–0.804) | 11.346 (4.373–42.13) | 0.088 (0.066–0.143) | <0.0001 * |
| 9c | Liu, 2021, Taiwan [37] | Asia | 173 | 78.60% | qRT-PCR | 1–5 days | Dengue Ag Rapid Test-Cassette (CTK Biotech, Inc., San Diego, CA, USA) | NS1/IgM: CTK 95.6% | NS1/IgM: CTK 70.3% | 130, 6, 11, 26 | 0.922 (0.888–0.945) | 0.813 (0.664–0.913) | 3.219 (2.164–4.649) | 0.063 (0.026–0.138) | <0.0001 * |
| 9d | Liu, 2021, Taiwan [37] | Asia | 173 | 78.60% | qRT-PCR | 1–5 days | Dengue Ag Rapid Test-Cassette (CTK Biotech, Inc., San Diego, CA, USA) | NS1/IgM/IgG: CTK 87.8% | NS1/IgM/IgG: CTK 43.2% | 119, 17, 21, 16 | 0.85 (0.814–0.885) | 0.491 (0.336–0.64) | 1.546 (1.193–2.091) | 0.282 (0.153–0.539) | <0.0001 * |
| 9e | Liu, 2021, Taiwan [37] | Asia | 173 | 78.60% | qRT-PCR | 1–5 days | SD Dengue Duo (Standard Diagnostics, Inc., Seoul, Korea) | NS1/IgM/IgG: SD 97.1% | NS1/IgM/IgG: SD 86.5% | 132, 4, 5, 32 | 0.964 (0.993–0.981) | 0.89 (0.772–0.957) | 7.193 (3.765–14.072) | 0.034 (0.012–0.08) | <0.0001 * |
| 10a | Tricou, 2010, Vietnam [39] | Asia | 292 | 83.90% | RT-PCR | 1–7 days | Bio-Rad NS1 Ag Strip | NS1/IgM Bio-Rad: 83.3% (72.1–91.4) | 100% | 204, 41, 0, 47 | 1 (0.98–1) | 0.535 (0.488–0.535) | NE | 0.167 (0.167–0.201) | <0.0001 * |
| 10b | Tricou, 2010, Vietnam [39] | Asia | 292 | 83.90% | RT-PCR | 1–7 days | SD Dengue Duo (NS1/IgM/IgG) lateral flow rapid tests | NS1/IgM SD Duo: 75.5% (69.6–80.8) | 100% | 185, 60, 0, 47 | 1 (0.977–1) | 0.439 (0.4–0.439) | NE | 0.245 (0.245–0.288) | <0.0001 * |
| 10c | Tricou, 2010, Vietnam [39] | Asia | 292 | 83.90% | RT-PCR | 1–7 days | Bio-Rad NS1 Ag Strip | NS1/IgM/IgG Bio-Rad: 61.6%; | 100% | 151, 94, 0, 47 | 1 (0.972–1) | 0.333 (0.303–0.333) | NE | 0.384 (0.384–0.441) | <0.0001 * |
| 10d | Tricou, 2010, Vietnam [39] | Asia | 292 | 83.90% | RT-PCR | 1–7 days | SD Dengue Duo (NS1/IgM/IgG) lateral flow rapid tests | NS1/IgM/IgG SD Duo: 83.7% (78.4–88.1) | 100% | 205, 40, 0, 47 | 1 (0.98–1) | 0.541 (0.493–0.541) | NE | 0.163 (0.163–0.197) | <0.0001 * |
| 11 | Andries, 2012, Cambodia [29] | Asia | 157 | 54.10% | NS1 capture ELISA, MAC-ELISA for IgM, indirect ELISA for IgG | 1–7 days | SD BIOLINE Dengue DUO® (Standard Diagnostic Inc., Seoul, Korea) | NS1/IgM/IgG: 94.4% (88.9–97.7) | NS1/IgM/IgG: 90.0% (73.5–97.9) | 80, 5, 7, 65 | 0.918 (0.864–0.949) | 0.932 (0.864–0.971) | 9.44 (5.39–15.824) | 0.062 (0.025–0.133) | <0.0001 * |
3.7. Subgroup Analysis by ICT Manufacturer
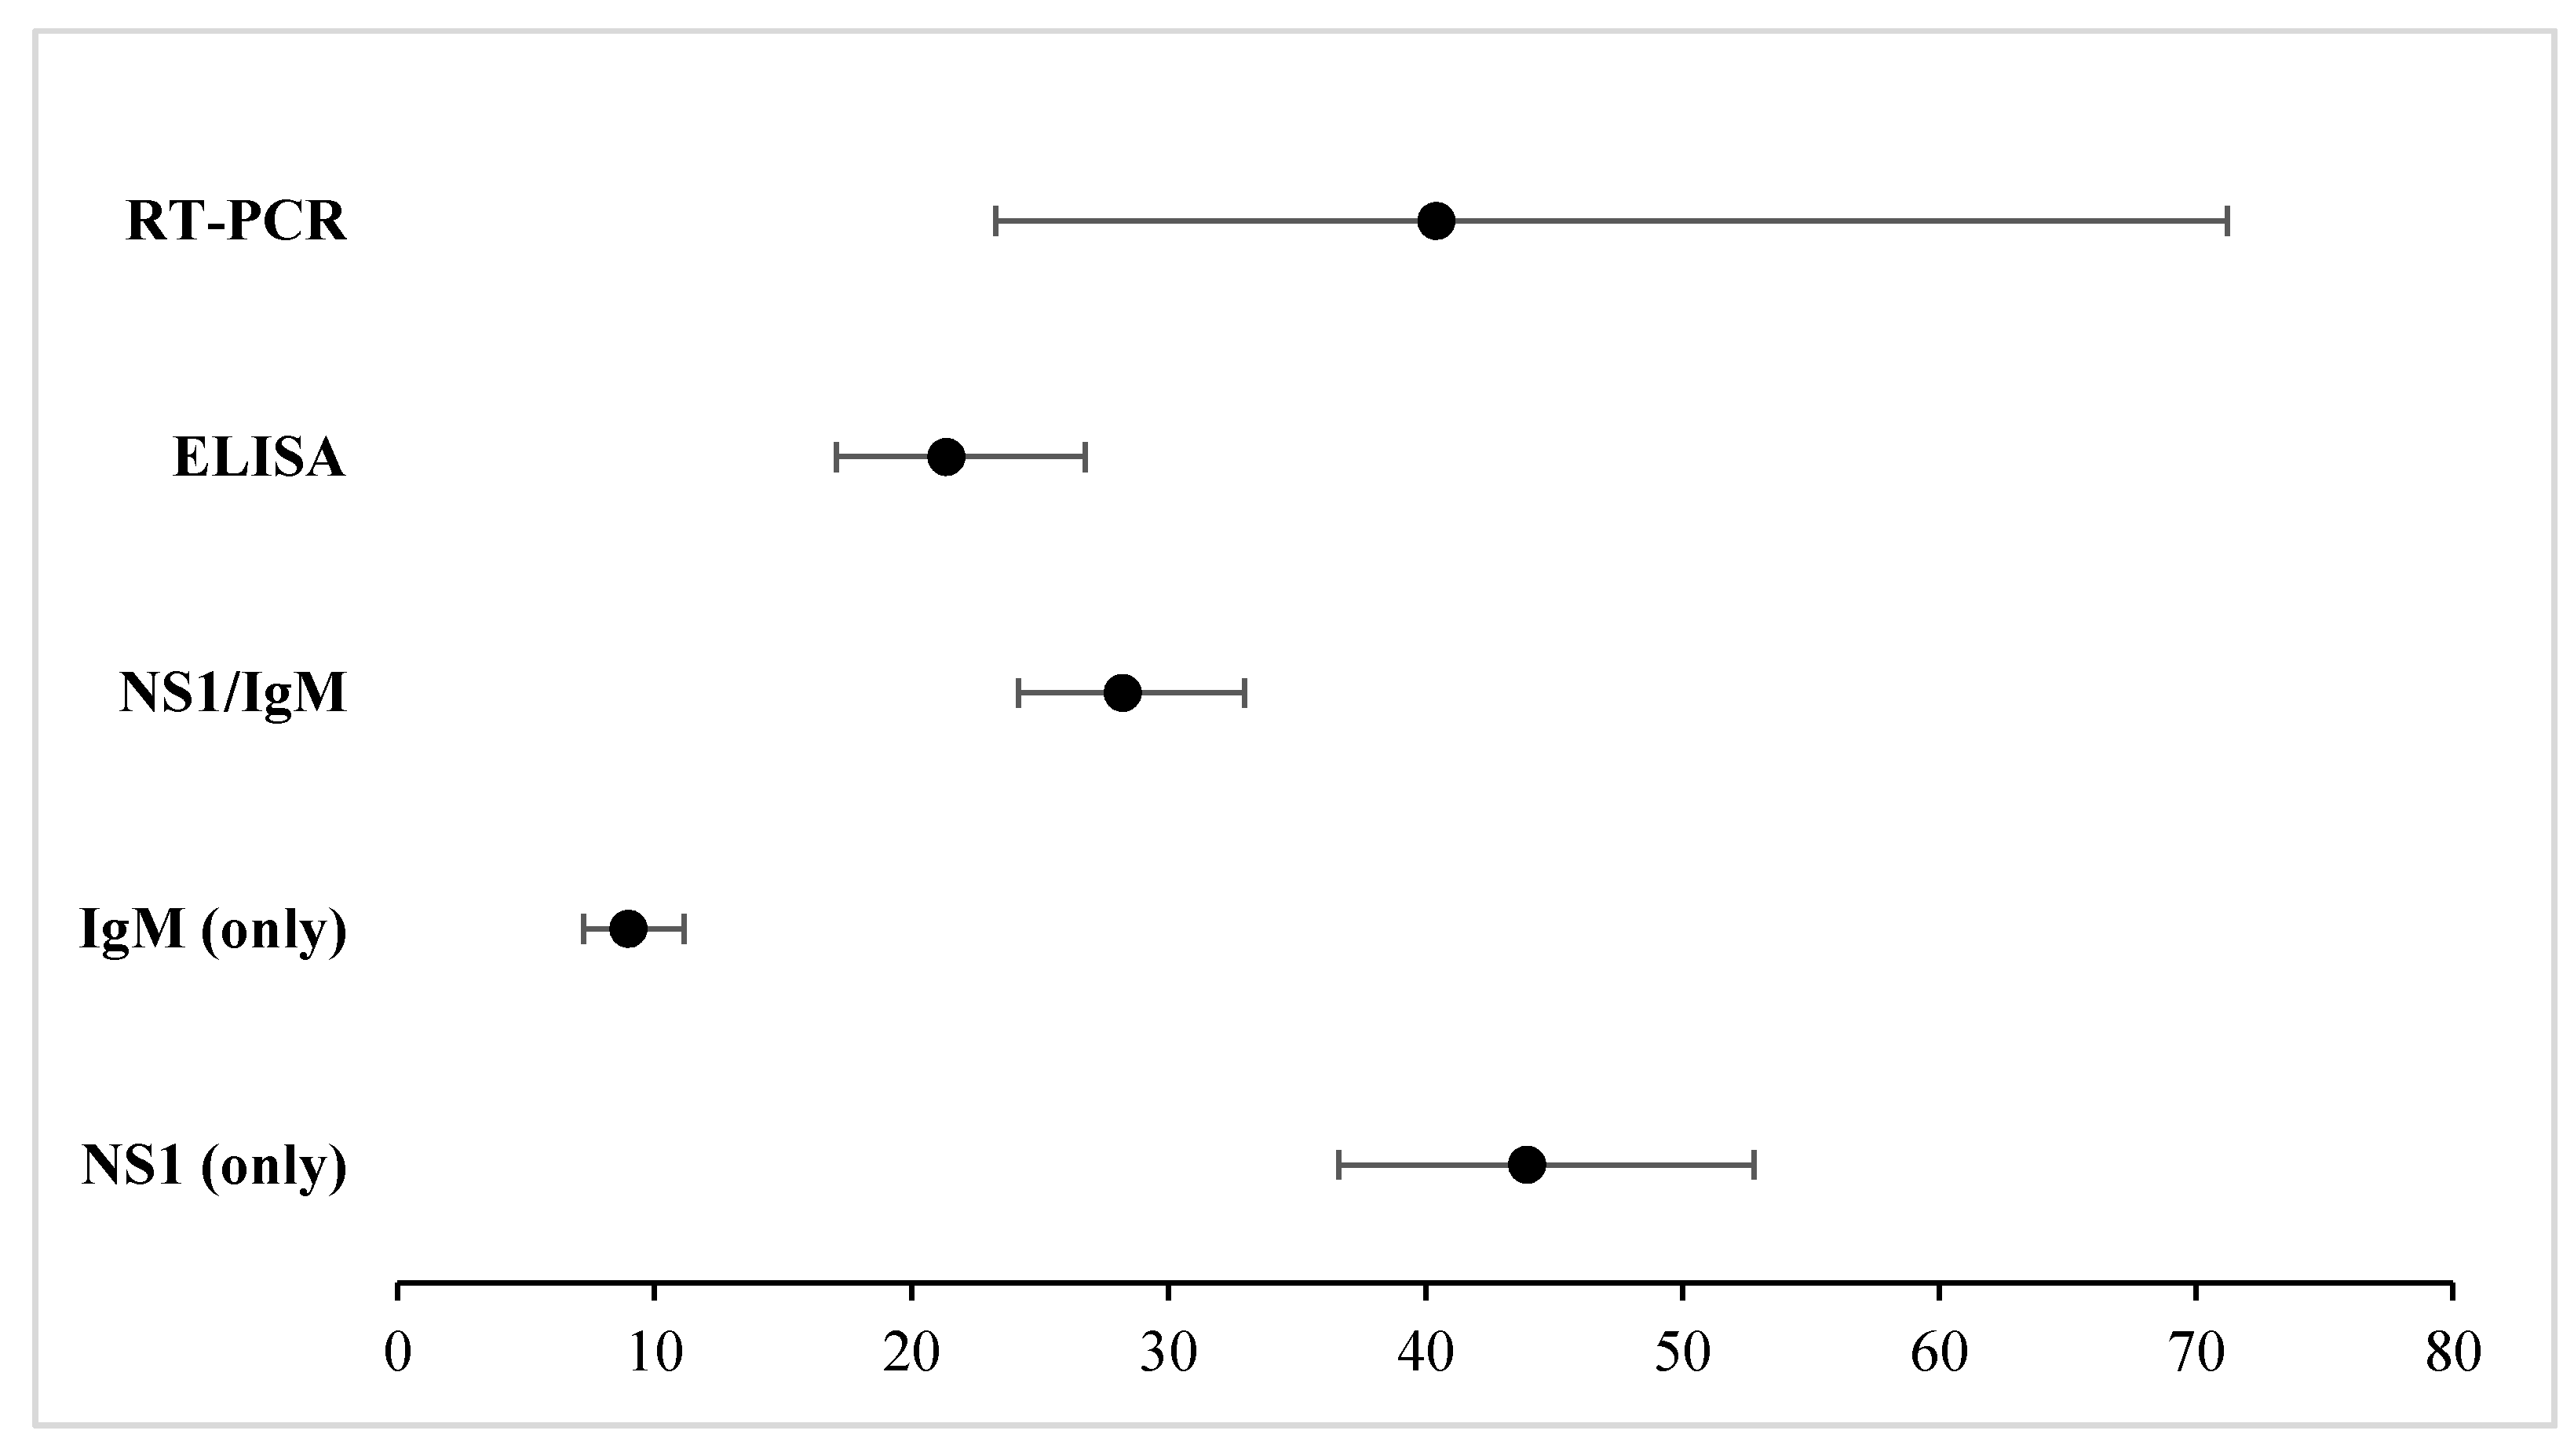
3.8. Diagnostic Accuracy by Reference Assay
3.9. Diagnostic Accuracy by Primary/Secondary Disease
3.10. Identification of Different DENV Serotypes
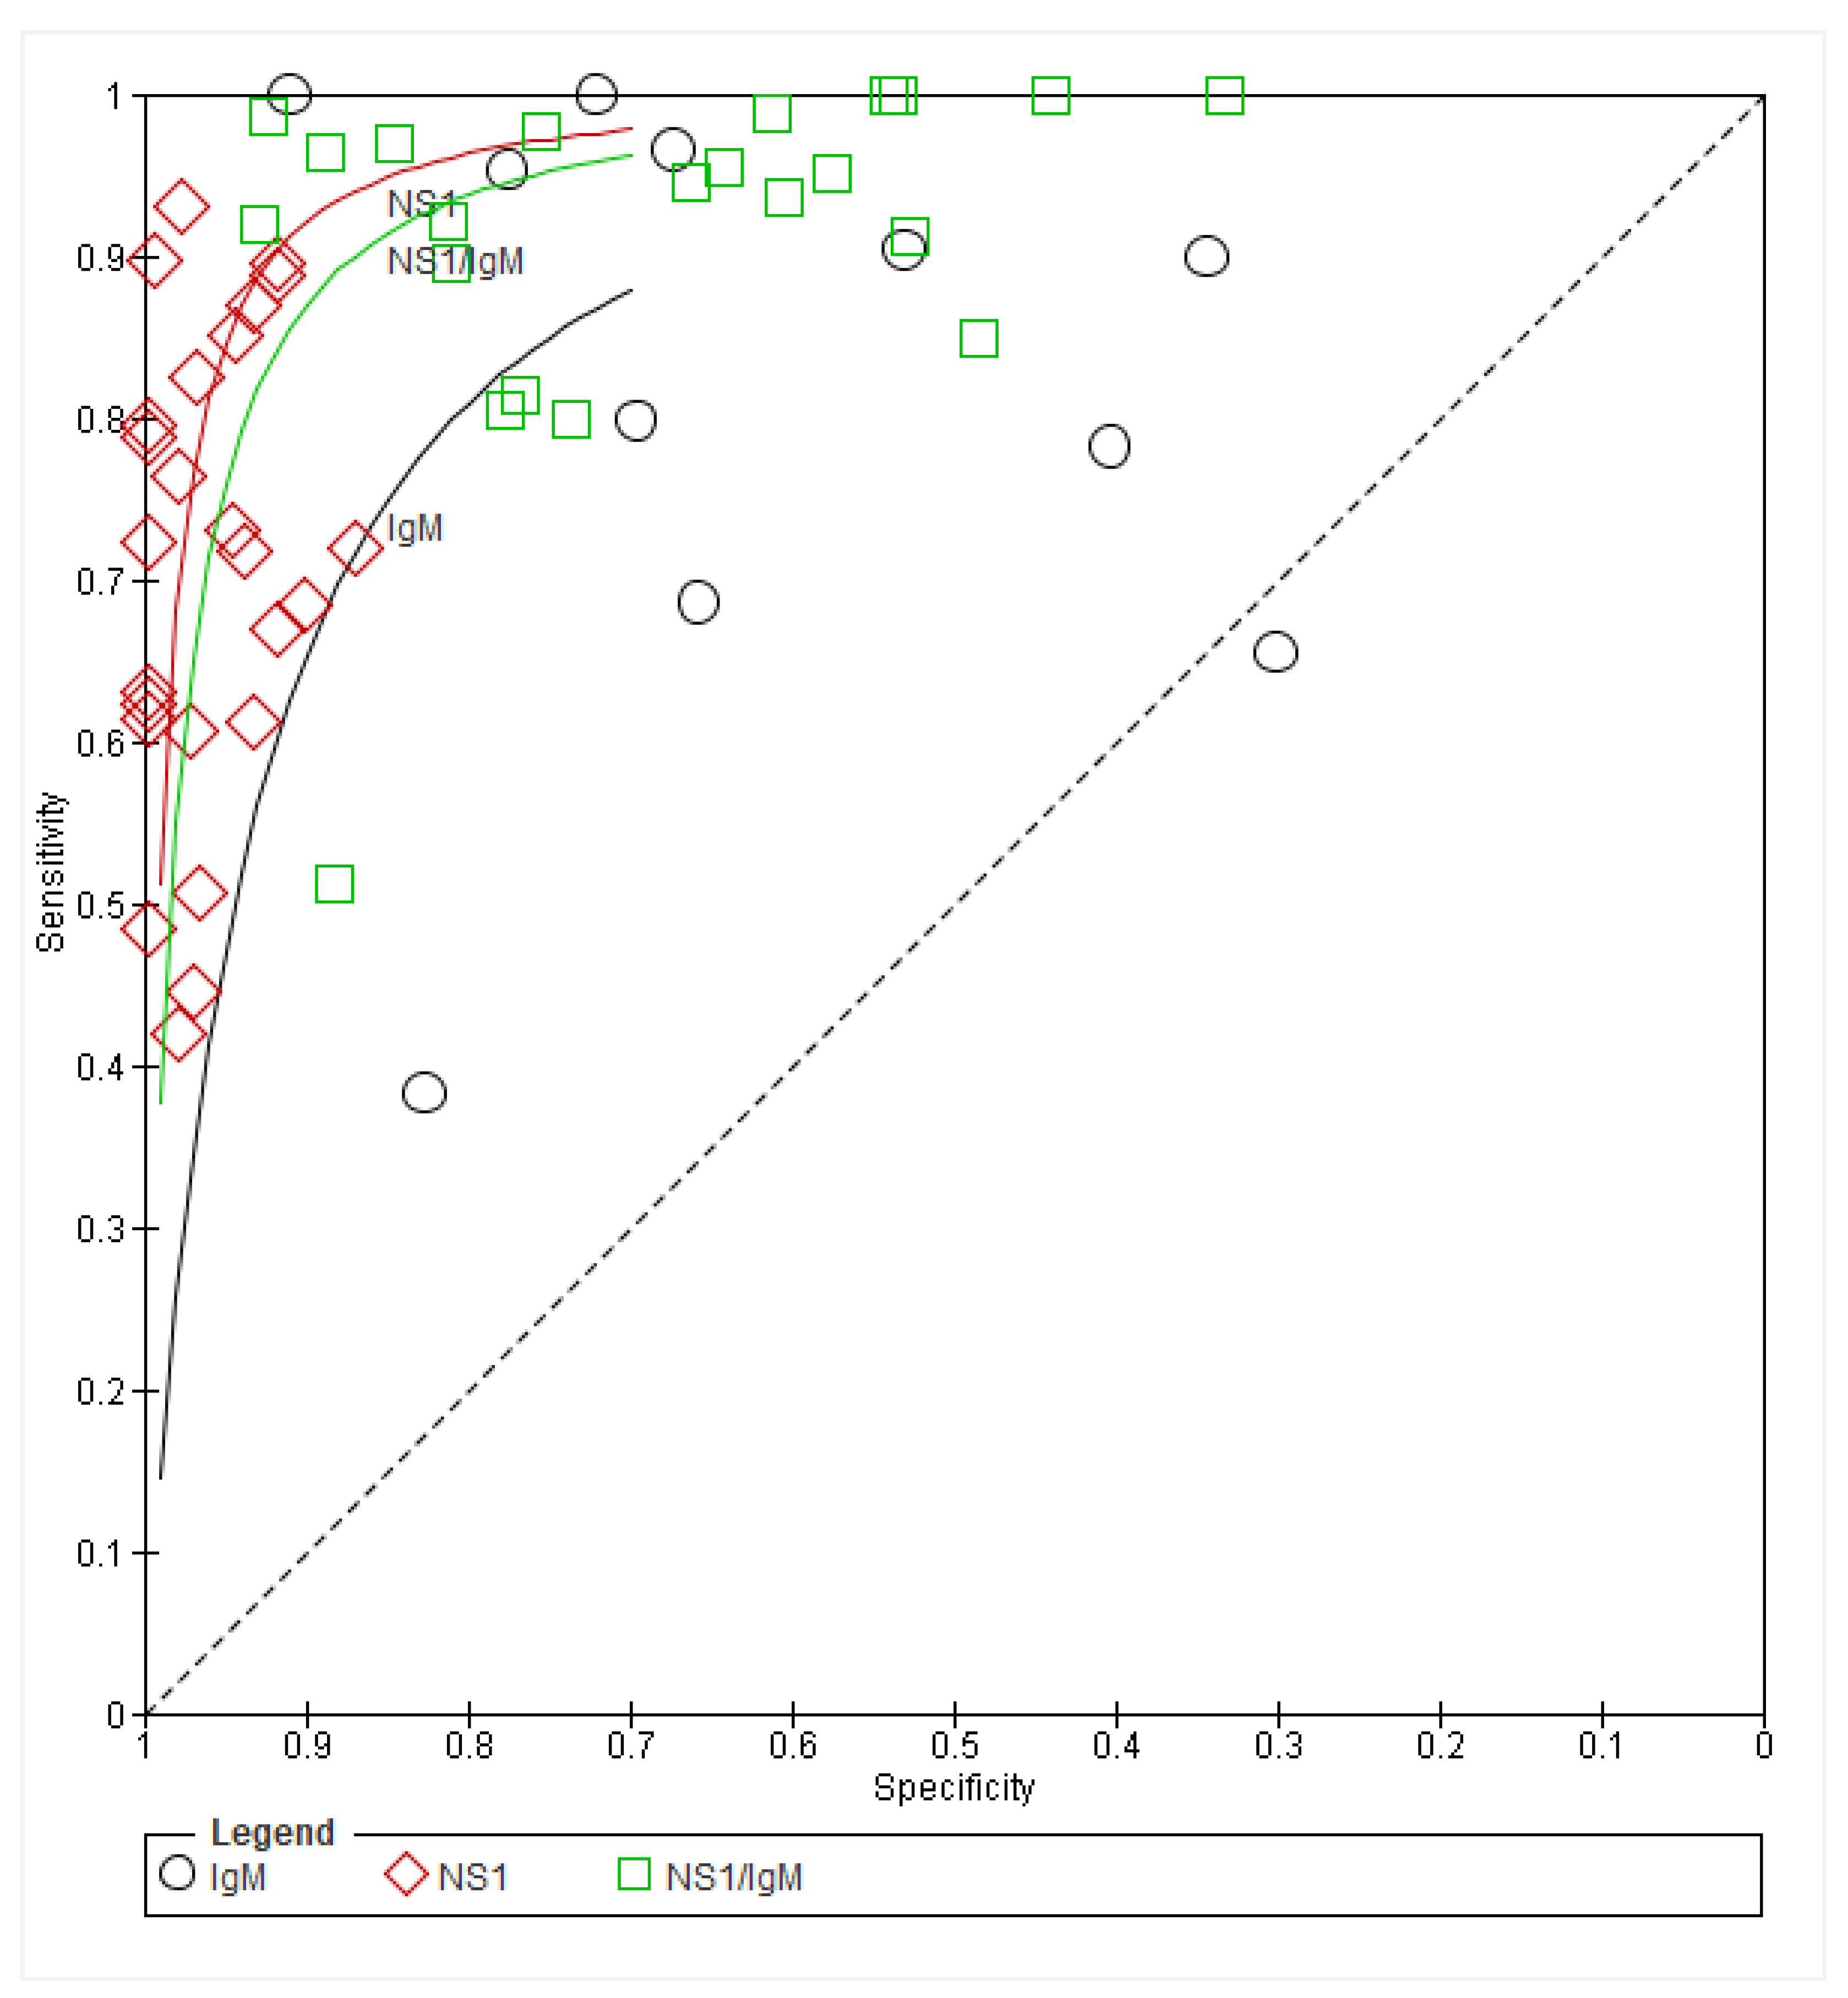
3.11. Summary Receiver Operating Characteristics (SROC) Findings
4. Discussion
5. Conclusions
Supplementary Materials
Author Contributions
Funding
Institutional Review Board Statement
Informed Consent Statement
Data Availability Statement
Conflicts of Interest
References
- Tuiskunen Bäck, A.; Lundkvist, Å. Dengue Viruses—An Overview. Infect. Ecol. Epidemiol. 2013, 3, 19839. [Google Scholar] [CrossRef] [PubMed]
- WHO Dengue and Severe Dengue. Available online: https://www.who.int/news-room/fact-sheets/detail/dengue-and-severe-dengue (accessed on 6 July 2022).
- Wilder-Smith, A.; Murray, N.E.A.; Quam, M.B. Epidemiology of dengue: Past, present and future prospects. Clin. Epidemiol. 2013, 5, 299–309. [Google Scholar] [CrossRef] [PubMed] [Green Version]
- Mardekian, S.K.; Roberts, A.L. Diagnostic Options and Challenges for Dengue and Chikungunya Viruses. BioMed Res. Int. 2015, 2015, 834371. [Google Scholar] [CrossRef] [PubMed] [Green Version]
- World Health Organization and Special Programme for Research and Training in Tropical Diseases and World Health Organization; Department of Control of Neglected Tropical Diseases and World Health Organization; Epidemic and Pandemic Alert. Dengue: Guidelines for Diagnosis, Treatment, Prevention and Control; World Health Organization: Geneva, Switzerland, 2009; ISBN 9241547871.
- Muller, D.A.; Depelsenaire, A.C.I.; Young, P.R. Clinical and Laboratory Diagnosis of Dengue Virus Infection. J. Infect. Dis. 2017, 215, S89–S95. [Google Scholar] [CrossRef]
- Lanciotti, R.S.; Calisher, C.H.; Gubler, D.J.; Chang, G.J.; Vorndam, A.V. Rapid detection and typing of dengue viruses from clinical samples by using reverse transcriptase-polymerase chain reaction. J. Clin. Microbiol. 1992, 30, 545–551. [Google Scholar] [CrossRef] [Green Version]
- Roehrig, J.T.; Hombach, J.; Barrett, A.D.T. Guidelines for Plaque-Reduction Neutralization Testing of Human Antibodies to Dengue Viruses. Viral Immunol. 2008, 21, 123–132. [Google Scholar] [CrossRef]
- Porter, K.R.; Widjaja, S.; Darmawan, H.; Lohita; Hadiwijaya, S.H.; Maroef, C.N.; Suharyono, W.; Tan, R. Evaluation of a Commercially Available Immunoglobulin M Capture Enzyme-Linked Immunosorbent Assay Kit for Diagnosing Acute Dengue Infections. Clin. Diagn. Lab. Immunol. 1999, 6, 741–744. [Google Scholar] [CrossRef] [Green Version]
- Duong, V.; Ly, S.; Try, P.L.; Tuiskunen, A.; Ong, S.; Chroeung, N.; Lundkvist, A.; Leparc-Goffart, I.; Deubel, V.; Vong, S.; et al. Clinical and Virological Factors Influencing the Performance of a NS1 Antigen-Capture Assay and Potential Use as a Marker of Dengue Disease Severity. PLoS Negl. Trop. Dis. 2011, 5, e1244. [Google Scholar] [CrossRef] [Green Version]
- Rathore, A.P.S.; St John, A.L. Cross-Reactive Immunity among Flaviviruses. Front. Immunol. 2020, 11, 334. [Google Scholar] [CrossRef] [Green Version]
- WHO Dengue Bulletin 2009, Volume 33. 2009. Available online: https://apps.who.int/iris/handle/10665/204939 (accessed on 6 July 2022).
- Alagarasu, K.; Walimbe, A.M.; Jadhav, S.M.; Deoshatwar, A.R. A meta-analysis of the diagnostic accuracy of dengue virus-specific IgA antibody-based tests for detection of dengue infection. Epidemiol. Infect. 2016, 144, 876–886. [Google Scholar] [CrossRef] [Green Version]
- Blacksell, S.D.; Doust, J.A.; Newton, P.N.; Peacock, S.J.; Day, N.P.J.; Dondorp, A.M. A systematic review and meta-analysis of the diagnostic accuracy of rapid immunochromatographic assays for the detection of dengue virus IgM antibodies during acute infection. Trans. R. Soc. Trop. Med. Hyg. 2006, 100, 775–784. [Google Scholar] [CrossRef] [PubMed]
- Mata, V.E.; De Andrade, C.A.F.; Passos, S.R.L.; Hökerberg, Y.H.M.; Fukuoka, L.V.B.; Da Silva, S.A. Rapid Immunochromatographic Tests for the Diagnosis of Dengue: A Systematic Review and Meta-Analysis. Cad. Saude Publica 2020, 36, e00225618. [Google Scholar] [CrossRef] [PubMed]
- Zhang, H.; Li, W.; Wang, J.; Peng, H.; Che, X.; Chen, X.; Zhou, Y. 2 NS1-Based Tests Supplying a Diagnostic Utility for Confirming Dengue 3 Infection: A Meta-Analysis Q1. Int. J. Infect. Dis. 2014, 30, e1–e10. [Google Scholar] [CrossRef] [PubMed] [Green Version]
- Shan, X.; Wang, X.; Yuan, Q.; Zheng, Y.; Zhang, H.; Wu, Y.; Yang, J. Evaluation of the diagnostic accuracy of nonstructural protein 1 Ag-based tests for dengue virus in Asian population: A meta-analysis. BMC Infect. Dis. 2015, 15, 360. [Google Scholar] [CrossRef] [PubMed] [Green Version]
- Hang, V.T.; Nguyet, N.M.; Trung, D.T.; Tricou, V.; Yoksan, S.; Dung, N.M.; Van Ngoc, T.; Hien, T.T.; Farrar, J.; Wills, B.; et al. Diagnostic Accuracy of NS1 ELISA and Lateral Flow Rapid Tests for Dengue Sensitivity, Specificity and Relationship to Viraemia and Antibody Responses. PLoS Negl. Trop. Dis. 2009, 3, e360. [Google Scholar] [CrossRef]
- Goncalves, A.; Peeling, R.W.; Chu, M.C.; Gubler, D.J.; De Silva, A.M.; Harris, E.; Murtagh, M.; Chua, A.; Rodriguez, W.; Kelly, C.; et al. Innovative and New Approaches to Laboratory Diagnosis of Zika and Dengue: A Meeting Report. J. Infect. Dis. 2018, 217, 1060–1068. [Google Scholar] [CrossRef]
- Statistics and Maps|Dengue|CDC. Available online: https://www.cdc.gov/dengue/statistics-maps/index.html (accessed on 23 May 2022).
- Horsley, T.; Dingwall, O.; Sampson, M. Checking reference lists to find additional studies for systematic reviews. Cochrane Database Syst. Rev. 2011, 2011, MR000026. [Google Scholar] [CrossRef]
- Whiting, P.F.; Rutjes, A.W.S.; Westwood, M.E.; Mallett, S.; Deeks, J.J.; Reitsma, J.B.; Leeflang, M.M.G.; Sterne, J.A.C.; Bossuyt, P.M.M.; QUADAS-2 Group. QUADAS-2: A Revised Tool for the Quality Assessment of Diagnostic Accuracy Studies. Ann. Intern. Med. 2011, 155, 529–536. [Google Scholar] [CrossRef]
- Fleiss, J.L.; Levin, B.; Paik, M.C. Statistical Methods for Rates and Proportions; John Wiley & Sons: Hoboken, NJ, USA, 2013; ISBN 1118625617. [Google Scholar]
- Farrington, D.P.; Loeber, R. Relative improvement over chance (RIOC) and phi as measures of predictive efficiency and strength of association in 2 × 2 tables. J. Quant. Criminol. 1989, 5, 201–213. [Google Scholar] [CrossRef]
- Kikuti, M.; Cruz, J.S.; Rodrigues, M.S.; Tavares, A.S.; Paploski, I.A.D.; Silva, M.M.O.; Santana, P.M.; Tauro, L.B.; Silva, G.A.O.F.; Campos, G.S.; et al. Accuracy of the SD BIOLINE Dengue Duo for rapid point-of-care diagnosis of dengue. PLoS ONE 2019, 14, e0213301. [Google Scholar] [CrossRef]
- Osorio, L.; Ramirez, M.; Bonelo, A.; Villar, L.A.; Parra, B. Comparison of the diagnostic accuracy of commercial NS1-based diagnostic tests for early dengue infection. Virol. J. 2010, 7, 361. [Google Scholar] [CrossRef] [PubMed] [Green Version]
- Pal, S.; Dauner, A.L.; Mitra, I.; Forshey, B.M.; Garcia, P.; Morrison, A.C.; Halsey, E.S.; Kochel, T.J.; Wu, S.-J.L. Evaluation of Dengue NS1 Antigen Rapid Tests and ELISA Kits Using Clinical Samples. PLoS ONE 2014, 9, e113411. [Google Scholar] [CrossRef] [PubMed] [Green Version]
- Carter, M.J.; Emary, K.R.; Moore, C.E.; Parry, C.M.; Sona, S.; Putchhat, H.; Reaksmey, S.; Chanpheaktra, N.; Stoesser, N.; Dobson, A.D.M.; et al. Rapid Diagnostic Tests for Dengue Virus Infection in Febrile Cambodian Children: Diagnostic Accuracy and Incorporation into Diagnostic Algorithms. PLoS Negl. Trop. Dis. 2015, 9, e0003424. [Google Scholar] [CrossRef]
- Andries, A.-C.; Duong, V.; Ngan, C.; Ong, S.; Huy, R.; Sroin, K.K.; Te, V.; Bunthin, Y.; Try, P.L.; Buchy, P. Field Evaluation and Impact on Clinical Management of a Rapid Diagnostic Kit That Detects Dengue NS1, IgM and IgG. PLoS Negl. Trop. Dis. 2012, 6, e1993. [Google Scholar] [CrossRef]
- Kulkarni, R.; Modak, M.; Gosavi, M.; Wani, D.; Mishra, A.C.; Arankalle, V.A. Comparative assessment of commercial enzyme-linked immunosorbent assay & rapid diagnostic tests used for dengue diagnosis in India. Indian J. Med Res. 2020, 151, 71–78. [Google Scholar] [CrossRef] [PubMed]
- Vivek, R.; Ahamed, S.F.; Kotabagi, S.; Chandele, A.; Khanna, I.; Khanna, N.; Nayak, K.; Dias, M.; Kaja, M.-K.; Shet, A. Evaluation of a pan-serotype point-of-care rapid diagnostic assay for accurate detection of acute dengue infection. Diagn. Microbiol. Infect. Dis. 2017, 87, 229–234. [Google Scholar] [CrossRef]
- Sathish, N.; Vijayakumar, T.S.; Abraham, P.; Sridharan, G. Dengue Fever: Its Laboratory Diagnosis, with Special Emphasis on IgM Detection; Department of Clinical Virology, Christian Medical College: Vellore, India, 2003. [Google Scholar]
- Ngim, C.F.; Husain, S.M.T.; Hassan, S.S.; Dhanoa, A.; Ahmad, S.A.A.; Mariapun, J.; Ismail, W.F.W.; Henien, N.P.B.; Jahan, N.K.; Pong, L.Y.; et al. Rapid testing requires clinical evaluation for accurate diagnosis of dengue disease: A passive surveillance study in Southern Malaysia. PLoS Negl. Trop. Dis. 2021, 15, e0009445. [Google Scholar] [CrossRef]
- Zainah, S.; Wahab, A.H.A.; Mariam, M.; Fauziah, M.K.; Khairul, A.H.; Roslina, I.; Sairulakhma, A.; Kadimon, S.S.; Jais, M.S.M.; Chua, K.B. Performance of a commercial rapid dengue NS1 antigen immunochromatography test with reference to dengue NS1 antigen-capture ELISA. J. Virol. Methods 2009, 155, 157–160. [Google Scholar] [CrossRef]
- Kyaw, A.K.; Tun, M.M.N.; Naing, S.T.; Htet, K.K.K.; Htwe, T.T.; Khaing, Y.Y.; Mar, T.T.; Aung, T.; Win, K.N.; Tar, T.; et al. Evaluation of commercially available three dengue rapid diagnostic test kits for diagnosis of acute dengue virus infection at the point-of-care setting in Myanmar. J. Virol. Methods 2019, 273, 113724. [Google Scholar] [CrossRef]
- Jang, W.S.; Kwak, S.Y.; May, W.L.; Yang, D.J.; Nam, J.; Lim, C.S. Comparative evaluation of three dengue duo rapid test kits to detect NS1, IgM, and IgG associated with acute dengue in children in Myanmar. PLoS ONE 2019, 14, e0213451. [Google Scholar] [CrossRef]
- Liu, L.-T.; Chen, C.-H.; Tsai, C.-Y.; Lin, P.-C.; Hsu, M.-C.; Huang, B.-Y.; Wang, Y.-H.; Tsai, J.-J. Evaluation of rapid diagnostic tests to detect dengue virus infections in Taiwan. PLoS ONE 2020, 15, e0239710. [Google Scholar] [CrossRef] [PubMed]
- Kittigul, L.; Suankeow, K. Use of a Rapid Immunochromatographic Test for Early Diagnosis of Dengue Virus Infection. Eur. J. Clin. Microbiol. Infect. Dis. 2002, 21, 224–226. [Google Scholar] [CrossRef] [PubMed]
- Tricou, V.; Vu, H.T.T.; Quynh, N.V.N.; Nguyen, C.V.V.; Tran, H.T.; Farrar, J.; Wills, B.; Simmons, C.P. Comparison of two dengue NS1 rapid tests for sensitivity, specificity and relationship to viraemia and antibody responses. BMC Infect. Dis. 2010, 10, 142. [Google Scholar] [CrossRef] [Green Version]
- Fry, S.R.; Meyer, M.; Semple, M.G.; Simmons, C.P.; Sekaran, S.D.; Huang, J.X.; McElnea, C.; Huang, C.-Y.; Valks, A.; Young, P.R.; et al. The Diagnostic Sensitivity of Dengue Rapid Test Assays Is Significantly Enhanced by Using a Combined Antigen and Antibody Testing Approach. PLoS Negl. Trop. Dis. 2011, 5, e1199. [Google Scholar] [CrossRef] [PubMed] [Green Version]
- Fatima, A.; Wang, J. Progress in the diagnosis of dengue virus infections and importance of point of care test: A review. Pak. J. Pharm. Sci. 2015, 28, 271–280. [Google Scholar]
- Lim, J.K.; Alexander, N.; Di Tanna, G.L. A systematic review of the economic impact of rapid diagnostic tests for dengue. BMC Health Serv. Res. 2017, 17, 850. [Google Scholar] [CrossRef]
- Messina, J.P.; Brady, O.J.; Scott, T.W.; Zou, C.; Pigott, D.M.; Duda, K.A.; Bhatt, S.; Katzelnick, L.; Howes, R.E.; Battle, K.E.; et al. Global spread of dengue virus types: Mapping the 70 year history. Trends Microbiol. 2014, 22, 138–146. [Google Scholar] [CrossRef] [Green Version]
- Halstead, S.B. Dengue. Lancet 2007, 370, 1644–1652. [Google Scholar] [CrossRef]
- Srichaikul, T.; Nimmannitya, S. Haematology in dengue and dengue haemorrhagic fever. Best Pract. Res. Clin. Haematol. 2000, 13, 261–276. [Google Scholar] [CrossRef]
- World Health Organization. Prevention and Control of Dengue and Dengue Haemorrhagic Fever; WHO Regional Office for South-East Asia: New Delhi, India, 1999.
- De la Cruz Hernández, S.I.; Puerta-Guardo, H.N.; Flores Aguilar, H.; González Mateos, S.; López Martinez, I.; Ortiz-Navarrete, V.; Ludert, J.E.; Del Angel, R.M. Primary Dengue Virus Infections Induce Differential Cytokine Production in Mexican Patients. Mem. Inst. Oswaldo Cruz 2016, 111, 161–167. [Google Scholar] [CrossRef]
- Shamala, D.S. Laboratory Diagnosis of Dengue: A Review. IIUM Med. J. Malaysia 2015, 14. [Google Scholar] [CrossRef]
- Zeng, X.; Zhang, Y.; Kwong, J.S.W.; Zhang, C.; Li, S.; Sun, F.; Niu, Y.; Du, L. The methodological quality assessment tools for preclinical and clinical studies, systematic review and meta-analysis, and clinical practice guideline: A systematic review. J. Evid.-Based Med. 2015, 8, 2–10. [Google Scholar] [CrossRef]
- World Health Organization. Global Plan to Combat Neglected Tropical Diseases 2008–2015; World Health Organization: Geneva, Switzerland, 2007.


| Statistical Term | Definition |
|---|---|
| True Positives (TP) | Individuals with the Disease with the Value of the Parameter of Interest above the Cut-Off. |
| False Positive (FP) | Individuals without the disease with the value of the parameter of interest above the cut-off. |
| True Negative (TN) | Individuals without the disease with the value of the parameter of interest below the cut-off. |
| False Negative (FN) | Individuals with the disease with the value of the parameter of interest below the cut-off. |
| Positive Likelihood Ratio (LR+) | Measures how likely it is that a positive test result will occur in individuals with the disease compared with those without the disease. |
| Negative Likelihood Ratio (LR−) | Measures how likely it is that a negative test result will occur in individuals with the disease compared with those without the disease. |
| Positive Predictive Value (PPV) | Reports the proportions of positive diagnostic test results and the true positive results. |
| Negative Predictive Value (NPV) | Reports the proportions of negative diagnostic test results and the true negative results. |
| Diagnostic Odds Ratio (DOR) | A general estimate of the discriminative power of diagnostic procedures. It tests the ratio of positivity odds in individuals with disease related to the odds of individuals without the disease. |
| Error Odds Ratio (EOR) | Measures the likelihood of errors in diagnostic tests in individuals with the disease compared with those without. |
| Phi Coefficient | Also called a mean square contingency coefficient, this measures the association between two variables. |
| Relative Improvement Over Chance (RIOC) | This measures the predictive efficiency of the test. |
| (a) | |||||||||
| Author, Year, Country (Ref) | Region | DENV-Positive Individuals (n) | Cohort Size (N) | Prevalence (as confirmed by Reference Method) | Reference Method | Sample Type | Days Post Fever Onset | ||
| 1 | Kikuti, 2019, Brazil [25] | Americas | 151 | 246 | 61.40% | NS1-ELISA, IgM-ELISA seroconversion (Abbott, Santa Clara, CA, USA; former Panbio Diagnostics, Brisbane, Australia), and/or RT-PCR | Acute serum | 1–4 days | |
| 2 | Osorio, 2010, Colombia [26] | Americas | 218 | 310 | 70.30% | RT-PCR, viral isolation, and/or IgM seroconversion | Acute serum | 1–7 days | |
| 3 | Pal, 2014, Peru [27] | Americas | 200 | 250 | 80% | RT-PCR and/or viral isolation followed by indirect immunofluorescence assay (IFA) | Acute serum | 1–5 days | |
| 4 | Carter, 2015, Cambodia [28] | Asia | 71 | 337 | 21.10% | Panbio Dengue IgM Combo ELISA (Panbio, Australia; Cat. # E-JED01C; Lot # 110061 | Acute serum | 1–2 days | |
| 5 | Andries, 2012, Cambodia [29] | Asia | 85 | 157 | 54.10% | NS1 capture ELISA, MAC-ELISA for IgM, indirect ELISA for IgG | Acute serum | 1–7 days | |
| 6 | Kulkarni, 2020, India [30] | Asia | 312 | 809 | 38.60% | Panbio ELISA | Acute serum | 1–7 days | |
| 7 | Vivek, 2017, India [31] | Asia | 179 | 211 | 84.80% | RT-PCR | Acute serum | 1–5 days | |
| 8 | Sathish, 2003, India [32] | Asia | 60 | 154 | 38.90% | NIV capture ELISA (MACELISA) | Acute serum | 2–7 days | |
| 9 | Ngim, 2021, Malaysia [33] | Asia | 167 | 368 | 45.40% | ELISA and/or RT-PCR | Acute serum | 1–6 days | |
| 10 | Zainah, 2009, Malaysia [34] | Asia | 100 | 314 | 31.80% | NS1 antigen–capture ELISA or RT-PCR | Acute serum | 1–7 days | |
| 11 | Kyaw, 2019, Myanmar [35] | Asia | 140 | 202 | 69.30% | DENV-specific IgM capture ELISA or DENV RNA isolation | Acute serum | 1–7 days | |
| 12 | Jang, 2019, Myanmar [36] | Asia | 109 | 220 | 49.50% | IgM/IgG ELISAs or qRT-PCR | Acute serum | 3–7 days | |
| 13 | Liu, 2021, Taiwan [37] | Asia | 136 | 173 | 78.60% | Qrt-PCR | Acute serum | 1–5 days | |
| 14 | Kittigul, 2002, Thailand [38] | Asia | 52 | 92 | 56.50% | 4× increased titers on hemagglutination inhibition test | Acute serum | 1–6 days | |
| 15 | Tricou, 2010, Vietnam [39] | Asia | 245 | 292 | 83.90% | RT–PCR | Acute serum | 1–7 days | |
| (b) | |||||||||
| ICT Manufacturer | Sensitivity % (95% CI) | Specificity % (95% CI) | Combined Sensitivity % (95% CI) | Combined Specificity % (95% CI) | Primary and Secondary Sensitivitity (Acute) % | ||||
| 1 | Kikuti, 2019, Brazil [25] | SD BIOLINE Dengue Duo RDT (Abbott, Santa Clara, CA, USA; former Alere Inc, Waltham, MA, USA) | NS1: 41.8% (35.1–48.7), IgM: 11.7% (7.7–16.8) | NS1: 98.0% (92.2–99.8), IgM: 94.6% (87.5–98.3) | NS1/IgM: 47.9% (41.0–54.8) | NS1/IgM: 92.6% (84.9–93.5) | Primary: NS1 26.7% (14.6–41.9), IgM 4.4% (0.5–15.2), NS1/IgM 31.1% (18.2–46.7), Secondary: NS1 40.7% (33.8–47.9), IgM 15.6% (10.8–21.4), NS1/IgM 49.8% (42.6–56.9) | ||
| 2 | Osorio, 2010, Colombia [26] | (i) Dengue NS1 Ag STRIP™ (Biorad Laboratories, Marnes-La-Coquette, France), and (ii) SD BIOLINE Dengue DUO® (Standard Diagnostic Inc., Suwon, Korea) | NS1: STRIP™ 61.5% (51.5–70.9), SD Bioline™ 51.0% (44.1–57.7) | NS1: STRIP™ 93.3% (84.2–99.4), SD Bioline™ 96.7% (90.8–99.3) | NS1/IgM: SD Bioline™ 78.4% (72.4–83.7), NS1/IgM/IgG: SD Bioline™ 80.7% (75–85.7) | NS1/IgM: SD Bioline™ 91.3% (83.6–96.2), NS1/IgM/IgG: SD Bioline™ 89.1% (81–94.7) | – | ||
| 3 | Pal, 2014, Peru [27] | (i) Dengue NS1 Ag STRIP® (Bio–Rad, Marnes-La-Coquette, France), (ii) Dengue NS1 Detect Rapid Test (1st generation) (InBios International, Seattle, WA, USA), (iii) Panbio Dengue Early Rapid, and (iv) SD Bioline Dengue NS1 Ag Rapid Test (Alere, Waltham, MA, USA) | NS1: Bio–Rad 79.1% (71.8–85.2), InBios 76.5% (64.6–85.9), Panbio 71.9% (64.1–78.9), SD 72.4% (64.5–79.3) | NS1: Bio–Rad 100% (91.1–100.0), InBios 97.3% (86.2–99.9), Panbio 95.0% (83.1–99.4), SD 100% (91.1–100) | – | – | – | ||
| 4 | Carter, 2015, Cambodia [28] | SD BIOLINE Dengue DUO® (Standard Diagnostic Inc., Suwon, Korea) | NS1: 60.8% (46.1–74.2); IgM: 32.7% (20.0–47.5) | NS1: 97.5% (94.9–99); IgM: 86.2% (81.5–90.0) | NS1/IgM: 57.8% (45.4–69.4) | NS1/IgM: 85.3% (80.3–89.5) | – | ||
| 5 | Andries, 2012, Cambodia [29] | SD BIOLINE Dengue DUO® (Standard Diagnostic Inc., Suwon, Korea) | NS1: 45.2% (36.4–54.3) | NS1: 96.8% (83.3–99.9) | NS1/IgM/IgG: 94.4% (88.9–97.7) | NS1/IgM/IgG: 90.0% (73.5–97.9) | Primary: NS1 89.5% (66.9–98.7), IgM/IgG 42.1% (20.3–66.5), NS1/IgM/IgG 100% (82.4–100), Secondary: NS1 43.4% (32.5–54.7), IgM/IgG 79.5% (69.2–87.6), NS1/IgM/IgG 97.6% (91.6–99.7) | ||
| 6 | Kulkarni, 2020, India [30] | J. Mitra Dengue Day 1 Test and SD-BIOLINE-Dengue-Duo (SDB-RDT) | NS1: J. Mitra-87.3 (82.2–92.5), SD–93.1 (88.2–98.0); IgM: J. Mitra–22.5 (17.1–27.9), SD–34.4 (27.7–41.1) | NS1: J. Mitra–93.4 (91.5–95.3), SD–97.8 (96.1–99.5); IgM: J. Mitra–93.6 (91.6–95.6), SD–94.5 (91.2–97.8) | NS1/IgM: J. Mitra–58.3 (52.9–63.8), SD–55.7 (49.4–62.0) | NS1/IgM: J. Mitra–91.1 (88.6–93.6), SD–92.0 (87.5–96.5) | Sensitivity J. Mitra: NS1: Primary–67/72 (93.1%), Secondary–43/40 (>100%)/ IgM: Primary–14/65 (21.5%), Secondary–19/73 (26%)/ Combined NS1/IgM: Primary–72/113 (63.7%), Secondary–47/79 (59.5%) | ||
| 7 | Vivek, 2017, India [31] | Dengue Day 1 Test (J. Mitra & Co) | NS1: 82.7% (76.3–87.9) | NS1: 96.9% (83.8–99.9) | NS1/IgM: 89.4% (83.9–93.5) | NS1/IgM: 93.8% (79.2–99.2) | Primary: NS1/IgM 90%, Secondary: NS1/IgM 96.9% | ||
| 8 | Sathish, 2003, India [32] | Panbio Rapid Immuochromatographic Card Test (Brisbane, Australia) | NS1: 73% (65–80) | NS1: 95% (90–98) | – | – | – | ||
| 9 | Ngim, 2021, Malaysia [33] | Dengue Combo Rapid Test-Cassette (Chembio Diagnostics, Inc., Medford, NY, USA) | – | – | NS1/IgM: 62.3% | NS1/IgM: 87.3% | – | ||
| 10 | Zainah, 2009, Malaysia [34] | DENGUE NS1 Ag STRIP (Bio-Rad, Marnes–La–Coquette, France) | NS1: 90.4% | NS1: 99.5% | – | – | Primary: NS1 92.3%, Secondary: NS1 79.1% | ||
| 11 | Kyaw, 2019, Myanmar [35] | (1) CareUs Dengue Combo, Korea, (2) Humasis Dengue Combo, Korea, and (3) Wondfo Dengue Combo, China | NS1: CareUs 72.1% (63.9–79.4), Humasis 68.6% (60.2–76.1), Wondfo 67.1% (58.7–74.8)/ IgM: CareUs 67.1% (58.7–74.8), Humasis 13.6% (8.4–20.4), Wondfo 19.3% (13.1–26.8) | NS1: CareUs 87.1% (76.1–94.3), Humasis 90.3% (80.1–96.4), Wondfo 91.9% (82.2–97.3), IgM: CareUs 83.9% (72.3–92.0), Humasis 83.9% (72.3–92.0), Wondfo 95.2% (86.5–98.9) | NS1/IgM: CareUs 92.1% (86.4–96.0), Humasis 74.3% (66.2–88.2), Wondfo 70.0% (61.7–77.4) | NS1/IgM: CareUs 75.8 (63.3–85.8), Humasis 88.7 (78.1–95.3), Wondfo 91.9 (82.2–97.3) | Primary: NS1/IgM CareUs 87.3% (77.3–94.0%), Humasis 85.0% (74.1–92.0%), Wondfo 83.1% (72.3–90.9%); Secondary: NS1/IgM CareUs 97.1 % (89.9–99.6%), Humasis 63.8% (51.3–75.0%), Wondfo 56.5% (44.0–68.4%) | ||
| 12 | Jang, 2019, Myanmar [36] | (i) Humasis Dengue Combo NS1, IgG/IgM (Humasis, Geyonggi-do, Korea), (ii) SD Bioline Dengue Duo NS1 Ag and IgG/IgM (SD Bioline, Korea), and (iii) CareUS Dengue Combo NS1 and IgM/IgG kits (WellsBio, Seoul, Korea) | NS1: Humasis 63.3% (53.5–72.3), SD Bioline 48.6% (38.9–58.4), CareUs 79.8% (71.1–86.9), IgM: Humasis 51.4% (41.6–61.1), SD Bioline 60.6% (50.7–69.8), CareUs 89.9% (82.7–94.9), IgG: Humasis 72.5% (63.1–80.6), SD Bioline 78.0 (69.0–85.5), CareUs 82.6% (74.1–89.2) | NS1: 100%, IgM: Humasis 98.2 (91.5–99.9), SD Bioline and CareUs 100%, IgG; 95.2 (86.7–99.0), SD Bioline and CareUs 100% | NS1/IgM: Humasis 81.7% (73.1–88.4), SD Bioline 80.7% (72.1–87.7), CareUs 96.3% (90.9–99.0) | NS1/IgM: Humasis 98.2% (91.5–99.9), SD Bioline 80.7% (72.1–87.7), CareUs 96.3% (90.9–98.9) | Primary: NS1 Humasis 77.3% (54.63–92.2), SD Bioline 72.7% (49.8–89.3), CareUS 90.9% (70.8–98.9), IgM Humasis 68.2% (45.1–86.1), SD Bioline 72.7% (49.8–89.3), CareUS 86.4% (65.1–97.1), NS1/IgM Humasis 86.4% (65.1–97.1), SD Bioline 90.9% (70.8–98.9), CareUS 90.9% (70.8–98.9), Secondary: NS1 Humasis 59.8% (48.7–70.2), SD Bioline 42.5% (32.0–53.6), CareUS 77.0 (66.75–85.36), IgM Humasis 47.1% (36.3–58.1), SD Bioline 57.5% (46.41–68.0), CareUS 90.8% (82.7–96.0), NS1/IgM Humasis 80.5% (70.6–88.2), SD Bioline 78.2% (68.0–86.3), CareUS 97.7% (91.9–99.7) | ||
| 13 | Liu, 2021, Taiwan [37] | Dengue NS1 Ag Strip (Bio-Rad, Marnes-La-Coquette, France), Dengue Ag Rapid Test-Cassette (CTK Biotech, Inc., San Diego, CA, USA) and SD Dengue Duo (Standard Diagnostics, Inc., Suwon, Korea) | NS1: SD 89.7%, Bio–Rad 85.3%, CTK 89% | NS1: SD 91.9%, Bio–Rad 94.6%, CTK 73% | NS1/IgM: SD 95.6%, Bio–Rad 91.9%, CTK 95.6%, NS1/IgM/IgG: SD 97.1%, CTK 87.8% | NS1/IgM: SD 89.2%, Bio–Rad 91.9%, CTK 70.3%, NS1/IgM/IgG: SD 86.5%, CTK 43.2% | Primary: SD NS1 95.7%, Bio–Rad NS1 90.4%, CTK NS1 93.9%, SD NS1/IgM/IgG 97.4%, CTK NS1/IgM 95.7%, CTK NS1/IgM/IgG 97.4%/ Secondary: SD NS1 60%, Bio–Rad NS1 50%, CTK NS1 60%, SD NS1/IgM 90%, SD NS1/IgM/IgG 100%, CTK NS1/IgM 90%, CTK NS1/IgM/IgG 100% | ||
| 14 | Kittigul, 2002, Thailand [38] | Panbio Duo cassette IgM/IgG (Inverness, Australia) | – | – | IgM/IgG: 79% | IgM/IgG: 95% | Primary: IgM/IgG 67%, Secondary: IgM/IgG 80% | ||
| 15 | Tricou, 2010, Vietnam [39] | Bio-Rad NS1 Ag Strip and SD Dengue Duo (NS1/IgM/IgG) lateral flow rapid tests | NS1 Bio-Rad: 61.6 (55.2–67.8); NS1 SD: 62.4 (56.1–68.5) | 100% | NS1/IgM Bio–Rad: 83.3% (72.1–91.4); NS1/IgM/IgG Bio–Rad: 61.6%; NS1/IgM SD Duo: 75.5% (69.6–80.8); NS1/IgM/IgG SD Duo: 83.7% (78.4–88.1) | 100% | Primary: NS1 Biorad 80.3% (68.7–89.1), SD NS1 80.3% (68.7–89.1), SD NS1/IgM 83.3% (72.1–91.4), SD NS1/IgM/IgG 83.3% (72.1–91.4), Secondary: NS1 Biorad 55.1% (47.4–62.6), SD NS1 56.3% (48.6–63.7), SD NS1/IgM 72.7% (65.5–79.2), SD NS1/IgM/IgG 84.1% (77.8–89.2) | ||
Publisher’s Note: MDPI stays neutral with regard to jurisdictional claims in published maps and institutional affiliations. |
© 2022 by the authors. Licensee MDPI, Basel, Switzerland. This article is an open access article distributed under the terms and conditions of the Creative Commons Attribution (CC BY) license (https://creativecommons.org/licenses/by/4.0/).
Share and Cite
Haider, M.; Yousaf, S.; Zaib, A.; Sarfraz, A.; Sarfraz, Z.; Cherrez-Ojeda, I. Diagnostic Accuracy of Various Immunochromatographic Tests for NS1 Antigen and IgM Antibodies Detection in Acute Dengue Virus Infection. Int. J. Environ. Res. Public Health 2022, 19, 8756. https://doi.org/10.3390/ijerph19148756
Haider M, Yousaf S, Zaib A, Sarfraz A, Sarfraz Z, Cherrez-Ojeda I. Diagnostic Accuracy of Various Immunochromatographic Tests for NS1 Antigen and IgM Antibodies Detection in Acute Dengue Virus Infection. International Journal of Environmental Research and Public Health. 2022; 19(14):8756. https://doi.org/10.3390/ijerph19148756
Chicago/Turabian StyleHaider, Mughees, Saira Yousaf, Asifa Zaib, Azza Sarfraz, Zouina Sarfraz, and Ivan Cherrez-Ojeda. 2022. "Diagnostic Accuracy of Various Immunochromatographic Tests for NS1 Antigen and IgM Antibodies Detection in Acute Dengue Virus Infection" International Journal of Environmental Research and Public Health 19, no. 14: 8756. https://doi.org/10.3390/ijerph19148756