
Chaos Analysis of Urban Low-Carbon Traffic Based on Game Theory


Abstract
:1. Introduction
2. Materials and Methods
2.1. Low-Carbon Travel Awareness Survey
2.2. Game Theory Model
2.3. Stability Analysis of Game Theory Model
3. Results
3.1. Parameter Calibration
3.2. Simulation Results
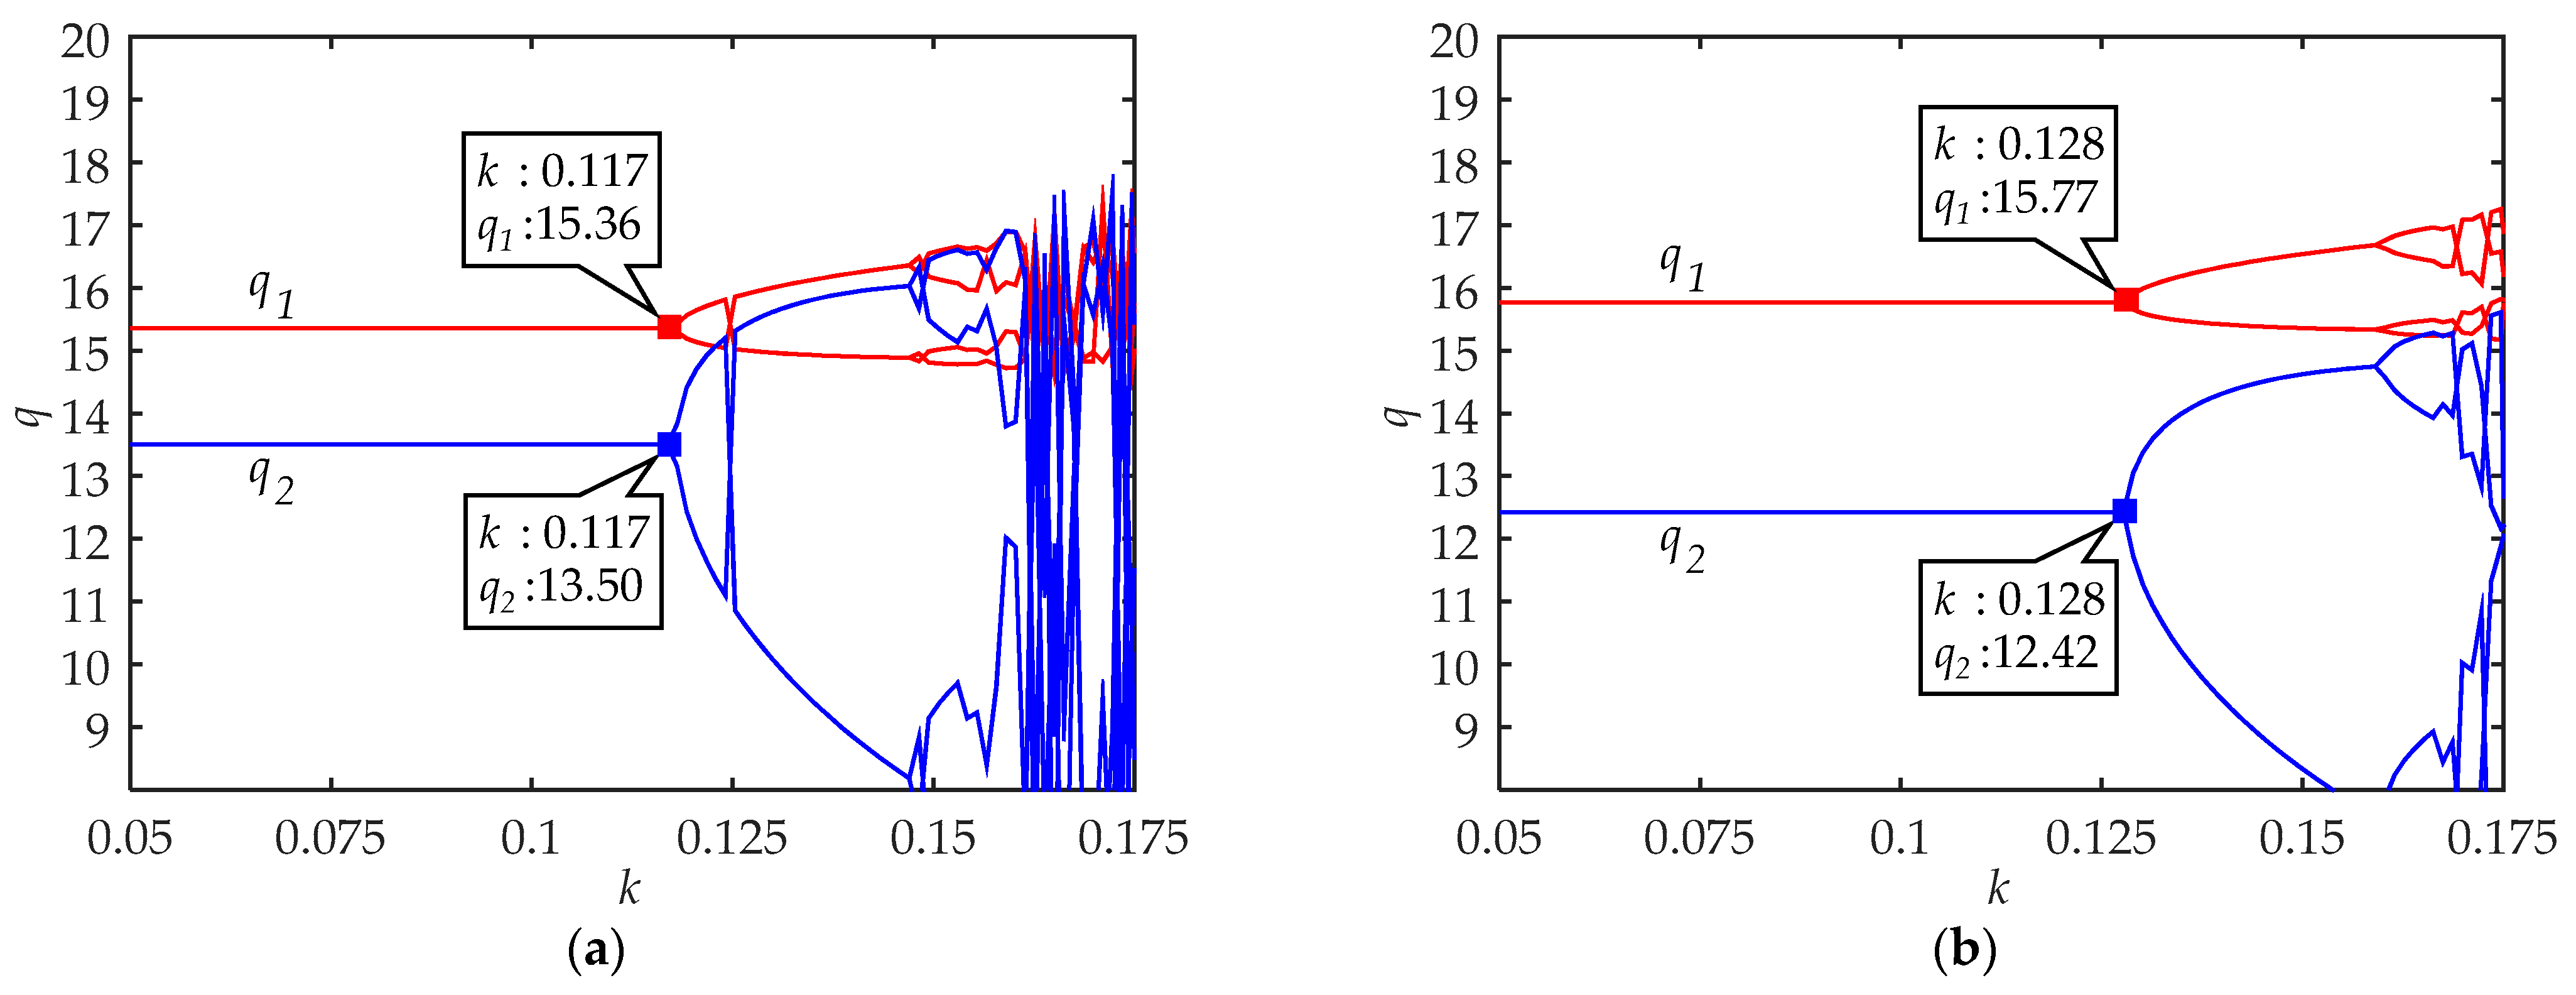
3.2.1. Simulation Results of Cities with Developed Traffic Systems
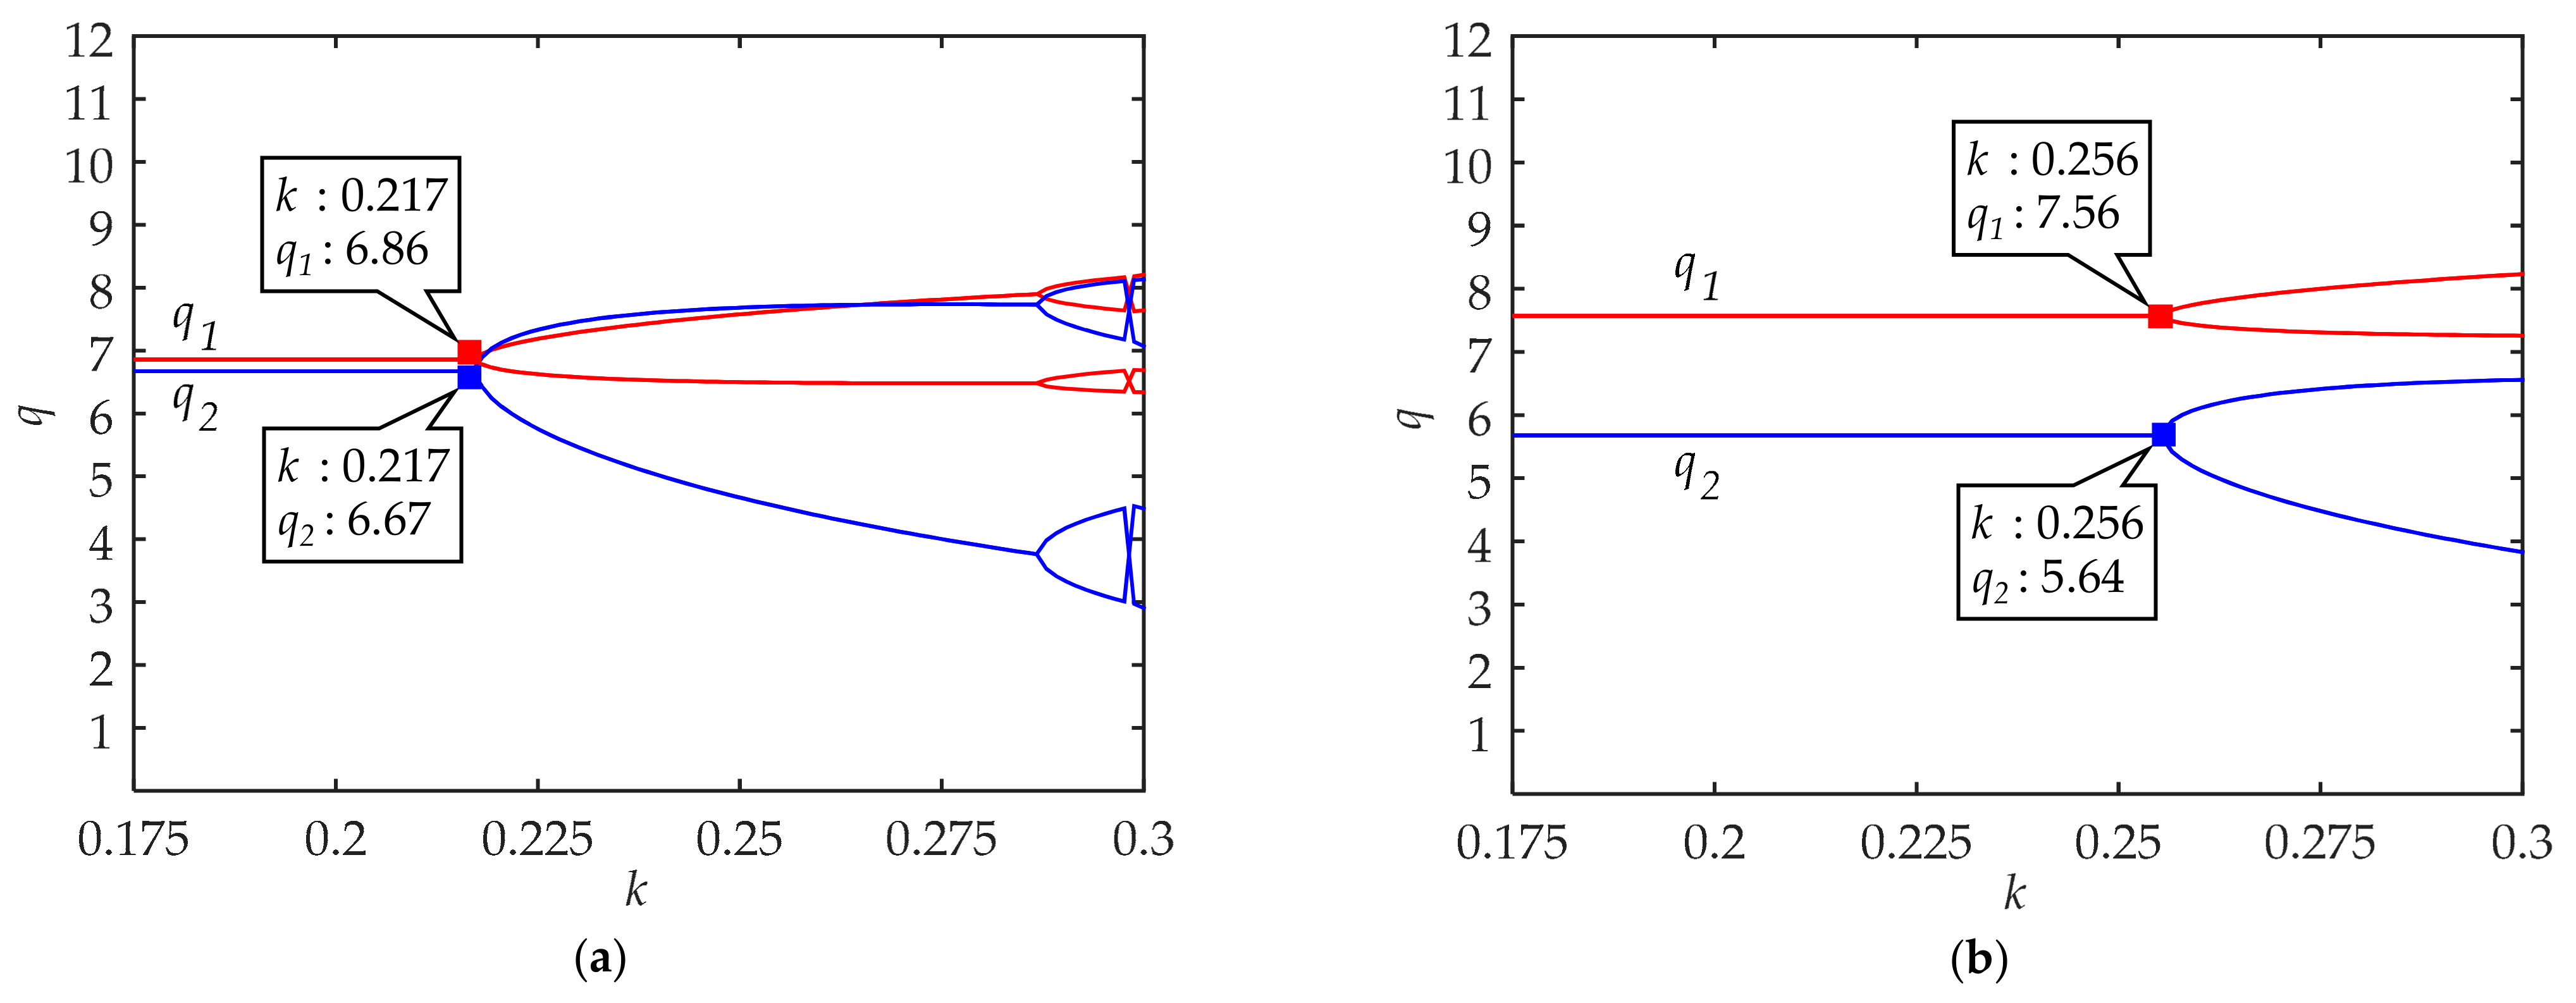
3.2.2. Simulation Results of Cities with Undeveloped Traffic Systems
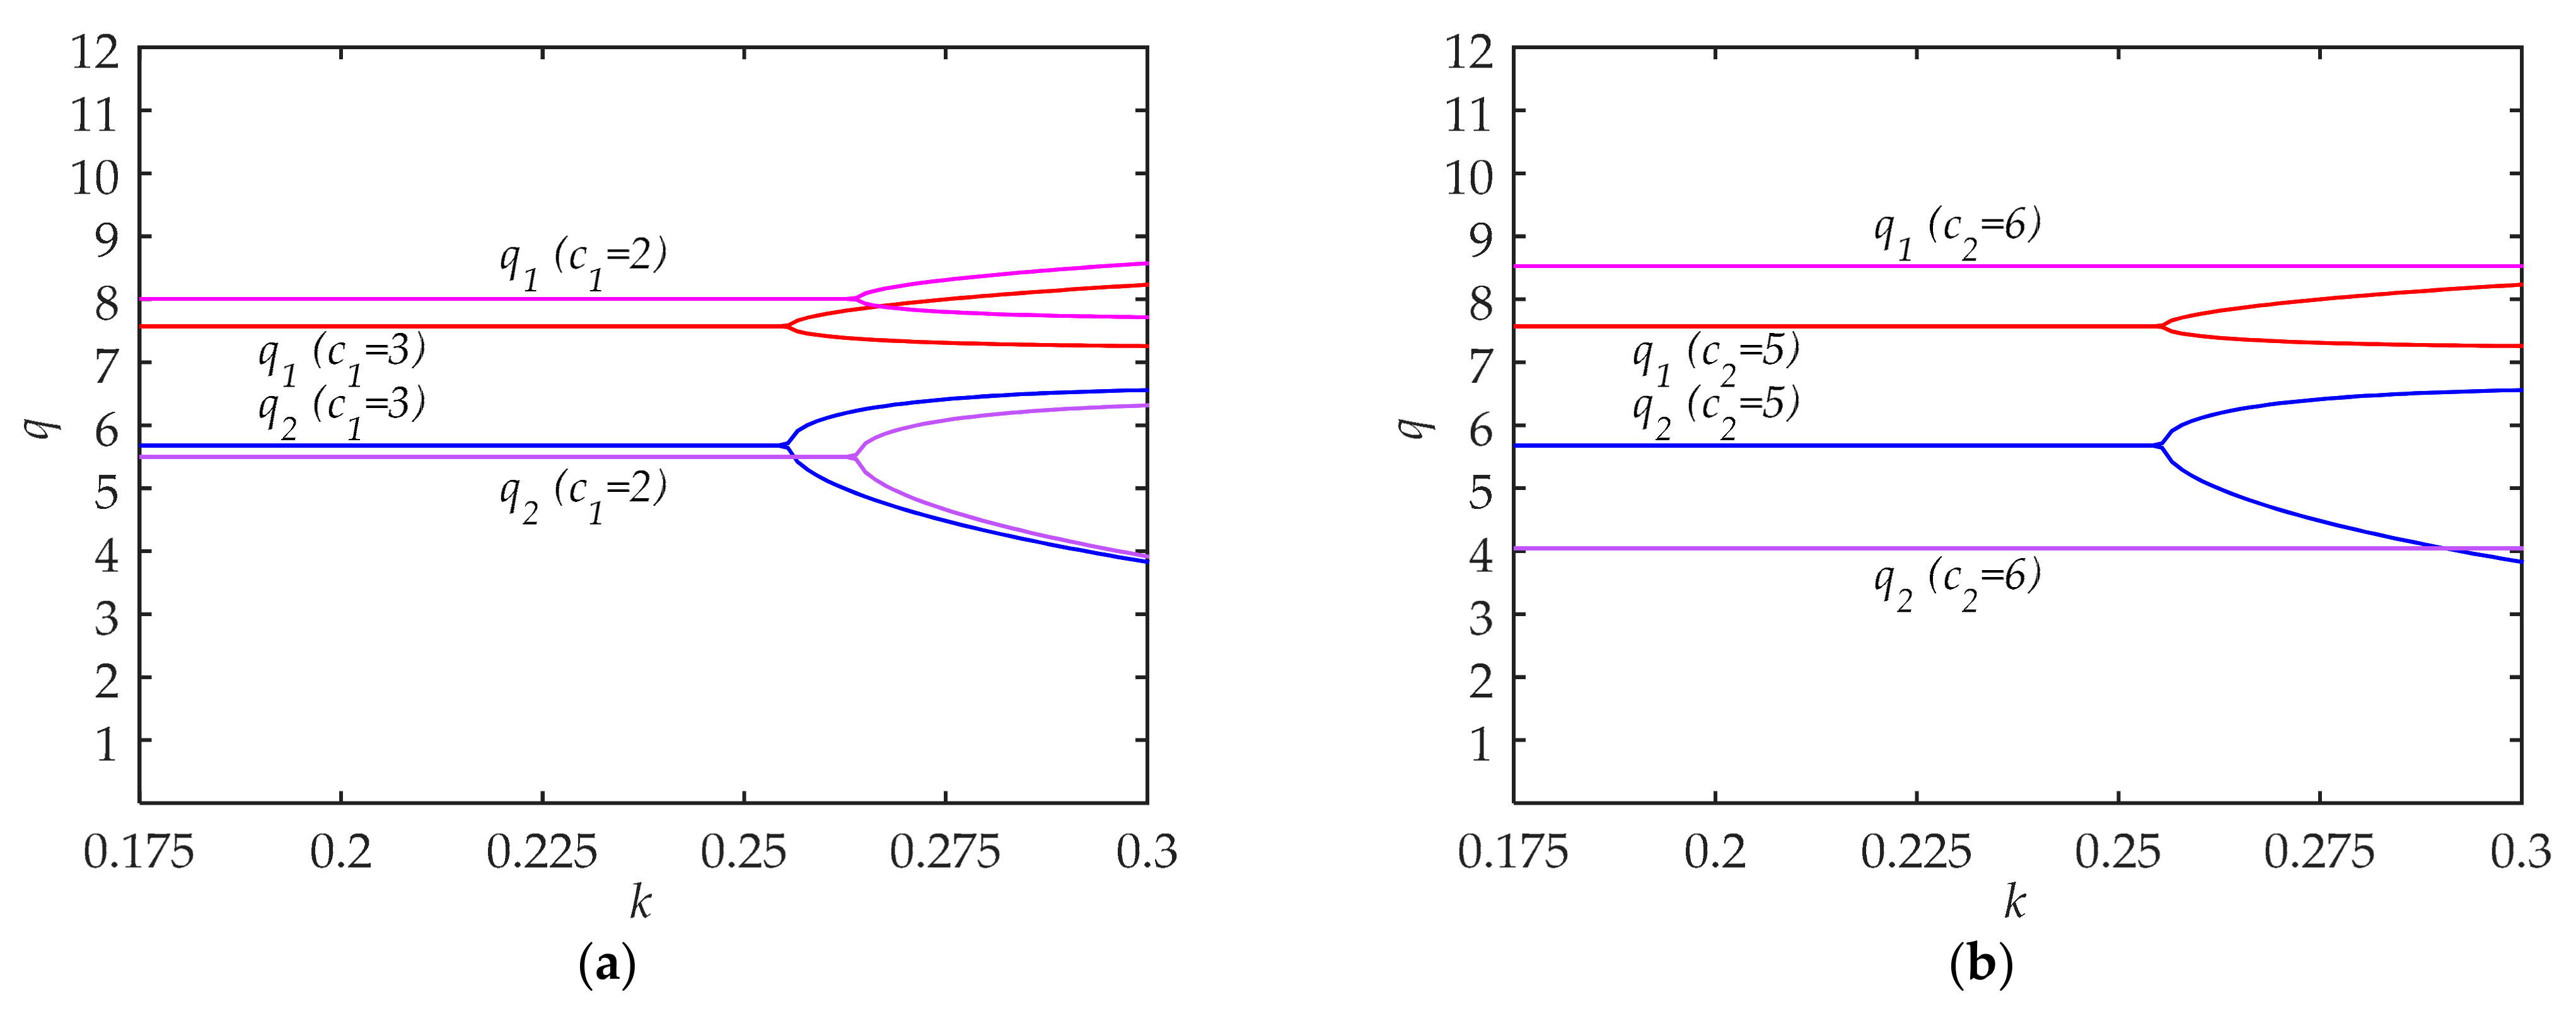
3.2.3. Simulation of the Impact of and in Cities with Undeveloped Traffic Systems
4. Discussion
4.1. Influence of Adjusting Rate k on System Stability
4.2. Effects of Low-Carbon Awareness in Travel Choice
4.3. Measures to Achieve Urban Low-Carbon Traffic
5. Conclusions
Author Contributions
Funding
Institutional Review Board Statement
Informed Consent Statement
Data Availability Statement
Acknowledgments
Conflicts of Interest
References
- Lu, X.; Ota, K.; Dong, M.; Yu, C.; Jin, H. Predicting transportation carbon emission with urban big data. IEEE Trans. Sustain. Comput. 2017, 2, 333–344. [Google Scholar] [CrossRef] [Green Version]
- Cheng, Y.H.; Chang, Y.H.; Lu, I.J. Urban transportation energy and carbon dioxide emission reduction strategies. Appl. Energy 2015, 157, 953–973. [Google Scholar] [CrossRef] [PubMed]
- Guan, C.; Srinivasan, S.; Nielsen, C.P. Does neighborhood form influence low-carbon transportation in china? Transp. Res. Part D Transp. Environ. 2019, 67, 406–420. [Google Scholar] [CrossRef]
- Olner, D.; Mitchell, G.; Heppenstall, A.; Pryce, G. The spatial economics of energy justice: Modelling the trade impacts of increased transport costs in a low carbon transition and the implications for uk regional inequality. Energy Policy 2020, 140, 111378. [Google Scholar] [CrossRef]
- Puškár, M.; Kopas, M. System based on thermal control of the hcci technology developed for reduction of the vehicle nox emissions in order to fulfil the future standard euro 7. Sci. Total Environ. 2018, 643, 674–680. [Google Scholar] [CrossRef]
- Marsden, G.; Anable, J.; Chatterton, T.; Docherty, I.; Faulconbridge, J.; Murray, L.; Roby, H.; Shires, J. Studying disruptive events: Innovations in behaviour, opportunities for lower carbon transport policy? Transp. Policy 2020, 94, 89–101. [Google Scholar] [CrossRef]
- Kivimaa, P.; Virkamäki, V. Policy mixes, policy interplay and low carbon transitions: The case of passenger transport in finland. Environ. Policy Gov. 2014, 24, 28–41. [Google Scholar] [CrossRef]
- Zhang, B.; Chen, H.; Du, Z.; Wang, Z. Does license plate rule induce low-carbon choices in residents’ daily travels: Motivation and impacts. Renew. Sustain. Energy Rev. 2020, 124, 109780. [Google Scholar] [CrossRef]
- Kimms, A.; Kozeletskyi, I. Consideration of multiple objectives in horizontal cooperation with an application to transportation planning. Iise Trans. 2017, 49, 1160–1171. [Google Scholar] [CrossRef]
- Qian, X.; Ukkusuri, S.V. Taxi market equilibrium with third-party hailing service. Transp. Res. Part B Methodol. 2017, 100, 43–63. [Google Scholar] [CrossRef]
- Bergland, H.; Pedersen, P.A. Efficiency and traffic safety with pay for performance in road transportation. Transp. Res. Part B Methodol. 2019, 130, 21–35. [Google Scholar] [CrossRef]
- Rosenthal, E.C. A cooperative game approach to cost allocation in a rapid-transit network. Transp. Res. Part B Methodol. 2017, 97, 64–77. [Google Scholar] [CrossRef]
- Algaba, E.; Fragnelli, V.; Llorca, N.; Sánchez-Soriano, J. Horizontal cooperation in a multimodal public transport system: The profit allocation problem. Eur. J. Oper. Res. 2019, 275, 659–665. [Google Scholar] [CrossRef]
- Yoo, J.; Langari, R. A predictive perception model and control strategy for collision-free autonomous driving. IEEE Trans. Intell. Transp. 2019, 20, 4078–4091. [Google Scholar] [CrossRef]
- Mandziuk, J. New shades of the vehicle routing problem: Emerging problem formulations and computational intelligence solution methods. IEEE Trans. Emerg. Top. Comput. Intell. 2019, 3, 230–244. [Google Scholar] [CrossRef]
- Tian, Z.; Gao, X.; Su, S.; Qiu, J.; Du, X.; Guizani, M. Evaluating reputation management schemes of internet of vehicles based on evolutionary game theory. IEEE Trans. Veh. Technol. 2019, 68, 5971–5980. [Google Scholar] [CrossRef] [Green Version]
- Du, Q.; Yan, Y.; Huang, Y.; Hao, C.; Wu, J. Evolutionary games of low-carbon behaviors of construction stakeholders under carbon taxes. Int. J. Environ. Res. Public Health 2021, 18, 508. [Google Scholar] [CrossRef] [PubMed]
- Encarnacao, S.; Santos, F.P.; Santos, F.C.; Blass, V.; Pacheco, J.M.; Portugali, J. Paths to the adoption of electric vehicles: An evolutionary game theoretical approach. Transp. Res. B Meth. 2018, 113, 24–33. [Google Scholar] [CrossRef]
- Kellner, F.; Schneiderbauer, M. Further insights into the allocation of greenhouse gas emissions to shipments in road freight transportation: The pollution routing game. Eur. J. Oper. Res. 2019, 278, 296–313. [Google Scholar] [CrossRef]
- Cai, L.; Lei, M.; Zhang, S.; Yu, Y.; Zhou, T.; Qin, J. A noise-immune lstm network for short-term traffic flow forecasting. Chaos Interdiscip. J. Nonlinear Sci. 2020, 30, 23135. [Google Scholar] [CrossRef] [PubMed]
- Xu, D.; Dai, H.; Wang, Y.; Peng, P.; Xuan, Q.; Guo, H. Road traffic state prediction based on a graph embedding recurrent neural network under the scats. Chaos Interdiscip. J. Nonlinear Sci. 2019, 29, 103125. [Google Scholar] [CrossRef]
- Li, Y.; Jiang, X.; Zhu, H.; He, X.; Peeta, S.; Zheng, T.; Li, Y. Multiple measures-based chaotic time series for traffic flow prediction based on bayesian theory. Nonlinear Dynam. 2016, 85, 179–194. [Google Scholar] [CrossRef]
- Peng, J.; Xuan, Z.M.; Ling, H.M.; Long, C. Travel mode and travel route choice behavior based on random regret minimization: A systematic review. Sustainability 2018, 10. [Google Scholar] [CrossRef] [Green Version]
- Chen, J.; Li, S. Mode choice model for public transport with categorized latent variables. Math. Probl. Eng. 2017, 2017, 1–11. [Google Scholar] [CrossRef] [Green Version]
- Liu, D.; Du, H.; Southworth, F.; Ma, S. The influence of social-psychological factors on the intention to choose low-carbon travel modes in tianjin, china. Transp. Res. Part A Policy Pract. 2017, 105, 42–53. [Google Scholar] [CrossRef]
- Calastri, C.; Borghesi, S.; Fagiolo, G. How do people choose their commuting mode? An evolutionary approach to travel choices. Econ. Politica 2019, 36, 887–912. [Google Scholar] [CrossRef] [Green Version]
- Hou, Q.; Hou, Q.; Zhang, X.; Zhang, X.; Li, B.; Li, B.; Zhang, X.; Zhang, X.; Wang, W.; Wang, W. Identification of low-carbon travel block based on gis hotspot analysis using spatial distribution learning algorithm. Neural Comput. Appl. 2019, 31, 4703–4713. [Google Scholar] [CrossRef]
- Peng, Y.; Lu, Q.; Xiao, Y. A dynamic stackelberg duopoly model with different strategies. ChaosSolitons Fractals 2016, 85, 128–134. [Google Scholar] [CrossRef]
- Changwei, Y.; Xinxin, W.; Huapu, L.; Changzhi, B. Road network equilibrium traffic assignment method based on stackelberg game. China J. Highw. Transp. 2009, 22, 89–93. [Google Scholar] [CrossRef]
- Anderson, R.W. Some theory of inverse demand for applied demand analysis. Eur. Econ. Rev. 1980, 14, 281–290. [Google Scholar] [CrossRef]
- Hörcher, D.; Graham, D.J. Demand imbalances and multi-period public transport supply. Transp. Res. Part B Methodol. 2018, 108, 106–126. [Google Scholar] [CrossRef] [Green Version]
- Xiaoguo, J. Economic efficiency analysis of differential duopoly game equilibrium. Stat. Decis. 2012, 36–38. [Google Scholar] [CrossRef]
- Dubiel-Teleszynski, T. Nonlinear dynamics in a heterogeneous duopoly game with adjusting players and diseconomies of scale. Commun. Nonlinear Sci. 2011, 16, 296–308. [Google Scholar] [CrossRef]
- Sugiyanto, G. The effect of congestion pricing scheme on the generalized cost and speed of a motorcycle. Walailak J. Sci. Technol. 2018, 95–106. [Google Scholar] [CrossRef]
- Klinger, T.; Lanzendorf, M. Moving between mobility cultures: What affects the travel behavior of new residents? Transportation 2016, 43, 243–271. [Google Scholar] [CrossRef]
- Adler, N.; Brudner, A.; Proost, S. A review of transport market modeling using game-theoretic principles. Eur. J. Oper. Res. 2020. [Google Scholar] [CrossRef]
- Lingxuan, Z.; Menendez, M.; Shixing, Z.; Bin, S. An analysis of traffic cost of different transport modes considering city block size. J. Transp. Syst. Eng. Inf. Technol. 2019, 19, 166–174. [Google Scholar] [CrossRef]
- Lu, J.; Li, B.; Li, H.; Al-Barakani, A. Expansion of city scale, traffic modes, traffic congestion, and air pollution. Cities 2021, 108, 102974. [Google Scholar] [CrossRef]
- Li, J.; Lo, K.; Guo, M. Do socio-economic characteristics affect travel behavior? A comparative study of low-carbon and non-low-carbon shopping travel in shenyang city, china. Int. J. Environ. Res. Public Health 2018, 15, 1346. [Google Scholar] [CrossRef] [PubMed] [Green Version]
- Wu, G. The impact of tourists’ environmental and climate satisfaction on environmental restoring awareness in seashore tourist resort. J. Coast. Res. 2020, 115, 208. [Google Scholar] [CrossRef]


| Lv 0 | Lv 1 | Lv 2 | Lv 3 | Lv 4 | Lv 5 | Lv 6 | Lv 7 | Lv 8 | Lv 9 | Lv 10 | Total | |
|---|---|---|---|---|---|---|---|---|---|---|---|---|
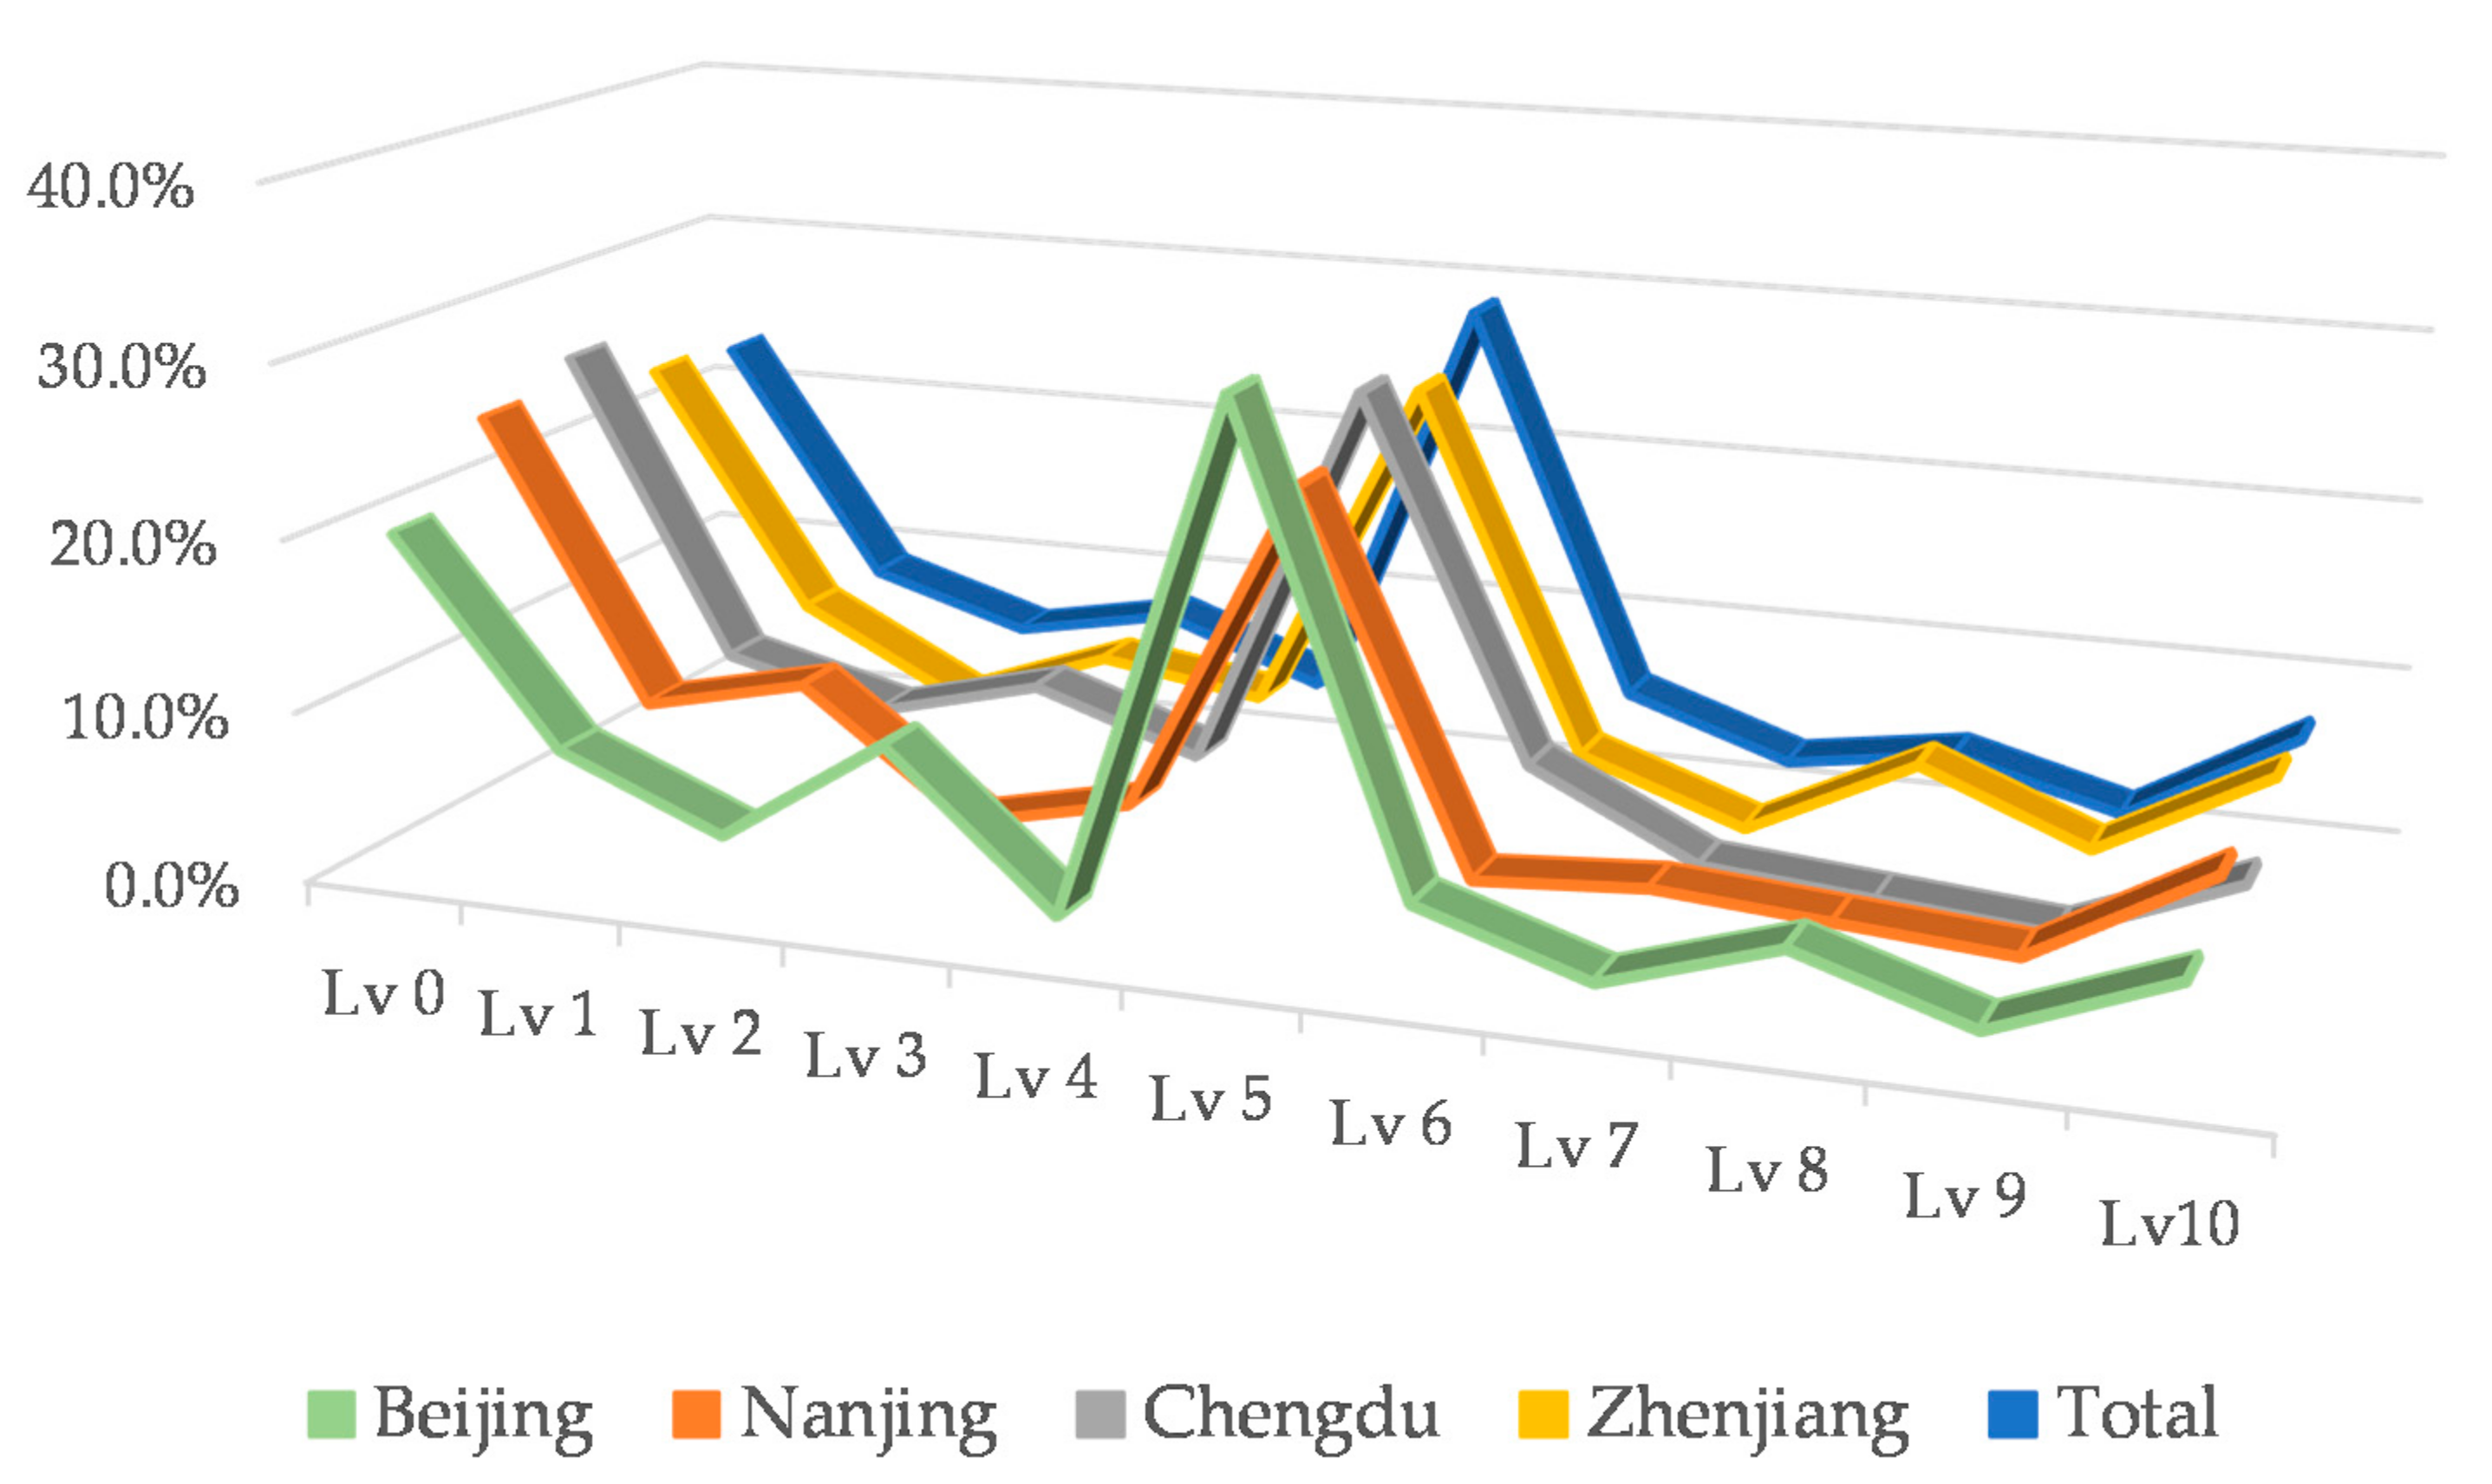
| Chengdu | 33 | 11 | 8 | 11 | 7 | 35 | 9 | 3 | 2 | 1 | 6 | 126 |
| Beijing | 26 | 11 | 6 | 14 | 3 | 41 | 7 | 3 | 7 | 3 | 8 | 129 |
| Nanjing | 35 | 12 | 15 | 5 | 8 | 35 | 5 | 6 | 5 | 4 | 12 | 142 |
| Zhenjiang | 48 | 19 | 9 | 16 | 13 | 53 | 10 | 3 | 13 | 5 | 16 | 205 |
| Others | 89 | 38 | 24 | 34 | 14 | 125 | 28 | 11 | 14 | 2 | 30 | 409 |
| Total | 231 | 91 | 62 | 80 | 45 | 289 | 59 | 26 | 41 | 15 | 72 | 1011 |
| Lv 0 | Lv 1 | Lv 2 | Lv 3 | Lv 4 | Lv 5 | Lv 6 | Lv 7 | Lv 8 | Lv 9 | Lv10 | |
|---|---|---|---|---|---|---|---|---|---|---|---|
| L-A | 29.0% | 10.0% | 7.0% | 8.0% | 5.0% | 28.0% | 3.0% | 2.0% | 3.0% | 1.0% | 4.0% |
| M-A | 22.8% | 9.0% | 6.1% | 7.9% | 4.5% | 28.6% | 5.8% | 2.6% | 4.1% | 1.5% | 7.1% |
| H-A | 16.0% | 6.0% | 4.0% | 6.0% | 3.0% | 28.0% | 9.0% | 6.0% | 8.0% | 4.0% | 10.0% |
Publisher’s Note: MDPI stays neutral with regard to jurisdictional claims in published maps and institutional affiliations. |
© 2021 by the authors. Licensee MDPI, Basel, Switzerland. This article is an open access article distributed under the terms and conditions of the Creative Commons Attribution (CC BY) license (http://creativecommons.org/licenses/by/4.0/).
Share and Cite
Wu, X.; He, R.; He, M. Chaos Analysis of Urban Low-Carbon Traffic Based on Game Theory. Int. J. Environ. Res. Public Health 2021, 18, 2285. https://doi.org/10.3390/ijerph18052285
Wu X, He R, He M. Chaos Analysis of Urban Low-Carbon Traffic Based on Game Theory. International Journal of Environmental Research and Public Health. 2021; 18(5):2285. https://doi.org/10.3390/ijerph18052285
Chicago/Turabian StyleWu, Xiaohui, Ren He, and Meiling He. 2021. "Chaos Analysis of Urban Low-Carbon Traffic Based on Game Theory" International Journal of Environmental Research and Public Health 18, no. 5: 2285. https://doi.org/10.3390/ijerph18052285