
Conceptualizing Vulnerability for Health Effects of the COVID-19 Pandemic and the Associated Measures in Utrecht and Zeist: A Concept Map

 , ,
, ,
Abstract
:1. Introduction
2. Materials and Methods
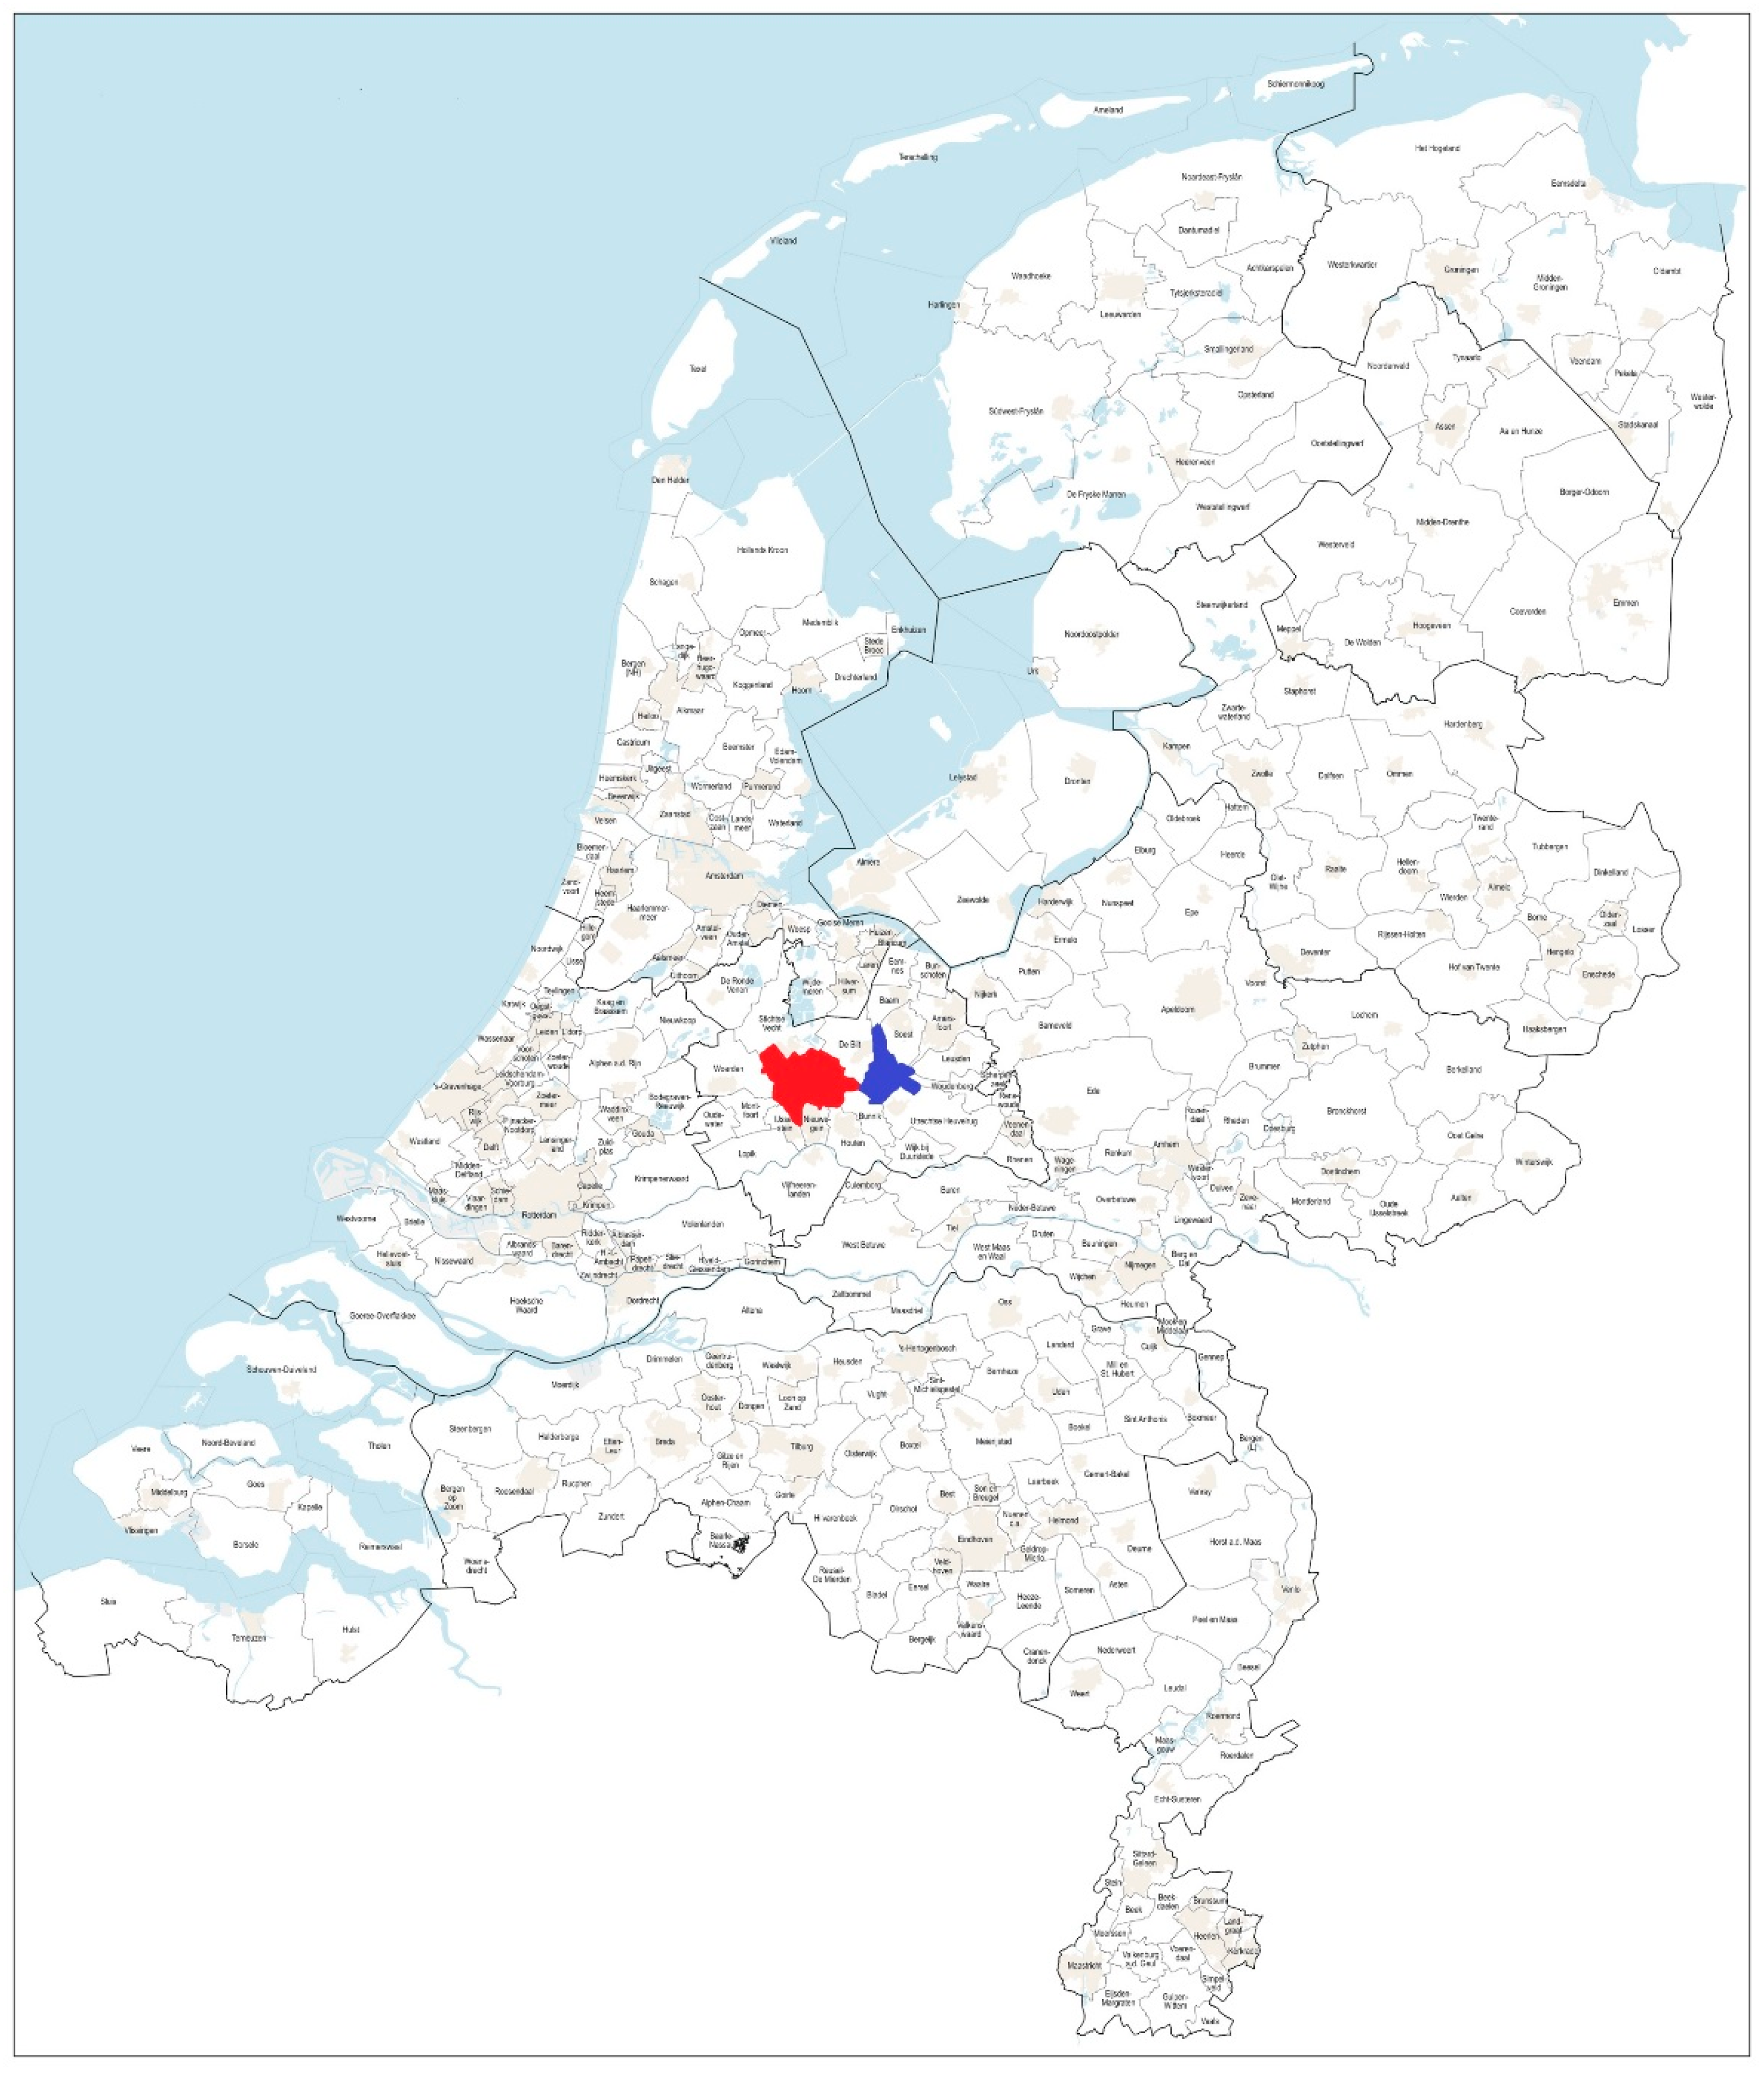
2.1. Step 1: Preparation
2.2. Step 2: Generation of Statements
2.3. Step 3: Structuring of Statements
2.4. Step 4: Graphical Representation of Statements
2.5. Step 5: Interpretation
2.6. Step 6: Implementation
3. Results
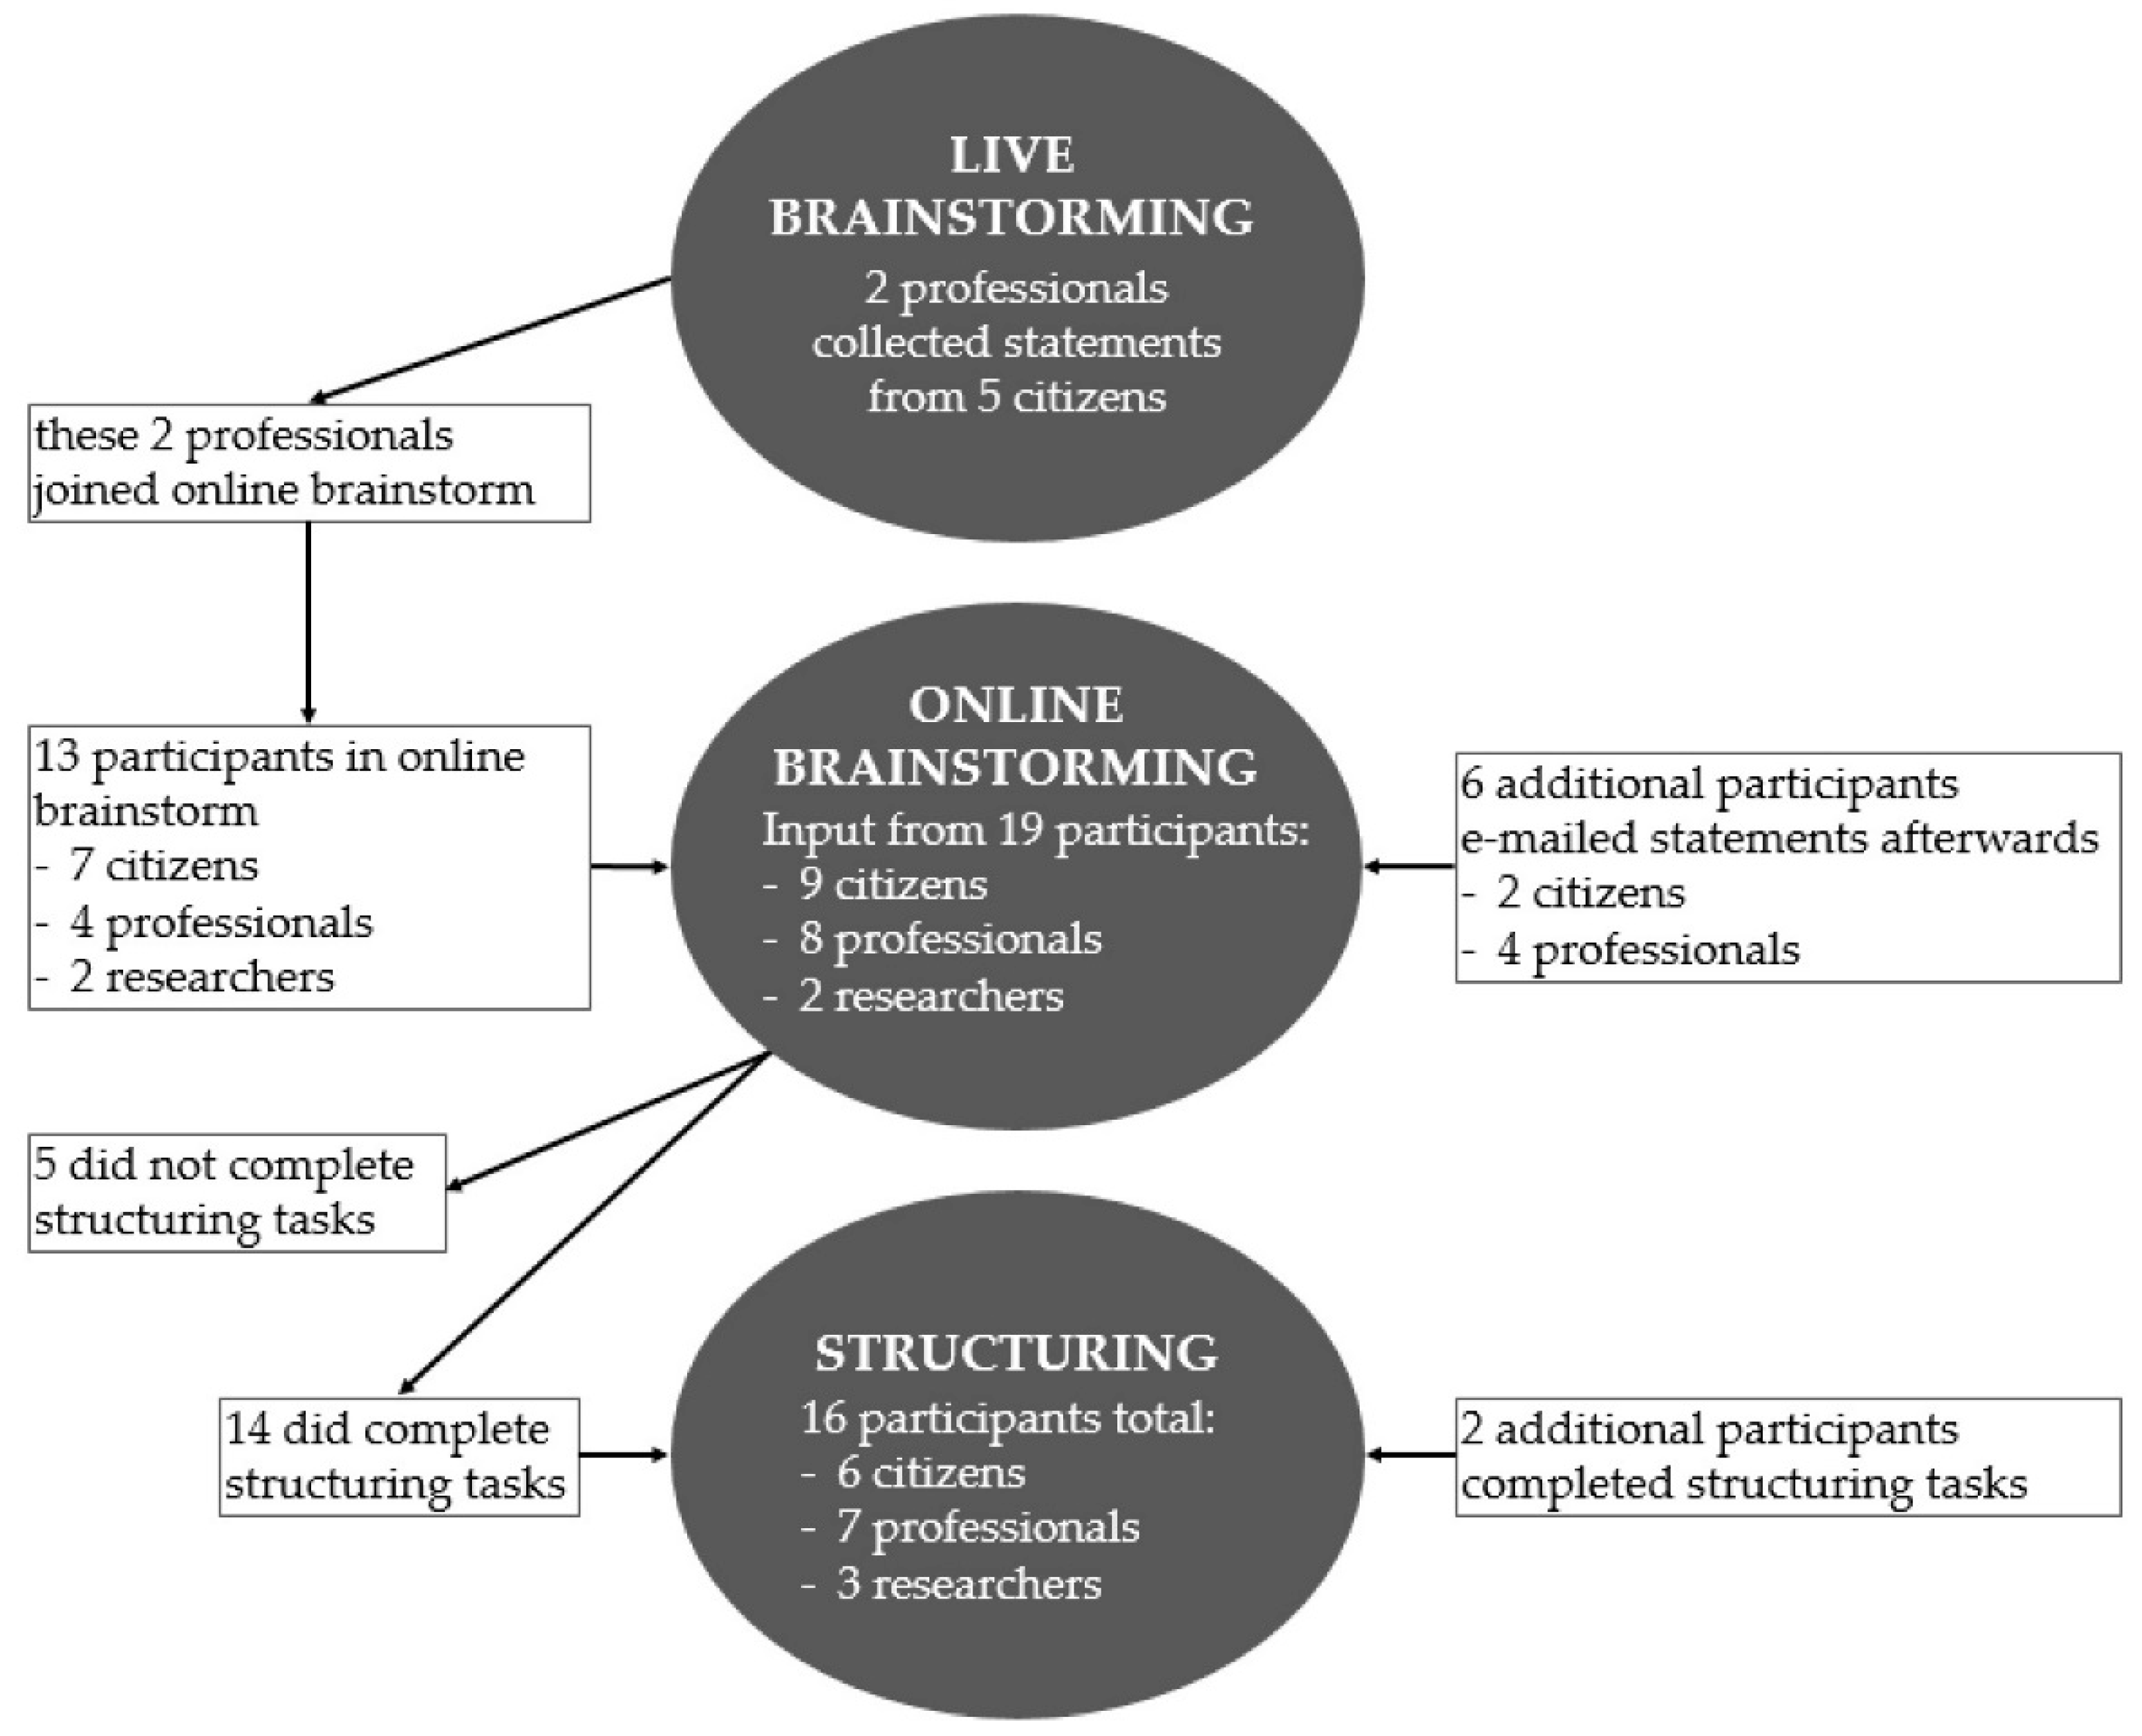
3.1. Participants
3.2. Statements and Clusters
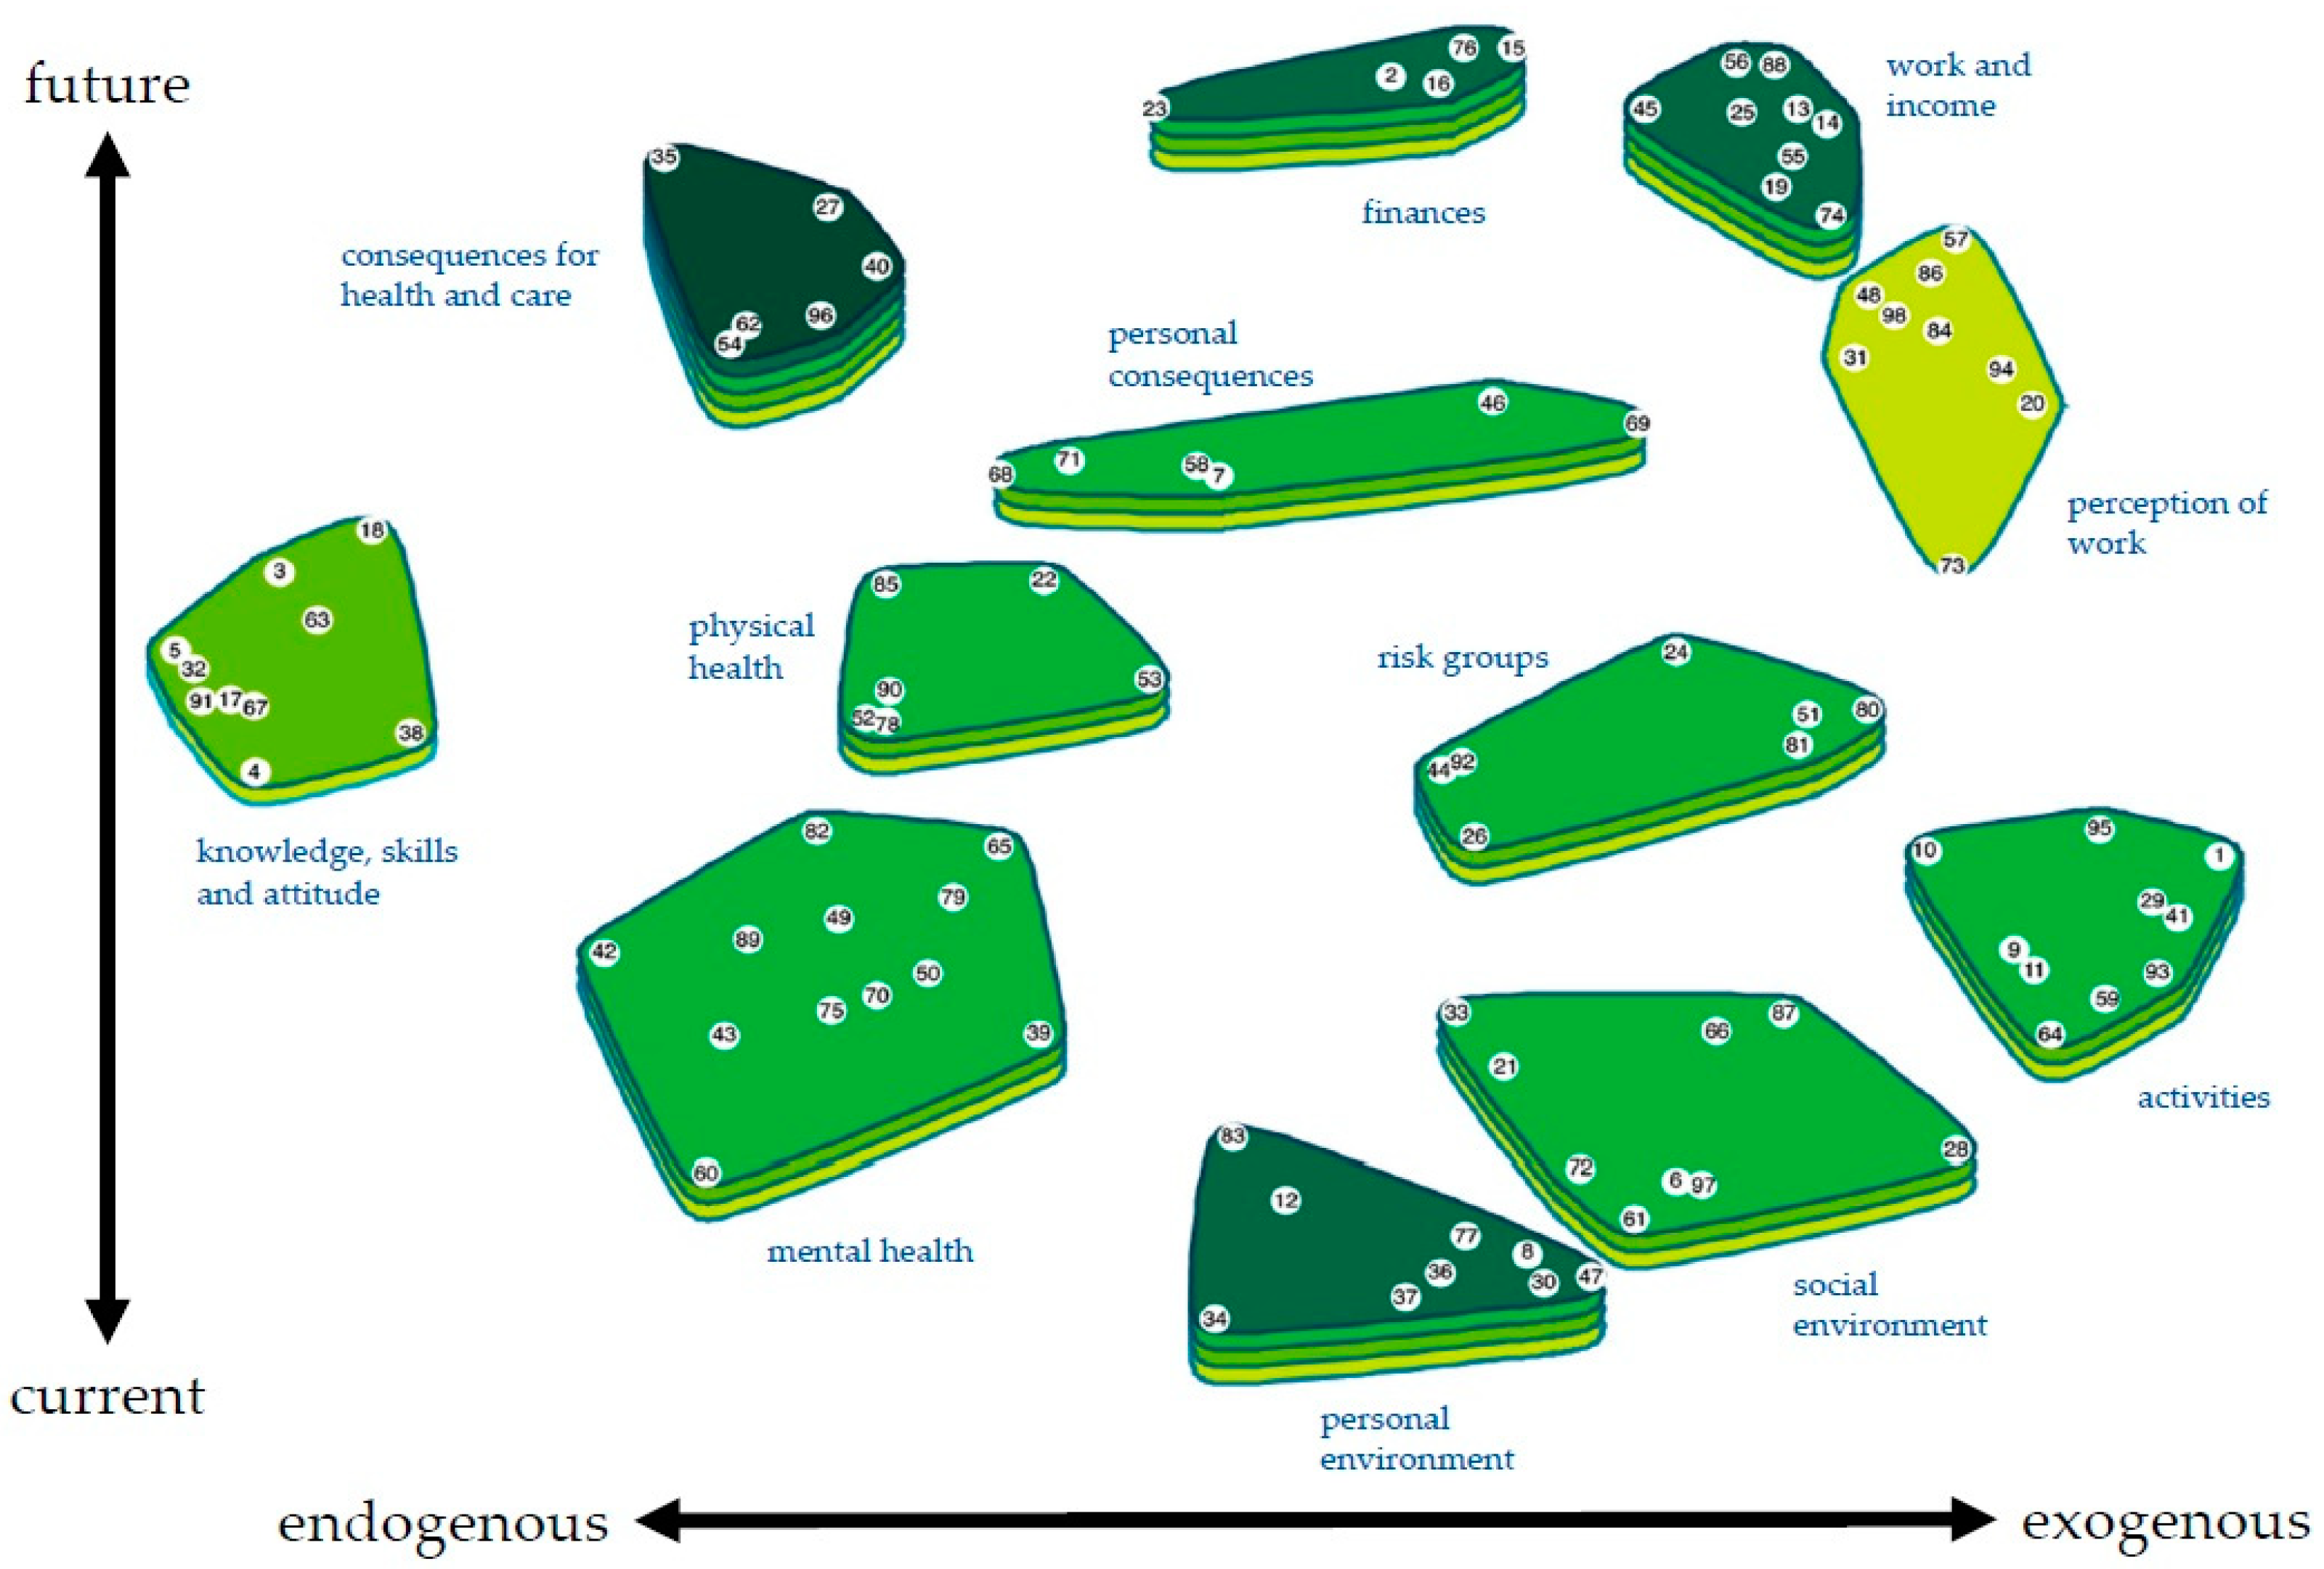
3.3. Description of the Concept Map
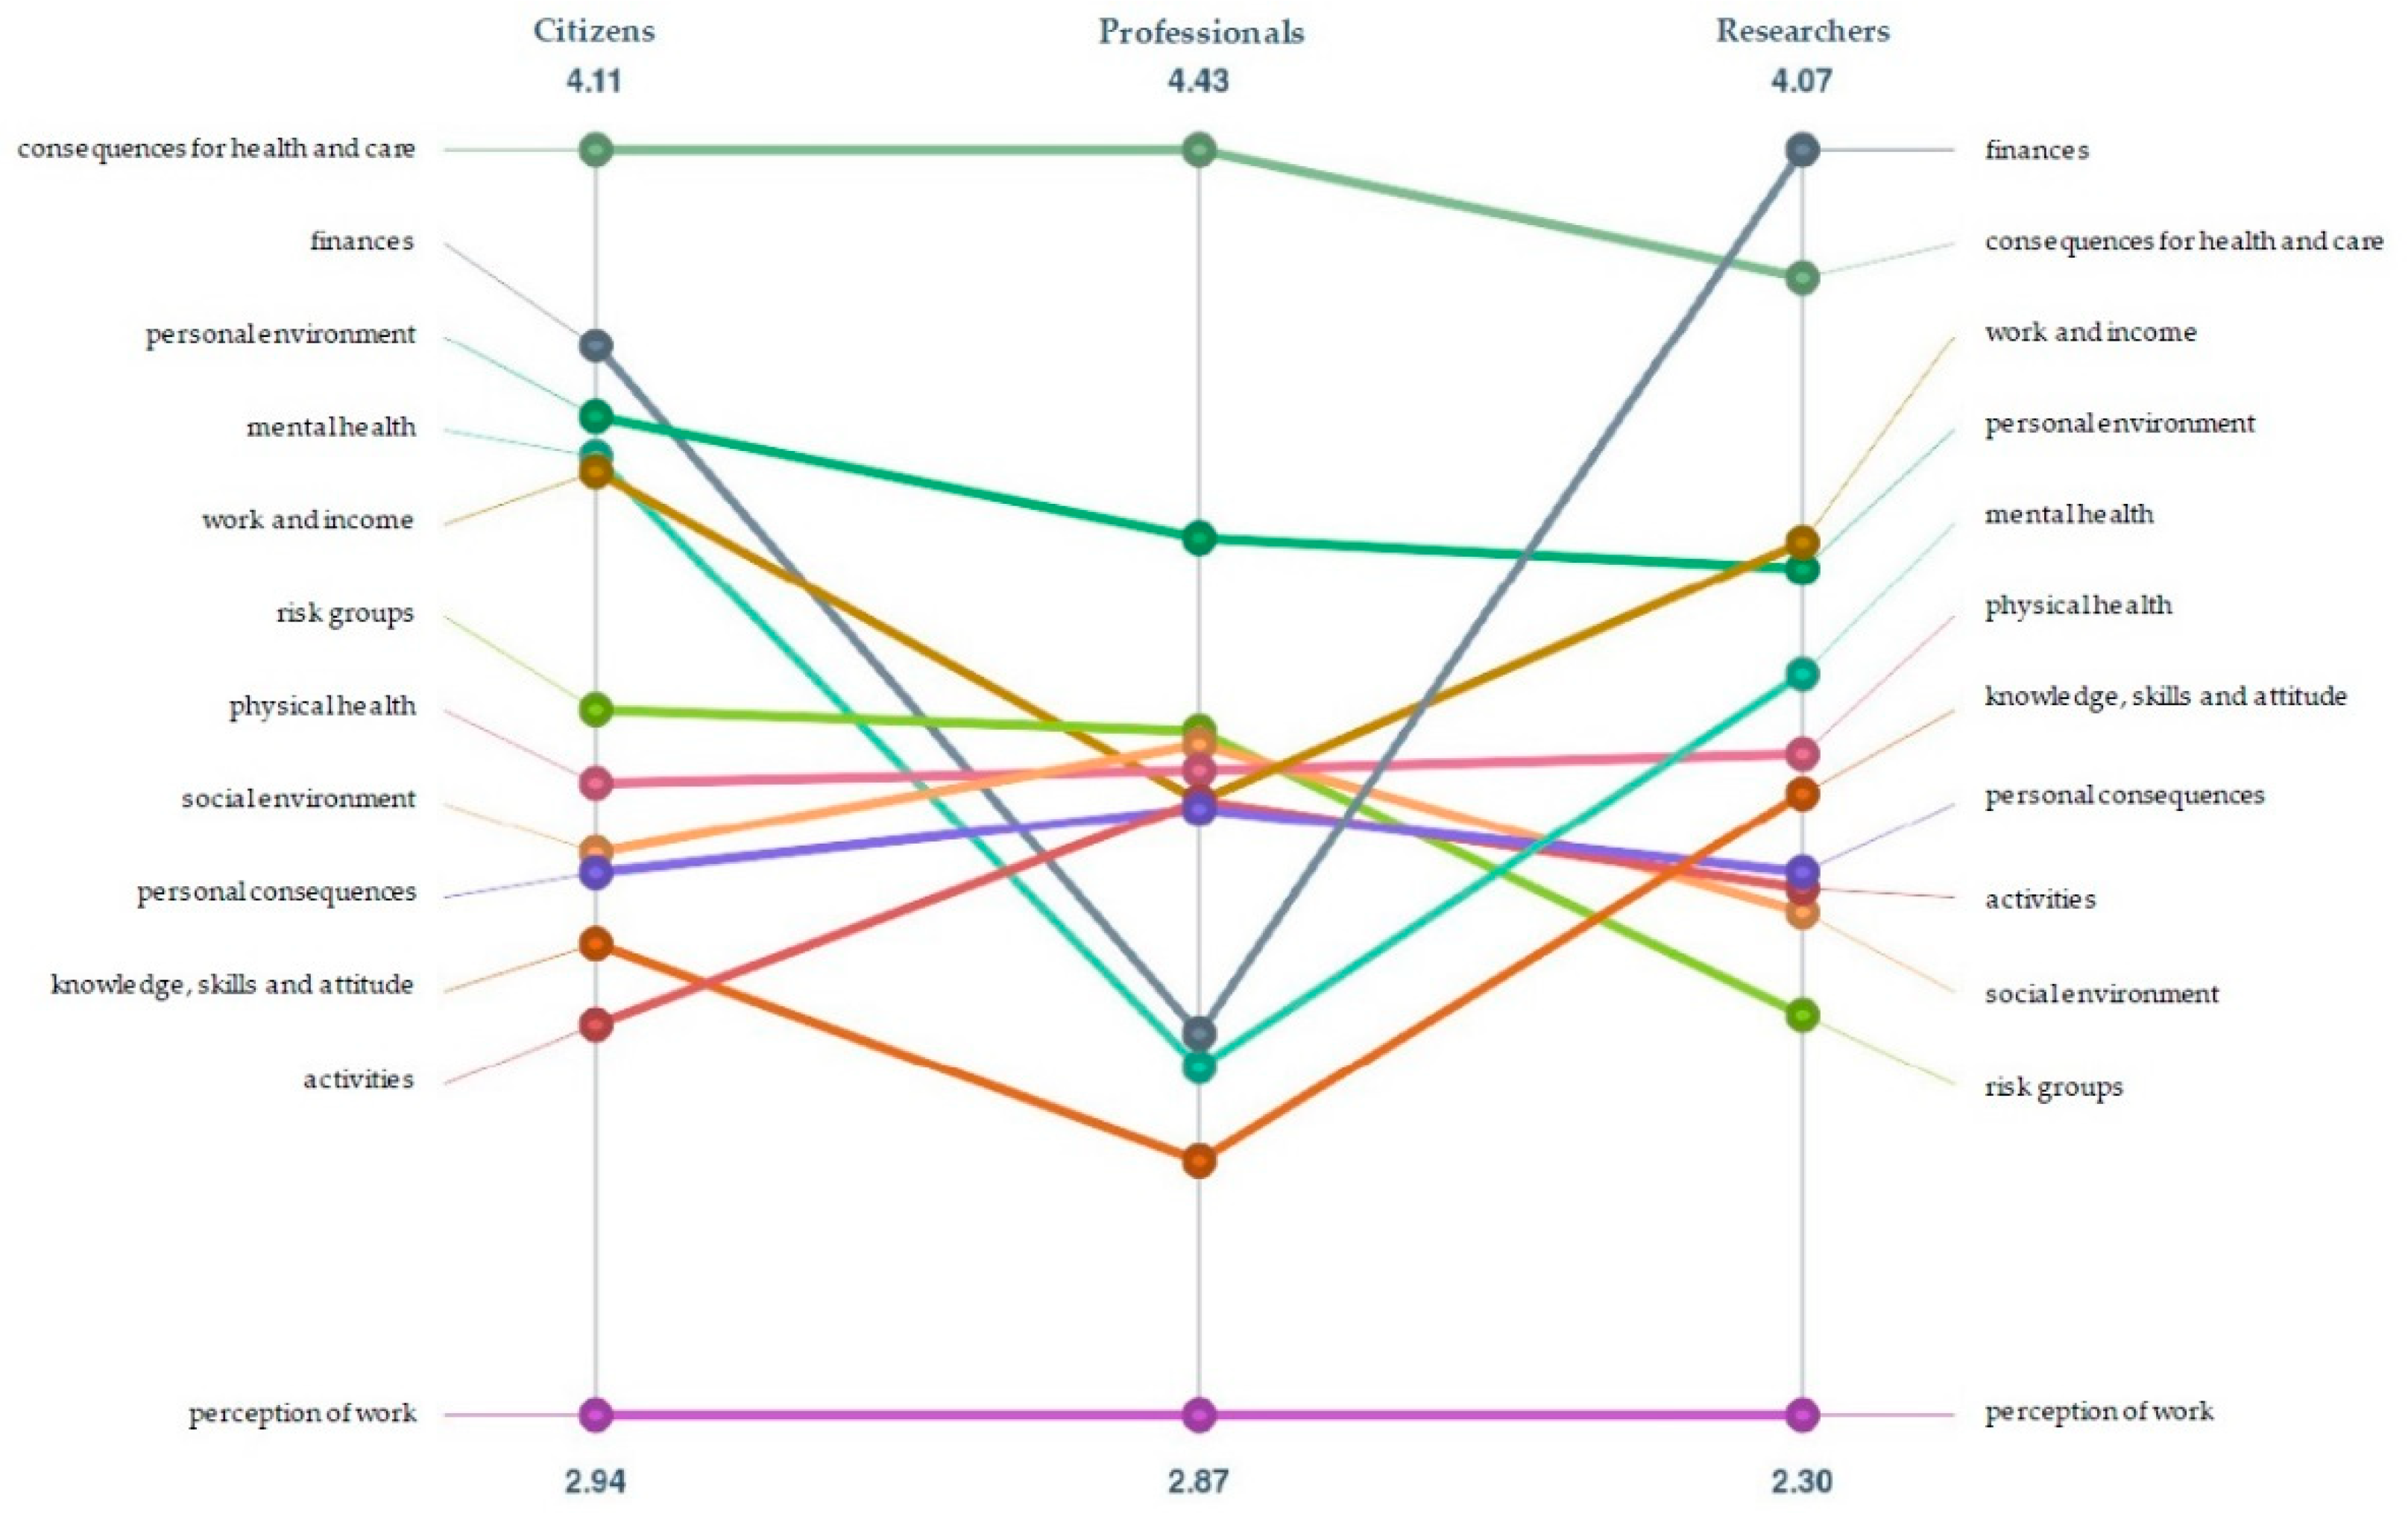
3.4. Comparing the Perspectives
4. Discussion
4.1. Implementation
4.2. Strengths and Limitations
4.3. Future Perspectives
5. Conclusions
Supplementary Materials
Author Contributions
Funding
Institutional Review Board Statement
Informed Consent Statement
Data Availability Statement
Acknowledgments
Conflicts of Interest
References
- Holmes, E.A.; O’Connor, R.C.; Perry, V.H.; Tracey, I.; Wessely, S.; Arseneault, L.; Ballard, C.; Christensen, H.; Sliver, R.C.; Everall, I.; et al. Multidisciplinary research priorities for the COVID-19 pandemic: A call for action for mental health science. Lancet Psychiatry 2020, 7, 547–560. [Google Scholar] [CrossRef]
- Pfefferbaum, B.; North, C.S. Mental Health and the COVID-19 Pandemic. N. Engl. J. Med. 2020, 383, 510–512. [Google Scholar] [CrossRef] [PubMed]
- Jordan, R.E.; Adab, P.; Cheng, K.K. COVID-19: Risk factors for severe disease and death. BMJ 2020, 368, m1198. [Google Scholar] [CrossRef] [PubMed] [Green Version]
- Van Giessen, A.; de Wit, A.; van den Brink, C.; Degeling, K.; Deuning, C.; Eeuwijk, J.; van den Ende, C.; van Gestel, I.; Gijsen, R.; van Gils, P.; et al. Impact van de Eerste COVID-19 Golf op de Reguliere Zorg en Gezondheid: Inventarisatie van de Omvang van Het Probleem en Eerste Schatting van Gezondheidseffecten; RIVM: Bilthoven, The Netherlands, 2020. [Google Scholar]
- Verder Kijken dan Corona, over de Toekomst van onze Gezondheid. Volksgezondheid Toekomst Verkenningen (E-magazine). 27 October 2020. Available online: https://www.volksgezondheidtoekomstverkenning.nl/magazine (accessed on 10 November 2021).
- CBS. Mentale Gezondheid in Eerste Helft 2021 op Dieptepunt. 3 September 2021. Available online: https://www.cbs.nl/nl-nl/nieuws/2021/35/mePRntale-gezondheid-in-eerste-helft-2021-op-dieptepunt (accessed on 10 November 2021).
- RIVM GGD GHOR Nederland en 25 GGD’en. Gedragswetenschappelijk Onderzoek naar Percepties, Gedrag en Welzijn van Burgers Tijdens de Corona Pandemie: Een Dynamic Cohort en Interview Studie. 5 November 2021. Available online: https://www.rivm.nl/gedragsonderzoek/maatregelen-welbevinden/welbevinden-en-leefstijl (accessed on 10 November 2021).
- COVID-19 op de Nederlandse Verpleegafdelingen. Patiëntkarakteristieken en Uitkomsten. 8 December 2020. Available online: https://www.stichting-nice.nl/COVID_rapport_afdeling.pdf (accessed on 5 November 2021).
- RIVM. Risicogroepen en COVID-19. 2020. Available online: https://www.rivm.nl/coronavirus-covid-19/risicogroepen (accessed on 5 November 2021).
- OECD. What Is the Impact of the COVID-19 Pandemic on Immigrants and Their Children? OECD: Paris, France, 2020. [Google Scholar]
- Ahmad, A.; Chung, R.; Eckenwiler, L.; Ganguli-Mitra, A.; Hunt, M.; Richards, R.; Saghai, Y.; Schwartz, L.; Scully, J.L.; Wild, V. What does it mean to be made vulnerable in the era of COVID-19? Lancet 2020, 395, 1481–1482. [Google Scholar] [CrossRef]
- Douglas, M.; Katikireddi, S.V.; Taulbut, M.; McKee, M.; McCartney, G. Mitigating the wider health effects of COVID-19 pandemic response. BMJ 2020, 369, m1557. [Google Scholar] [CrossRef] [PubMed]
- Raad voor Volksgezondheid en Samenleving. (Samen)leven Is Meer dan Overleven: Breder Kijken en Kiezen in Tijden van Corona; Raad voor Volksgezondheid & Samenleving: Den Haag, The Netherlands, 2020. [Google Scholar]
- Horton, R. Offline: COVID-19 is not a pandemic. Lancet 2020, 396, 874. [Google Scholar] [CrossRef]
- Bambra, C.; Riordan, R.; Ford, J.; Matthews, F. The COVID-19 pandemic and health inequalities. J. Epidemiol. Community Health 2020, 74, 964–968. [Google Scholar] [CrossRef] [PubMed]
- Mendenhall, E. The COVID-19 syndemic is not global: Context matters. Lancet 2020, 396, 1731. [Google Scholar] [CrossRef]
- Luna, F. Identifying and evaluating layers of vulnerability—A way forward. Dev. World Bioeth. 2019, 19, 86–95. [Google Scholar] [CrossRef] [PubMed] [Green Version]
- Chan, E.Y.Y.; Gobat, N.; Dubois, C.; Bedson, J.; de Almeida, J.R. Bottom-up citizen engagement for health emergency and disaster risk management: Directions since COVID-19. Lancet 2021, 398, 194–196. [Google Scholar] [CrossRef]
- Gilmore, B.; Ndejjo, R.; Tchetchia, A.; de Claro, V.; Mago, E.; A Diallo, A.; Lopes, C.; Bhattacharyya, S. Community engagement for COVID-19 prevention and control: A rapid evidence synthesis. BMJ Glob. Health 2020, 5, e003188. [Google Scholar] [CrossRef] [PubMed]
- World Health Organization. Risk Communication and Community Engagement Readiness and Response to Coronavirus Disease (COVID-19: Interim Guidance, 19 March 2020); World Health Organization: Geneva, Switzerland, 2020. [Google Scholar]
- O’Mara-Eves, A.; Brunton, G.; McDaid, G.; Oliver, S.; Kavanagh, J.; Jamal, F.; Matosevic, T.; Harden, A.; Thomas, J. Community engagement to reduce inequalities in health: A systematic review, meta-analysis and economic analysis. Public Health Res. 2013, 1. [Google Scholar] [CrossRef] [PubMed] [Green Version]
- Osborne, J.; Paget, J.; Napier, D.; Giles-Vernick, T.; Kutalek, R.; Rodyna, R.; Ahmed, S.M.; Dückers, M. Addressing vulnerabilities in communities facing infectious disease threats: A need for social science-driven assessments. J. Glob. Health 2021, 11, 03003. [Google Scholar] [CrossRef] [PubMed]
- Trochim, W.M.K. An introduction to concept mapping for planning and evaluation. Eval. Program Plan. 1989, 12, 1–16. [Google Scholar] [CrossRef]
- Van Bon-Martens, M.J.; van de Goor, I.A.; van Oers, H. Concept mapping as a method to enhance evidence-based public health. Eval. Program. Plan. 2017, 60, 213–228. [Google Scholar] [CrossRef] [PubMed]
- Nabitz, U.; van Randeraad-van der Zee, C.; Kok, I.; van Bon-Martens, M.; Serverens, P. An overview of concept mapping in Dutch mental health care. Eval. Program. Plan. 2017, 60, 202–212. [Google Scholar] [CrossRef]
- Van Bon-Martens, M.J.H.; Van de Goor, L.A.M.; Holsappel, J.C.; Kuunders, T.J.M.; Jacobs-van der Bruggen, M.A.M.; Te Brake, J.H.M.; van Oers, J.A.M. Concept mapping as a promising method to bring practice into science. Public Health 2014, 128, 504–514. [Google Scholar] [CrossRef] [PubMed]
- Rosas, S.R.; Kane, M. Quality and rigor of the concept mapping methodology: A pooled study analysis. Eval. Program. Plan. 2012, 35, 236–245. [Google Scholar] [CrossRef]
- The Concept System® Groupwisdom™ (Build 2021.24.01) [Web-Based Platform]. Ithaca, NY, USA. 2021. Available online: https://www.groupwisdom.tech (accessed on 4 November 2021).
- CBS StatLine. Available online: https://opendata.cbs.nl/#/CBS/nl/ (accessed on 4 November 2021).
- CBS Kerncijfers Wijken en Buurten 2021. Available online: https://www.cbs.nl/nl-nl/maatwerk/2021/31/kerncijfers-wijken-en-buurten-2021 (accessed on 4 November 2021).
- Basic Map Showing the 352 Dutch Municipalities as of 01/01/2021. Janwillemvanaalst, CC BY 4.0 <https://creativecommons.org/licenses/by/4.0>, via Wikimedia Commons. Available online: https://commons.wikimedia.org/wiki/File:2021-NL-Gemeenten-basis-2500px.png (accessed on 4 November 2021).
- Whitehead, M.; Dahlgren, G. Concepts and Principles for Tackling Social Inequities in Health: Levelling Up Part 1; WHO Regional Office for Europe: Copenhagen, Denmark, 2006. [Google Scholar]
- Bambra, C.; Gibson, M.; Sowden, A.; Wright, K.; Whitehead, M.; Petticrew, M. Tackling the wider social determinants of health and health inequalities: Evidence from systematic reviews. J. Epidemiol. Community Health 2010, 64, 284–291. [Google Scholar] [CrossRef] [Green Version]
- Singh, S.R.; Eghdami, M.R.; Singh, S. The concept of social vulnerability: A review from disasters perspectives. Int. J. Interdiscip. Multidiscip. Stud. 2014, 1, 71–82. [Google Scholar]
- Mayrhuber, E.A.; Dückers, M.L.; Wallner, P.; Arnberger, A.; Allex, B.; Wiesböck, L.; Wanka, A.; Kolland, F.; Rder, R.; Hutter, H.P.; et al. Vulnerability to heatwaves and implications for public health interventions—A scoping review. Environ. Res. 2018, 166, 42–54. [Google Scholar] [CrossRef] [Green Version]
- Kim, S.J.; Bostwick, W. Social Vulnerability and Racial Inequality in COVID-19 Deaths in Chicago. Health Educ. Behav. 2020, 47, 509–513. [Google Scholar] [CrossRef]
- Fiorenzato, E.; Zabberoni, S.; Costa, A.; Cona, G. Cognitive and mental health changes and their vulnerability factors related to COVID-19 lockdown in Italy. PLoS ONE 2021, 16, e0246204. [Google Scholar] [CrossRef]
- Blix, I.; Birkeland, M.S.; Thoresen, S. Worry and mental health in the COVID-19 pandemic: Vulnerability factors in the general Norwegian population. BMC Public Health 2021, 21, 928. [Google Scholar] [CrossRef] [PubMed]
- The, L. Redefining vulnerability in the era of COVID-19. Lancet 2020, 395, 1089. [Google Scholar]
- Pharos. Infosheet Corona en Vergroten van Gezondheidsverschillen; Pharos: Utrecht, The Netherlands, 2021. [Google Scholar]
- Huber, M.A.S. Towards a New, Dynamic Concept of Health. Its Operationalisation and Use in Public Health and Healthcare, and in Evaluating Health Effects of Food; Maastricht University: Maastricht, The Netherlands, 2014. [Google Scholar]
- Osborne, J.; Paget, J.; Giles-Vernick, T.; Kutalek, R.; Napier, D.; Baliatsas, C.; Dückers, M. Community engagement and vulnerability in infectious diseases: A systematic review and qualitative analysis of the literature. Soc. Sci. Med. 2021, 284, 114246. [Google Scholar] [CrossRef] [PubMed]
- Kane, M.; Trochim, W.M.K. Concept Mapping for Planning and Evaluation; SAGE Publications Inc.: Thousand Oaks, CA, USA, 2007. [Google Scholar]
- Napier, A.D. The Rapid Assessment of Vulnerable Populations: A ‘barefoot’ Manual; Department of Anthropology, University College London: London, UK, 2014. [Google Scholar]
- Jeleff, M.; Lehner, L.; Giles-Vernick, T.; Dückers, M.L.; Napier, A.D.; Jirovsky, E.; Kutalek, R. Vulnerability assessment tools for infectious threats and antimicrobial resistance: A scoping review protocol. BMJ Open 2019, 9, e031944. [Google Scholar] [CrossRef] [PubMed] [Green Version]


| No. | Cluster Label | Average Ranking 1 |
|---|---|---|
| 1 | Activities | 3.40 |
| 2 | Risk groups | 3.51 |
| 3 | Social environment | 3.48 |
| 4 | Personal environment | 3.83 |
| 5 | Finances | 3.70 |
| 6 | Work and income | 3.68 |
| 7 | Perception of work | 2.79 |
| 8 | Knowledge, skills and attitude | 3.25 |
| 9 | Mental health | 3.50 |
| 10 | Personal consequences | 3.45 |
| 11 | Physical health | 3.53 |
| 12 | Consequences for health and care | 4.21 |
Publisher’s Note: MDPI stays neutral with regard to jurisdictional claims in published maps and institutional affiliations. |
© 2021 by the authors. Licensee MDPI, Basel, Switzerland. This article is an open access article distributed under the terms and conditions of the Creative Commons Attribution (CC BY) license (https://creativecommons.org/licenses/by/4.0/).
Share and Cite
van der Ven, L.G.L.; Duinhof, E.L.; Dückers, M.L.A.; Jambroes, M.; van Bon-Martens, M.J.H. Conceptualizing Vulnerability for Health Effects of the COVID-19 Pandemic and the Associated Measures in Utrecht and Zeist: A Concept Map. Int. J. Environ. Res. Public Health 2021, 18, 12163. https://doi.org/10.3390/ijerph182212163
van der Ven LGL, Duinhof EL, Dückers MLA, Jambroes M, van Bon-Martens MJH. Conceptualizing Vulnerability for Health Effects of the COVID-19 Pandemic and the Associated Measures in Utrecht and Zeist: A Concept Map. International Journal of Environmental Research and Public Health. 2021; 18(22):12163. https://doi.org/10.3390/ijerph182212163
Chicago/Turabian Stylevan der Ven, Lilian G. L., Elisa L. Duinhof, Michel L. A. Dückers, Marielle Jambroes, and Marja J. H. van Bon-Martens. 2021. "Conceptualizing Vulnerability for Health Effects of the COVID-19 Pandemic and the Associated Measures in Utrecht and Zeist: A Concept Map" International Journal of Environmental Research and Public Health 18, no. 22: 12163. https://doi.org/10.3390/ijerph182212163