Strength and Speed Profiles Based on Age and Sex Differences in Young Basketball Players


Abstract
:1. Introduction
2. Materials and Methods
2.1. Design
2.2. Participants
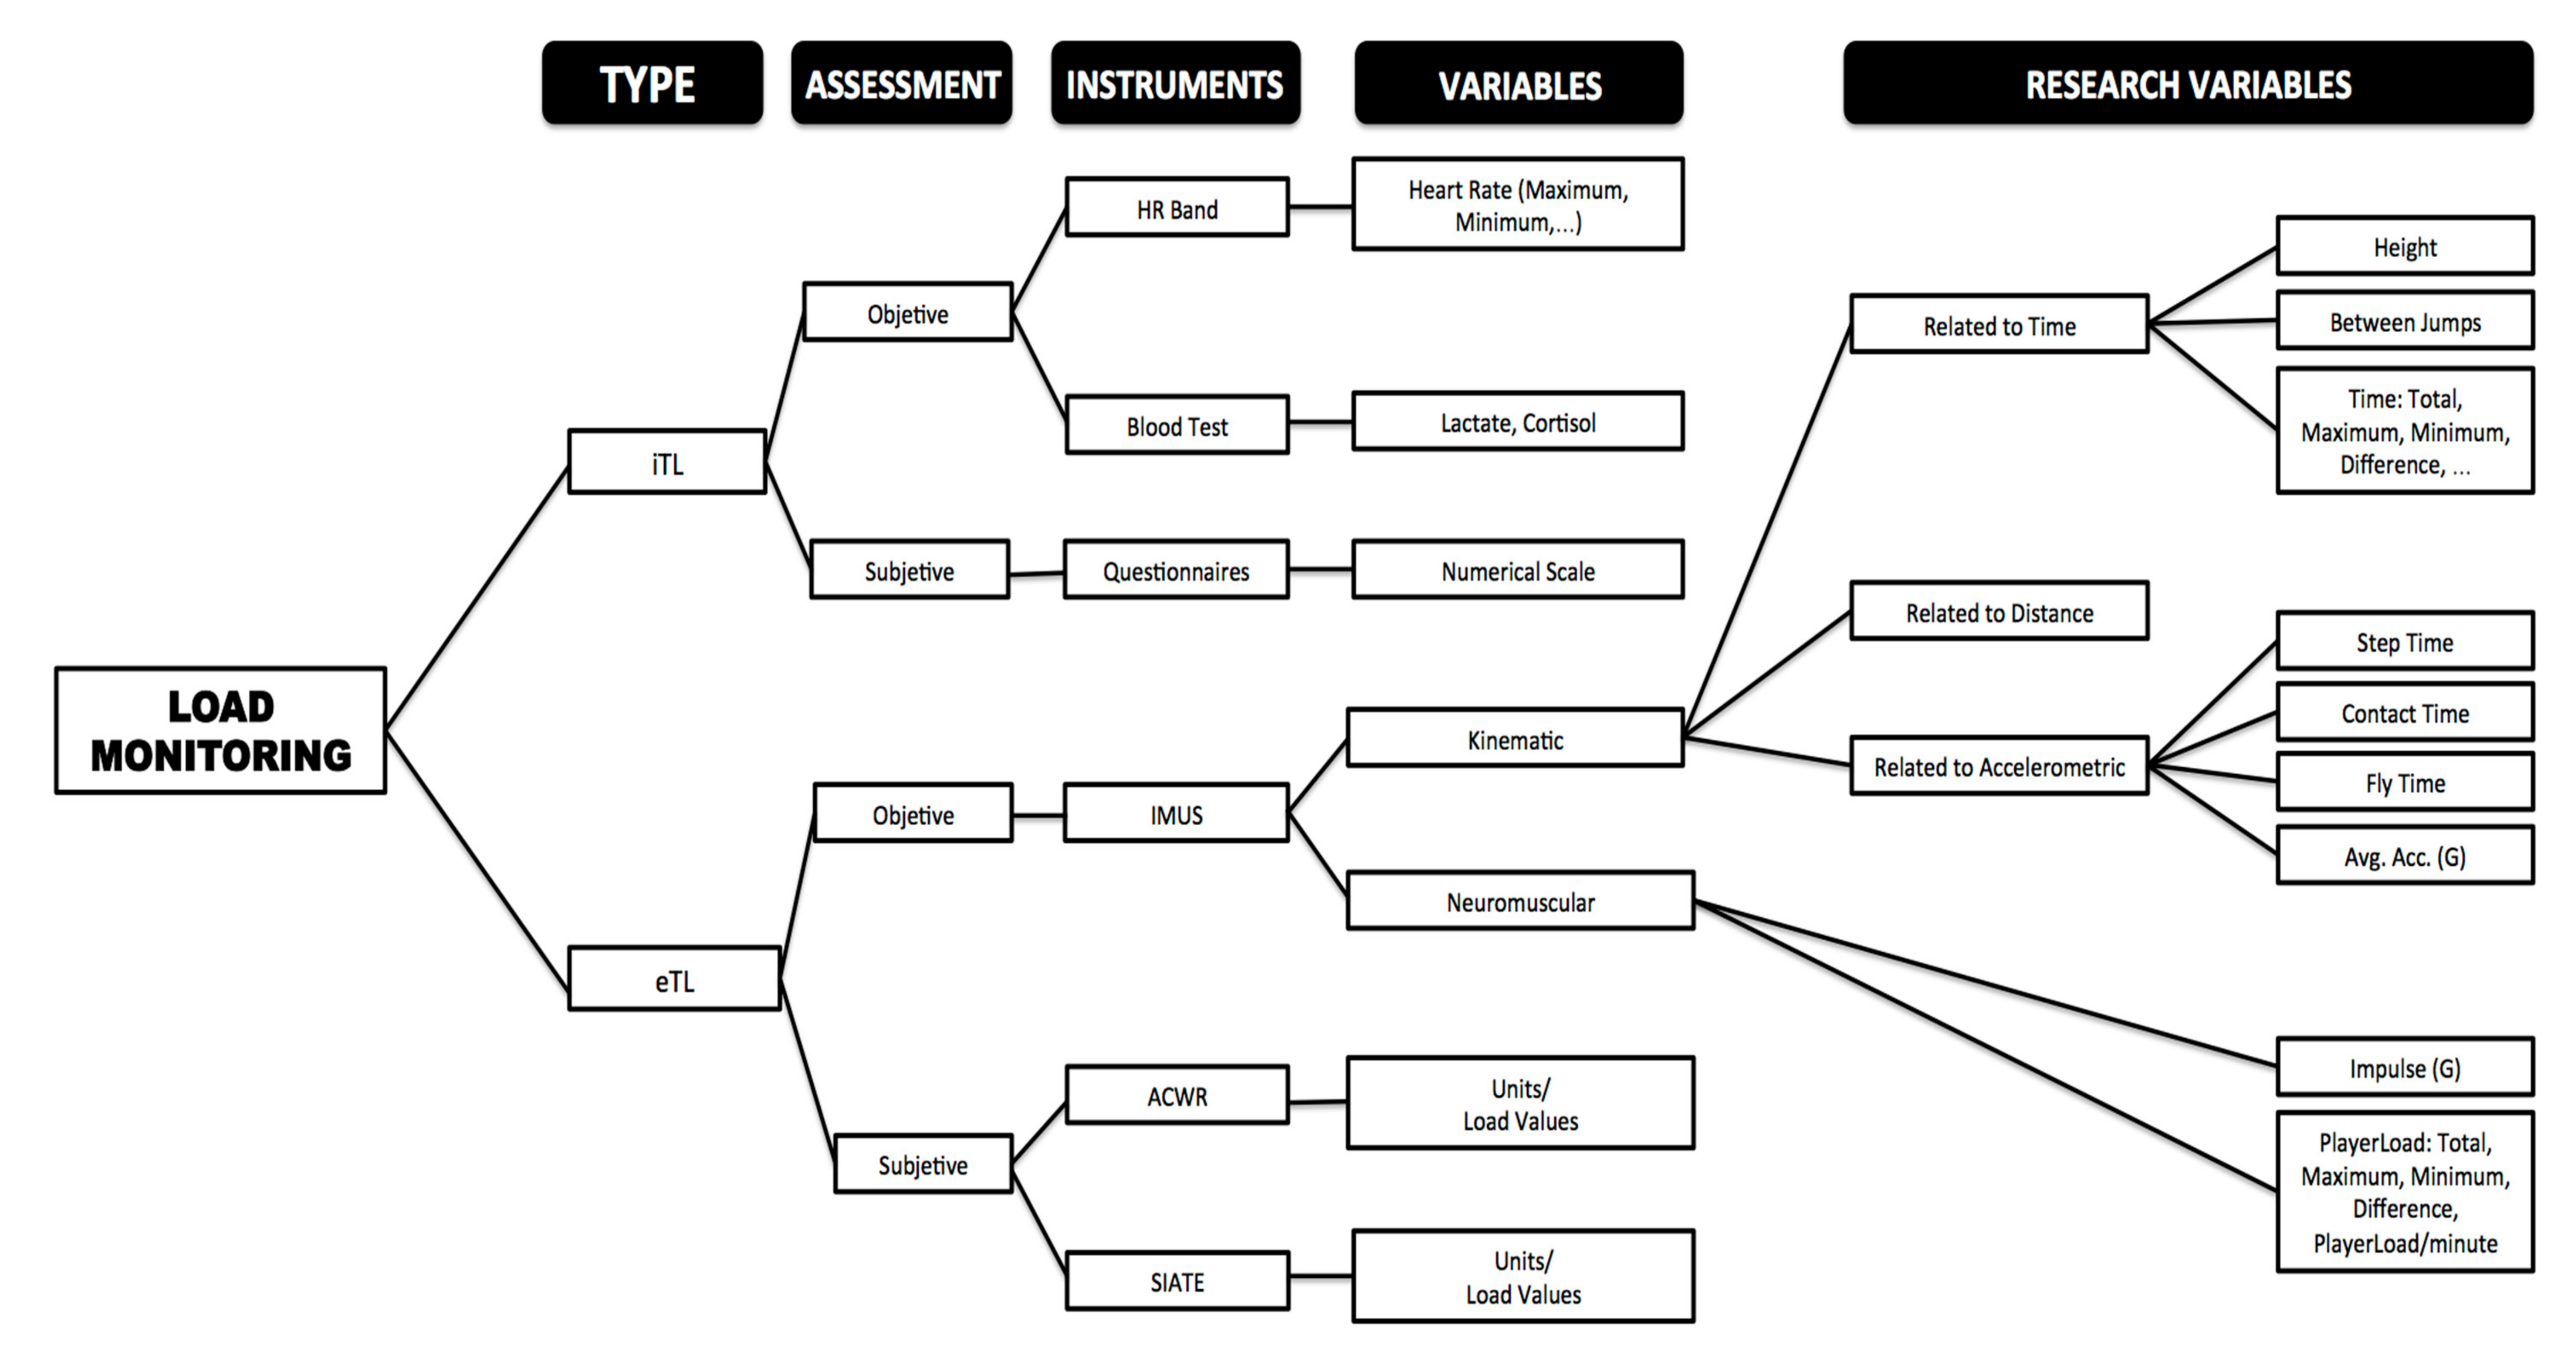
2.3. Variables
2.4. Performance Test
- ○
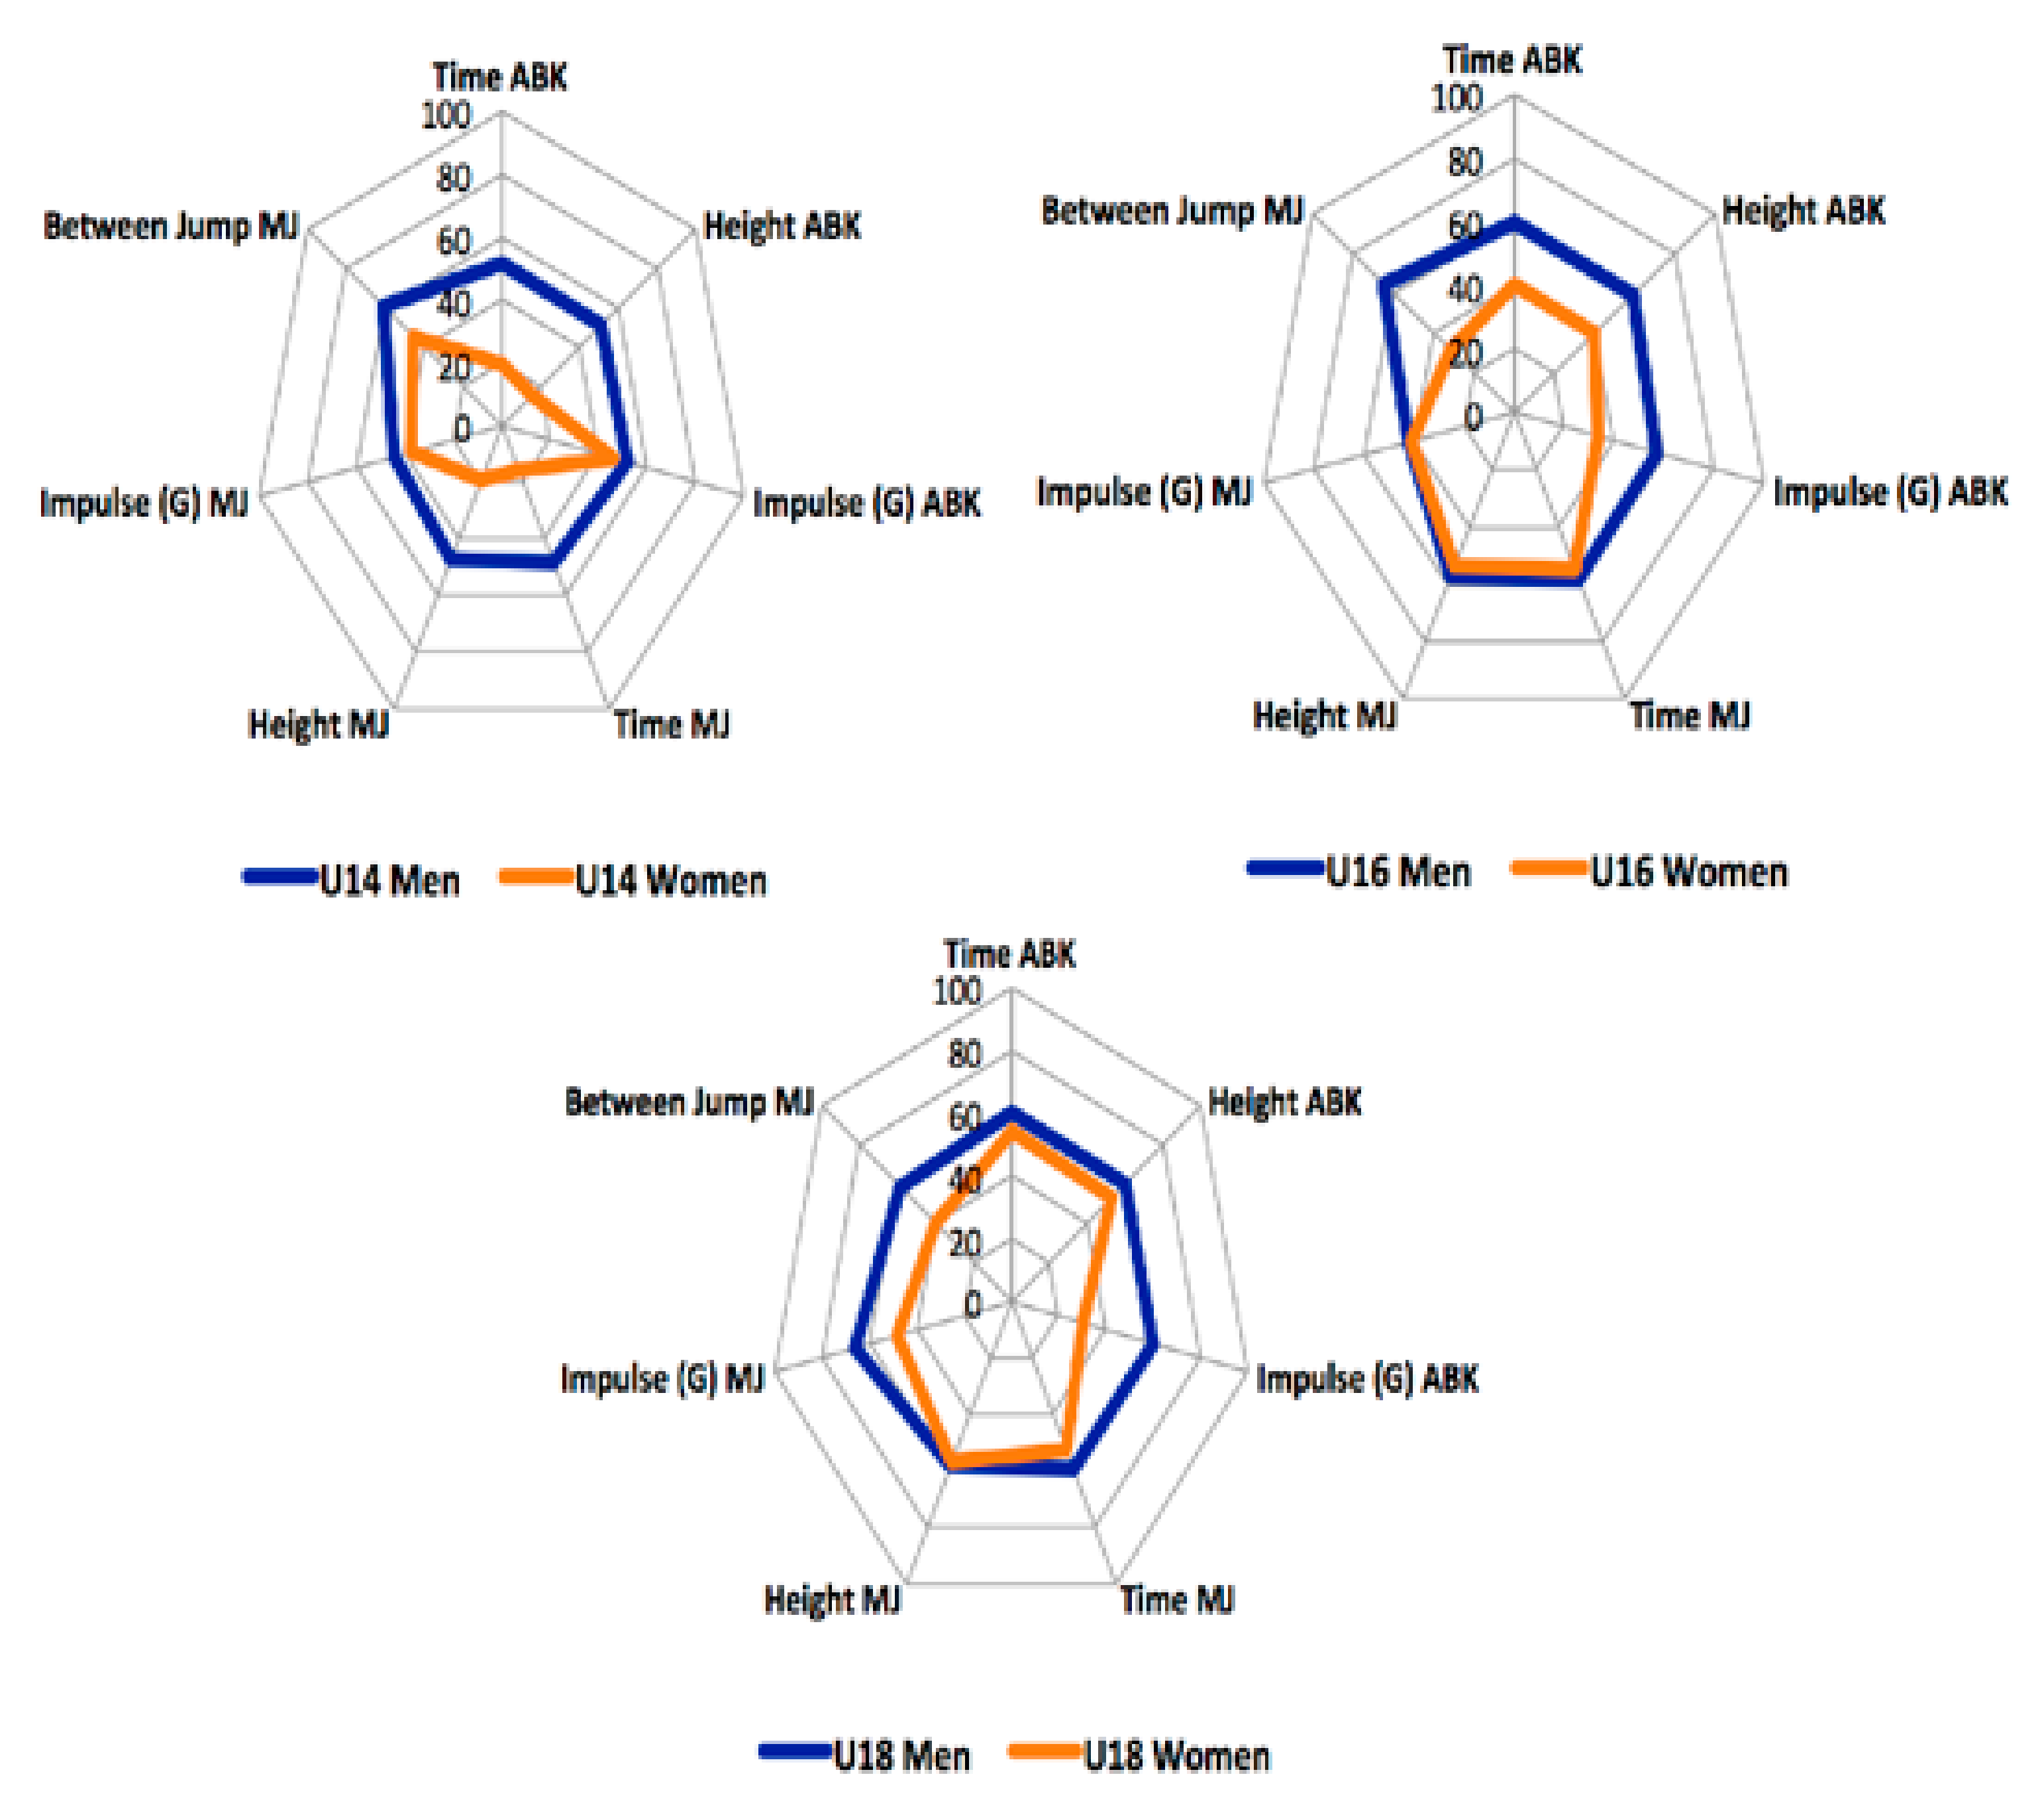
- Abalakov test (ABK) [36]: it consists of a test of maximum lower body strength in which the athlete performs a counter-movement jump with the help of the arms. Each athlete makes three attempts separated by recovery time so that they are not affected by fatigue [3]. Out of the three attempts, the highest jump is selected for analysis. The test was evaluated with the following variables: (i) time; (ii) height; (iii) impulse (G).
- ○
- Multi-jump test (MJ) [3]: it consists of a test that assesses the tolerance to fatigue of the lower body. To do this, the player starts on a box with a height of 50 cm. The player jumps down from the box and makes five maximum jumps in a row using the arm swing. The variables analyzed in this test were time, height, imposed (g), and between jumps (from jump 2 to 5) of each jump. The test was evaluated with the following variables: (i) time; (ii) height; (iii) impulse (G); (iv) between jumps.
- ○
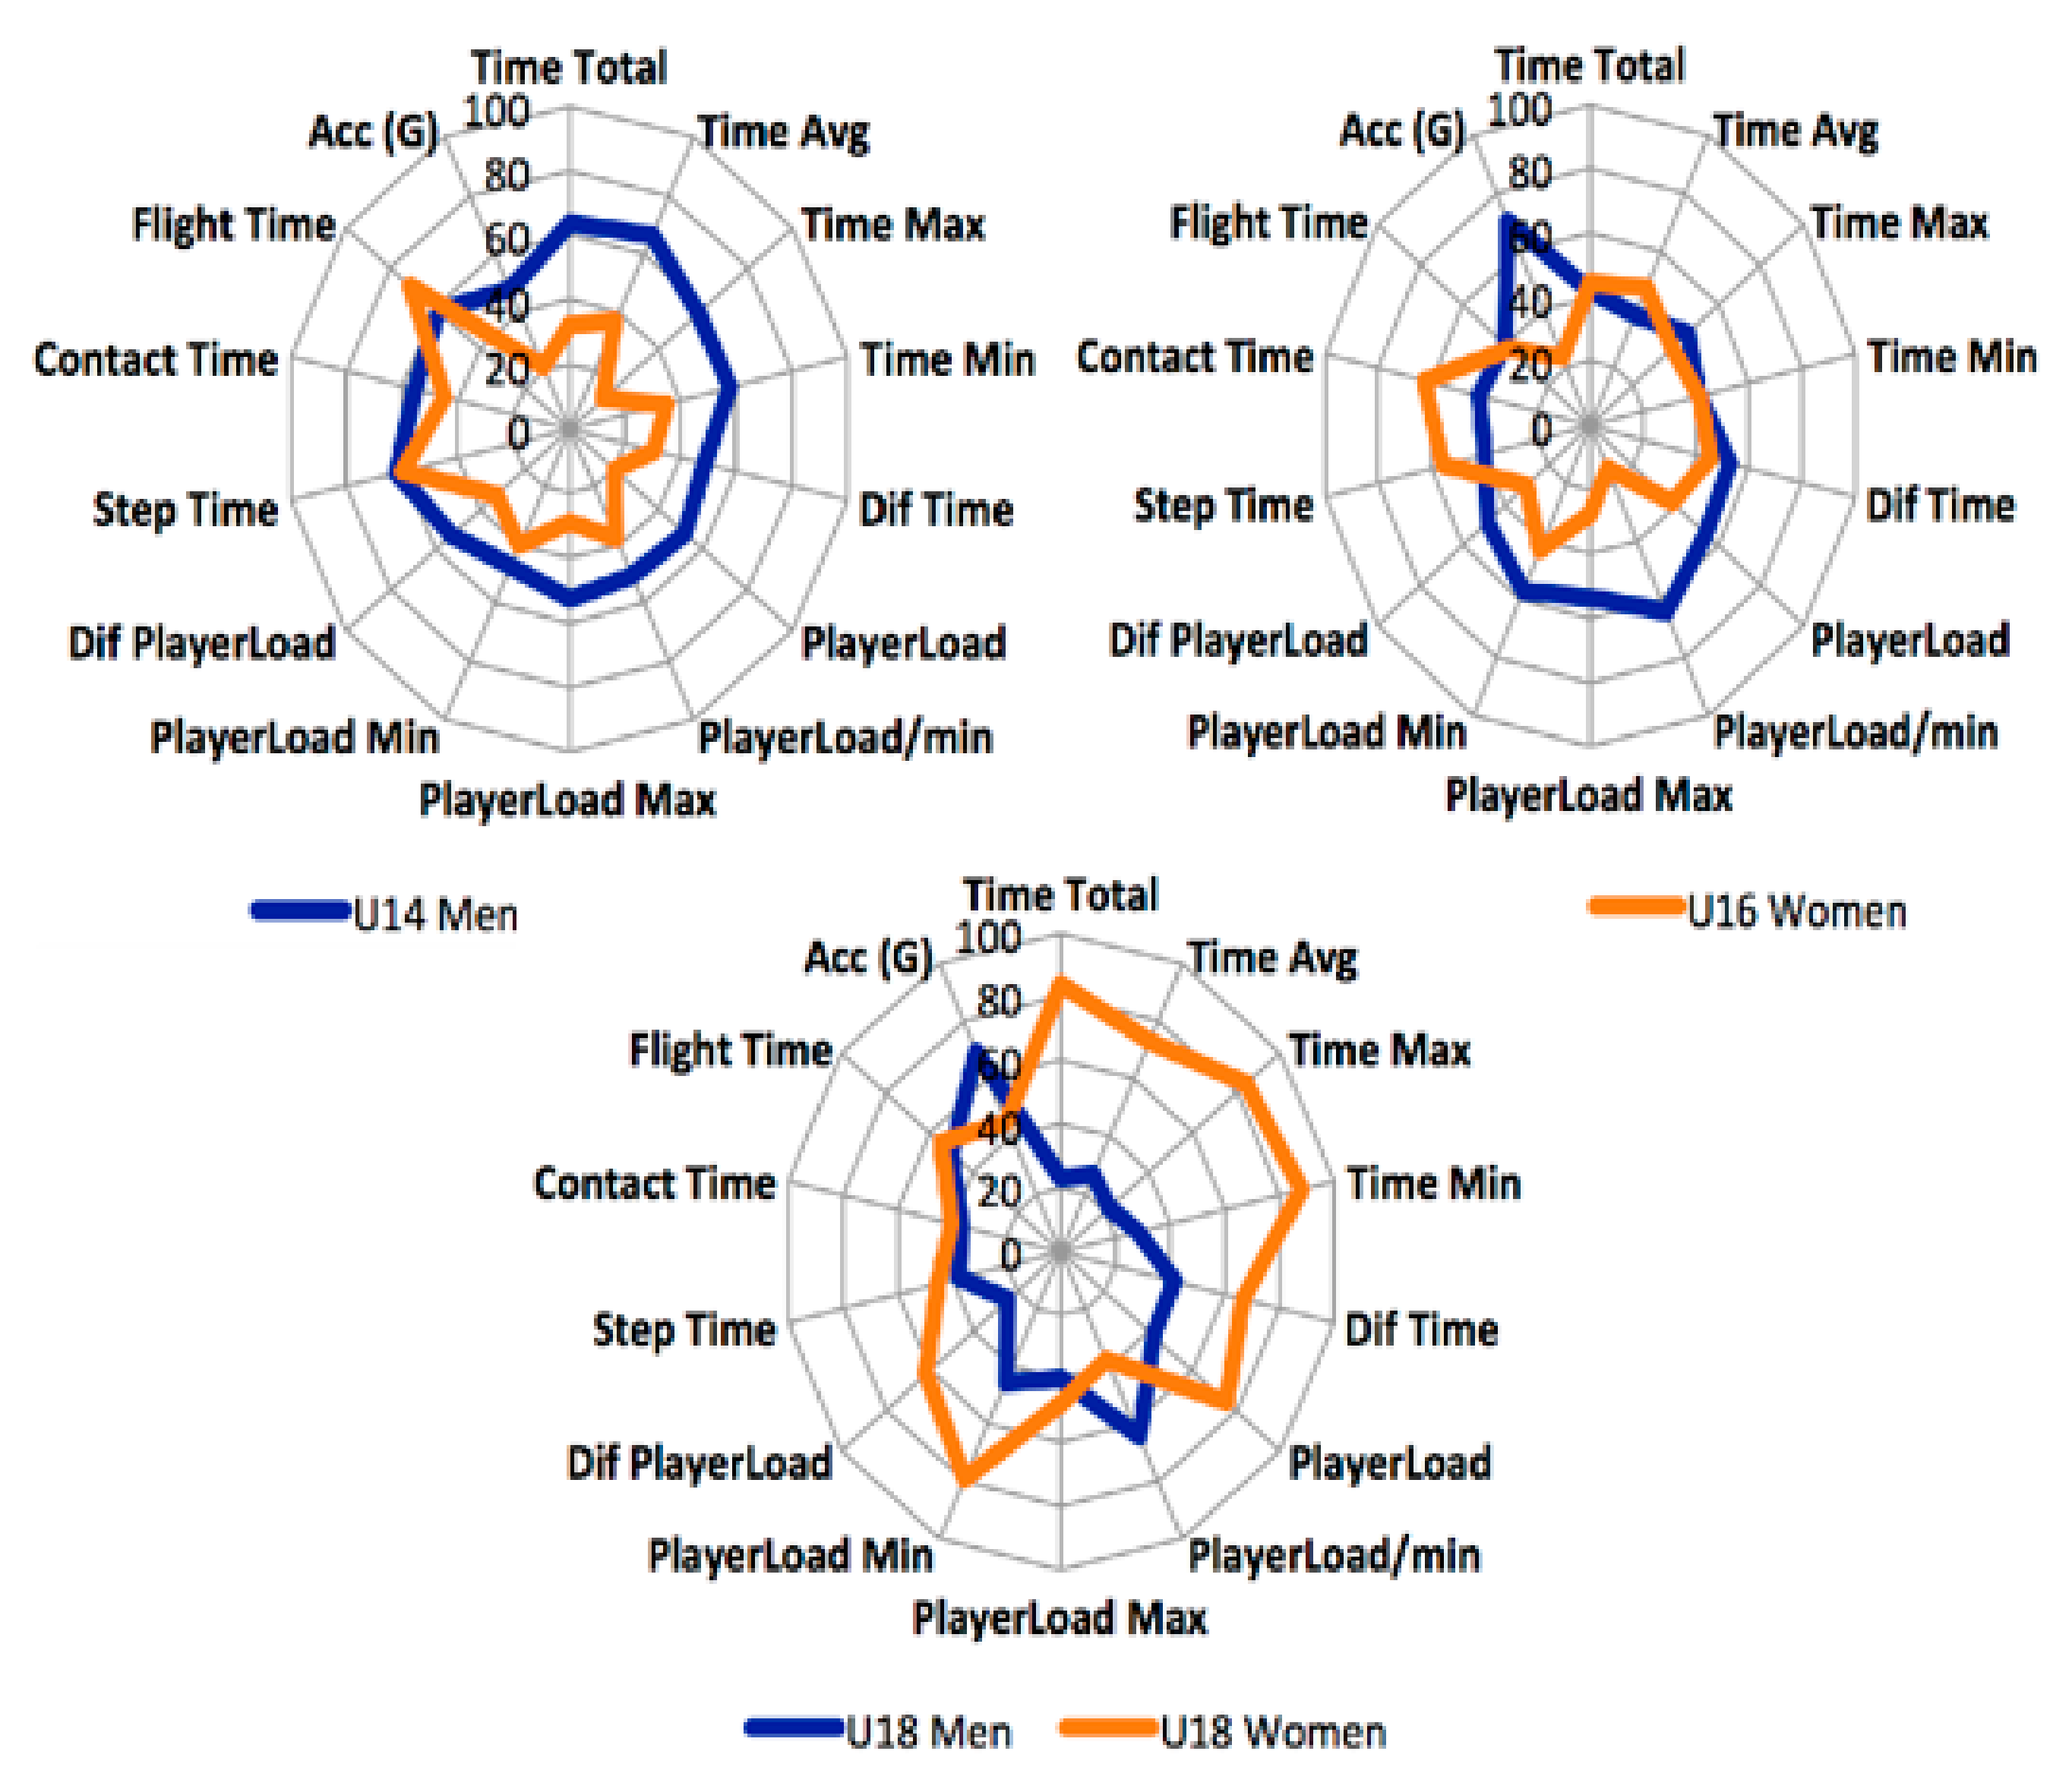
- Sprint test RSA (5 × 14 m) [37]: it consists of a test that assesses sprint speed and tolerance to repeated maximum efforts with incomplete rest. In this test, the athlete performs five sprints in which they must cover 14 m (from the baseline of the basketball court to the midfield line) in the shortest possible time and trying to record the smallest possible difference between repetitions. At the end of each sprint, the player has an active recovery of 30 s. The test was evaluated with the following variables: (i) time total; (ii) time average; (iii) time maximum; (iv) time minimum; (v) time differences; (vi) player load, (vii) player load/minute; (viii) player load maximum; (ix) player load minimum; (x) player load differences; (xi) step time; (xii) contact time; (xiii) flight time; (xiv) average acceleration (G).
2.5. Equipment
2.6. Procedure
2.7. Statistical Analysis
3. Results
4. Discussion
4.1. Speed Test (RSA Test)
4.2. Lower Body Strength Test (Maximum Strength and Reactive Strength)
5. Conclusions
Author Contributions
Funding
Institutional Review Board Statement
Informed Consent Statement
Data Availability Statement
Acknowledgments
Conflicts of Interest
References
- Erčulj, F.; Blas, M.; Bračič, M. Physical Demands on Young Elite European Female Basketball Players with Special Reference to Speed, Agility, Explosive Strength, and Take-off Power. J. Strength Cond. Res. 2010, 24, 2970–2978. [Google Scholar] [CrossRef] [PubMed]
- Delextrat, A.; Badiella, A.; Saavedra, V.; Matthew, D.; Schelling, X.; Torres-Ronda, L. Match activity demands of elite Spanish female basketball players by playing position. Int. J. Perform. Anal. Sport 2015, 15, 687–703. [Google Scholar] [CrossRef]
- Mancha-Triguero, D.; García-Rubio, J.; Ibáñez, S.J. Batería de test de campo para evaluar la condición física de jugadores de baloncesto: SBAFIT. E-Bm. J. Sci. Sport 2019, 15, 107–126. [Google Scholar]
- Korkmaz, C.; Karahan, M. A comparative study on the physical fitness and performance of male basketball players in different divisions. J. Phys. Educ. Sport 2012, 6, 16–23. [Google Scholar]
- Delextrat, A.; Cohen, D. Strength, Power, Speed, and Agility of Women Basketball Players According to Playing Position. J. Strength Cond. Res. 2009, 23, 1974–1981. [Google Scholar] [CrossRef]
- Padulo, J.; Bragazzi, N.L.; Nikolaidis, P.T.; Iacono, A.D.; Attene, G.; Pizzolato, F.; Pupo, J.D.; Zagatto, A.M.; Oggianu, M.; Migliaccio, G.M. Repeated Sprint Ability in Young Basketball Players: Multi-direction vs. One-Change of Direction (Part 1). Front. Physiol. 2016, 7, 133. [Google Scholar] [CrossRef] [Green Version]
- Castagna, C.; Manzi, V.; Impellizzeri, F.; Chaouachi, A.; Ben Abdelkrim, N.; Ditroilo, M. Validity of an On-Court Lactate Threshold Test in Young Basketball Players. J. Strength Cond. Res. 2010, 24, 2434–2439. [Google Scholar] [CrossRef]
- Ibáñez, S.J.; Sampaio, J.; Feu, S.; Calvo, A.L.; Gómez, M.A.; Ortega, E. Basketball game-related statistics that discriminate between teams’ season-long success. Eur. J. Sport Sci. 2008, 8, 369–372. [Google Scholar] [CrossRef]
- Soslu, R.; Özkan, S.R.; Göktepe, A.M. The relationship between anaerobic performances, muscle strength, hamstring/quadriceps ratio, agility, sprint ability and vertical jump in professional basketball players. J. Phys. Educ. Sport 2016, 10, 164–173. [Google Scholar]
- Alemdaroğlu, U. The Relationship between Muscle Strength, Anaerobic Performance, Agility, Sprint Ability and Vertical Jump Performance in Professional Basketball Players. J. Hum. Kinet. 2012, 31, 149–158. [Google Scholar] [CrossRef] [Green Version]
- Ziv, G.; Lidor, R. Vertical jump in female and male basketball players—A review of observational and experimental studies. J. Sci. Med. Sport 2010, 13, 332–339. [Google Scholar] [CrossRef] [PubMed]
- Sheppard, J.M.; Young, W.B. Agility literature review: Classifications, training and testing. J. Sports Sci. 2006, 24, 919–932. [Google Scholar] [CrossRef] [PubMed] [Green Version]
- Balsalobre-Fernández, C.; Tejero-González, C.M.; del Campo-Vecino, J.; Bachero-Mena, B.; Sánchez-Martínez, J. Relationships among repeated sprint ability, vertical jump performance and upper-body strength in professional basketball players. Arch. Med. Deporte 2014, 31, 148–153. [Google Scholar]
- Boyd, L.J.; Ball, K.; Aughey, R.J. Quantifying External Load in Australian Football Matches and Training Using Accelerometers. Int. J. Sports Physiol. Perform. 2013, 8, 44–51. [Google Scholar] [CrossRef] [PubMed] [Green Version]
- Gonzalo-Skok, O.; Serna, J.; Rhea, M.R.; Marín, P.J. Relationships between functional movement tests and performance tests in young elite male basketball players. Int. J. Sports Phys. Ther. 2015, 10, 628–638. [Google Scholar] [PubMed]
- Haizlip, K.M.; Harrison, B.C.; Leinwand, L.A. Sex-Based Differences in Skeletal Muscle Kinetics and Fiber-Type Composition. Physiology 2015, 30, 30–39. [Google Scholar] [CrossRef] [PubMed]
- Rice, P.E.; Goodman, C.L.; Capps, C.R.; Triplett, N.T.; Erickson, T.M.; McBride, J.M. Force—And power—Time curve comparison during jumping between strength-matched male and female basketball players. Eur. J. Sport Sci. 2016, 17, 1–8. [Google Scholar] [CrossRef]
- Oh, S.L.; Yoon, S.H.; Lim, J.Y. Age- and sex-related differences in myosin heavy chain isoforms and muscle strength, function, and quality: A cross sectional study. J. Exerc. Nutr. Biochem. 2018, 22, 43–50. [Google Scholar] [CrossRef]
- Bottinelli, R.; Canepari, M.; Pellegrino, M.A.; Reggiani, C. Force-velocity properties of human skeletal muscle fibres: Myosin heavy chain isoform and temperature dependence. J. Physiol. 1996, 495, 573–586. [Google Scholar] [CrossRef]
- Wu, R.; Delahunt, E.; Ditroilo, M.; Lowery, M.; De Vito, G. Effects of age and sex on neuromuscular-mechanical determinants of muscle strength. AGE 2016, 38, 1–12. [Google Scholar] [CrossRef] [Green Version]
- Ramos, S.; Volossovitch, A.; Ferreira, A.P.; Fragoso, I.; Massuça, L. Differences in maturity, morphological and physical attributes between players selected to the primary and secondary teams of a Portuguese Basketball elite academy. J. Sports Sci. 2019, 37, 1681–1689. [Google Scholar] [CrossRef] [PubMed]
- Buchanan, P.A.; Vardaxis, V.G. Sex-Related and Age-Related Differences in Knee Strength of Basketball Players Ages 11–17 Years. J. Athl. Train. 2003, 38, 231–237. [Google Scholar]
- Butterworth, A.D.; O’Donoghue, P.; Cropley, B. Performance profiling in sports coaching: A review. Int. J. Perform. Anal. Sport 2013, 13, 572–593. [Google Scholar] [CrossRef]
- Liu, H.; Gómez, M.A.; Lago-Peñas, C. Match performance profiles of goalkeepers of elite football teams. Int. J. Sports Sci. Coa 2015, 10, 669–682. [Google Scholar] [CrossRef]
- Zhang, S.; Lorenzo, A.; Gómez-Ruano, M.Á.; Liu, H.; Gonçalves, B.; Sampaio, J. Players’ technical and physical performance profiles and game-to-game variation in NBA. Int. J. Perform. Anal. Sport 2017, 17, 466–483. [Google Scholar] [CrossRef]
- Cui, Y.; Gómez, M.Á.; Gonçalves, B.; Sampaio, J. Performance profiles of professional female tennis players in grand slams. PLoS ONE 2018, 13, e0200591. [Google Scholar] [CrossRef] [PubMed]
- Jara, D.; Ortega-Toro, E.; Gómez-Ruano, M.A.; Weigelt, M.; Nikolic, B.; De Baranda, P.S. Physical and Tactical Demands of the Goalkeeper in Football in Different Small-Sided Games. Sensors 2019, 19, 3605. [Google Scholar] [CrossRef] [Green Version]
- Yi, Q.; Gómez-Ruano, M.A.; Liu, H.; Zhang, S.; Gao, B.; Wunderlich, F.; Memmert, D. Evaluation of the Technical Performance of Football Players in the UEFA Champions League. Int. J. Environ. Res. Public Health 2020, 17, 604. [Google Scholar] [CrossRef] [Green Version]
- Mancha-Triguero, D.; García-Rubio, J.; Antúnez, A.; Ibáñez, S.J. Physical and Physiological Profiles of Aerobic and Anaerobic Capacities in Young Basketball Players. Int. J. Environ. Res. Public Health 2020, 17, 1409. [Google Scholar] [CrossRef] [Green Version]
- García-Ceberino, J.M.; Antúnez, A.; Feu, S.; Ibáñez, S.J. Quantification of Internal and External Load in School Football According to Gender and Teaching Methodology. Int. J. Environ. Res. Public Health 2020, 17, 344. [Google Scholar] [CrossRef] [Green Version]
- Lago-Peñas, C.; Lorenzo-Calvo, A.; Cárdenas, D.; Alarcón, F.; Ureña, A.; Fuentes-Guerra, F.J.G.; Gómez-Ruano, M.A.; Fradua, L.; Sainz de Baranda-Andújar, P.; Ibáñez, S.J.; et al. La creación de conocimiento en los deportes de equipo. Sobre el tamaño de la muestra y la generalización de los resultados. J. Uni. Mov. Perform. 2020, 1, 7–8. [Google Scholar]
- Ibáñez, S.J.; Antúnez, A.; Pino-Ortega, J.; García-Rubio, J. Control del entrenamiento mediante el empleo de tecnologías en tiempo real en balonmano. In Avances Científicos Para el Aprendizaje y Desarrollo del Balonmano, 1st ed.; Feu, S., García-Rubio, J., Ibáñez, S.J., Eds.; Universidad de Extremadura: Cáceres, Spain, 2018; pp. 167–192. [Google Scholar]
- Reina, M.R.; García-Rubio, J.; Feu, S.; Ibáñez, S.J. Training and Competition Load Monitoring and Analysis of Women’s Amateur Basketball by Playing Position: Approach Study. Front. Psychol. 2019, 9, 2689. [Google Scholar] [CrossRef] [PubMed] [Green Version]
- Reina, M.R.; García-Rubio, J.; Ibáñez, S.J. Activity Demands and Speed Profile of Young Female Basketball Players Using Ultra-Wide Band Technology. Int. J. Environ. Res. Public Health 2020, 17, 1477. [Google Scholar] [CrossRef] [Green Version]
- Reche-Soto, P.; Cardona-Nieto, D.; Diaz-Suarez, A.; Bastida-Castillo, A.; Gomez-Carmona, C.; Garcia-Rubio, J.; Pino-Ortega, J. Player Load and Metabolic Power Dynamics as Load Quantifiers in Soccer. J. Hum. Kinet. 2019, 69, 259–269. [Google Scholar] [CrossRef] [PubMed] [Green Version]
- Bosco, C. La Valoración de la Fuerza con el Test de Bosco; Paidotribo: Barcelona, Spain, 1994; pp. 35–138. [Google Scholar]
- Castagna, C.; Abt, G.; Manzi, V.; Annino, G.; Padua, E.; D’ottavio, S. Effect of Recovery Mode on Repeated Sprint Ability in Young Basketball Players. J. Strength Cond. Res. 2008, 22, 923–929. [Google Scholar] [CrossRef]
- Pino-Ortega, J.; García-Rubio, J.; Ibáñez, S.J. Validity and reliability of the WIMU inertial device for the assessment of the vertical jump. Peer J. 2018, 6, e4709. [Google Scholar] [CrossRef]
- Field, A. Discovering Statistics Using SPSS; Sage: London, UK, 2009. [Google Scholar]
- O’Donoghue, P. Statistics for Sport and Exercise Studies: An Introduction; Routledge: London, UK, 2013. [Google Scholar]
- Newell, J.; Aitchison, T.; Grant, S. Statistics for Sports and Exercise Science: A Practical Approach; Routledge: New York, NY, USA, 2014. [Google Scholar]
- Hopkins, W.G.; Marshall, S.W.; Batterham, A.M.; Hanin, J. Progressive Statistics for Studies in Sports Medicine and Exercise Science. Med. Sci. Sports Exerc. 2009, 41, 3–13. [Google Scholar] [CrossRef] [Green Version]
- Chaouachi, A.; Brughelli, M.; Chamari, K.; Levin, G.T.; Ben Abdelkrim, N.; Laurencelle, L.; Castagna, C. Lower Limb Maximal Dynamic Strength and Agility Determinants in Elite Basketball Players. J. Strength Cond. Res. 2009, 23, 1570–1577. [Google Scholar] [CrossRef]
- Doma, K.; Leicht, A.; Sinclair, W.; Schumann, M.; Damas, F.; Burt, D.; Woods, C. Impact of Exercise-Induced Muscle Damage on Performance Test Outcomes in Elite Female Basketball Players. J. Strength Cond. Res. 2018, 32, 1731–1738. [Google Scholar] [CrossRef] [Green Version]
- Štrumbelj, B.; Vučković, G.; Jakovljević, S.; Milanović, Z.; James, N.; Erčulj, F. Graded Shuttle Run Performance by Playing Positions in Elite Female Basketball. J. Strength Cond. Res. 2015, 29, 793–799. [Google Scholar] [CrossRef]
- Bompa, T.O. Periodización del Entrenamiento Deportivo; Editorial Paidotribo: Barcelona, Spain, 2006. [Google Scholar]
- Jakovljevic, S.T.; Karalejic, M.S.; Pajic, Z.B.; Macura, M.M.; Erculj, F.F. Speed and Agility of 12- and 14-Year-Old Elite Male Basketball Players. J. Strength Cond. Res. 2012, 26, 2453–2459. [Google Scholar] [CrossRef] [PubMed]
- İşler, A.K.; Ariburun, B.; Ali, A.; Aytar, A.; Tandogan, R. The relationship between anaerobic performance, muscle strength and sprint ability in American football players. Isokinet. Exerc. Sci. 2008, 16, 87–92. [Google Scholar] [CrossRef]
- Sekulic, D.; Spasic, M.; Mirkov, D.; Cavar, M.; Sattler, T. Gender-Specific Influences of Balance, Speed, and Power on Agility Performance. J. Strength Cond. Res. 2013, 27, 802–811. [Google Scholar] [CrossRef] [PubMed]
- Haj-Sassi, R.; Dardouri, W.; Yahmed, M.H.; Gmada, N.; Mahfoudhi, M.E.; Gharbi, Z. Relative and Absolute Reliability of a Modified Agility T-test and Its Relationship with Vertical Jump and Straight Sprint. J. Strength Cond. Res. 2009, 23, 1644–1651. [Google Scholar] [CrossRef] [PubMed]
- Young, W.; Farrow, D. A Review of Agility: Practical Applications for Strength and Conditioning. Strength Cond. J. 2006, 28, 24. [Google Scholar] [CrossRef]
- Raeder, C.; Wiewelhove, T.; Simola, R.; Álvaro, D.P.; Kellmann, M.; Meyer, T.; Pfeiffer, U.P.D.M.; Ferrauti, A. Assessment of Fatigue and Recovery in Male and Female Athletes After 6 Days of Intensified Strength Training. J. Strength Cond. Res. 2016, 30, 3412–3427. [Google Scholar] [CrossRef]
- Rodríguez-Rosell, D.; Mora-Custodio, R.; Franco-Márquez, F.; Yáñez-García, J.M.; González-Badillo, J.J. Traditional vs. sport-specific vertical jump tests: Reliability, validity, and relationship with the legs strength and sprint performance in adult and teen soccer and basketball players. J. Strength Cond. Res. 2017, 31, 196–206. [Google Scholar] [CrossRef]
- Laffaye, G.; Choukou, M.A.; Benguigui, N.; Padulo, J. Age- and gender-related development of stretch shortening cycle during a sub-maximal hopping task. Biol. Sport 2015, 33, 29–35. [Google Scholar]
- Laffaye, G.; Wagner, P.P.; Tombleson, T.I. Countermovement jump height: Gender and sport-specific differences in the force-time variables. J. Strength Cond. Res. 2014, 28, 1096–1105. [Google Scholar] [CrossRef]
- Hannah, R.; Minshull, C.; Buckthorpe, M.W.; Folland, J.P. Explosive neuromuscular performance of males versus females. Exp. Physiol. 2012, 97, 618–629. [Google Scholar] [CrossRef]


| U14 Men | U14 Women | U16 Men | U16 Women | U18 Men | U18 Women | ||||||||
|---|---|---|---|---|---|---|---|---|---|---|---|---|---|
| Performance Test | Variable | Mean | SD | Mean | SD | Mean | SD | Mean | SD | Mean | SD | Mean | SD |
| Repeat sprint ability (RSA) | Time total | 14.13 | 1.08 | 13.83 | 0.64 | 13.58 | 1.81 | 14.12 | 0.95 | 13.27 | 0.83 | 14.98 | 0.73 |
| Time avg. | 2.82 | 0.22 | 2.77 | 0.13 | 2.60 | 0.36 | 2.82 | 0.19 | 2.65 | 0.17 | 2.99 | 0.15 | |
| Time max. | 3.04 | 0.25 | 2.91 | 0.13 | 3.05 | 0.44 | 3.03 | 0.20 | 2.86 | 0.20 | 3.17 | 0.28 | |
| Time min. | 2.60 | 0.29 | 2.60 | 0.12 | 2.56 | 0.28 | 2.61 | 0.18 | 2.48 | 0.18 | 3.70 | 0.16 | |
| Time dif. | 0.44 | 0.27 | 0.31 | 0.14 | 0.49 | 0.25 | 0.42 | 0.16 | 0.38 | 0.18 | 0.47 | 0.19 | |
| PL | 1.42 | 1.02 | 0.95 | 0.25 | 1.70 | 1.72 | 0.97 | 0.61 | 1.22 | 0.26 | 1.67 | 0.27 | |
| PL/min. | 4.84 | 1.08 | 4.15 | 1.11 | 5.73 | 1.27 | 4.14 | 0.39 | 5.65 | 1.14 | 4.41 | 0.69 | |
| PL max. | 0.50 | 0.98 | 0.21 | 0.15 | 0.66 | 1.67 | 0.21 | 0.15 | 0.28 | 0.06 | 0.37 | 0.05 | |
| PL min. | 0.21 | 0.06 | 0.18 | 0.08 | 0.23 | 0.05 | 0.18 | 0.11 | 0.20 | 0.07 | 0.30 | 0.06 | |
| PL dif. | 0.29 | 1.01 | 0.34 | 0.16 | 0.43 | 0.66 | 0.32 | 0.16 | 0.81 | 0.58 | 0.69 | 0.36 | |
| Step time | 283.91 | 11.35 | 282.59 | 10.92 | 266.39 | 21.13 | 290.77 | 46.61 | 266.92 | 16.28 | 272.47 | 18.91 | |
| Contact time | 204.34 | 14.50 | 197.00 | 14.13 | 194.95 | 13.82 | 223.11 | 35.41 | 190.37 | 14.86 | 193.60 | 14.69 | |
| Flight time | 79.56 | 7.58 | 84.86 | 7.86 | 71.43 | 10.21 | 67.66 | 15.33 | 76.40 | 12.82 | 78.86 | 10.20 | |
| Acc (G) | 2.38 | 0.38 | 1.97 | 0.31 | 2.93 | 0.50 | 1.89 | 0.40 | 2.97 | 0.56 | 2.35 | 0.27 | |
| Abalakov | Time (ms) | 512.95 | 51.46 | 454.50 | 35.40 | 540.54 | 67.07 | 472.95 | 72.70 | 551.49 | 86.03 | 518.17 | 47.48 |
| Height (cm) | 32.64 | 6.36 | 25.47 | 3.97 | 36.37 | 8.84 | 28.04 | 8.65 | 38.18 | 11.34 | 33.19 | 5.90 | |
| Impulse (G) | 2.73 | 1.63 | 2.31 | 1.30 | 2.95 | 1.06 | 2.08 | 0.61 | 3.26 | 1.35 | 2.09 | 0.49 | |
| Multi-jump | Time | 459.80 | 47.77 | 404.88 | 34.15 | 484.00 | 50.19 | 475.05 | 46.04 | 488.00 | 53.55 | 469.38 | 49.85 |
| Height | 26.41 | 5.79 | 20.67 | 4.27 | 29.39 | 5.95 | 28.13 | 5.38 | 29.92 | 6.62 | 29.00 | 5.31 | |
| Impulse (G) | 3.24 | 1.05 | 3.19 | 2.04 | 3.13 | 0.96 | 3.04 | 0.71 | 4.06 | 0.67 | 3.46 | 0.78 | |
| Between jump | 535.50 | 97.43 | 464.72 | 81.42 | 572.71 | 122.00 | 370.12 | 122.74 | 518.00 | 81.21 | 441.52 | 83.79 | |
| Age | Sex | Age*Sex | ||||||
|---|---|---|---|---|---|---|---|---|
| Performance Test | Variable | Sig. | Eta | Post Hoc | Sig. | Eta | Sig. | Eta |
| RSA Test | Time total | <0.001 * | 0.762 | U14-U18 | <0.001 * | 0.488 | <0.001 * | 0.452 |
| Time avg | <0.001 * | 0.715 | U14-U16 | <0.001 * | 0.565 | <0.001 * | 0.681 | |
| Time max | <0.001 * | 0.659 | U14-U16; U16-U18 | <0.001 * | 0.009 | <0.001 * | 0.787 | |
| Time min | <0.001 * | 0.688 | U14-U16; U14-U18 | <0.001 * | 0.446 | <0.001 * | 0.792 | |
| Time dif | 0.002 * | 0.089 | 0.292 | 0.002 | <0.001 * | 0.175 | ||
| Player load | 0.391 | 0.218 | 0.446 | 0.012 | 0.216 | 0.012 | ||
| Player load/min | 0.023 * | 0.117 | U14-U16; U16-U18 | <0.001 * | 0.001 | 0.387 | 0.151 | |
| Player load max | 0.48 * | 0.011 | 0.203 | 0.013 | 0.188 | 0.025 | ||
| Player load min | <0.001 * | 0.221 | U14-U16; U16-U18 | 0.761 | 0.044 | <0.001 * | 0.326 | |
| Player load dif | 0.465 | 0.012 | 0.193 | 0.048 | 0.375 | 0.015 | ||
| Step time | 0.014 * | 0.063 | U14-U18 | 0.016 * | 0.004 | 0.029 | 0.053 | |
| Contact time | <0.001 * | 0.127 | U16-U18 | 0.011 * | 0.421 | <0.001 * | 0.131 | |
| Flight time | <0.001 * | 0.184 | U14-U16; U16-U18 | 0.481 | 0.128 | 0.152 | 0.029 | |
| Acc avg step (G) | <0.001 * | 0.200 | U14-U16; U14-U18 | <0.001 * | 0.132 | 0.002 * | 0.089 | |
| ABK Test | Time | <0.001 * | 0.132 | U14-U18 | <0.001 * | 0.001 | 0.894 | 0.002 |
| Height | <0.001 * | 0.138 | U14-U18 | <0.001 * | 0.069 | 0.985 | 0.000 | |
| Impulse (G) | 0.019 * | 0.059 | 0.693 | 0.060 | 0.001 * | 0.099 | ||
| MJ Test | Time | <0.001 * | 0.231 | U14-U16; U14-U18 | 0.002 * | 0.002 | 0.045 * | 0.047 |
| Height | <0.001 * | 0.219 | U14-U16; U14-U18 | 0.005 * | 0.259 | 0.104 | 0.034 | |
| Impulse (G) | 0.018 * | 0.060 | U14-U18 | 0.607 | 0.156 | 0.003 * | 0.084 | |
| Between jumps | 0.184 | 0.026 | <0.001 * | 0.219 | 0.002 * | 0.090 | ||
Publisher’s Note: MDPI stays neutral with regard to jurisdictional claims in published maps and institutional affiliations. |
© 2021 by the authors. Licensee MDPI, Basel, Switzerland. This article is an open access article distributed under the terms and conditions of the Creative Commons Attribution (CC BY) license (http://creativecommons.org/licenses/by/4.0/).
Share and Cite
Mancha-Triguero, D.; García-Rubio, J.; Gamonales, J.M.; Ibáñez, S.J. Strength and Speed Profiles Based on Age and Sex Differences in Young Basketball Players. Int. J. Environ. Res. Public Health 2021, 18, 643. https://doi.org/10.3390/ijerph18020643
Mancha-Triguero D, García-Rubio J, Gamonales JM, Ibáñez SJ. Strength and Speed Profiles Based on Age and Sex Differences in Young Basketball Players. International Journal of Environmental Research and Public Health. 2021; 18(2):643. https://doi.org/10.3390/ijerph18020643
Chicago/Turabian StyleMancha-Triguero, David, Javier García-Rubio, José M. Gamonales, and Sergio J. Ibáñez. 2021. "Strength and Speed Profiles Based on Age and Sex Differences in Young Basketball Players" International Journal of Environmental Research and Public Health 18, no. 2: 643. https://doi.org/10.3390/ijerph18020643