
Infectious Respiratory Diseases Decreased during the COVID-19 Pandemic in South Korea


Abstract
:1. Introduction
2. Materials and Methods
2.1. Study Design and Target Diseases
2.2. Calculation of Incidence Rate (IR) and Incidence Rate Ratio (IRR) for the Eight Infectious Respiratory Diseases
2.3. Data Collection
2.4. Data Analyses
3. Results
3.1. Characteristics of Study Population
3.2. Yearly and Monthly IRs, AS-IRs, and SS-IRs of Eight Infectious Respiratory Diseases in Intervention and Pre-Intervention Periods
3.3. Yearly and Monthly IRRs and AS-IRRs for Eight Infectious Respiratory Diseases in the Intervention and Pre-Intervention Periods
4. Discussion
5. Conclusions
Author Contributions
Funding
Conflicts of Interest
Appendix A

| Year | Age Group | Chickenpox | Measles | Pertussis | Mumps | IPD | Scarlet Fever | Rubella | MD | All Diseases |
|---|---|---|---|---|---|---|---|---|---|---|
| 2020 (Ref.) | 0–9 | 328.88 | 0 | 0.33 | 132.77 | 0.30 | 26.68 | 0 | 0 | 488.95 |
| 10–19 | 66.58 | 0 | 0.04 | 29.76 | 0.02 | 2.08 | 0 | 0 | 98.48 | |
| 20–29 | 10.60 | 0 | 0.01 | 5.64 | 0 | 0.26 | 0 | 0 | 16.52 | |
| 30–39 | 6.49 | 0 | 0.03 | 5.07 | 0.07 | 0.52 | 0 | 0 | 12.19 | |
| 40–49 | 3.37 | 0 | 0.02 | 3.66 | 0.11 | 0.14 | 0.01 | 0.01 | 7.33 | |
| 50–59 | 2.37 | 0 | 0 | 2.51 | 0.35 | 0.02 | 0 | 0.01 | 5.26 | |
| 60–69 | 1.64 | 0 | 0.03 | 1.51 | 0.57 | 0.06 | 0 | 0 | 3.80 | |
| 70+ | 1.71 | 0 | 0.23 | 1.11 | 1.79 | 0.07 | 0 | 0 | 4.91 | |
| 2019 | 0–9 | 1152.24 * | 0.58* | 3.89 * | 223.11 * | 0.96 * | 138.47 * | 0 | 0 | 1519.25 * |
| 10–19 | 296.05 * | 0.12* | 1.75 * | 50.03 * | 0.10 | 4.64 * | 0 | 0.04 | 352.73 * | |
| 20–29 | 23.42 * | 0.90* | 0.09 | 7.97 * | 0.04 | 0.38 | 0 | 0.06 * | 32.86 * | |
| 30–39 | 13.86 * | 0.28* | 0.11 | 6.86 * | 0.13 | 0.75 | 0.07 * | 0 | 22.06 * | |
| 40–49 | 6.30 * | 0.08* | 0.13 * | 4.81 * | 0.29 * | 0.29 * | 0.02 | 0 | 11.92 * | |
| 50–59 | 2.75 | 0.02 | 0.17 * | 3.12 * | 0.66 * | 0.07 | 0 | 0.02 | 6.81 * | |
| 60–69 | 2.19 | 0 | 0.30 * | 1.71 | 1.58 * | 0.05 | 0 | 0.05 | 5.88 * | |
| 70+ | 2.03 | 0 | 1.55 * | 1.40 | 3.36 * | 0.13 | 0 | 0 | 8.47 * | |
| 2018 | 0–9 | 1452.40 * | 0.09* | 11.07 * | 266.37 * | 0.88 * | 251.62 * | 0 | 0.05 | 1982.48 * |
| 10–19 | 306.99 * | 0.06 | 3.85 * | 57.35 * | 0.17 * | 11.61 * | 0 | 0.06 | 380.08 * | |
| 20–29 | 24.02 * | 0.01 | 0.07 | 8.74 * | 0.10 * | 0.41 | 0 | 0.06 * | 33.42 * | |
| 30–39 | 14.94 * | 0.01 | 0.19 * | 7.86 * | 0.28 * | 0.87 * | 0 | 0.03 | 24.18 * | |
| 40–49 | 6.71 * | 0.02 | 0.20 * | 5.29 * | 0.33 * | 0.33 * | 0 | 0 | 12.88 * | |
| 50–59 | 3.10 * | 0.01 | 0.28 * | 3.49 * | 0.75 * | 0.09 | 0 | 0.01 | 7.74 * | |
| 60–69 | 2.47 | 0 | 0.58 * | 2.46 * | 2.05 * | 0.27 * | 0 | 0 | 7.83 * | |
| 70+ | 2.24 | 0 | 1.78 * | 1.54 | 3.41 * | 0.24 * | 0 | 0.02 | 9.22 * | |
| 2017 | 0–9 | 1233.41 * | 0.07 | 2.77 * | 226.15 * | 0.99 * | 425.35 * | 0.07 | 0.02 | 1888.82 * |
| 10–19 | 210.48* | 0.02 | 1.19 * | 53.84 * | 0.09 | 13.71 * | 0.02 | 0.08 * | 279.43 * | |
| 20–29 | 20.31* | 0.01 | 0.06 | 8.60 * | 0 | 0.35 | 0 | 0.07 * | 29.41 * | |
| 30–39 | 11.87* | 0 | 0.14 * | 7.25 * | 0.23 * | 1.00 * | 0.01 | 0 | 20.51 * | |
| 40–49 | 5.42* | 0.01 | 0.14 * | 4.22 * | 0.31 * | 0.38 * | 0.02 | 0 | 10.50 * | |
| 50–59 | 2.34 | 0 | 0.16 * | 3.04 | 0.91 * | 0.14 * | 0 | 0.02 | 6.62 * | |
| 60–69 | 1.96 | 0 | 0.32 * | 1.91 | 1.59 * | 0.12 | 0 | 0.05 | 5.96 * | |
| 70+ | 2.02 | 0 | 0.92 * | 1.32 | 3.47 * | 0.22 | 0 | 0.02 | 7.97 * |
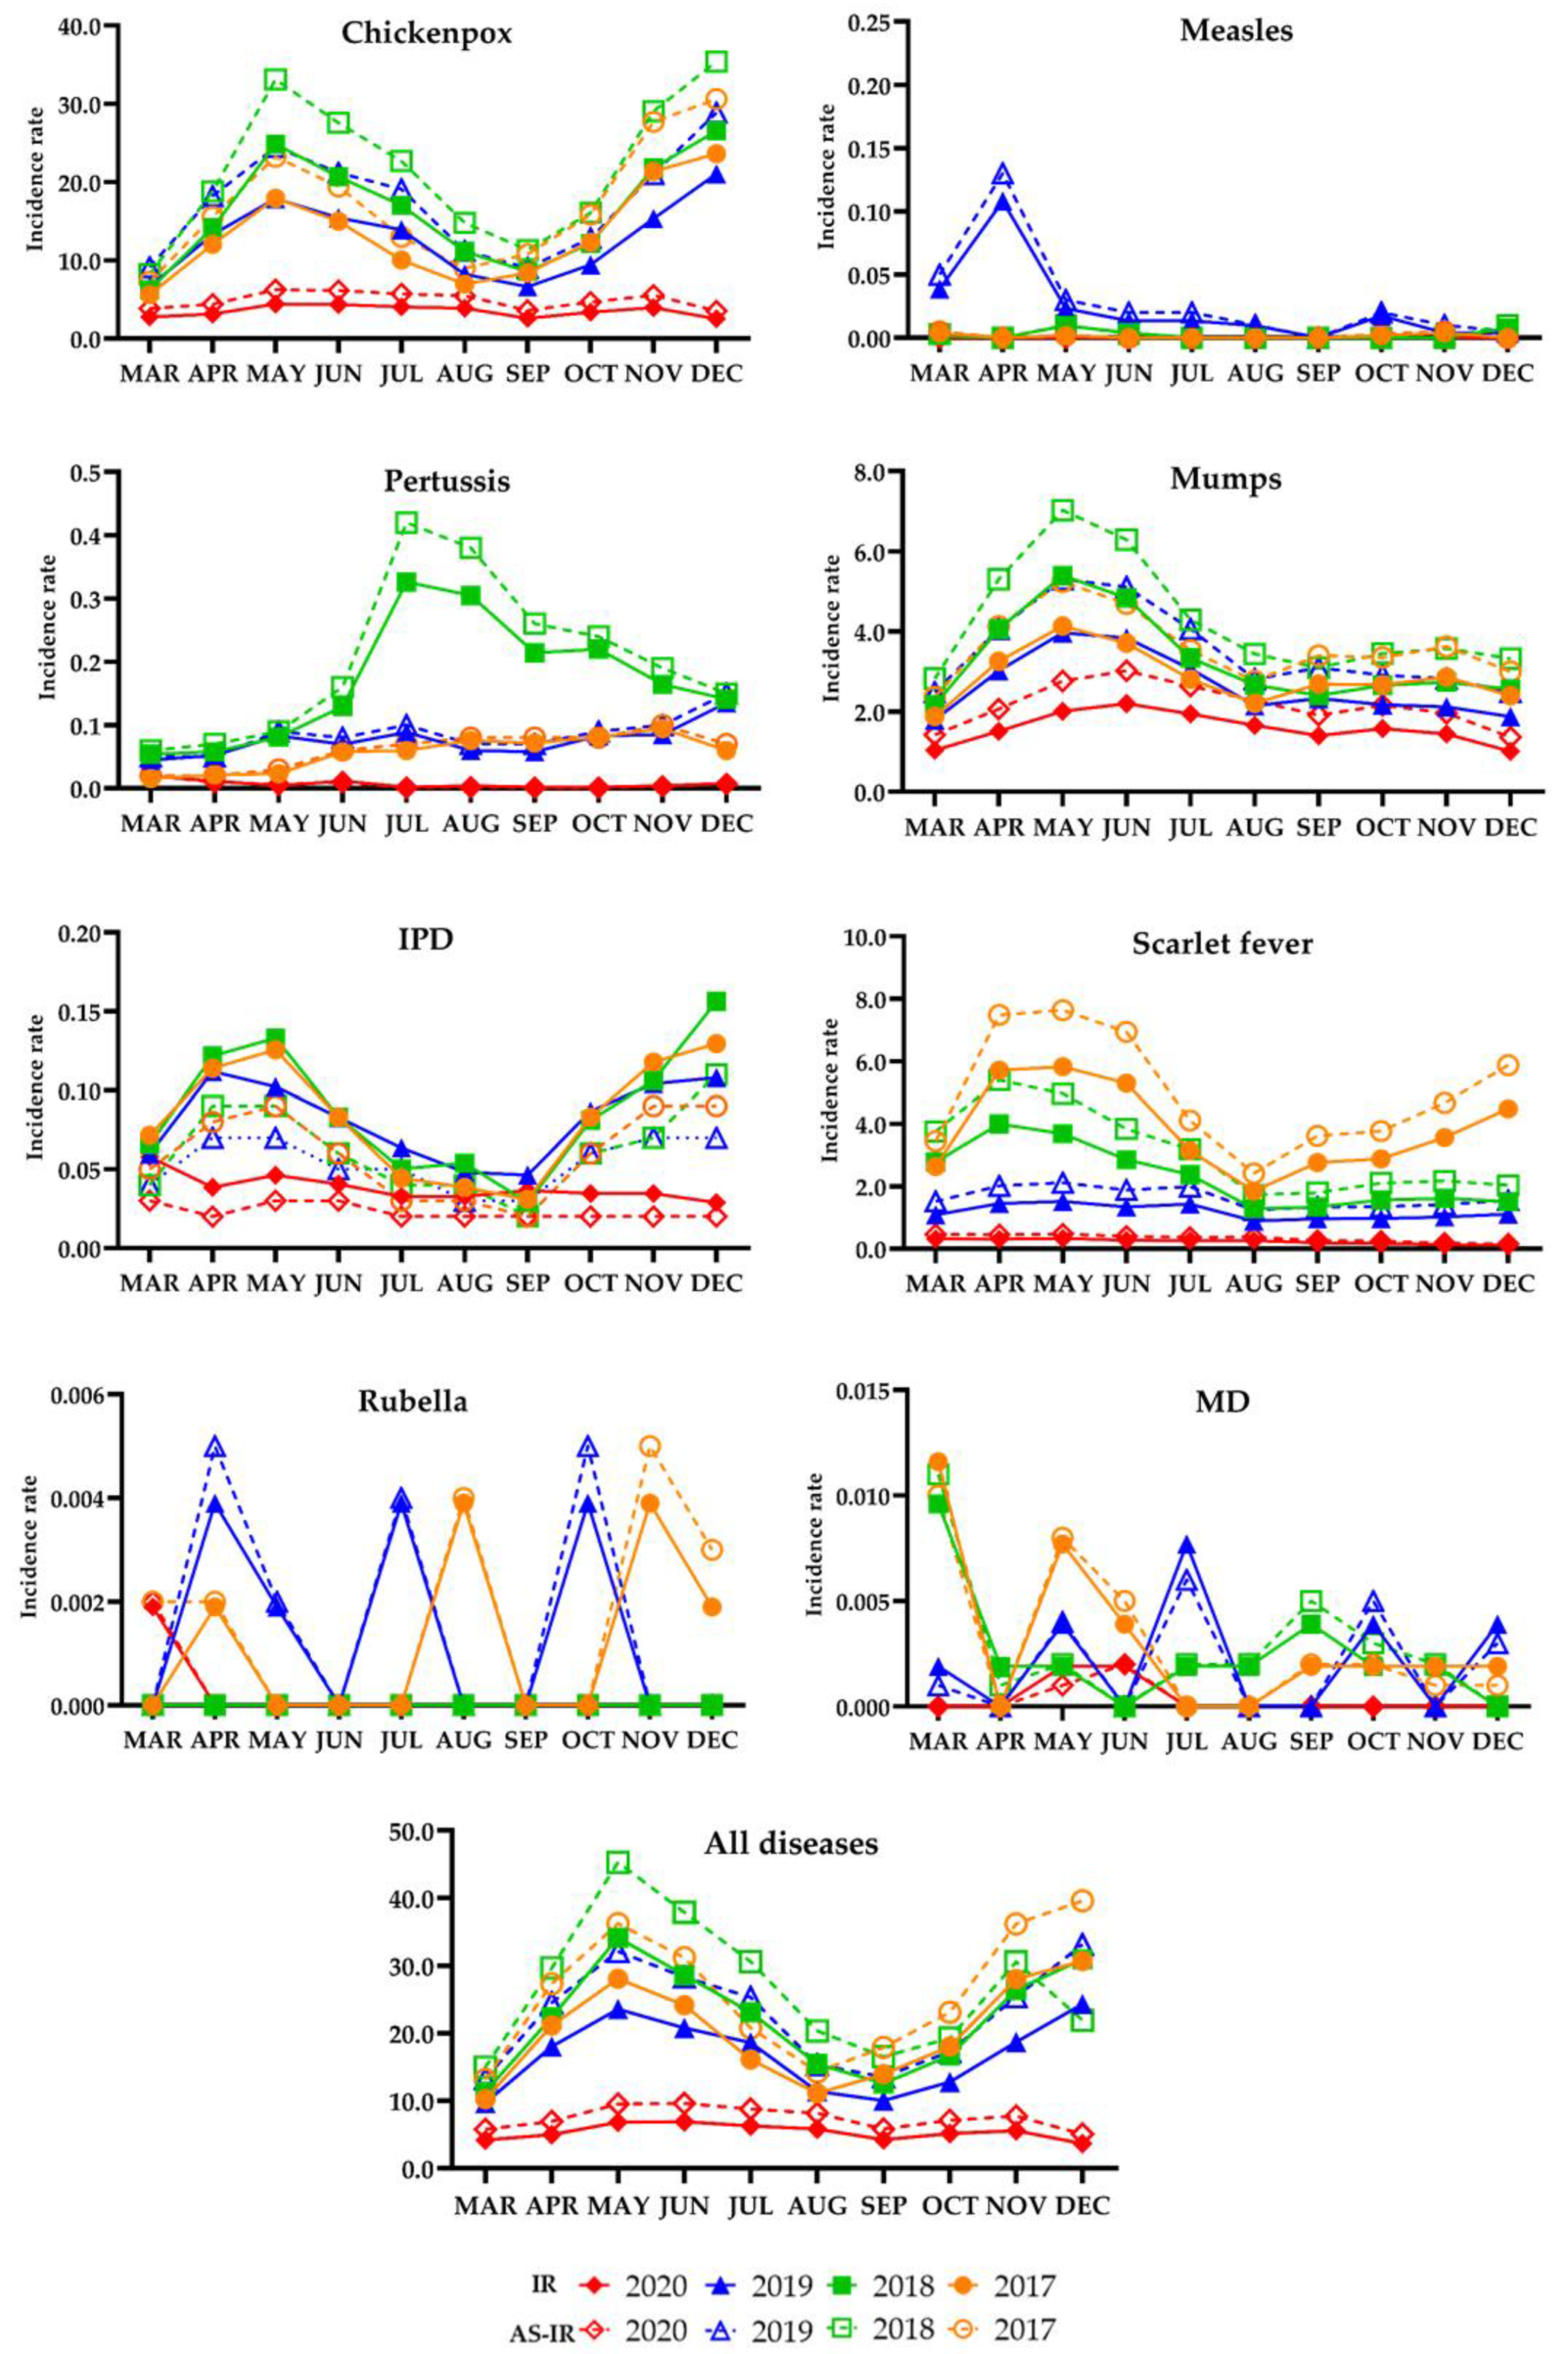
| Category | Year | Month | Chickenpox | Measles | Pertussis | Mumps | IPD | Scarlet Fever | Rubella | MD | All Diseases |
|---|---|---|---|---|---|---|---|---|---|---|---|
| IR | 2020 | Mar | 2.76 | 0 | 0.02 | 1.04 | 0.06 | 0.32 | 0.002 | 0 | 4.19 |
| Apr | 3.13 | 0 | 0.01 | 1.50 | 0.04 | 0.31 | 0 | 0 | 5.00 | ||
| May | 4.44 | 0 | 0.004 | 2.01 | 0.05 | 0.33 | 0 | 0.002 | 6.83 | ||
| Jun | 4.37 | 0 | 0.01 | 2.20 | 0.04 | 0.28 | 0 | 0.002 | 6.90 | ||
| Jul | 4.05 | 0 | 0.002 | 1.94 | 0.03 | 0.26 | 0 | 0 | 6.28 | ||
| Aug | 3.86 | 0 | 0.004 | 1.66 | 0.03 | 0.27 | 0 | 0 | 5.82 | ||
| Sep | 2.59 | 0 | 0.002 | 1.40 | 0.04 | 0.19 | 0 | 0 | 4.22 | ||
| Oct | 3.37 | 0 | 0.002 | 1.58 | 0.03 | 0.18 | 0 | 0 | 5.16 | ||
| Nov | 3.96 | 0 | 0.004 | 1.44 | 0.03 | 0.13 | 0 | 0 | 5.57 | ||
| Dec | 2.51 | 0 | 0.008 | 1.01 | 0.03 | 0.11 | 0 | 0 | 3.66 | ||
| 2019 | Mar | 6.67 * | 0.04 * | 0.04 * | 1.79 * | 0.06 | 1.09 * | 0 | 0.002 | 9.70 * | |
| Apr | 13.29 * | 0.11 * | 0.05 * | 3.02 * | 0.11 * | 1.45 * | 0.004 | 0 | 18.03 * | ||
| May | 17.85 * | 0.02 * | 0.08 * | 3.97 * | 0.10 * | 1.52 * | 0.002 | 0.004 | 23.55 * | ||
| Jun | 15.43 * | 0.01 * | 0.07 * | 3.83 * | 0.08 * | 1.35 * | 0 | 0 | 20.77 * | ||
| Jul | 13.92 * | 0.01 * | 0.09 * | 3.07 * | 0.06 * | 1.43 * | 0.004 | 0.008 * | 18.59 * | ||
| Aug | 8.22 * | 0.01 * | 0.06 * | 2.14 * | 0.05 | 0.89 * | 0 | 0 | 11.38 * | ||
| Sep | 6.63 * | 0 | 0.06 * | 2.32 * | 0.05 | 0.96 * | 0 | 0 | 10.02 * | ||
| Oct | 9.43 * | 0.02 * | 0.08 * | 2.17 * | 0.09 * | 0.97 * | 0.004 | 0.004 | 12.77 * | ||
| Nov | 15.34 * | 0.004 | 0.08 * | 2.11 * | 0.10 * | 1.02 * | 0 | 0 | 18.67 * | ||
| Dec | 21.06 * | 0.004 | 0.14 * | 1.87 * | 0.11 * | 1.11 * | 0 | 0.004 | 24.30 * | ||
| 2018 | Mar | 6.25 * | 0.002 | 0.05 * | 2.16 * | 0.07 | 2.78 * | 0 | 0.01 * | 11.33 * | |
| Apr | 14.13 * | 0 | 0.06 * | 4.05 * | 0.12 * | 4.00 * | 0 | 0.002 | 22.37 * | ||
| May | 24.84 * | 0.01 * | 0.08 * | 5.39 * | 0.13 * | 3.69 * | 0 | 0.002 | 34.15 * | ||
| Jun | 20.68 * | 0.004 | 0.13 * | 4.84 * | 0.08 * | 2.85 * | 0 | 0 | 28.59 * | ||
| Jul | 17.02 * | 0 | 0.33 * | 3.34 * | 0.05 | 2.37 * | 0 | 0.002 | 23.11 * | ||
| Aug | 11.13 * | 0 | 0.30 * | 2.67 * | 0.05 | 1.29 * | 0 | 0.002 | 15.45 * | ||
| Sep | 8.57 * | 0 | 0.21 * | 2.40 * | 0.03 | 1.34 * | 0 | 0.004 | 12.55 * | ||
| Oct | 12.15 * | 0 | 0.22 * | 2.65 * | 0.08 * | 1.56 * | 0 | 0.002 | 16.67 * | ||
| Nov | 21.80 * | 0 | 0.16 * | 2.74 * | 0.11 * | 1.62 * | 0 | 0.002 | 26.43 * | ||
| Dec | 26.54 * | 0.008 * | 0.14 * | 2.56 * | 0.16 * | 1.51 * | 0 | 0 | 30.92 * | ||
| 2017 | Mar | 5.62 * | 0.004 | 0.02 | 1.88 * | 0.07 | 2.63 * | 0.01 | 0.01 * | 10.24 * | |
| Apr | 12.03 * | 0 | 0.02 | 3.25 * | 0.11 * | 5.71 * | 0.002 | 0 | 21.13 * | ||
| May | 17.94 * | 0.002 | 0.02 * | 4.13 * | 0.13 * | 5.82 * | 0 | 0.01 | 28.05 * | ||
| Jun | 14.99 * | 0 | 0.06 * | 3.71 * | 0.08 * | 5.30 * | 0 | 0.004 | 24.15 * | ||
| Jul | 10.05 * | 0 | 0.06 * | 2.81 * | 0.04 | 3.14 * | 0 | 0 | 16.11 * | ||
| Aug | 6.95 * | 0 | 0.08 * | 2.20 * | 0.04 | 1.85 * | 0.004 | 0 | 11.12 * | ||
| Sep | 8.37 * | 0 | 0.07 * | 2.68 * | 0.03 | 2.76 * | 0 | 0.002 | 13.92 * | ||
| Oct | 12.31 * | 0.002 | 0.08 * | 2.67 * | 0.08 * | 2.88 * | 0 | 0.002 | 18.03 * | ||
| Nov | 21.37 * | 0.004 | 0.09 * | 2.86 * | 0.12 * | 3.57 * | 0.004 | 0.002 | 28.02 * | ||
| Dec | 23.64 * | 0 | 0.06 * | 2.39 * | 0.13 * | 4.48 * | 0.002 | 0.002 | 30.70 * | ||
| AS-IR | 2020 | Mar | 3.85 † | 0 | 0.02 | 1.42 † | 0.03 | 0.46 † | 0.002 | 0 | 5.79 † |
| Apr | 4.40 † | 0 | 0.01 | 2.06 † | 0.02 | 0.45 † | 0 | 0 | 6.94 † | ||
| May | 6.25 † | 0 | 0.006 | 2.76 † | 0.03 | 0.48 † | 0 | 0.001 | 9.52 † | ||
| Jun | 6.14 † | 0 | 0.01 | 3.02 † | 0.03 | 0.40 † | 0 | 0.002 | 9.60 † | ||
| Jul | 5.72 † | 0 | 0.001 | 2.64 † | 0.02 | 0.37 † | 0 | 0 | 8.75 † | ||
| Aug | 5.46 † | 0 | 0.002 | 2.27 † | 0.02 | 0.38 † | 0 | 0 | 8.13 † | ||
| Sep | 3.61 † | 0 | 0.001 | 1.91 † | 0.02 | 0.27 † | 0 | 0 | 5.81 † | ||
| Oct | 4.67 † | 0 | 0.001 | 2.16 † | 0.02 | 0.25 † | 0 | 0 | 7.11 † | ||
| Nov | 5.55 † | 0 | 0.003 | 1.96 † | 0.02 | 0.18 † | 0 | 0 | 7.71 † | ||
| Dec | 3.53 † | 0 | 0.007 | 1.36 † | 0.02 | 0.16 † | 0 | 0 | 5.08 † | ||
| 2019 | Mar | 9.13 *,† | 0.05 * | 0.05 * | 2.48 *,† | 0.04 | 1.52 *,† | 0 | 0.001 | 13.26 *,† | |
| Apr | 18.20 *,† | 0.13 * | 0.05 * | 4.06 *,† | 0.07 * | 2.02 *,† | 0.005 | 0 | 24.53 *,† | ||
| May | 24.48 *,† | 0.03 * | 0.09 * | 5.30 *,† | 0.07 * | 2.12 *,† | 0.002 | 0.004 | 32.09 *,† | ||
| Jun | 21.17 *,† | 0.02 * | 0.08 * | 5.11 *,† | 0.05 | 1.88 *,† | 0 | 0 | 28.31 *,† | ||
| Jul | 19.09 *,† | 0.02 * | 0.10 * | 4.06 *,† | 0.05 | 1.99 *,† | 0.004 | 0.006 | 25.31 *,† | ||
| Aug | 11.21 *,† | 0.01 * | 0.07 * | 2.81 *,† | 0.03 | 1.24 *,† | 0 | 0 | 15.37 *,† | ||
| Sep | 9.01 *,† | 0 | 0.07 * | 3.09 *,† | 0.03 | 1.34 *,† | 0 | 0 | 13.53 *,† | ||
| Oct | 12.83 *,† | 0.02 * | 0.09 * | 2.91 *,† | 0.06 * | 1.35 *,† | 0.005 | 0.005 | 17.27 *,† | ||
| Nov | 21.00 *,† | 0.01 | 0.10 * | 2.82 *,† | 0.07 * | 1.42 *,† | 0 | 0 | 25.41 *,† | ||
| Dec | 28.88 *,† | 0.005 | 0.15 * | 2.49 *,† | 0.07 * | 1.55 *,† | 0 | 0.003 | 33.15 *,† | ||
| 2018 | Mar | 8.26 *,† | 0.003 | 0.06 * | 2.82 *,† | 0.04 | 3.76 *,† | 0 | 0.01 * | 14.96 *,† | |
| Apr | 18.79 *,† | 0 | 0.07 * | 5.30 *,† | 0.09 * | 5.40 *,† | 0 | 0.001 | 29.66 *,† | ||
| May | 33.12 *,† | 0.01 * | 0.09 * | 7.03 *,† | 0.09 * | 4.97 *,† | 0 | 0.002 | 45.32 *,† | ||
| Jun | 27.56 *,† | 0.003 | 0.16 * | 6.29 *,† | 0.06 * | 3.84 *,† | 0 | 0 | 37.91 *,† | ||
| Jul | 22.68 *,† | 0 | 0.42 *,† | 4.29 *,† | 0.04 | 3.19 *,† | 0 | 0.002 | 30.62 *,† | ||
| Aug | 14.78 *,† | 0 | 0.38 *,† | 3.44 *,† | 0.04 | 1.73 *,† | 0 | 0.002 | 20.36 *,† | ||
| Sep | 11.34 *,† | 0 | 0.26 *,† | 3.09 *,† | 0.02 | 1.80 *,† | 0 | 0.005 | 16.52 *,† | ||
| Oct | 16.08 *,† | 0 | 0.24 * | 3.45 *,† | 0.06 * | 2.10 *,† | 0 | 0.003 | 19.29 *,† | ||
| Nov | 29.05 *,† | 0 | 0.19 * | 3.57 *,† | 0.07 * | 2.18 *,† | 0 | 0.002 | 30.58 *,† | ||
| Dec | 35.38 *,† | 0.01 * | 0.15 * | 3.32 *,† | 0.11 * | 2.04 *,† | 0 | 0 | 21.94 *,† | ||
| 2017 | Mar | 7.25 *,† | 0.005 | 0.02 | 2.36 *,† | 0.05 | 3.45 *,† | 0.002 | 0.01 * | 13.14 *,† | |
| Apr | 15.58 *,† | 0 | 0.02 | 4.13 *,† | 0.08 * | 7.48 *,† | 0.002 | 0 | 27.30 *,† | ||
| May | 23.23 *,† | 0.002 | 0.03 * | 5.24 *,† | 0.09 * | 7.63 *,† | 0 | 0.008 | 36.23 *,† | ||
| Jun | 19.42 *,† | 0 | 0.06 * | 4.69 *,† | 0.06 * | 6.94 *,† | 0 | 0.005 | 31.17 *,† | ||
| Jul | 13.00 *,† | 0 | 0.07 * | 3.53 *,† | 0.03 | 4.11 *,† | 0 | 0 | 20.75 *,† | ||
| Aug | 8.98 *,† | 0 | 0.08 * | 2.76 *,† | 0.03 | 2.42 *,† | 0.004 | 0 | 14.27 *,† | ||
| Sep | 10.78 *,† | 0 | 0.08 * | 3.40 *,† | 0.02 | 3.62 *,† | 0 | 0.002 | 17.90 *,† | ||
| Oct | 15.83 *,† | 0.003 | 0.08 * | 3.35 *,† | 0.06 * | 3.77 *,† | 0 | 0.002 | 23.10 *,† | ||
| Nov | 27.69 *,† | 0.005 | 0.10 * | 3.62 *,† | 0.09 * | 4.67 *,† | 0.005 | 0.001 | 36.18 *,† | ||
| Dec | 30.59 *,† | 0 | 0.07 * | 3.00 *,† | 0.09 * | 5.87 *,† | 0.003 | 0.001 | 39.62 *,† |
References
- Kim, H.J. Novel respiratory infectious diseases in Korea. Yeungnam Univ. J. Med. 2020, 37, 286–295. [Google Scholar] [CrossRef] [PubMed]
- Kutter, J.S.; Spronken, M.I.; Fraaij, P.L.; Fouchier, R.A.M.; Herfst, S. Transmission routes of respiratory viruses among humans. Curr. Opin. Virol. 2018, 28, 142–151. [Google Scholar] [CrossRef] [PubMed]
- Goronzy, J.J.; Weyand, C.M. Understanding immunosenescence to improve responses to vaccines. Nat. Immunol. 2013, 14, 428–436. [Google Scholar] [CrossRef] [PubMed] [Green Version]
- Nwachuku, N.; Gerba, C.P. Health risks of enteric viral infections in children. Rev. Environ. Contam. Toxicol. 2006, 186, 1–56. [Google Scholar]
- Janati, A.; Hosseiny, M.; Gouya, M.M.; Moradi, G.; Ghaderi, E. Communicable disease reporting systems in the world: A systematic review article. Iran. J. Public Health 2015, 44, 1453–1465. [Google Scholar]
- McArthur, D.B. Emerging infectious diseases. Nurs. Clin. N. Am. 2019, 54, 297–311. [Google Scholar] [CrossRef]
- Park, S.; Cho, E. National Infectious Diseases Surveillance data of South Korea. Epidemiol. Health. 2014, 36, e2014030. [Google Scholar] [CrossRef] [Green Version]
- Centers for Disease Control and Prevention. Diseases & Conditions. 2021. Available online: https://www.cdc.gov/DiseasesConditions/ (accessed on 10 March 2021).
- Drexler, M. What You Need to Know about Infectious Diseases; National Academics Press: Washington, DC, USA, 2010. [Google Scholar]
- Cha, S.H. The history of vaccination and current vaccination policies in Korea. Clin. Exp. Vaccine Res. 2012, 1, 3–8. [Google Scholar] [CrossRef] [Green Version]
- Im, J.H.; Choi, D.H.; Baek, J.; Kwon, H.Y.; Choi, S.R.; Chung, M.H.; Lee, J.S. Altered Influenza Vaccination Coverage and Related Factors in Pregnant Women in Korea from 2007 to 2019. J. Korean Med. Sci. 2021, 36, e42. [Google Scholar] [CrossRef]
- Jung, J.; Ko, Y.J.; Kim, Y.E.; Huh, K.; Park, B.J.; Yoon, S.J. Epidemiological impact of the Korean national immunization program on varicella incidence. J. Korean Med. Sci. 2019, 34, e53. [Google Scholar] [CrossRef] [PubMed]
- Kim, J.H.; Bae, W.; Kim, J.; Hwang, E.S. An urgent need for global preparedness against the reemergence of “Forgotten” infectious diseases in Korea. J. Korean Med. Sci. 2018, 33, e125. [Google Scholar] [CrossRef] [Green Version]
- Fonkwo, P.N. Pricing infectious disease. The economic and health implications of infectious diseases. EMBO Rep. 2008, 9, S13–S17. [Google Scholar] [CrossRef] [Green Version]
- Korea Centers for Disease Control and Prevention. The Report of Updates of COVID-19 (2020) in Korea. 2020. Available online: http://www.kdca.go.kr/board/board.es?mid=a20501000000&bid=0015 (accessed on 10 March 2021). (In Korean)
- Anderson, R.M.; Heesterbeek, H.; Klinkenberg, D.; Hollingsworth, T.D. How will country-based mitigation measures influence the course of the COVID-19 epidemic? Lancet 2020, 395, 931–934. [Google Scholar] [CrossRef]
- Dbouk, T.; Drikakis, D. On respiratory droplets and face masks. Phys. Fluids 2020, 32, 063303. [Google Scholar] [CrossRef]
- Scheid, J.L.; Lupien, S.P.; Ford, G.S.; West, S.L. Commentary: Physiological and psychological impact of face mask usage during the COVID-19 pandemic. Int. J. Environ. Res. Public Health 2020, 17, 6655. [Google Scholar] [CrossRef]
- Price, R.H.M.; Graham, C.; Ramalingam, S. Association between viral seasonality and meteorological factors. Sci. Rep. 2019, 9, 929. [Google Scholar] [CrossRef]
- Lindahl, J.F.; Grace, D. The consequences of human actions on risks for infectious diseases: A review. Infect. Ecol. Epidemiol. 2015, 5, 30048. [Google Scholar] [CrossRef] [PubMed] [Green Version]
- Ministry of the Interior and Safety. Publications. Flattening the Curve on COVID-19. 2020. Available online: https://www.mois.go.kr/eng/bbs/type002/commonSelectBoardArticle.do?bbsId=BBSMSTR_000000000022&nttId=76748 (accessed on 10 March 2021).
- Statistic Korea. Information of Statistic. 2021. Available online: https://meta.narastat.kr/metasvc/index.do?iemInputNo=0000161224513 (accessed on 10 March 2021). (In Korean).
- Korean Statistical Information Service. Statistical Database. 2021. Available online: https://kosis.kr/index/index.do (accessed on 10 March 2021). (In Korean).
- Lee, Y.H.; Choe, Y.J.; Cho, S.I.; Bang, J.H.; Oho, M.D.; Lee, J.K. Increasing varicella incidence rates among children in the Republic of Korea: An age-period-cohort analysis. Epidemiol. Infect. 2019, 147, e245. [Google Scholar] [CrossRef] [PubMed] [Green Version]
- Choe, Y.J.; Lee, Y.H.; Cho, S.I. Increasing mumps incidence rates among children and adolescents in the Republic of Korea: Age-period-cohort analysis. Int. J. Infect. Dis. 2017, 57, 92–97. [Google Scholar] [CrossRef] [PubMed] [Green Version]
- Oh, S.H.; Choi, E.H.; Shin, S.H.; Kim, Y.K.; Chang, J.K.; Choi, K.M.; Hur, J.K.; Kim, K.H.; Kim, J.Y.; Chung, E.H.; et al. Varicella and varicella vaccination in South Korea. Clin. Vaccine Immunol. 2014, 21, 762–768. [Google Scholar] [CrossRef] [Green Version]
- Kim, H.W.; Cho, H.K.; Choi, K.M.; Eun, B.W.; Lee, S.Y.; Kim, K.H. Efficacy of mumps vaccine in Korea. Int. J. Infect. Dis. 2012, 16, E306. [Google Scholar] [CrossRef] [Green Version]
- Huh, K.M.; Jung, J.H.; Hong, J.W.; Kim, M.Y.; Ahn, J.G.; Kim, J.H.; Kang, J.M. Impact of non-pharmaceutical interventions on the incidence of respiratory infections during the COVID-19 outbreak in Korea: A nationwide surveillance study. Clin. Infect. Dis. 2020, 72, e184–e191. [Google Scholar] [CrossRef]
- Eom, H.; Park, Y.; Kim, J.; Yang, J.S.; Kang, H.; Kim, K.; Chun, B.C.; Park, O.; Hong, J.I. Occurrence of measles in a country with elimination status: Amplifying measles infection in hospitalized children due to imported virus. PLoS ONE 2018, 13, e0188957. [Google Scholar] [CrossRef] [Green Version]
- World Health Organization. Regional Office for the Western Pacific. Sixth Annual Meeting of the Regional Verification Commission for Measles Elimination in the Western Pacific, Beijing, China, 12–15 September 2017: Meeting Report. 2017. Available online: https://apps.who.int/iris/handle/10665/259629 (accessed on 10 March 2021).
- Heo, J.Y. Meningococcal disease in Korea: An epidemiologic study of the underestimated infectious disease. Infect. Chemother. 2016, 48, 51–53. [Google Scholar] [CrossRef]
- Kim, H.S.; Engel, S.; Neveu, D.; Thollot, Y.; Oster, P.; Yang, K. Post-Marketing Surveillance Observational Study of Quadrivalent Meningococcal Diphtheria Toxoid Conjugate Vaccine (MenACWY-DT, MCV4/Menactra®) in the Republic of Korea, 2014–2019. Infect. Dis. Ther. 2021, 10, 399–409. (In Korean) [Google Scholar] [CrossRef]
- Ministry of Culture. Korea Policy Briefing. To Prepare for the Increase in Chickenpox Mumps. 2018. Available online: https://www.korea.kr/news/pressReleaseView.do?newsId=156301079 (accessed on 10 March 2021). (In Korean).
- Park, D.W.; Kim, S.H.; Park, J.W.; Kim, M.J.; Cho, S.J.; Park, H.J.; Jung, S.H.; Seo, M.H.; Lee, Y.S.; Kim, B.H.; et al. Incidence and characteristics of scarlet fever, South Korea, 2008–2015. Emerg. Infect. Dis. 2017, 23, 658–661. [Google Scholar] [CrossRef] [PubMed] [Green Version]
- Korea Meteorological Administration (KMA). Climate of Korea. Available online: https://www.kma.go.kr/eng/biz/climate_01.jsp (accessed on 10 March 2021).
- Choi, Y.J.; Lim, Y.H.; Lee, K.S.; Hong, Y.C. Elevation of ambient temperature is associated with an increased risk of herpes zoster: A time-series analysis. Sci. Rep. 2019, 9, 12254. [Google Scholar] [CrossRef] [PubMed] [Green Version]
- Davis, R.E.; Dougherty, E.; McArthur, C.; Huang, Q.S.; Baker, M.G. Cold, dry air is associated with influenza and pneumonia mortality in Auckland, New Zealand. Influenza Other Resp. 2016, 10, 310–313. [Google Scholar] [CrossRef]
- Galvin, C.J.; Li, Y.J.; Malwade, S.; Syed-Abdul, S. COVID-19 preventive measures showing an unintended decline in infectious diseases in Taiwan. Int. J. Infect. Dis. 2020, 98, 18–20. [Google Scholar] [CrossRef] [PubMed]
- Kim, C.; Pae, J.; Kim, W.J.; Jang, Y.; Wie, J.H.; Park, I.Y.; Ko, H.S. Current status of pertussis vaccination during pregnancy and influencing factors in Korea. Taiwan J. Obstet. Gynecol. 2021, 60, 273–280. [Google Scholar] [CrossRef] [PubMed]
- Yu, X.; Duan, J.; Jiang, Y.; Zhang, H. Distinctive trajectories of the COVID-19 epidemic by age and gender: A retrospective modeling of the epidemic in South Korea. Int. J. Infect. Dis. 2020, 98, 200–205. [Google Scholar] [CrossRef] [PubMed]
- Lim, S.; Yoon, H.I.; Song, K.H.; Kim, E.S.; Kim, H.B. Face masks and containment of COVID-19: Experience from South Korea. J. Hosp. Infect. 2020, 106, 206–207. [Google Scholar] [CrossRef]
- Olsen, S.J.; Azziz-Baumgartner, E.; Budd, A.P.; Brammer, L.; Sullivan, S.; Pineda, R.F.; Cohen, C.; Fry, A.M. Decreased influenza activity during the COVID-19 pandemic-United States, Australia, Chile, and South Africa, 2020. Am. J. Transplant. 2020, 20, 3681–3685. [Google Scholar] [CrossRef] [PubMed]
- Tegnell, A. The Swedish public health response to COVID-19. Apmis 2021, 10, 1111. [Google Scholar]
- Sinha, P.; Reifler, K.; Rossi, M.; Sagar, M. COVID-19 mitigation strategies were associated with decreases in other respiratory virus infections [published online ahead of print, 20 March 2021]. Open Forum Infect. Dis. 2021. [Google Scholar]
- Wang, J.; Pan, L.; Tang, S.; Ji, J.S.; Shi, X. Mask use during COVID-19: A risk adjusted strategy. Environ. Pollut. 2020, 266, 115099. [Google Scholar] [CrossRef]
- Feng, S.; Shen, C.; Xia, N.; Song, W.; Fan, M.; Cowling, B.J. Rational use of face masks in the COVID-19 pandemic. Lancet Respir. Med. 2020, 8, 434–436. [Google Scholar] [CrossRef]
- Bahl, P.; Doolan, C.; de Silva, C.; Chughtai, A.A.; Bourouiba, L.; MacIntyre, C.R. Airborne or droplet precautions for health workers treating COVID-19? [published online ahead of print, 16 April 2020]. J. Infect. Dis. 2020. [Google Scholar]
- Sim, S.W.; Moey, K.S.; Tan, N.C. The use of facemasks to prevent respiratory infection: A literature review in the context of the Health Belief Model. Singap. Med. J. 2014, 55, 160–167. [Google Scholar] [CrossRef] [Green Version]
- Chu, D.K.; Akl, E.A.; Duda, S.; Solo, K.; Yaacoub, S.; Schünemann, H.J. Physical distancing, face masks, and eye protection to prevent person-to-person transmission of SARS-CoV-2 and COVID-19: A systematic review and meta-analysis. Lancet 2020, 395, 1973–1987. [Google Scholar] [CrossRef]
- Lam, E.; Rosen, J.B.; Zucker, J.R. Mumps: An update on outbreaks, vaccine efficacy, and genomic diversity. Clin. Microbiol. Rev. 2020, 33, e00151-19. [Google Scholar] [CrossRef] [PubMed]
- van Hoek, A.J.; Andrews, N.; Waight, P.A.; Stowe, J.; Gates, P.; George, R.; Miller, E. The effect of underlying clinical conditions on the risk of developing invasive pneumococcal disease in England. J. Infect. 2012, 65, 17–24. [Google Scholar] [CrossRef] [PubMed]

| Variables | 2020 | 2019 | 2018 | 2017 | 2005 |
|---|---|---|---|---|---|
| Korean RRP, N (%) | 51,829,023 (100) | 51,849,861 (100) | 51,826,059 (100) | 51,778,544 (100) | 48,683,040 (100) |
| Age group, N (%) | |||||
| 0–9 | 3,970,070 (7.7) | 4,166,914 (8.0) | 4,303,062 (8.3) | 4,435,198 (8.6) | 5,829,053 (12.0) |
| 10–19 | 4,793,336 (9.2) | 4,959,010 (9.6) | 5,131,153 (9.9) | 5,304,425 (10.2) | 6,670,033 (13.7) |
| 20–29 | 6,806,153 (13.1) | 6,810,356 (13.1) | 6,823,973 (13.2) | 6,810,967 (13.2) | 7,697,455 (15.8) |
| 30–39 | 6,873,117 (13.3) | 7,071,024 (13.6) | 7,270,143 (14.0) | 7,368,649 (14.2) | 8,859,246 (18.2) |
| 40–49 | 8,294,787 (16.0) | 8,383,230 (16.2) | 8,488,587 (16.4) | 8,702,752 (16.8) | 8,325,045 (17.1) |
| 50–59 | 8,645,014 (16.7) | 8,667,377 (16.7) | 8,615,884(16.6) | 8,490,204 (16.4) | 5,079,574 (10.4) |
| 60–69 | 6,744,506 (13.0) | 6,310,651 (12.2) | 5,949,639 (11.5) | 5,657,264 (10.9) | 3,674,784 (7.5) |
| 70+ | 5,702,040 (11.0) | 5,481,299 (10.6) | 5,243,618 (10.1) | 5,009,085 (9.7) | 2,547,850 (5.2) |
| Sex group, N (%) | |||||
| Male | 25,841,029 (49.9) | 25,864,816 (49.9) | 25,866,129 (49.9) | 25,855,919 (49.9) | 24,409,659 (50.1) |
| Female | 25,987,994 (50.1) | 25,985,045 (50.1) | 25,959,930 (50.1) | 25,922,625 (50.1) | 24,273,381 (49.9) |
| Category | Year | Chickenpox | Measles | Pertussis | Mumps | IPD | Scarlet Fever | Rubella | MD | All Diseases |
|---|---|---|---|---|---|---|---|---|---|---|
| No. of cases | 2020 | 18,165 | 0 | 35 | 8139 | 197 | 1239 | 1 | 2 | 27,778 |
| 2019 | 66,284 | 120 | 393 | 13,664 | 422 | 6119 | 7 | 11 | 87,020 | |
| 2018 | 84,537 | 12 | 877 | 17,002 | 456 | 11,932 | 0 | 13 | 114,829 | |
| 2017 | 69,010 | 6 | 290 | 14,805 | 434 | 19,753 | 7 | 16 | 104,321 | |
| IR 1 | 2020 (Ref.) | 35.05 | 0 | 0.07 | 15.70 | 0.38 | 2.39 | 0.002 | 0.004 | 53.60 |
| 2019 | 127.84 * | 0.23* | 0.76 * | 26.35 * | 0.81 * | 11.80 * | 0.01 * | 0.02 * | 167.83 * | |
| 2018 | 163.12 * | 0.02* | 1.69 * | 32.81 * | 0.88 * | 23.02 * | 0 | 0.03 * | 221.57 * | |
| 2017 | 133.28 * | 0.01* | 0.56 * | 28.59 * | 0.84 * | 38.15 * | 0.01 * | 0.03 * | 201.48 * | |
| AS-IR 1 | 2020 (Ref.) | 52.56 † | 0 | 0.07 | 22.92 † | 0.24 † | 3.66 † | 0.002 | 0.003 | 79.47 † |
| 2019 | 186.38 *,† | 0.88 *,† | 0.88 *,† | 37.43 *,† | 0.57 *,† | 17.48 *,† | 0.02 * | 0.02 * | 243.08 *,† | |
| 2018 | 224.26 *,† | 2.10 * | 2.10 *,† | 44.10 *,† | 0.67 *,† | 32.04 *,† | 0 | 0.03 * | 303.21 *,† | |
| 2017 | 183.32 *,† | 0.64 * | 0.64 * | 38.38 *,† | 0.62 *,† | 53.15 *,† | 0.02 * | 0.03 * | 276.18 *,† | |
| SS-IR 1 | 2020 (Ref.) | 35.05 | 0 | 0.07 | 15.71 | 0.38 | 2.39 | 0.002 | 0.004 | 53.61 |
| 2019 | 127.87 * | 0.23 * | 0.76 * | 26.37 * | 0.82 * | 11.81 * | 0.01 * | 0.02 * | 167.89 * | |
| 2018 | 163.15 * | 0.02 * | 1.69 * | 32.82 * | 0.88 * | 23.04 * | 0 | 0.03 * | 221.64 * | |
| 2017 | 133.31 * | 0.01 * | 0.56 * | 28.61 * | 0.84 * | 38.17 * | 0.01 * | 0.03 * | 201.54 * |
| Category | Year | Chickenpox | Measles | Pertussis | Mumps | IPD | Scarlet Fever | Rubella | MD | All Diseases |
|---|---|---|---|---|---|---|---|---|---|---|
| IRR | 2019 | 3.6 * | - | 11.2 * | 1.7 * | 2.1 * | 4.9 * | 7.0 * | 5.5 * | 3.1 * |
| 2018 | 4.7 * | - | 25.1 * | 2.1 * | 2.3 * | 9.6 * | - | 6.5 * | 4.1 * | |
| 2017 | 3.8 * | - | 8.3 * | 1.8 * | 2.2 * | 16.0 * | 7.0 * | 8.0 * | 3.8 * | |
| AS-IRR | 2019 | 3.6 * | - | 12.5 * | 1.6 * | 2.3 * | 4.8 * | 8.2 * | 6.4 * | 3.1 * |
| 2018 | 4.3 * | - | 30.0 * | 1.9 * | 2.7 * | 8.8 * | - | 9.1 * | 3.8 * | |
| 2017 | 3.5 * | - | 9.1 * | 1.7 * | 2.6 * | 14.6 * | 8.3 * | 9.8 * | 3.5 * |
| Category | Year | Month | Chickenpox | Measles | Pertussis | Mumps | IPD | Scarlet Fever | Rubella | MD | All Diseases |
|---|---|---|---|---|---|---|---|---|---|---|---|
| IRR | 2019 | Mar | 2.4 * | - | 2.3 * | 1.7 * | 1.0 | 3.4 * | 0 | - | 2.3 * |
| Apr | 4.2 * | - | 4.5 * | 2.0 * | 2.9 * | 4.7 * | - | - | 3.6 * | ||
| May | 4.0 * | - | 21.5 * | 2.0 * | 2.2 * | 4.6 * | - | 2.0 | 3.4 * | ||
| Jun | 3.5 * | - | 6.0 * | 1.7 * | 2.0 * | 4.8 * | - | 0 | 3.0 * | ||
| Jul | 3.4 * | - | 46.0 * | 1.6 * | 1.9 * | 5.4 * | - | - | 3.0 * | ||
| Aug | 2.1 * | - | 15.5 * | 1.3 * | 1.4 | 3.4 * | - | - | 2.0 * | ||
| Sep | 2.6 * | - | 30.0 * | 1.7 * | 1.3 | 5.0 * | - | - | 2.4 * | ||
| Oct | 2.8 * | - | 43.0 * | 1.4 * | 2.5 * | 5.5 * | - | - | 2.5 * | ||
| Nov | 3.9 * | - | 22.0 * | 1.5 * | 3.0 * | 8.0 * | - | - | 3.4 * | ||
| Dec | 8.4 * | - | 17.5 * | 1.9 * | 3.7 * | 9.9 * | - | - | 6.6 * | ||
| 2018 | Mar | 2.3 * | - | 2.8 * | 2.1 * | 1.1 | 8.7 * | 0 | - | 2.7 * | |
| Apr | 4.5 * | - | 5.0 * | 2.7 * | 3.2 * | 12.9 * | - | - | 4.5 * | ||
| May | 5.6 * | - | 21.0 * | 2.7 * | 2.9 * | 11.1 * | - | 1.0 | 5.0 * | ||
| Jun | 4.7 * | - | 11.2 * | 2.2 * | 2.0 * | 10.3 * | - | 0 | 4.1 * | ||
| Jul | 4.2 * | - | 169.0 * | 1.7 * | 1.5 | 9.0 * | - | - | 3.7 * | ||
| Aug | 2.9 * | - | 79.0 * | 1.6 * | 1.6 | 4.8 * | - | - | 2.7 * | ||
| Sep | 3.3 * | - | 111.0 * | 1.7 * | 0.8 | 7.0 * | - | - | 3.0 * | ||
| Oct | 3.6 * | - | 114.0 * | 1.7 * | 2.3 * | 8.8 * | - | - | 3.2 * | ||
| Nov | 5.5 * | - | 42.5 * | 1.9 * | 3.1 * | 12.8 * | - | - | 4.7 * | ||
| Dec | 10.6 * | - | 18.3 * | 2.5 * | 5.4 * | 13.5 * | - | - | 8.4 * | ||
| 2017 | Mar | 2.0 * | - | 0.8 | 1.8 * | 1.2 | 8.2 * | 1.0 | - | 2.4 * | |
| Apr | 3.8 * | - | 1.8 | 2.2 * | 3.0 * | 18.4 * | - | - | 4.2 * | ||
| May | 4.0 * | - | 6.0 * | 2.1 * | 2.7 * | 17.5 * | - | 4.0 | 4.1 * | ||
| Jun | 3.4 * | - | 5.0 * | 1.7 * | 2.0 * | 19.1 * | - | 2.0 | 3.5 * | ||
| Jul | 2.3 * | - | 31.0 * | 1.4 * | 1.4 | 11.9 * | - | - | 2.6 * | ||
| Aug | 1.8 * | - | 19.5 * | 1.3 * | 1.2 | 6.9 * | - | - | 1.9 * | ||
| Sep | 3.2 * | - | 37.0 * | 1.9 * | 0.8 | 14.5 * | - | - | 3.3 * | ||
| Oct | 3.7 * | - | 42.0 * | 1.7 * | 2.4 * | 16.2 * | - | - | 3.5 * | ||
| Nov | 5.4 * | - | 24.5 * | 2.0 * | 3.4 * | 28.0 * | - | - | 5.0 * | ||
| Dec | 9.4 * | - | 7.8 * | 2.4 * | 4.5 * | 40.0 * | - | - | 8.4 * | ||
| AS-IRR | 2019 | Mar | 2.4 * | - | 2.5 * | 1.7 * | 1.1 | 3.3 * | 0 | - | 2.3 * |
| Apr | 4.1 * | - | 3.6 * | 2.0 * | 3.2 * | 4.5 * | - | - | 3.5 * | ||
| May | 3.9 * | - | 15.4 * | 1.9 * | 2.5 * | 4.4 * | - | 3.9 | 3.4 * | ||
| Jun | 3.4 * | - | 6.1 * | 1.7 * | 1.9 | 4.7 * | - | 0 | 2.9 * | ||
| Jul | 3.3 * | - | 117.8 * | 1.5 * | 2.0 | 5.3 * | - | - | 2.9* | ||
| Aug | 2.1 * | - | 37.7 * | 1.2 * | 1.7 | 3.2 * | - | - | 1.9 * | ||
| Sep | 2.5 * | - | 76.8 * | 1.6 * | 1.2 | 4.9 * | - | - | 2.3 * | ||
| Oct | 2.7 * | - | 101.0 * | 1.3 * | 2.9 * | 5.3 * | - | - | 2.4 * | ||
| Nov | 3.8 * | - | 31.7 * | 1.4 * | 4.0 * | 7.7 * | - | - | 3.3 * | ||
| Dec | 8.2 * | - | 20.8 * | 1.8 * | 4.2 * | 9.6 * | - | - | 6.5 * | ||
| 2018 | Mar | 2.1 * | - | 3.0 * | 2.0 * | 1.4 | 8.2 * | 0 | - | 2.6 * | |
| Apr | 4.3 * | - | 5.3 * | 2.6 * | 4.0 * | 12.0 * | - | - | 4.3 * | ||
| May | 5.3 * | - | 16.3 * | 2.6 * | 3.3 * | 10.4 * | - | 1.9 | 4.8 * | ||
| Jun | 4.5 * | - | 12.2 * | 2.1 * | 2.1 * | 9.5 * | - | 0 | 4.0 * | ||
| Jul | 4.0 * | - | 481.6 * | 1.6 * | 1.6 | 8.5 * | - | - | 3.5 * | ||
| Aug | 2.7 * | - | 217.3 * | 1.5 * | 1.8 | 4.5 * | - | - | 2.5 * | ||
| Sep | 3.1 * | - | 300.5 * | 1.6 * | 1.0 | 6.6 * | - | - | 2.8 * | ||
| Oct | 3.4 * | - | 283.1 * | 1.6 * | 2.7 * | 8.3 * | - | - | 2.7 * | ||
| Nov | 5.2 * | - | 61.3 * | 1.8 * | 4.3 * | 11.9 * | - | - | 4.0 * | ||
| Dec | 10.0 * | - | 21.3 * | 2.4 * | 6.3 * | 12.7 * | - | - | 4.3 * | ||
| 2017 | Mar | 1.9 * | - | 0.8 | 1.7 * | 1.4 | 7.5 * | 0.8 | - | 2.3 * | |
| Apr | 3.5 * | - | 1.6 | 2.0 * | 3.8 * | 16.6 * | - | - | 3.9 * | ||
| May | 3.7 * | - | 4.8 * | 1.9 * | 3.4 * | 16.0 * | - | 7.2 | 3.8 * | ||
| Jun | 3.2 * | - | 4.9 * | 1.6 * | 2.1 * | 17.2 * | - | 2.4 | 3.2 * | ||
| Jul | 2.3 * | - | 77.0 * | 1.3 * | 1.2 | 11.0 * | - | - | 2.4 * | ||
| Aug | 1.6 * | - | 47.3 * | 1.2 * | 1.4 | 6.3 * | - | - | 1.8 * | ||
| Sep | 3.0 * | - | 88.7 * | 1.8 * | 0.9 | 13.2 * | - | - | 3.1 * | ||
| Oct | 3.4 * | - | 94.5 * | 1.5 * | 2.7 * | 14.9 * | - | - | 3.2 * | ||
| Nov | 5.0 * | - | 33.4 * | 1.8 * | 5.0 * | 25.5 * | - | - | 4.7 * | ||
| Dec | 8.6 * | - | 9.4 * | 2.2 * | 5.2 * | 36.5 * | - | - | 7.8 * |
Publisher’s Note: MDPI stays neutral with regard to jurisdictional claims in published maps and institutional affiliations. |
© 2021 by the authors. Licensee MDPI, Basel, Switzerland. This article is an open access article distributed under the terms and conditions of the Creative Commons Attribution (CC BY) license (https://creativecommons.org/licenses/by/4.0/).
Share and Cite
Kim, D.H.; Nguyen, T.M.; Kim, J.H. Infectious Respiratory Diseases Decreased during the COVID-19 Pandemic in South Korea. Int. J. Environ. Res. Public Health 2021, 18, 6008. https://doi.org/10.3390/ijerph18116008
Kim DH, Nguyen TM, Kim JH. Infectious Respiratory Diseases Decreased during the COVID-19 Pandemic in South Korea. International Journal of Environmental Research and Public Health. 2021; 18(11):6008. https://doi.org/10.3390/ijerph18116008
Chicago/Turabian StyleKim, Da Hae, Thi Mai Nguyen, and Jin Hee Kim. 2021. "Infectious Respiratory Diseases Decreased during the COVID-19 Pandemic in South Korea" International Journal of Environmental Research and Public Health 18, no. 11: 6008. https://doi.org/10.3390/ijerph18116008