
Salivary Antibodies against Multiple Environmental Pathogens Found in Individuals Recreating at an Iowa Beach

 , ,
, , 
Abstract
:1. Introduction
2. Materials and Methods
2.1. Collection, Processing and Analysis of Saliva Samples
2.2. Activation, Coupling, Controls and Measurements for Cross-Reactivity
2.3. Assessing Exposure
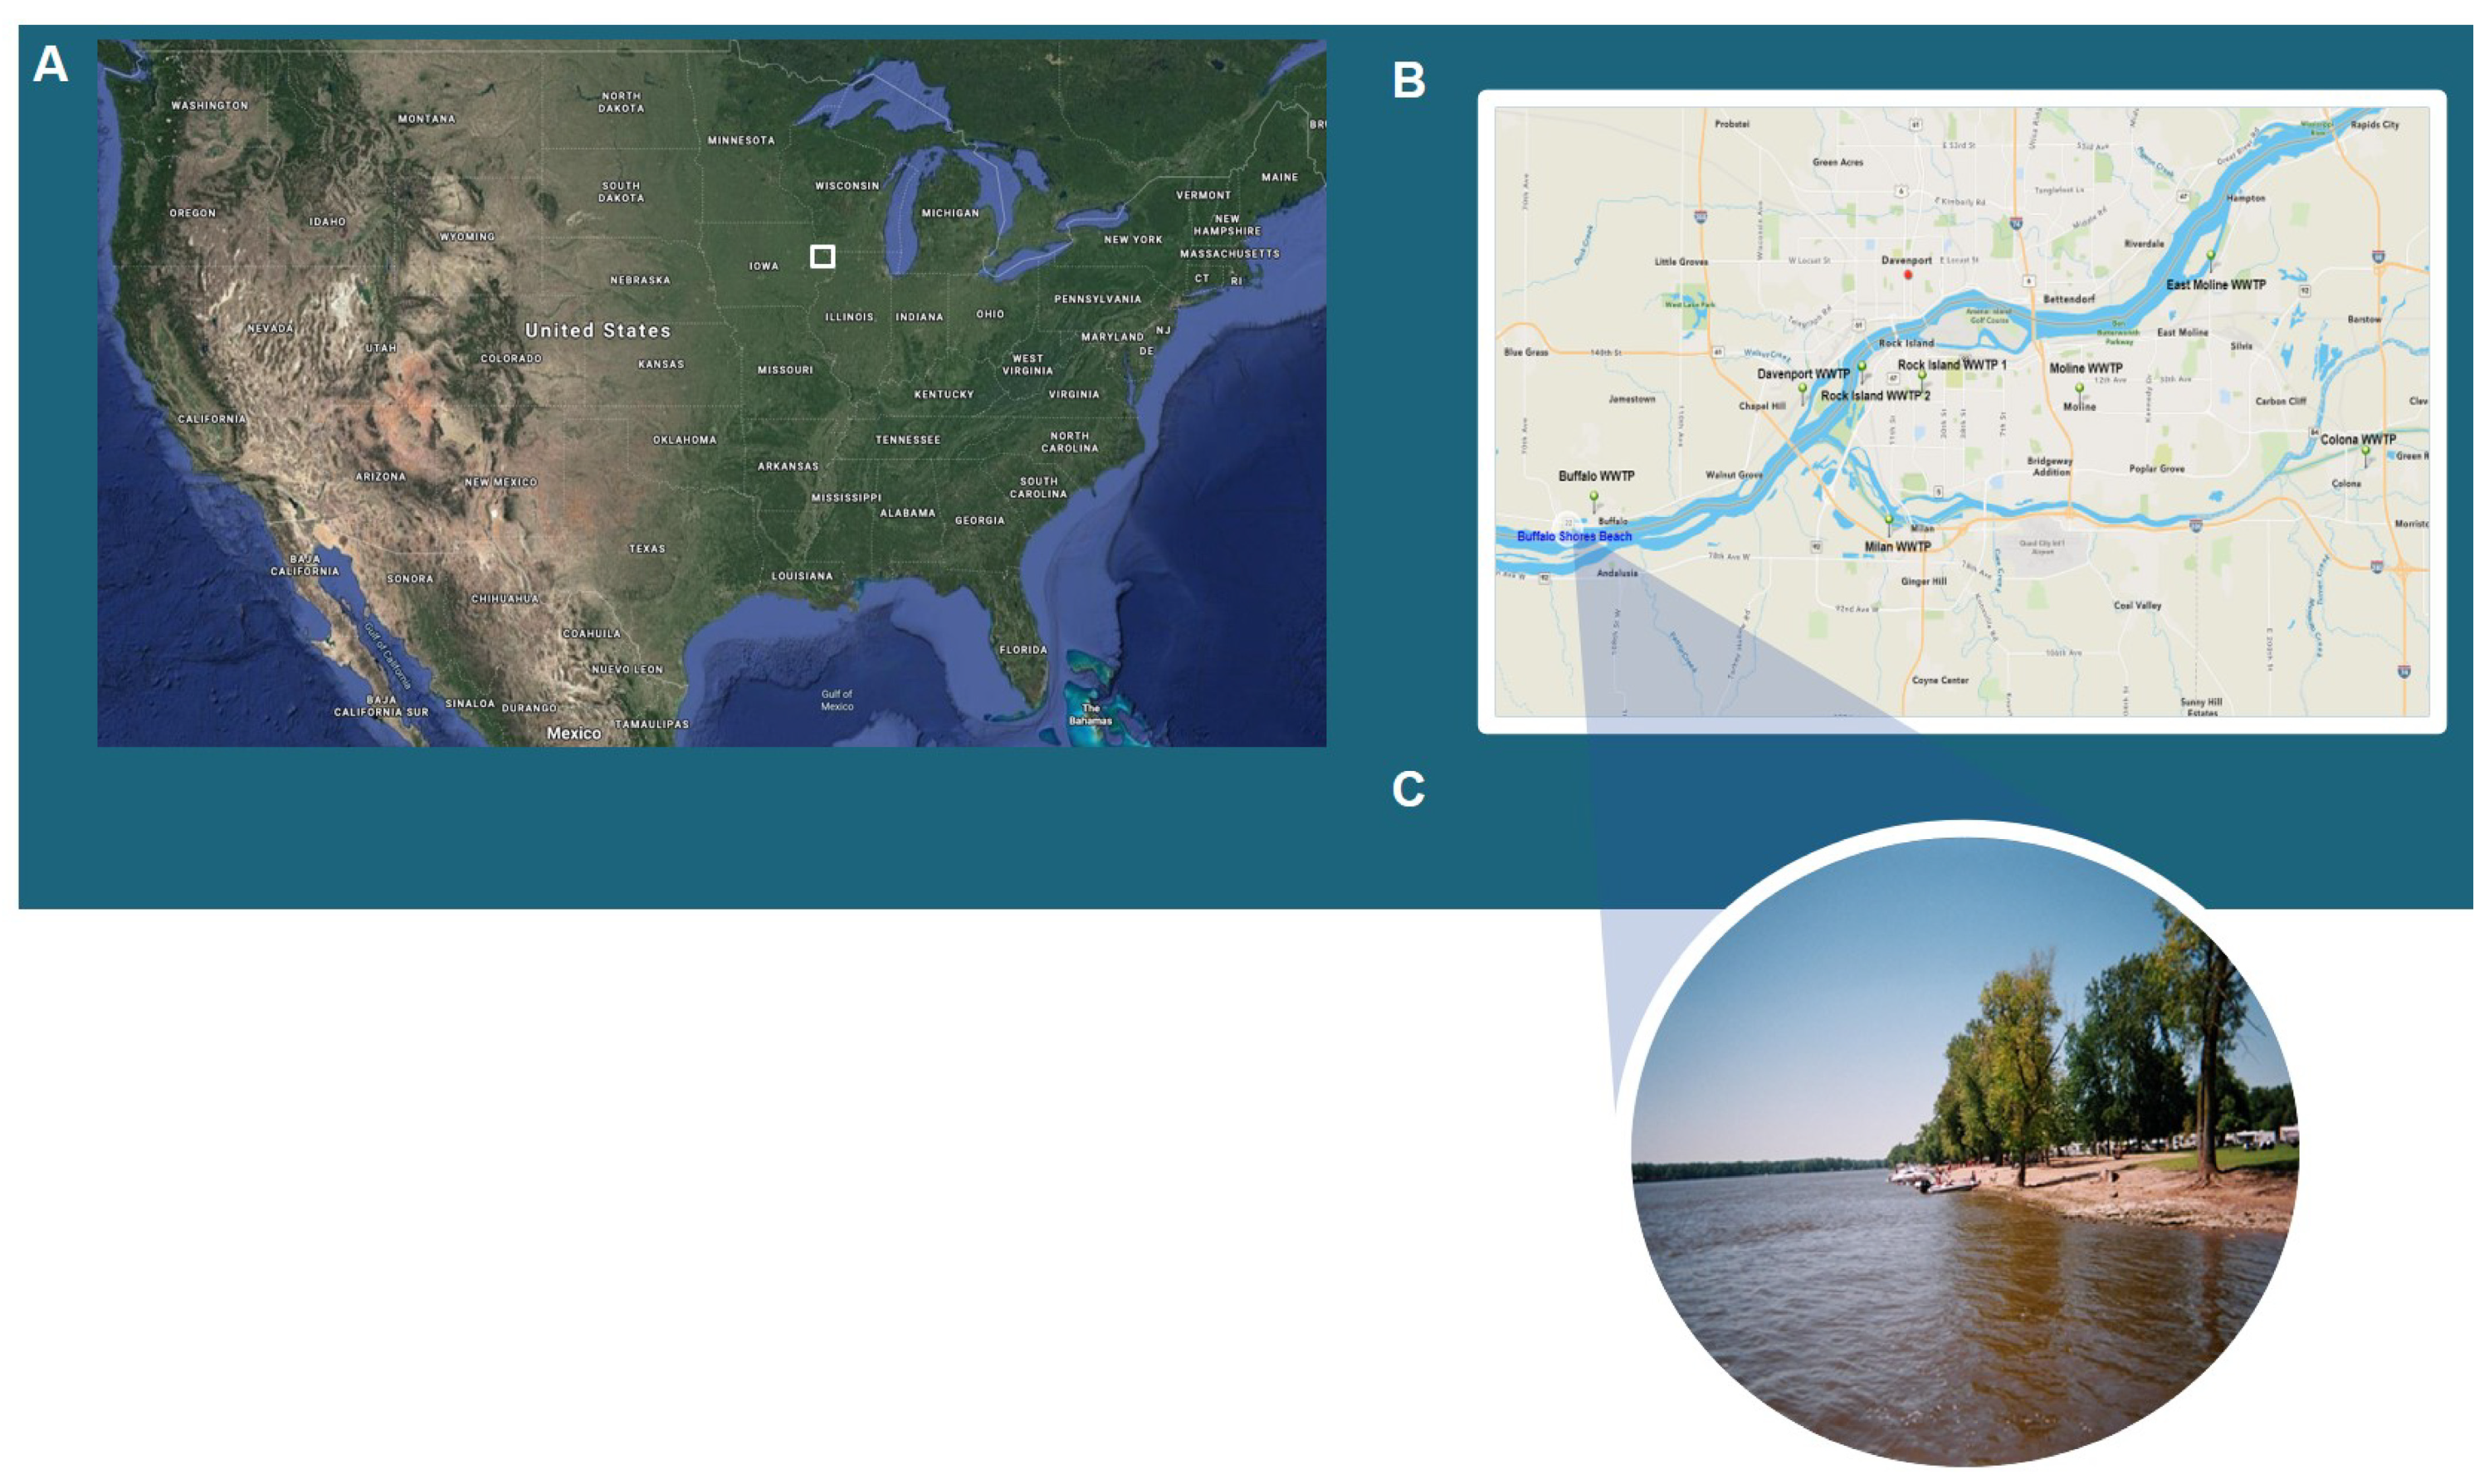
2.4. Study Site
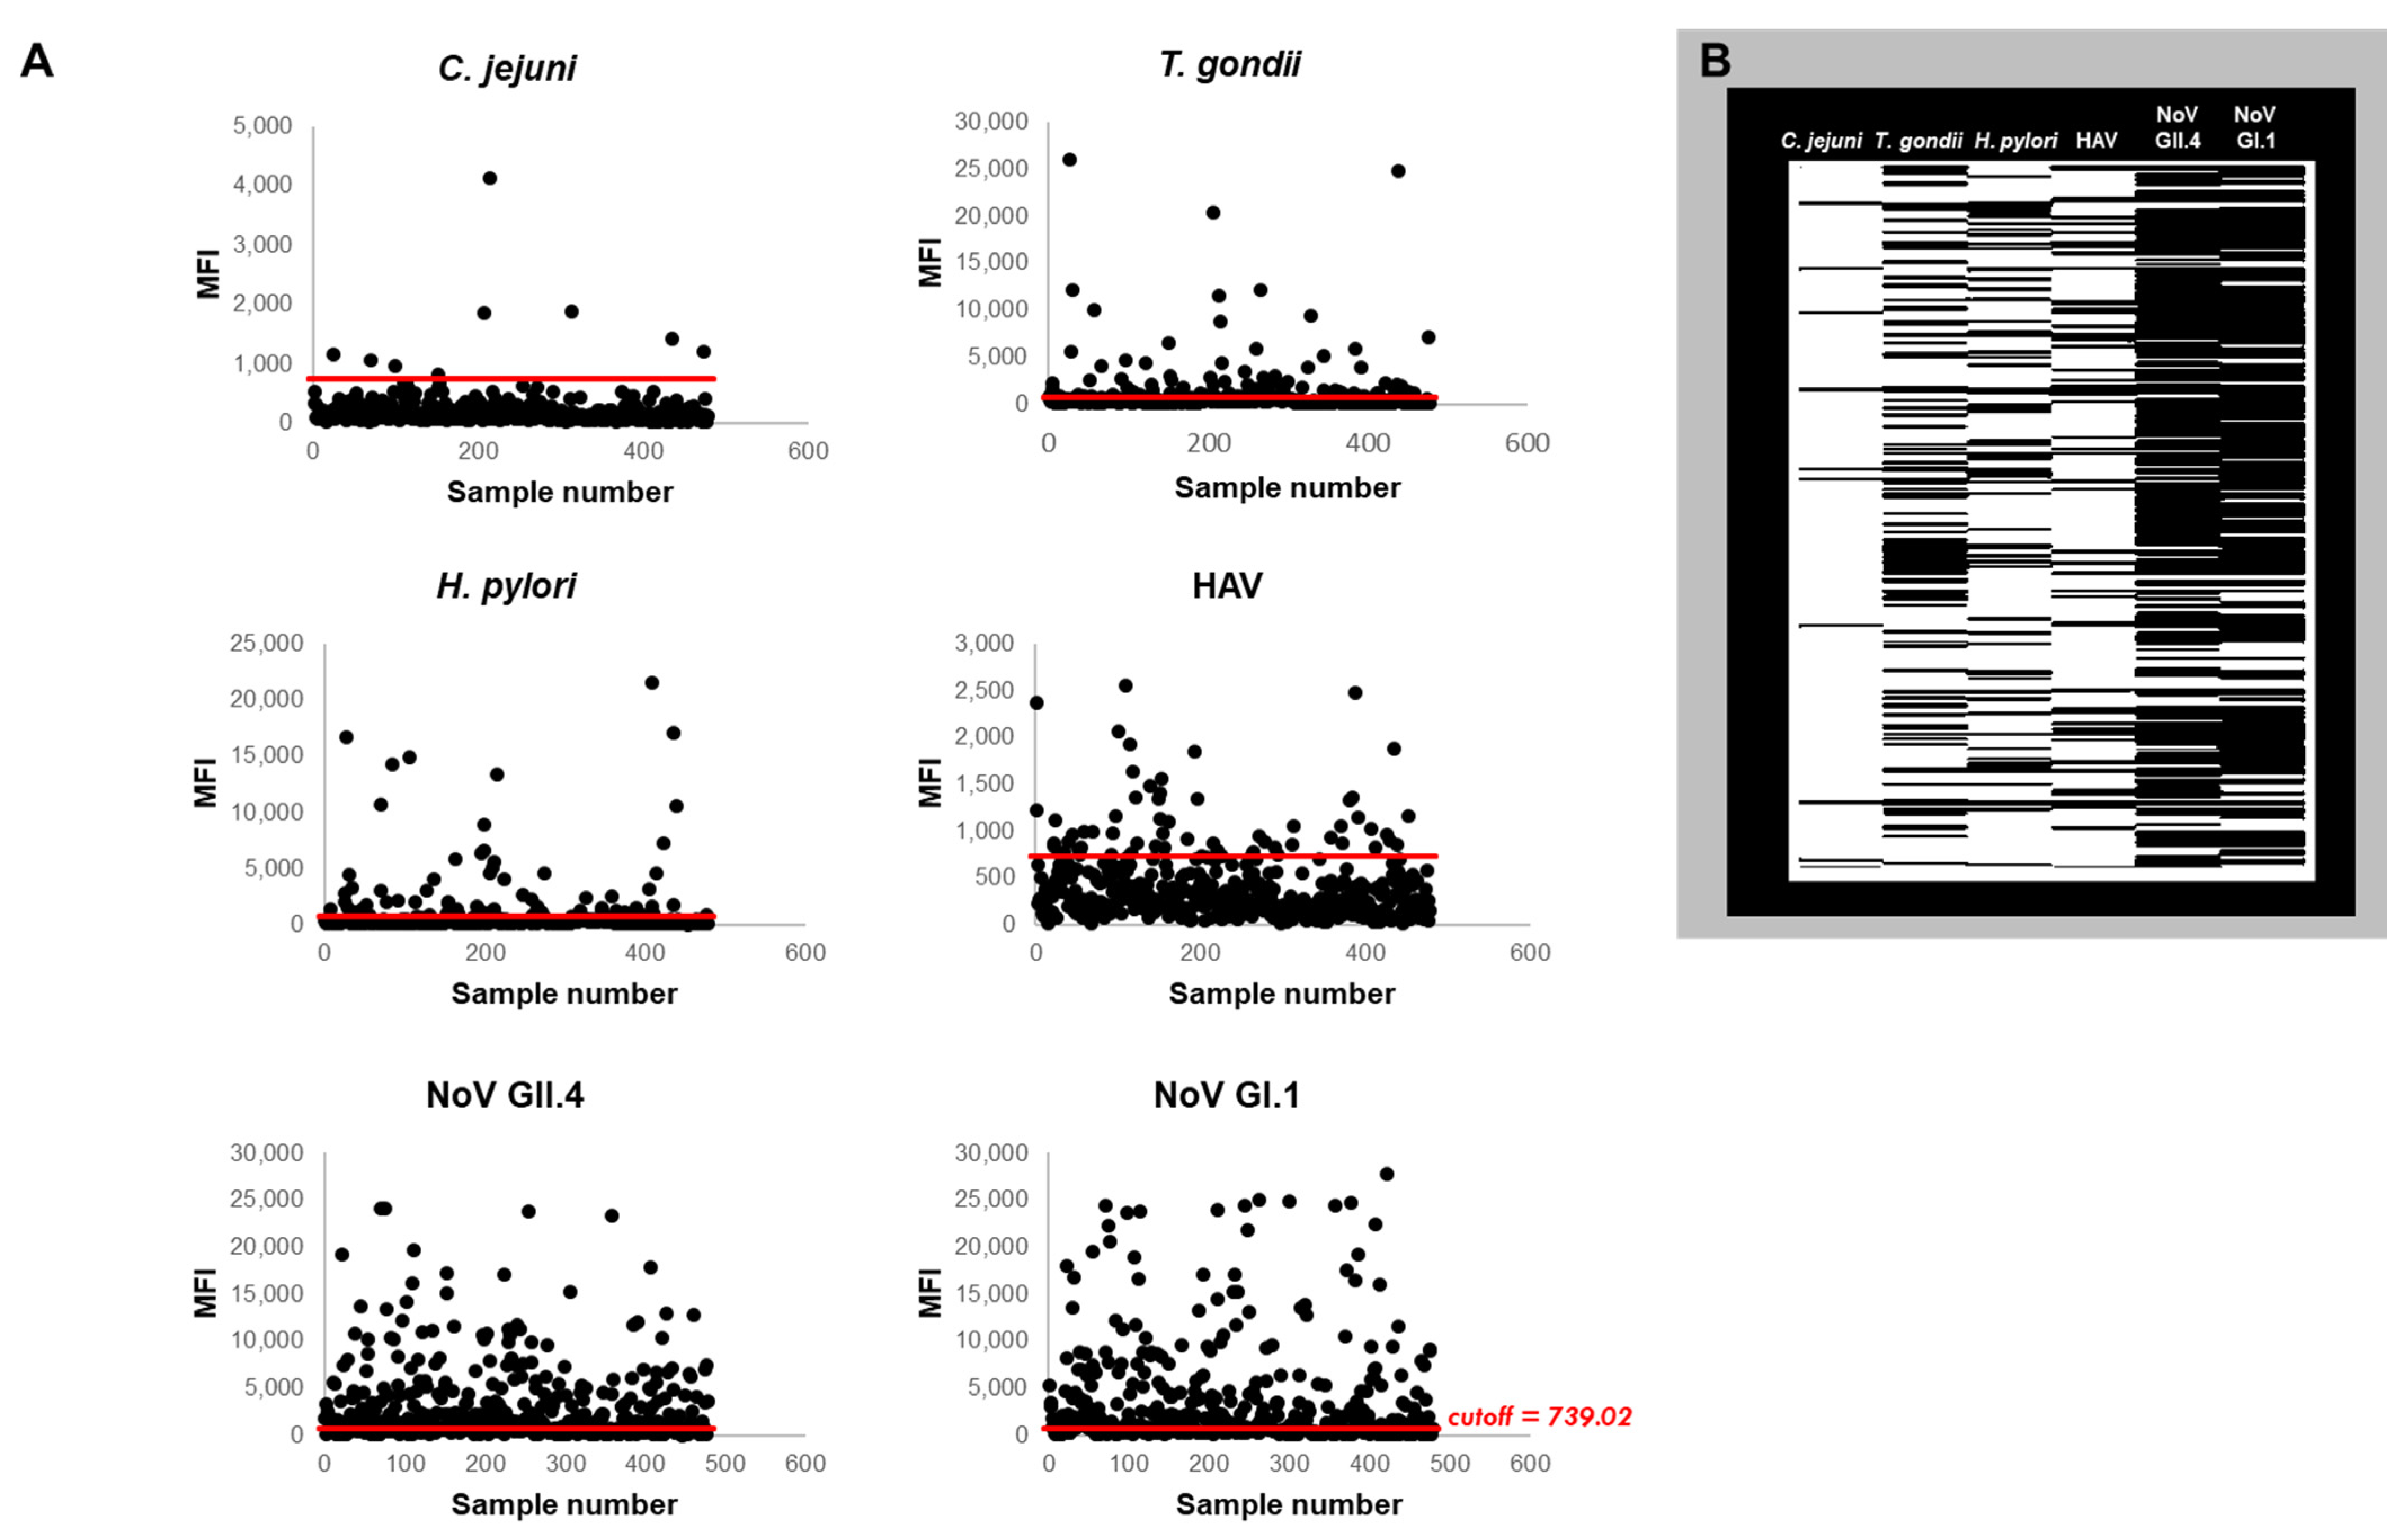
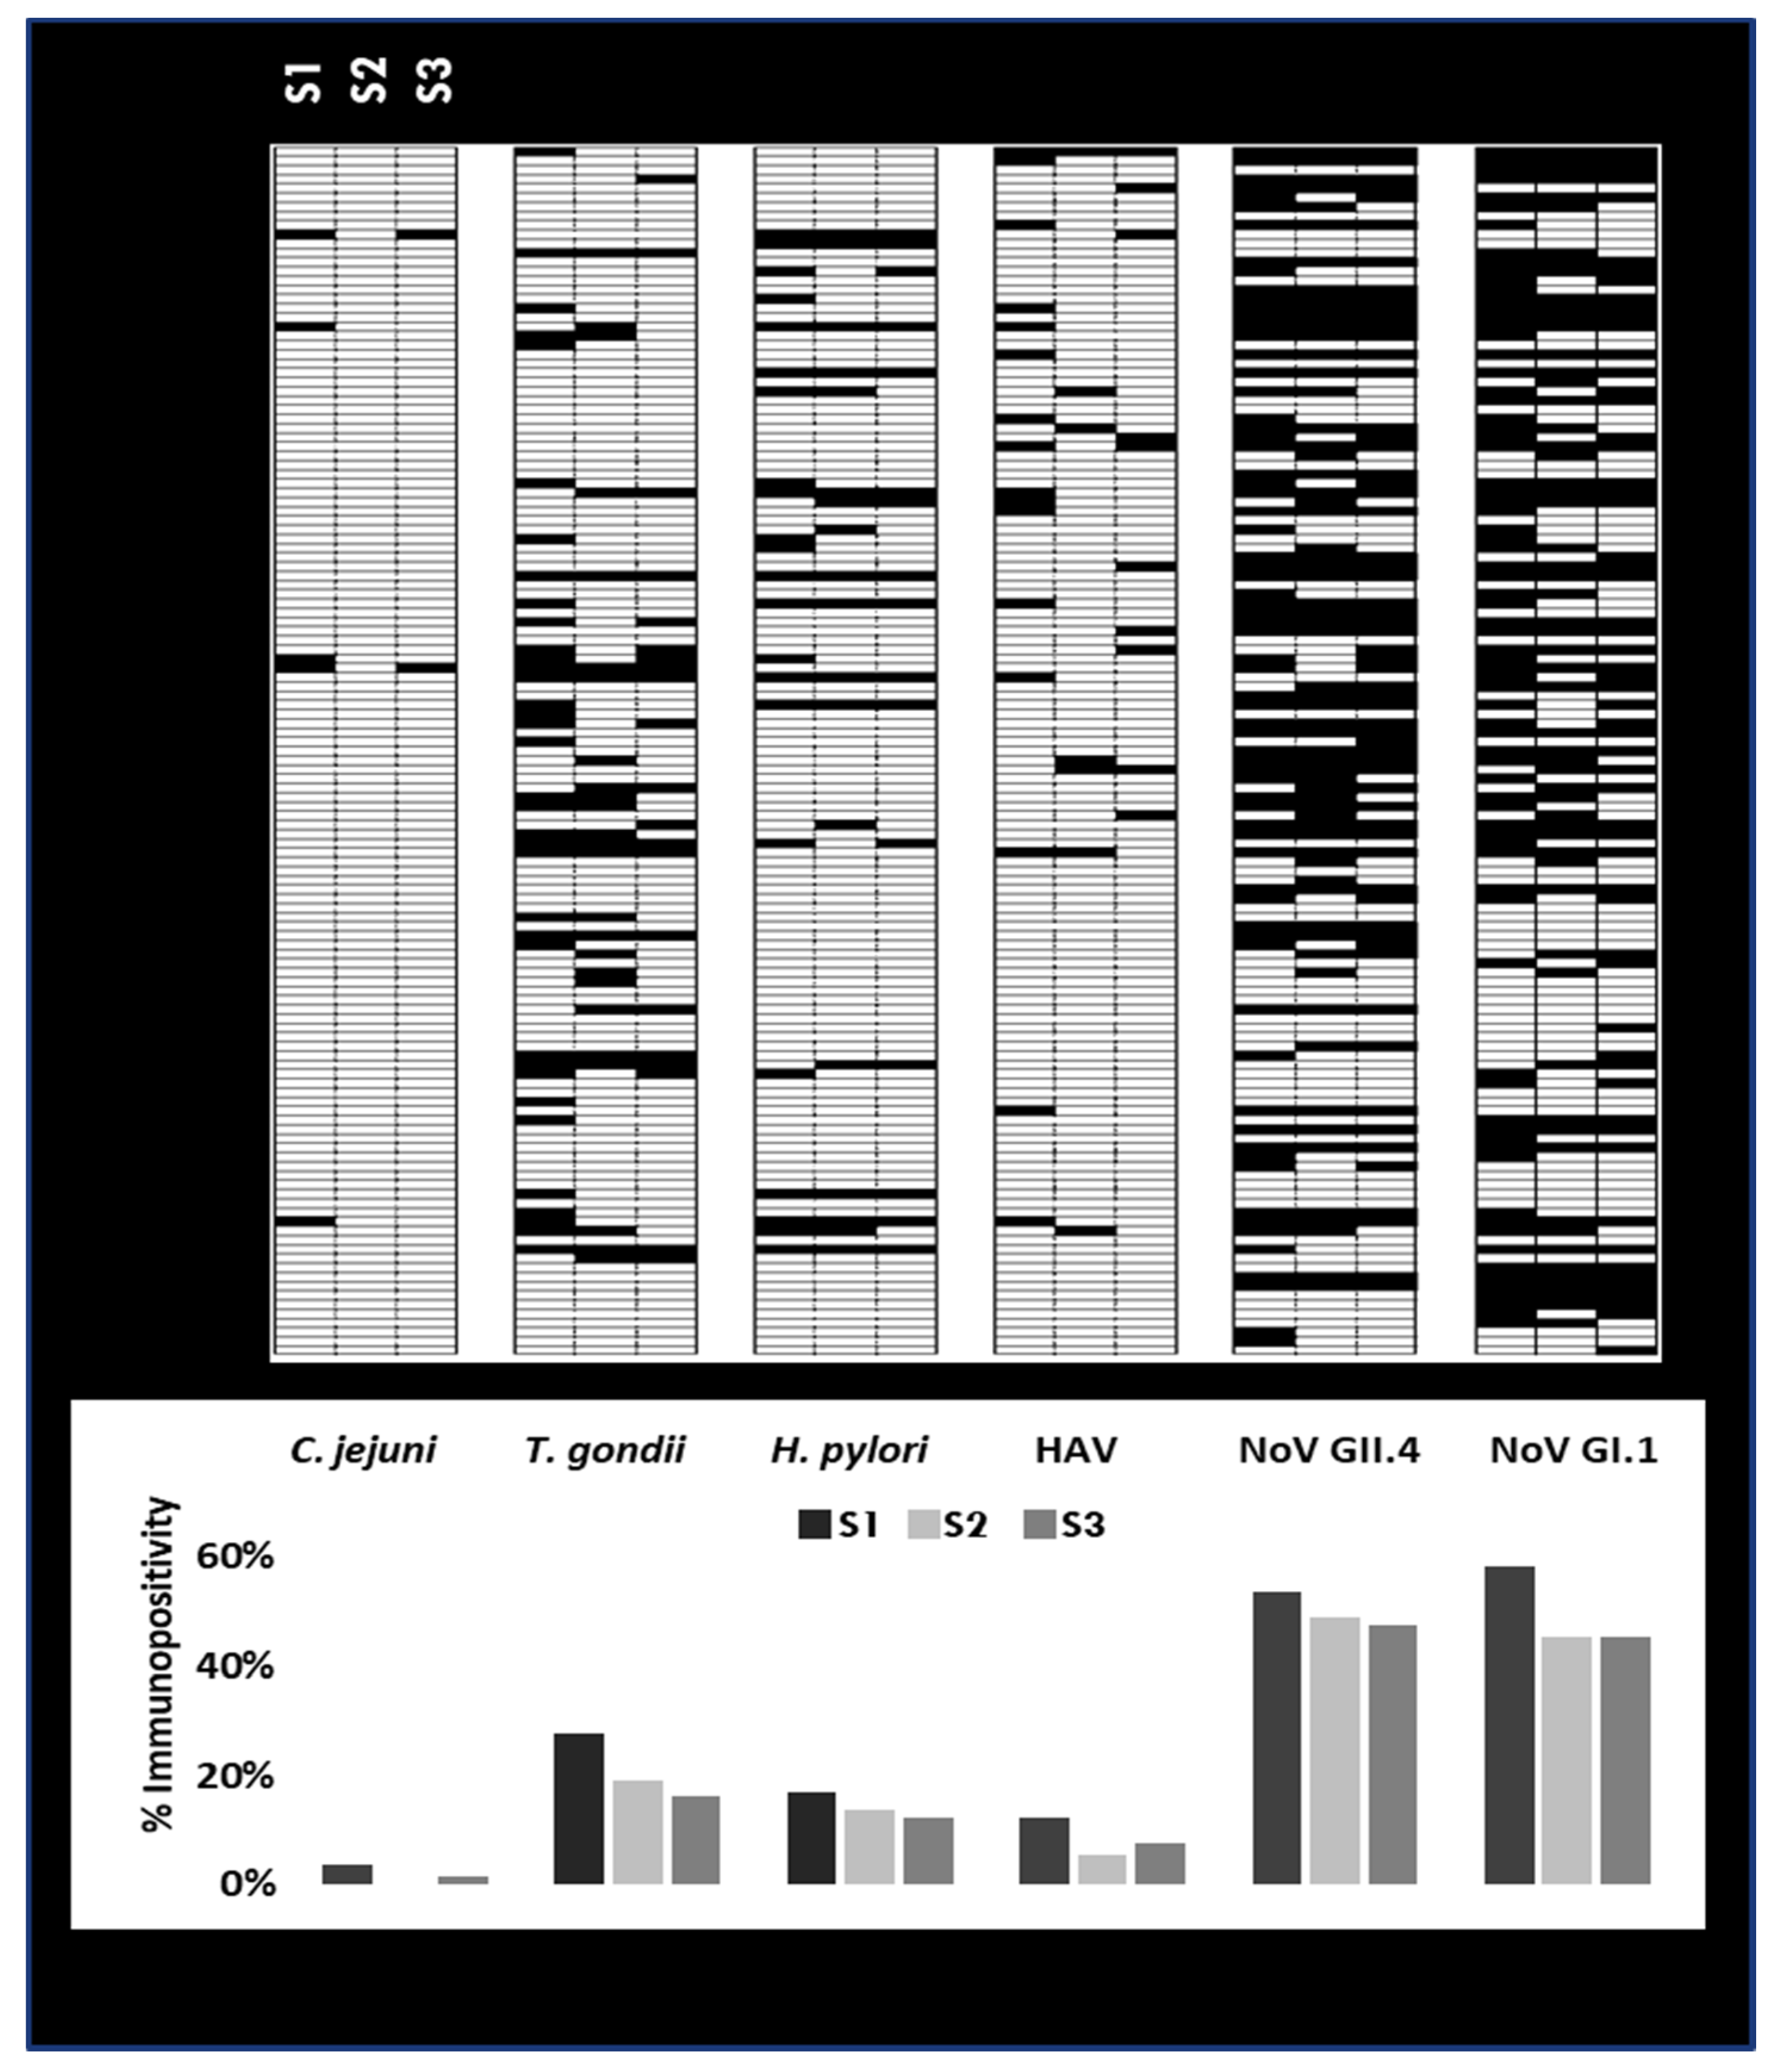
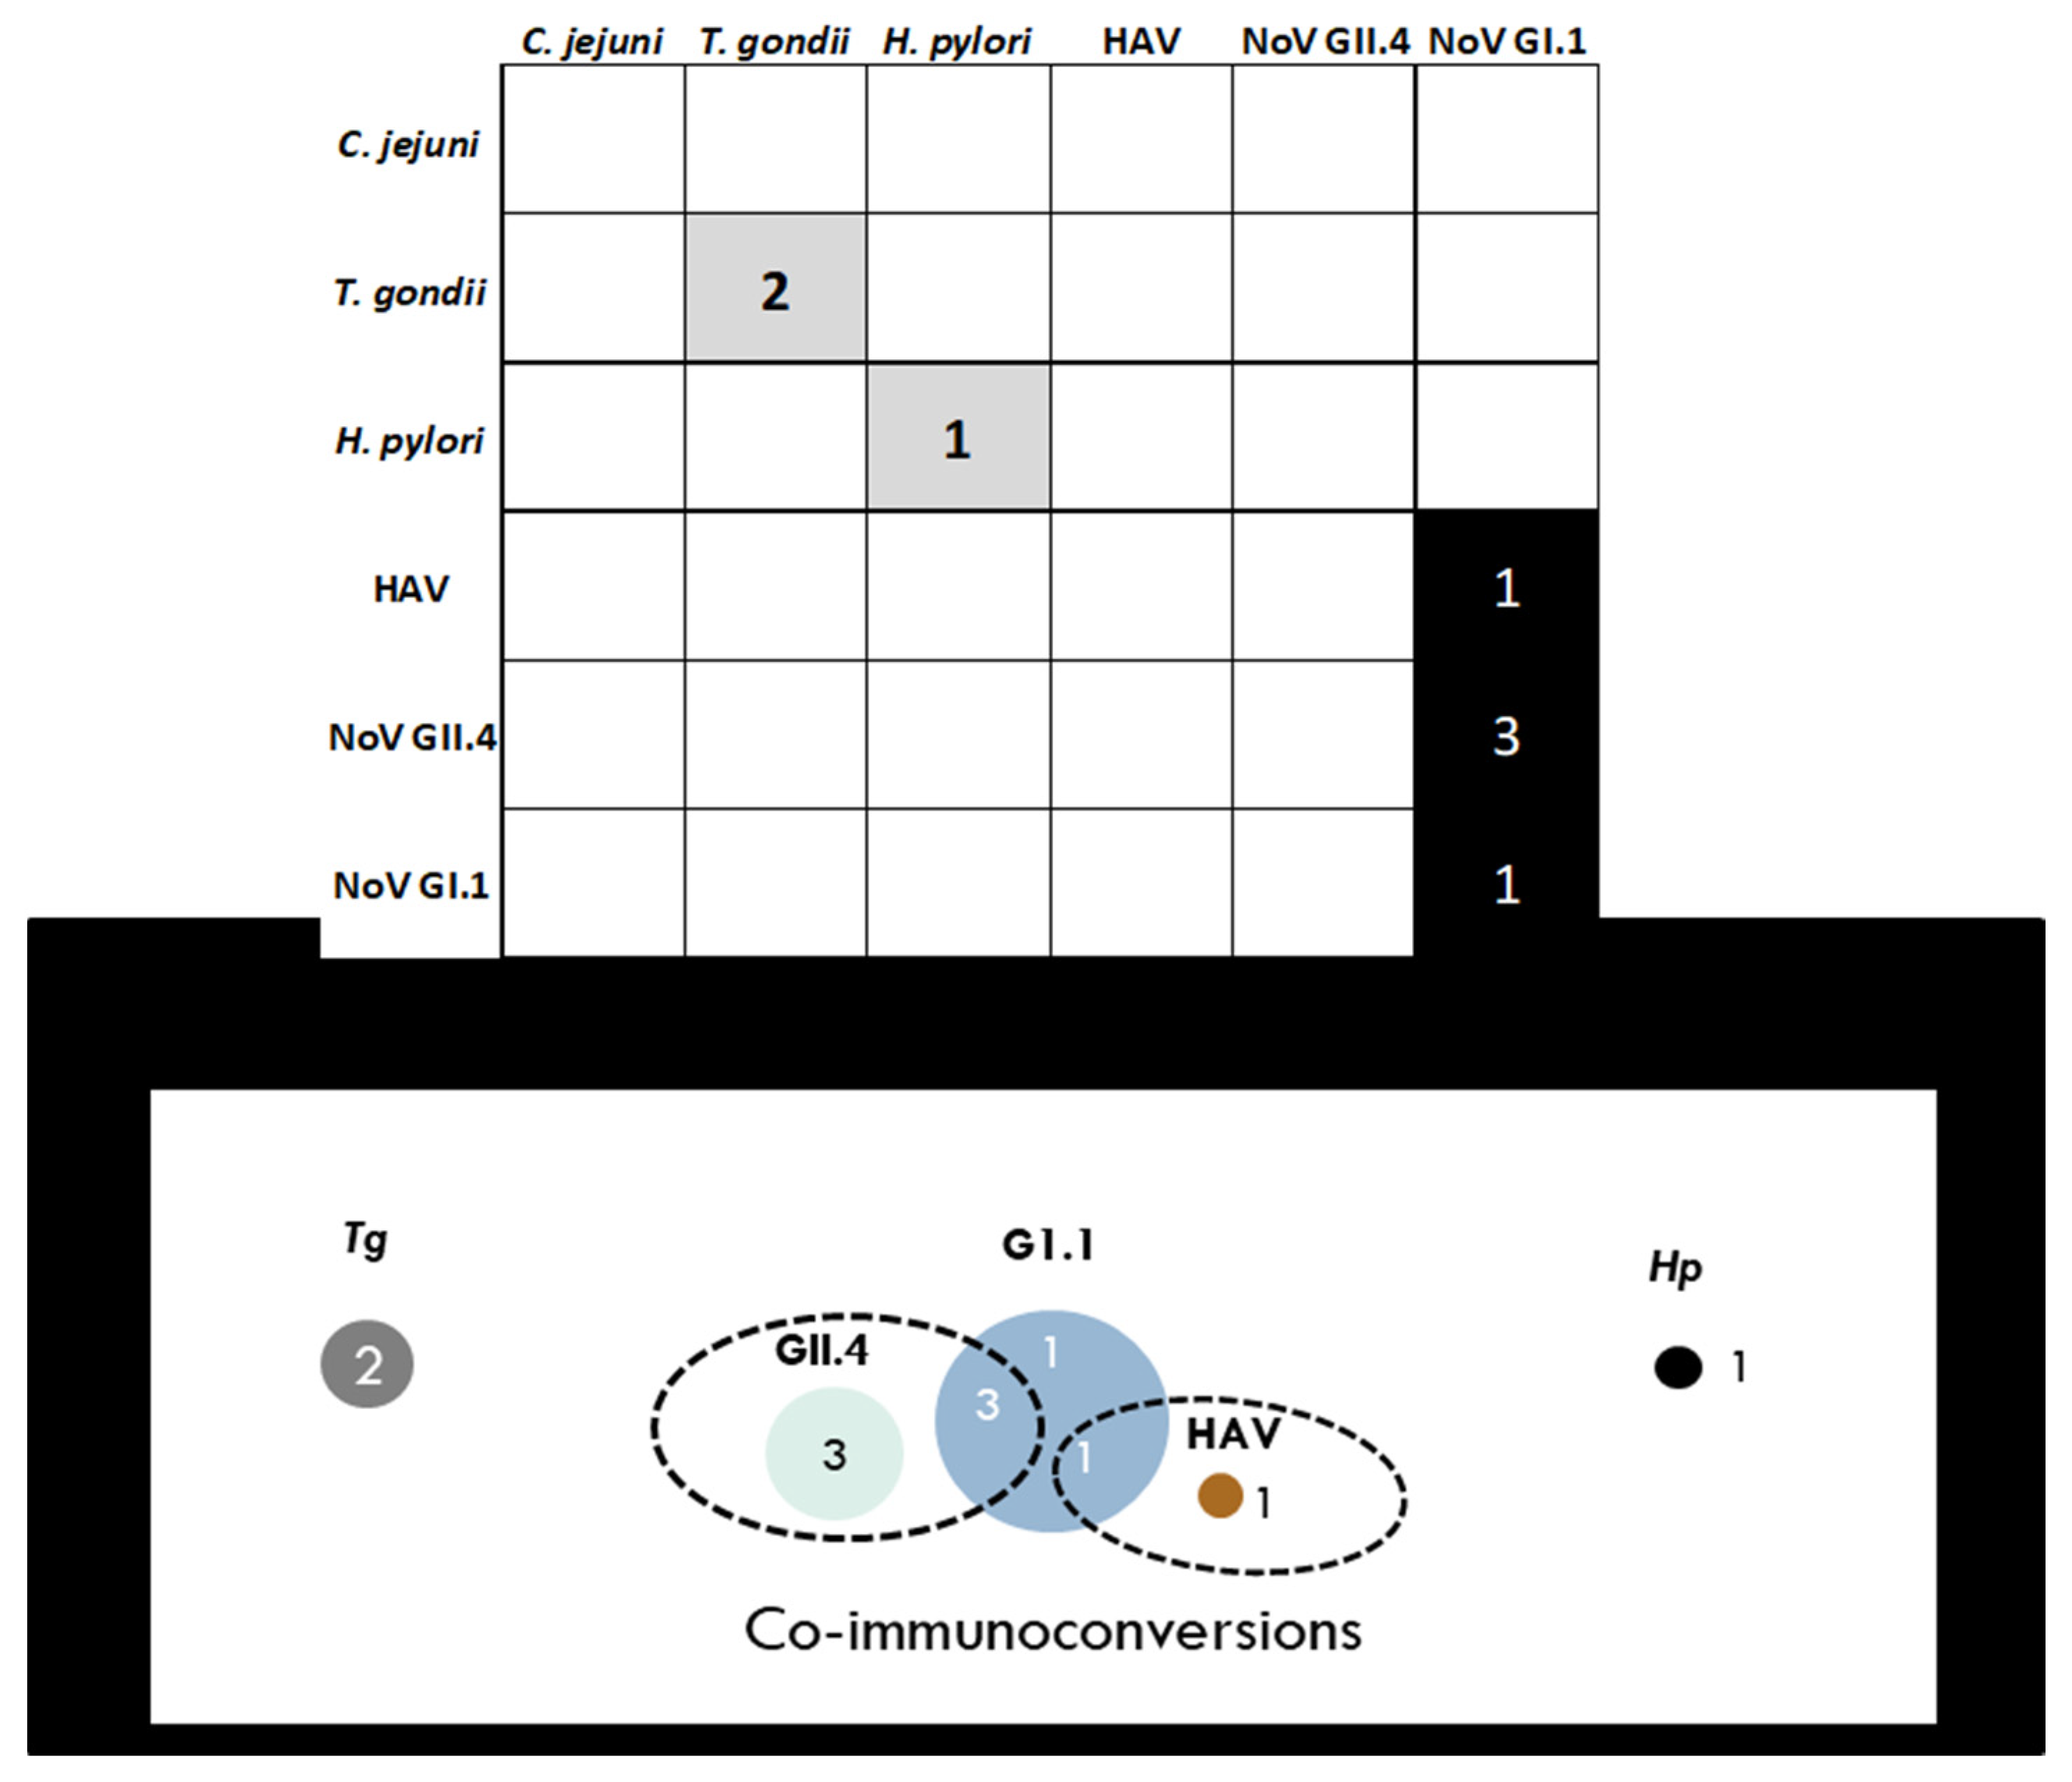
3. Results
4. Discussion
5. Conclusions
Supplementary Materials
Author Contributions
Funding
Institutional Review Board Statement
Informed Consent Statement
Data Availability Statement
Acknowledgments
Conflicts of Interest
Disclaimer
References
- Ford, T.E.; Hamner, S. A Perspective on the Global Pandemic of Waterborne Disease. Microb. Ecol. 2018, 76, 2–8. [Google Scholar] [CrossRef]
- Wade, T.J.; Krueger, W.; Sams, E.; Converse, R.; Hudgens, E.; Dufour, A. Health Risks Associated with Swimming at an Inland River. In Proceedings of the Society for Epidemiologic Research Conference, Denver, CO, USA, 16–19 June 2015. [Google Scholar]
- Exum, N.G.; Pisanic, N.; Granger, D.A.; Schwab, K.J.; Detrick, B.; Kosek, M.; Egorov, A.I.; Griffin, S.M.; Heaney, C.D. Use of Pathogen-Specific Antibody Biomarkers to Estimate Waterborne Infections in Population-Based Settings. Curr. Environ. Health Rep. 2016, 3, 322–334. [Google Scholar] [CrossRef] [Green Version]
- Gentile, G.; Micozzi, A. Speculations on the Clinical Significance of Asymptomatic Viral Infections. Clin. Microbiol. Infect. 2016, 22, 585–588. [Google Scholar] [CrossRef] [Green Version]
- Oran, D.P.; Topol, E.J. Prevalence of Asymptomatic Sars-Cov-2 Infection: A Narrative Review. Ann. Intern. Med. 2020, 173, 362–367. [Google Scholar] [CrossRef] [PubMed]
- Augustine, S.A.J.; Eason, T.N.; Simmons, K.J.; Curioso, C.L.; Griffin, S.M.; Ramudit, M.K.D.; Plunkett, T.R. Developing a Salivary Antibody Multiplex Immunoassay to Measure Human Exposure to Environmental Pathogens. J. Vis. Exp. 2016, 115, e54415. [Google Scholar] [CrossRef]
- Brandtzaeg, P. Do Salivary Antibodies Reliably Reflect Both Mucosal and Systemic Immunity? Ann. N. Y. Acad. Sci. 2007, 1098, 288–311. [Google Scholar] [CrossRef]
- Griffin, S.M.; Chen, I.M.; Fout, G.S.; Wade, T.J.; Egorov, A.I. Development of a Multiplex Microsphere Immunoassay for the Quantitation of Salivary Antibody Responses to Selected Waterborne Pathogens. J. Immunol. Methods 2011, 364, 83–93. [Google Scholar] [CrossRef]
- Heaney, J.L.J.; Whittaker, A.; Carroll, D.; Drayson, M.T. The Utility of Saliva for the Assessment of Anti-Pneumococcal Antibodies: Investigation of Saliva as a Marker of Antibody Status in Serum. Biomarkers 2018, 23, 115–122. [Google Scholar] [CrossRef]
- Huestis, M.A.; Verstraete, A.; Kwong, T.C.; Morland, J.; Vincent, M.J.; De La Torre, R. Oral Fluid Testing: Promises and Pitfalls. Clin. Chem. 2011, 57, 805–810. [Google Scholar] [CrossRef]
- Rodenburg, G.D.; Sanders, E.A.M.; Van Gils, E.J.M.; Veenhoven, R.H.; Zborowski, T.; Dobbelsteen, G.P.J.M.V.D.; Bloem, A.C.; Berbers, G.A.M.; Bogaert, D. Salivary Immune Responses to the 7-Valent Pneumococcal Conjugate Vaccine in the First 2 Years of Life. PLoS ONE 2012, 7, e46916. [Google Scholar] [CrossRef]
- Pisanic, N.; Ballard, S.-B.; Colquechagua, F.D.; François, R.; Exum, N.; Yori, P.P.; Schwab, K.J.; Granger, D.A.; Detrick, B.; Olortegui, M.P.; et al. Minimally Invasive Saliva Testing to Monitor Norovirus Infection in Community Settings. J. Infect. Dis. 2018, 219, 1234–1242. [Google Scholar] [CrossRef] [Green Version]
- Augustine, S.A.J.; Simmons, K.J.; Eason, T.N.; Curioso, C.L.; Griffin, S.M.; Wade, T.J.; Dufour, A.; Fout, G.S.; Grimm, A.C.; Oshima, K.H.; et al. Immunoprevalence to Six Waterborne Pathogens in Beachgoers at Boqueron Beach, Puerto Rico: Application of a Microsphere-Based Salivary Antibody Multiplex Immunoassay. Front. Public Health 2017, 5, 84. [Google Scholar] [CrossRef]
- Griffin, S.M.; Converse, R.R.; Leon, J.S.; Wade, T.J.; Jiang, X.; Moe, C.L.; Egorov, A.I. Application of Salivary Antibody Immunoassays for the Detection of Incident Infections with Norwalk Virus in a Group of Volunteers. J. Immunol. Methods 2015, 424, 53–63. [Google Scholar] [CrossRef] [Green Version]
- Simmons, K.J.; Eason, T.N.; Curioso, C.L.; Griffin, S.M.; Ramudit, M.K.D.; Oshima, K.H.; Sams, E.A.; Wade, T.J.; Grimm, A.; Dufour, A.; et al. Visitors to a Tropical Marine Beach Show Evidence of Immunoconversions to Multiple Waterborne Pathogens. Front. Public Health 2019, 7, 231. [Google Scholar] [CrossRef] [Green Version]
- Wade, T.J.; Augustine, S.A.J.; Griffin, S.M.; Sams, E.A.; Oshima, K.H.; Egorov, A.I.; Simmons, K.J.; Eason, T.N.; Dufour, A.P. Asymptomatic Norovirus Infection Associated with Swimming at a Tropical Beach: A Prospective Cohort Study. PLoS ONE 2018, 13, e0195056. [Google Scholar] [CrossRef] [Green Version]
- Wade, T.J.; Griffin, S.M.; Egorov, A.I.; Sams, E.; Hudgens, E.; Augustine, S.; DeFlorio-Barker, S.; Plunkett, T.; Dufour, A.P.; Styles, J.N.; et al. Application of a Multiplex Salivary Immunoassay to Detect Sporadic Incident Norovirus Infections. Sci. Rep. 2019, 9, 1–7. [Google Scholar] [CrossRef]
- Augustine, S.A.J.; Eason, T.N.; Simmons, K.J.; Griffin, S.M.; Curioso, C.L.; Ramudit, M.K.D.; Sams, E.A.; Oshima, K.H.; Dufour, A.; Wade, T.J. Rapid Salivary Igg Antibody Screening for Hepatitis A. J. Clin. Microbiol. 2020, 58. [Google Scholar] [CrossRef]
- Anonymous. The Power of Multiplexing. Thermofisher. Available online: https://www.thermofisher.com/content/dam/LifeTech/global/technical-reference-library/s2s/dbourdon/The%20power%20of%20multiplexing.pdf (accessed on 26 August 2020).
- Augustine, S.A.; Simmons, K.J.; Eason, T.N.; Griffin, S.M.; Curioso, C.L.; Wymer, L.J.; Fout, G.S.; Grimm, A.C.; Oshima, K.H.; Dufour, A. Statistical Approaches to Developing a Multiplex Immunoassay for Determining Human Exposure to Environmental Pathogens. J. Immunol. Methods 2015, 425, 1–9. [Google Scholar] [CrossRef] [Green Version]
- Cretich, M.; Daaboul, G.G.; Sola, L.; Ünlü, M.S.; Chiari, M. Digital detection of biomarkers assisted by nanoparticles: Application to diagnostics. Trends Biotechnol. 2015, 33, 343–351. [Google Scholar] [CrossRef]
- Ajami, N.J.; Kavanagh, O.V.; Ramani, S.; Crawford, S.E.; Atmar, R.L.; Jiang, Z.; Okhuysen, P.C.; Estes, M.K.; Dupont, H.L. Seroepidemiology of norovirus-associated travelers’ diarrhea. J. Travel Med. 2014, 21, 6–11. [Google Scholar] [CrossRef] [Green Version]
- Moe, C.L.; Sair, A.; Lindesmith, L.; Estes, M.K.; Jaykus, L.-A. Diagnosis of Norwalk Virus Infection by Indirect Enzyme Immunoassay Detection of Salivary Antibodies to Recombinant Norwalk Virus Antigen. Clin. Diagn. Lab. Immunol. 2004, 11, 1028–1034. [Google Scholar] [CrossRef] [Green Version]
- Monroe, S.; Stine, S.E.; Jiang, X.; Estes, M.K.; Glass, R.I. Detection of antibody to recombinant Norwalk virus antigen in specimens from outbreaks of gastroenteritis. J. Clin. Microbiol. 1993, 31, 2866–2872. [Google Scholar] [CrossRef] [Green Version]
- Jones, J.L.; Kruszon-Moran, D.; Wilson, M.; McQuillan, G.; Navin, T.; McAuley, J.B. Toxoplasma gondii Infection in the United States: Seroprevalence and Risk Factors. Am. J. Epidemiol. 2001, 154, 357–365. [Google Scholar] [CrossRef] [PubMed]
- Klevens, R.M.; Kruszon-Moran, D.; Wasley, A.; Gallagher, K.; McQuillan, G.M.; Kuhnert, W.; Teshale, E.H.; Drobeniuc, J.; Bell, B.P. Seroprevalence of Hepatitis A Virus Antibodies in the U.S.: Results from the National Health and Nutrition Examination Survey. Public Health Rep. 2011, 126, 522–532. [Google Scholar] [CrossRef]
- Krueger, W.S.; Hilborn, E.D.; Converse, R.R.; Wade, T.J. Drinking water source and human Toxoplasma gondii infection in the United States: A cross-sectional analysis of NHANES data. BMC Public Health 2014, 14, 711. [Google Scholar] [CrossRef] [PubMed] [Green Version]
- Nikakhlagh, S.; Samarbafzadeh, A.R.; Jahani, M.; Poostchi, H.; Kayedani, G.A.; Naghashpoor, M.; Saki, N. Determining the Role of Helicobacter pylori in Chronic Sinus Infections Using the Polymerase Chain Reaction. Jundishapur J. Microbiol. 2015, 8, 3. [Google Scholar] [CrossRef] [PubMed] [Green Version]
- Sivadon-Tardy, V.; Orlikowski, D.; Porcher, R.; Ronco, E.; Caudie, C.; Roussi, J.; Fauchère, J.-L.; Mégraud, F.; Tabor, H.; Sharshar, T.; et al. Detection of Campylobacter jejuni by Culture and Real-Time PCR in a French Cohort of Patients with Guillain-Barre Syndrome. J. Clin. Microbiol. 2010, 48, 2278–2281. [Google Scholar] [CrossRef] [PubMed] [Green Version]
- González-Pons, M.; Soto-Salgado, M.; Sevilla, J.; Márquez-Lespier, J.M.; Morgan, D.; Pérez, C.M.; Cruz-Correa, M. Seroprevalence of Helicobacter pylori Hispanics living in Puerto Rico: A population-based study. Helicobacter 2018, 23, e12453. [Google Scholar] [CrossRef] [PubMed] [Green Version]
- Hagan, A.K.; Zuchner, T. Lanthanide-based time-resolved luminescence immunoassays. Anal. Bioanal. Chem. 2011, 400, 2847–2864. [Google Scholar] [CrossRef] [Green Version]
- Weiskopf, D.; Weinberger, B.; Grubeck-Loebenstein, B. The aging of the immune system. Transpl. Int. 2009, 22, 1041–1050. [Google Scholar] [CrossRef]
- Pérez-Mazliah, D.; Ndungu, F.; Aye, R.; Langhorne, J. B-cell memory in malaria: Myths and realities. Immunol. Rev. 2019, 293, 57–69. [Google Scholar] [CrossRef]
- Hadler, S.C.; Erben, J.J.; Matthews, D.; Starko, K.; Francis, D.P.; Maynard, J.E. Effect of Immunoglobulin on Hepatitis A in Day-care Centers. JAMA 1983, 249, 48–53. [Google Scholar] [CrossRef] [PubMed]
- Wyse, C.; O’Malley, G.; Coogan, A.N.; McConkey, S.; Smith, D.J. Seasonal and daytime variation in multiple immune parameters in humans: Evidence from 329,261 participants of the UK Biobank cohort. Iscience 2021, 24, 102255. [Google Scholar] [CrossRef] [PubMed]
- Morris-Cunnington, M.C.; Edmunds, W.J.; Miller, E.; Brown, D.W.G. A population-based seroprevalence study of hepatitis A virus using oral fluid in England and Wales. Am. J. Epidemiol. 2004, 159, 786–794. [Google Scholar] [CrossRef] [Green Version]
- Morris-Cunnington, M.C.; Edmunds, W.J.; Miller, E.; Brown, D.W.G. A novel method of oral fluid collection to monitor immunity to common viral infections. Epidemiol. Infect. 2004, 132, 35–42. [Google Scholar] [CrossRef]
- Schramm, W.; Angulo, G.B.; Torres, P.C.; Burgess-Cassler, A. A Simple Saliva-Based Test for Detecting Antibodies to Human Immunodeficiency Virus. Clin. Diagn. Lab. Immunol. 1999, 6, 577–580. [Google Scholar] [CrossRef] [Green Version]
- Stuart, J.M.; Majeed, F.A.; Cartwright, K.A.; Room, R.; Parry, J.V.; Perry, K.R.; Begg, N.T. Salivary antibody testing in a school outbreak of hepatitis A. Epidemiol. Infect. 1992, 109, 161. [Google Scholar]
- Yap, G.; Sil, B.K.; Ng, L.-C. Use of Saliva for Early Dengue Diagnosis. PLoS Negl. Trop. Dis. 2011, 5, e1046. [Google Scholar] [CrossRef] [PubMed] [Green Version]


| Organism | Antigen (Ag) | Source | Amt. of Ag Coupled (µg) |
|---|---|---|---|
| Hepatitis A virus | Cell culture concentrate | Meridian | 100 |
| Norovirus GI.1 | P-particle | Xi Jiang * | 5 |
| Norovirus GII.4 | P-particle | Xi Jiang * | 5 |
| Campylobacter jejuni | Heat-killed whole bacterial cells | KPL | 50 |
| Helicobacter pylori | Bacterial cell lysate | Meridian | 25 |
| Toxoplasma gondii | Recombinant p30 (SAG1) | Meridian | 25 |
| Community | Population | Plant Capacity | Treatment | Chlorination |
|---|---|---|---|---|
| Moline, IL, N 1 | 43,483 * | 1,375,000 GPD | Secondary | Yes |
| Rock Island, IL | 39,018 | 16,000,000 GPD | Tertiary | Yes |
| Milan, IL | 5099 | 1,000,000 GPD | Secondary | Yes |
| Moline, IL, S 1 | 43,483 * | 1,800,000 GPD | Secondary | Yes |
| Colona, IL | 5099 | 1,000,000 GPD | Secondary | Yes |
| East Moline, IL | 21,302 | 11,100,000 GPD | Secondary | Yes |
| Davenport, IA | 127,142 | 20,000,000 GPD | Secondary | No |
| Buffalo, IA | 1260 | 130,000 GPD | Secondary | Yes |
| Immunoprevalence | n (%) | n | % |
|---|---|---|---|
| None | 102 (21.34) | 102 | 21.34% |
| Any (N ≥ 1) | 376 (78.66) | 376 | 78.66% |
| Single (N = 1) | 107 (22.38) | 107 | 22.38% |
| Multiple (N ≥ 2) | 269 (56.28) | 269 | 56.28% |
| To N pathogens | |||
| N | n (%) | n | % |
| 0 | 102 (21.34) | 102 | 21.34% |
| 1 | 107 (22.38) | 107 | 22.38% |
| 2 | 149 (31.17) | 149 | 31.17% |
| 3 | 82 (17.15) | 82 | 17.15% |
| 4 | 29 (6.07) | 29 | 6.07% |
| 5 | 7 (1.46) | 7 | 1.46% |
| 6 | 2 (0.42) | 2 | 0.42% |
| To specific pathogens | |||
| Pathogen | n (%) | n | % |
| C. jejuni | 9 (1.88) | 9 | 1.88% |
| T. gondii | 109 (22.80) | 109 | 22.80% |
| H. pylori | 71 (14.85) | 71 | 14.85% |
| Hep. A | 60 (12.55) | 60 | 12.55% |
| NoV GII.4 | 281 (58.79) | 281 | 58.79% |
| NoV GI.1 | 284 (59.41) | 284 | 59.41% |
| C. jejuni | T. gondii | H. pylori | HAV | NoV GII.4 | NoV GI.1 | |
|---|---|---|---|---|---|---|
| C. jejuni | 4 (0.84%) | 5 (1.05%) | 5 (1.05%) | 8 (1.67%) | 8 (1.67%) | |
| T. gondii | 29 (6.07%) | 23 (4.81%) | 65 (13.60%) | 79 (16.53%) | ||
| H. pylori | 11 (2.30%) | 50 (10.46%) | 61 (12.76%) | |||
| HAV | 52 (10.88%) | 53 (11.09%) | ||||
| NoV GII.4 | 216 (45.19%) | |||||
| NoV GI.1 |
| Immunoconversions | n (%) | n | % |
|---|---|---|---|
| None | 123 (93.89) | 123 | 93.89% |
| Any (N ≥ 1) | 8 (6.11) | 8 | 6.11% |
| Single (N= 1) | 4 (50) | 4 | 50% |
| Multiple (N ≥ 2) | 4 (50) | 4 | 50% |
| To N pathogens | |||
| N | n (%) | n | % |
| 0 | 123 (93.89) | 123 | 93.9% |
| 1 | 4 (3.05) | 4 | 3.05% |
| 2 | 4 (3.05) | 4 | 3.05% |
| 3 | 0 (0.00) | 0 | 0% |
| 4 | 0 (0.00) | 0 | 0% |
| 5 | 0 (0.00) | 0 | 0% |
| 6 | 0 (0.00) | 0 | 0% |
| To specific pathogens | |||
| Pathogen | n (%) | n | % |
| C. jejuni | 0 (0.00) | 0 | 0% |
| T. gondii | 2 (1.53) | 2 | 1.53% |
| H. pylori | 1 (0.76) | 1 | 0.76% |
| HAV | 1 (0.76) | 1 | 0.76% |
| NoV GII.4 | 3 (2.29) | 3 | 2.29% |
| NoV GI.1 | 5 (3.82) | 3 | 3.82% |
Publisher’s Note: MDPI stays neutral with regard to jurisdictional claims in published maps and institutional affiliations. |
© 2021 by the authors. Licensee MDPI, Basel, Switzerland. This article is an open access article distributed under the terms and conditions of the Creative Commons Attribution (CC BY) license (https://creativecommons.org/licenses/by/4.0/).
Share and Cite
Augustine, S.A.J.; Eason, T.N.; Wade, T.; Griffin, S.M.; Sams, E.; Simmons, K.; Ramudit, M.; Oshima, K.; Dufour, A. Salivary Antibodies against Multiple Environmental Pathogens Found in Individuals Recreating at an Iowa Beach. Int. J. Environ. Res. Public Health 2021, 18, 5797. https://doi.org/10.3390/ijerph18115797
Augustine SAJ, Eason TN, Wade T, Griffin SM, Sams E, Simmons K, Ramudit M, Oshima K, Dufour A. Salivary Antibodies against Multiple Environmental Pathogens Found in Individuals Recreating at an Iowa Beach. International Journal of Environmental Research and Public Health. 2021; 18(11):5797. https://doi.org/10.3390/ijerph18115797
Chicago/Turabian StyleAugustine, Swinburne A. J., Tarsha N. Eason, Tim Wade, Shannon M. Griffin, Elizabeth Sams, Kaneatra Simmons, Malini Ramudit, Kevin Oshima, and Alfred Dufour. 2021. "Salivary Antibodies against Multiple Environmental Pathogens Found in Individuals Recreating at an Iowa Beach" International Journal of Environmental Research and Public Health 18, no. 11: 5797. https://doi.org/10.3390/ijerph18115797