
How Well Does a Sequential Minimal Optimization Model Perform in Predicting Medicine Prices for Procurement System?


Abstract
:1. Introduction
2. Literature Review
2.1. Pharmaceutical Procurement
2.2. John Platt’s Sequential Minimal Optimization (SMO)
3. Data, Variables, and Methodology
3.1. Data and Variables
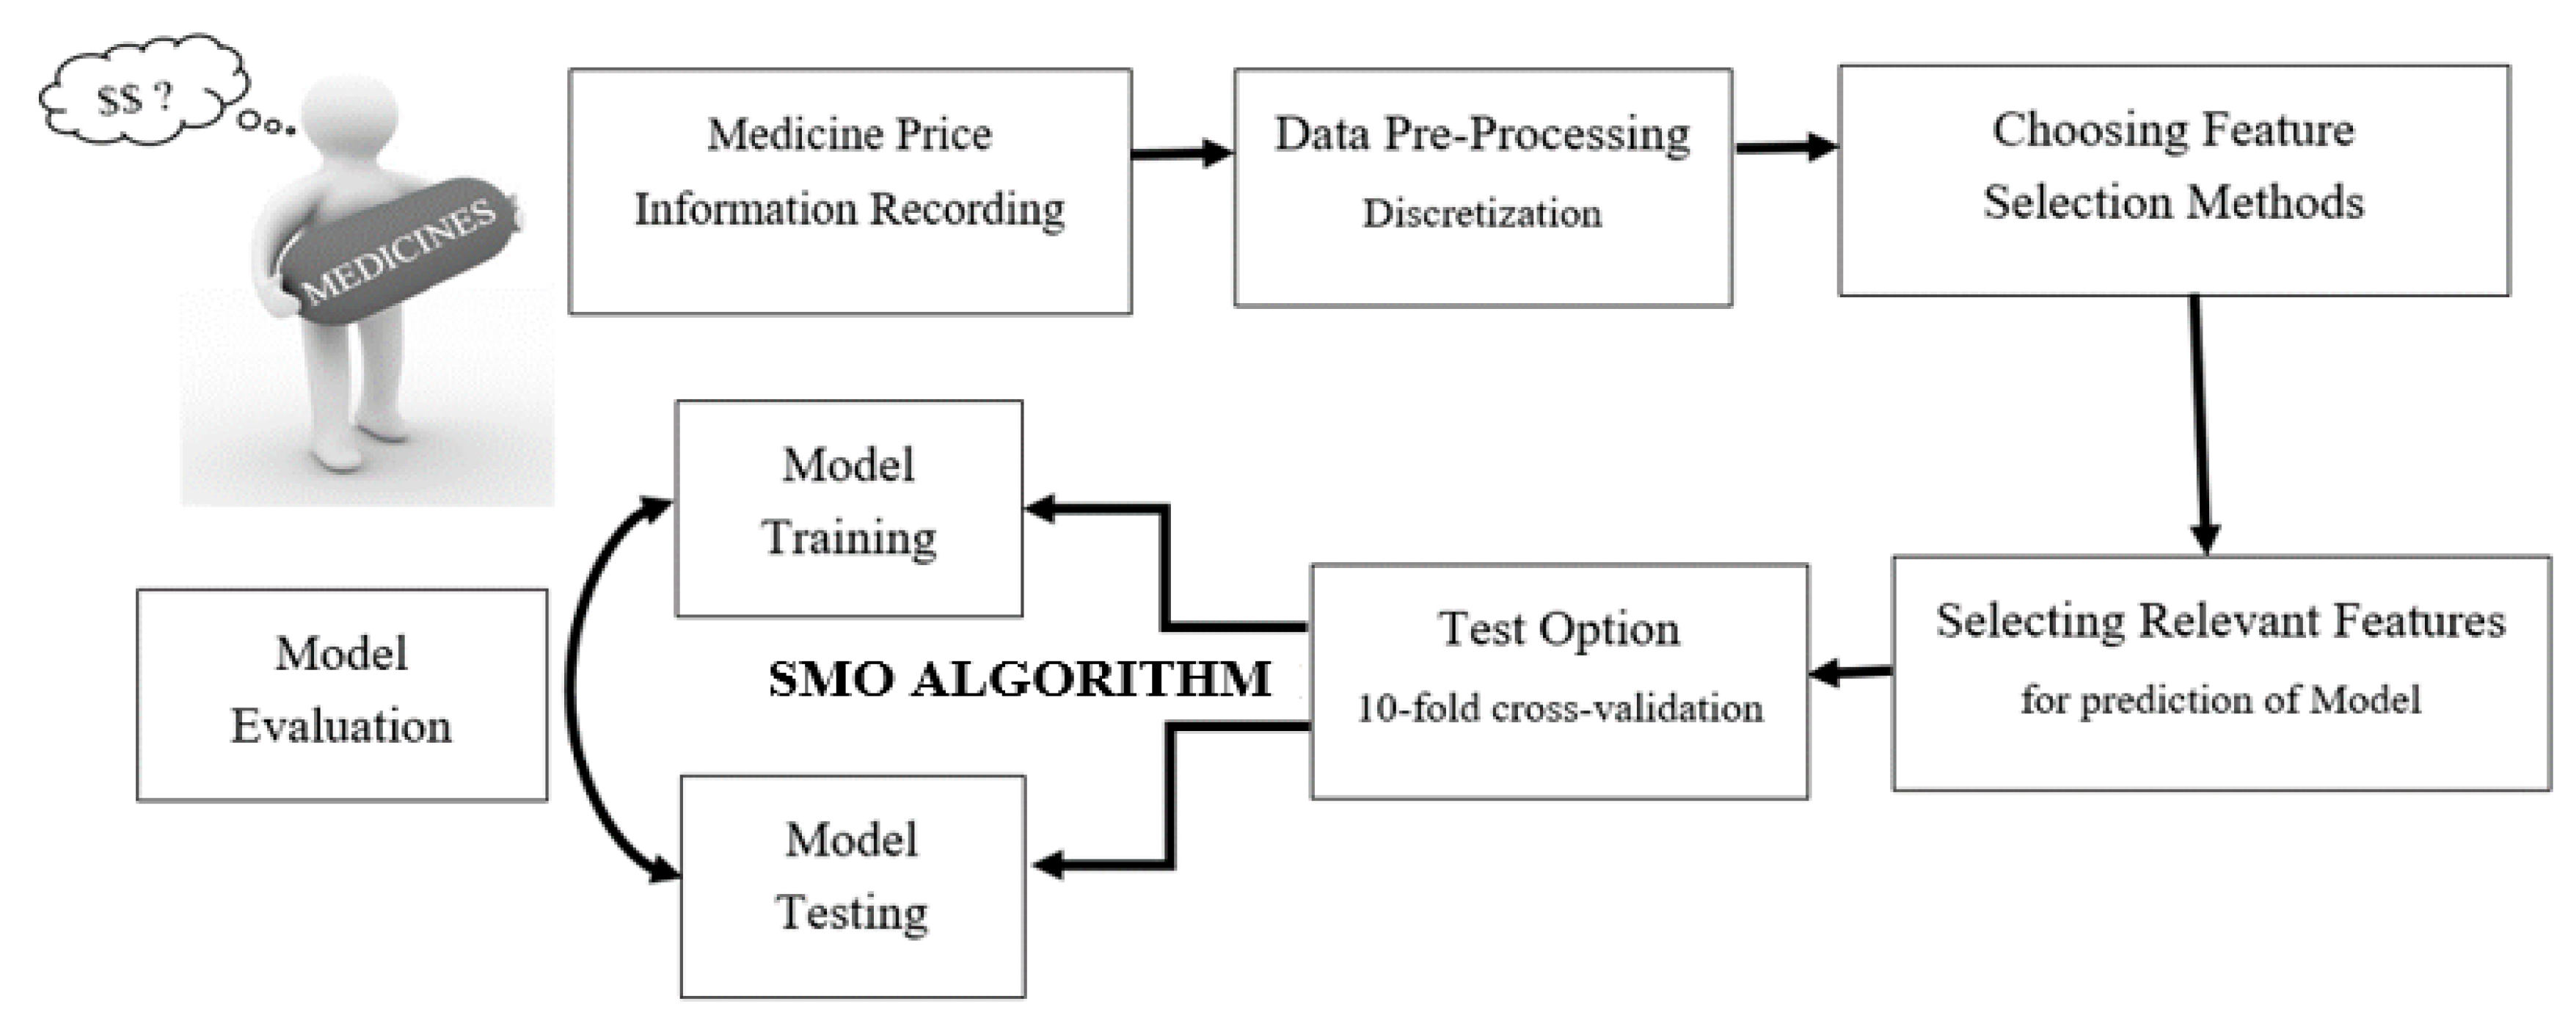
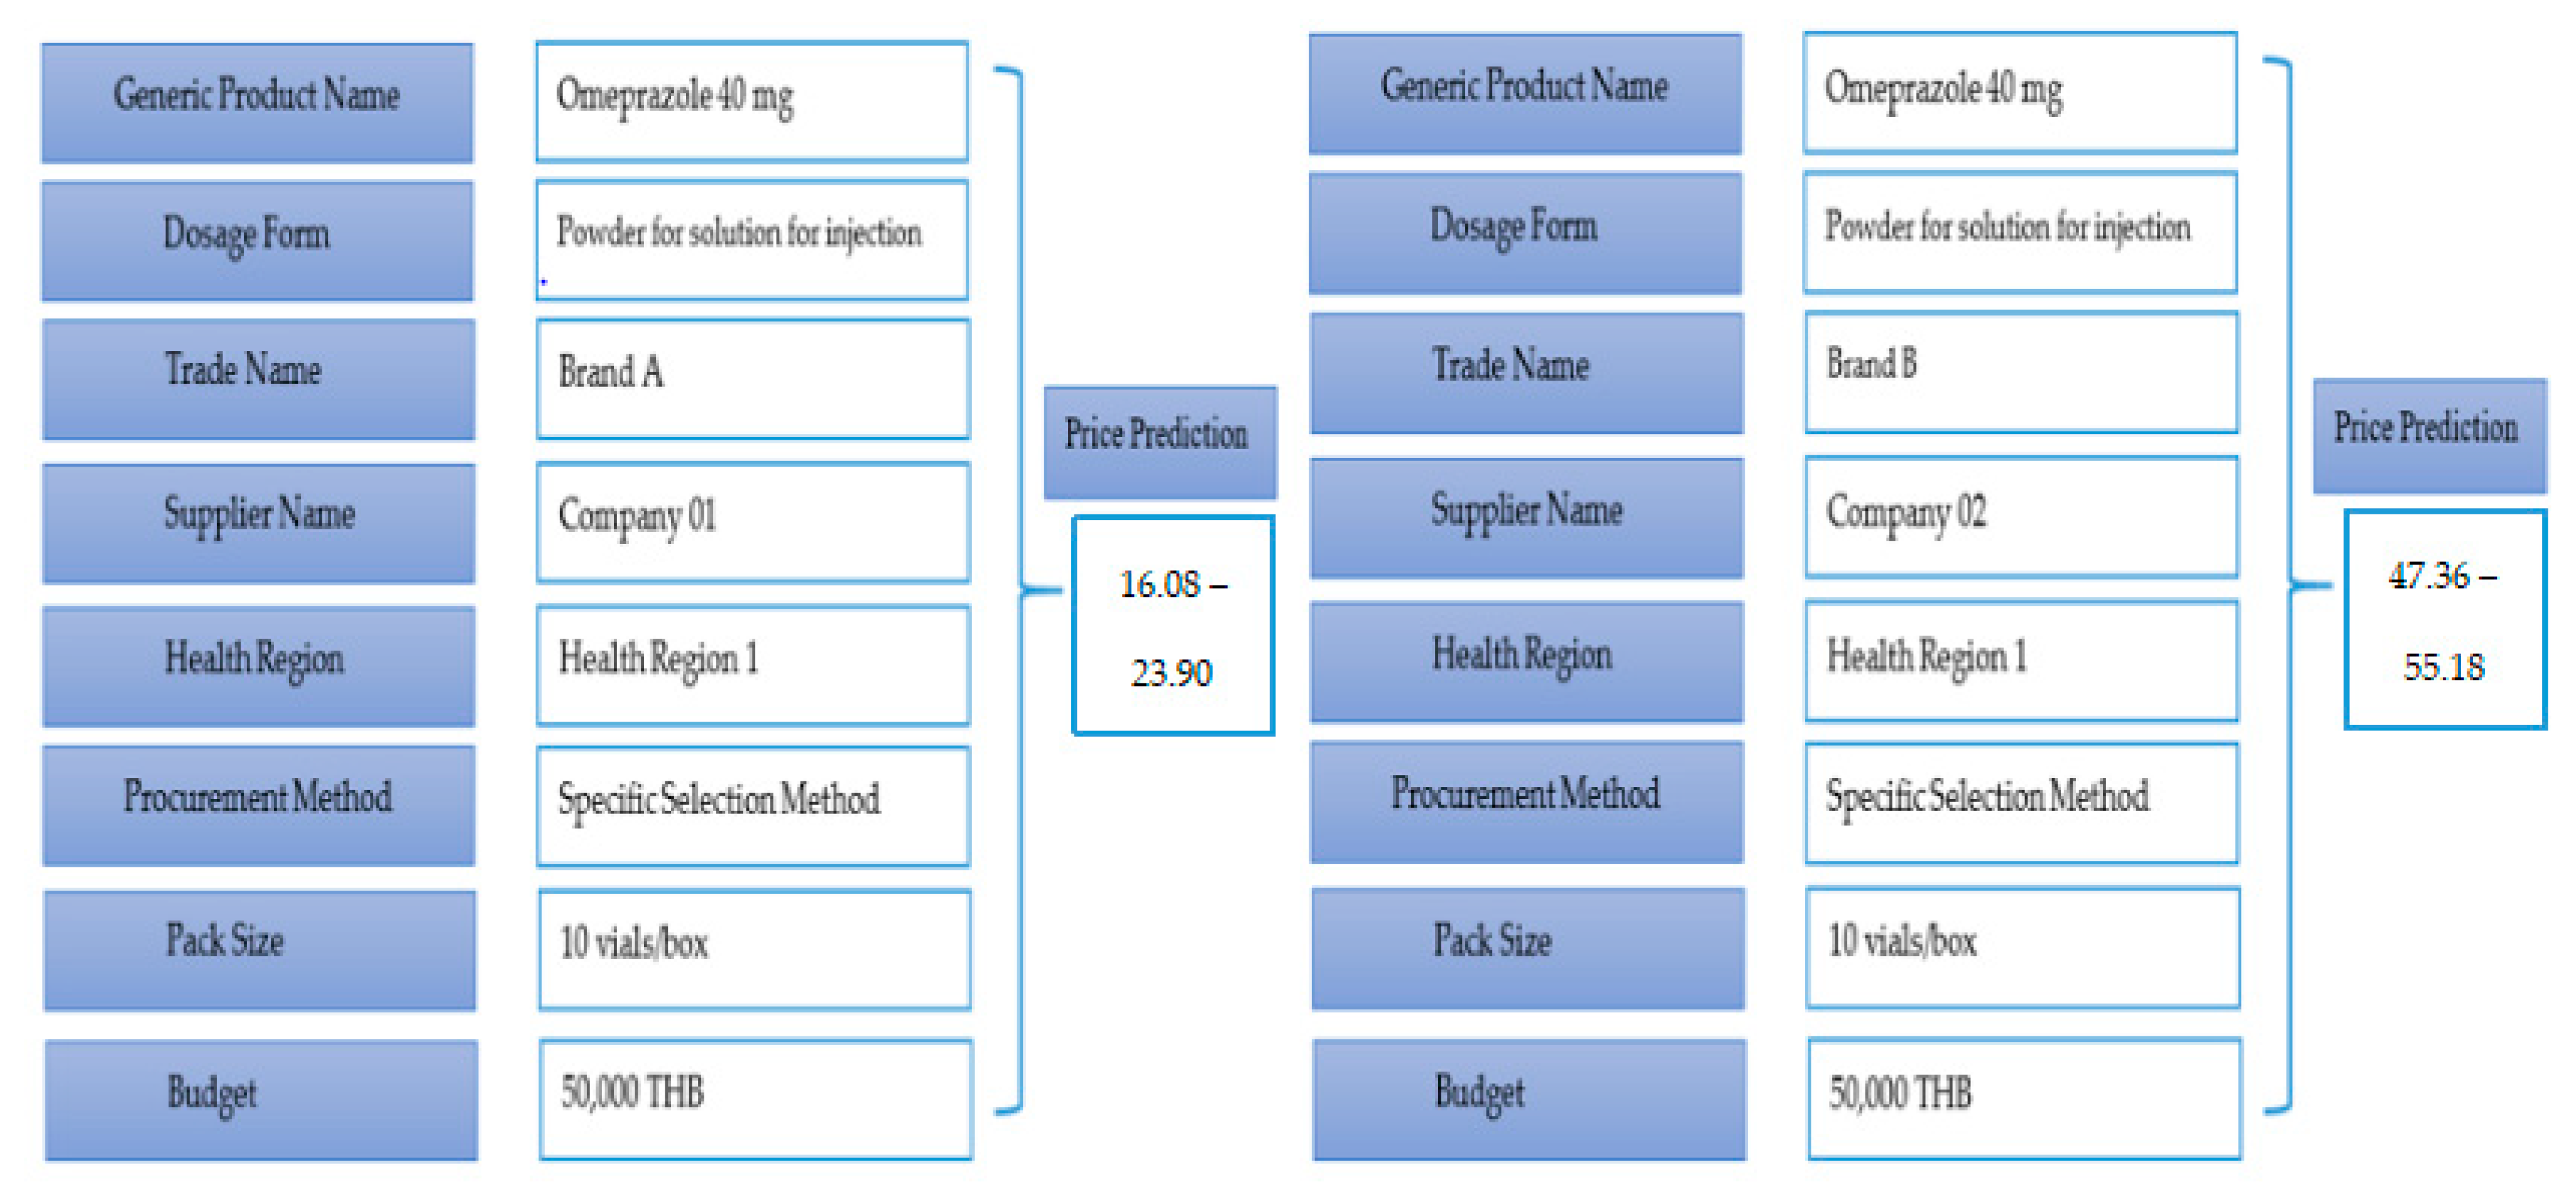
3.2. Conceptual Framework
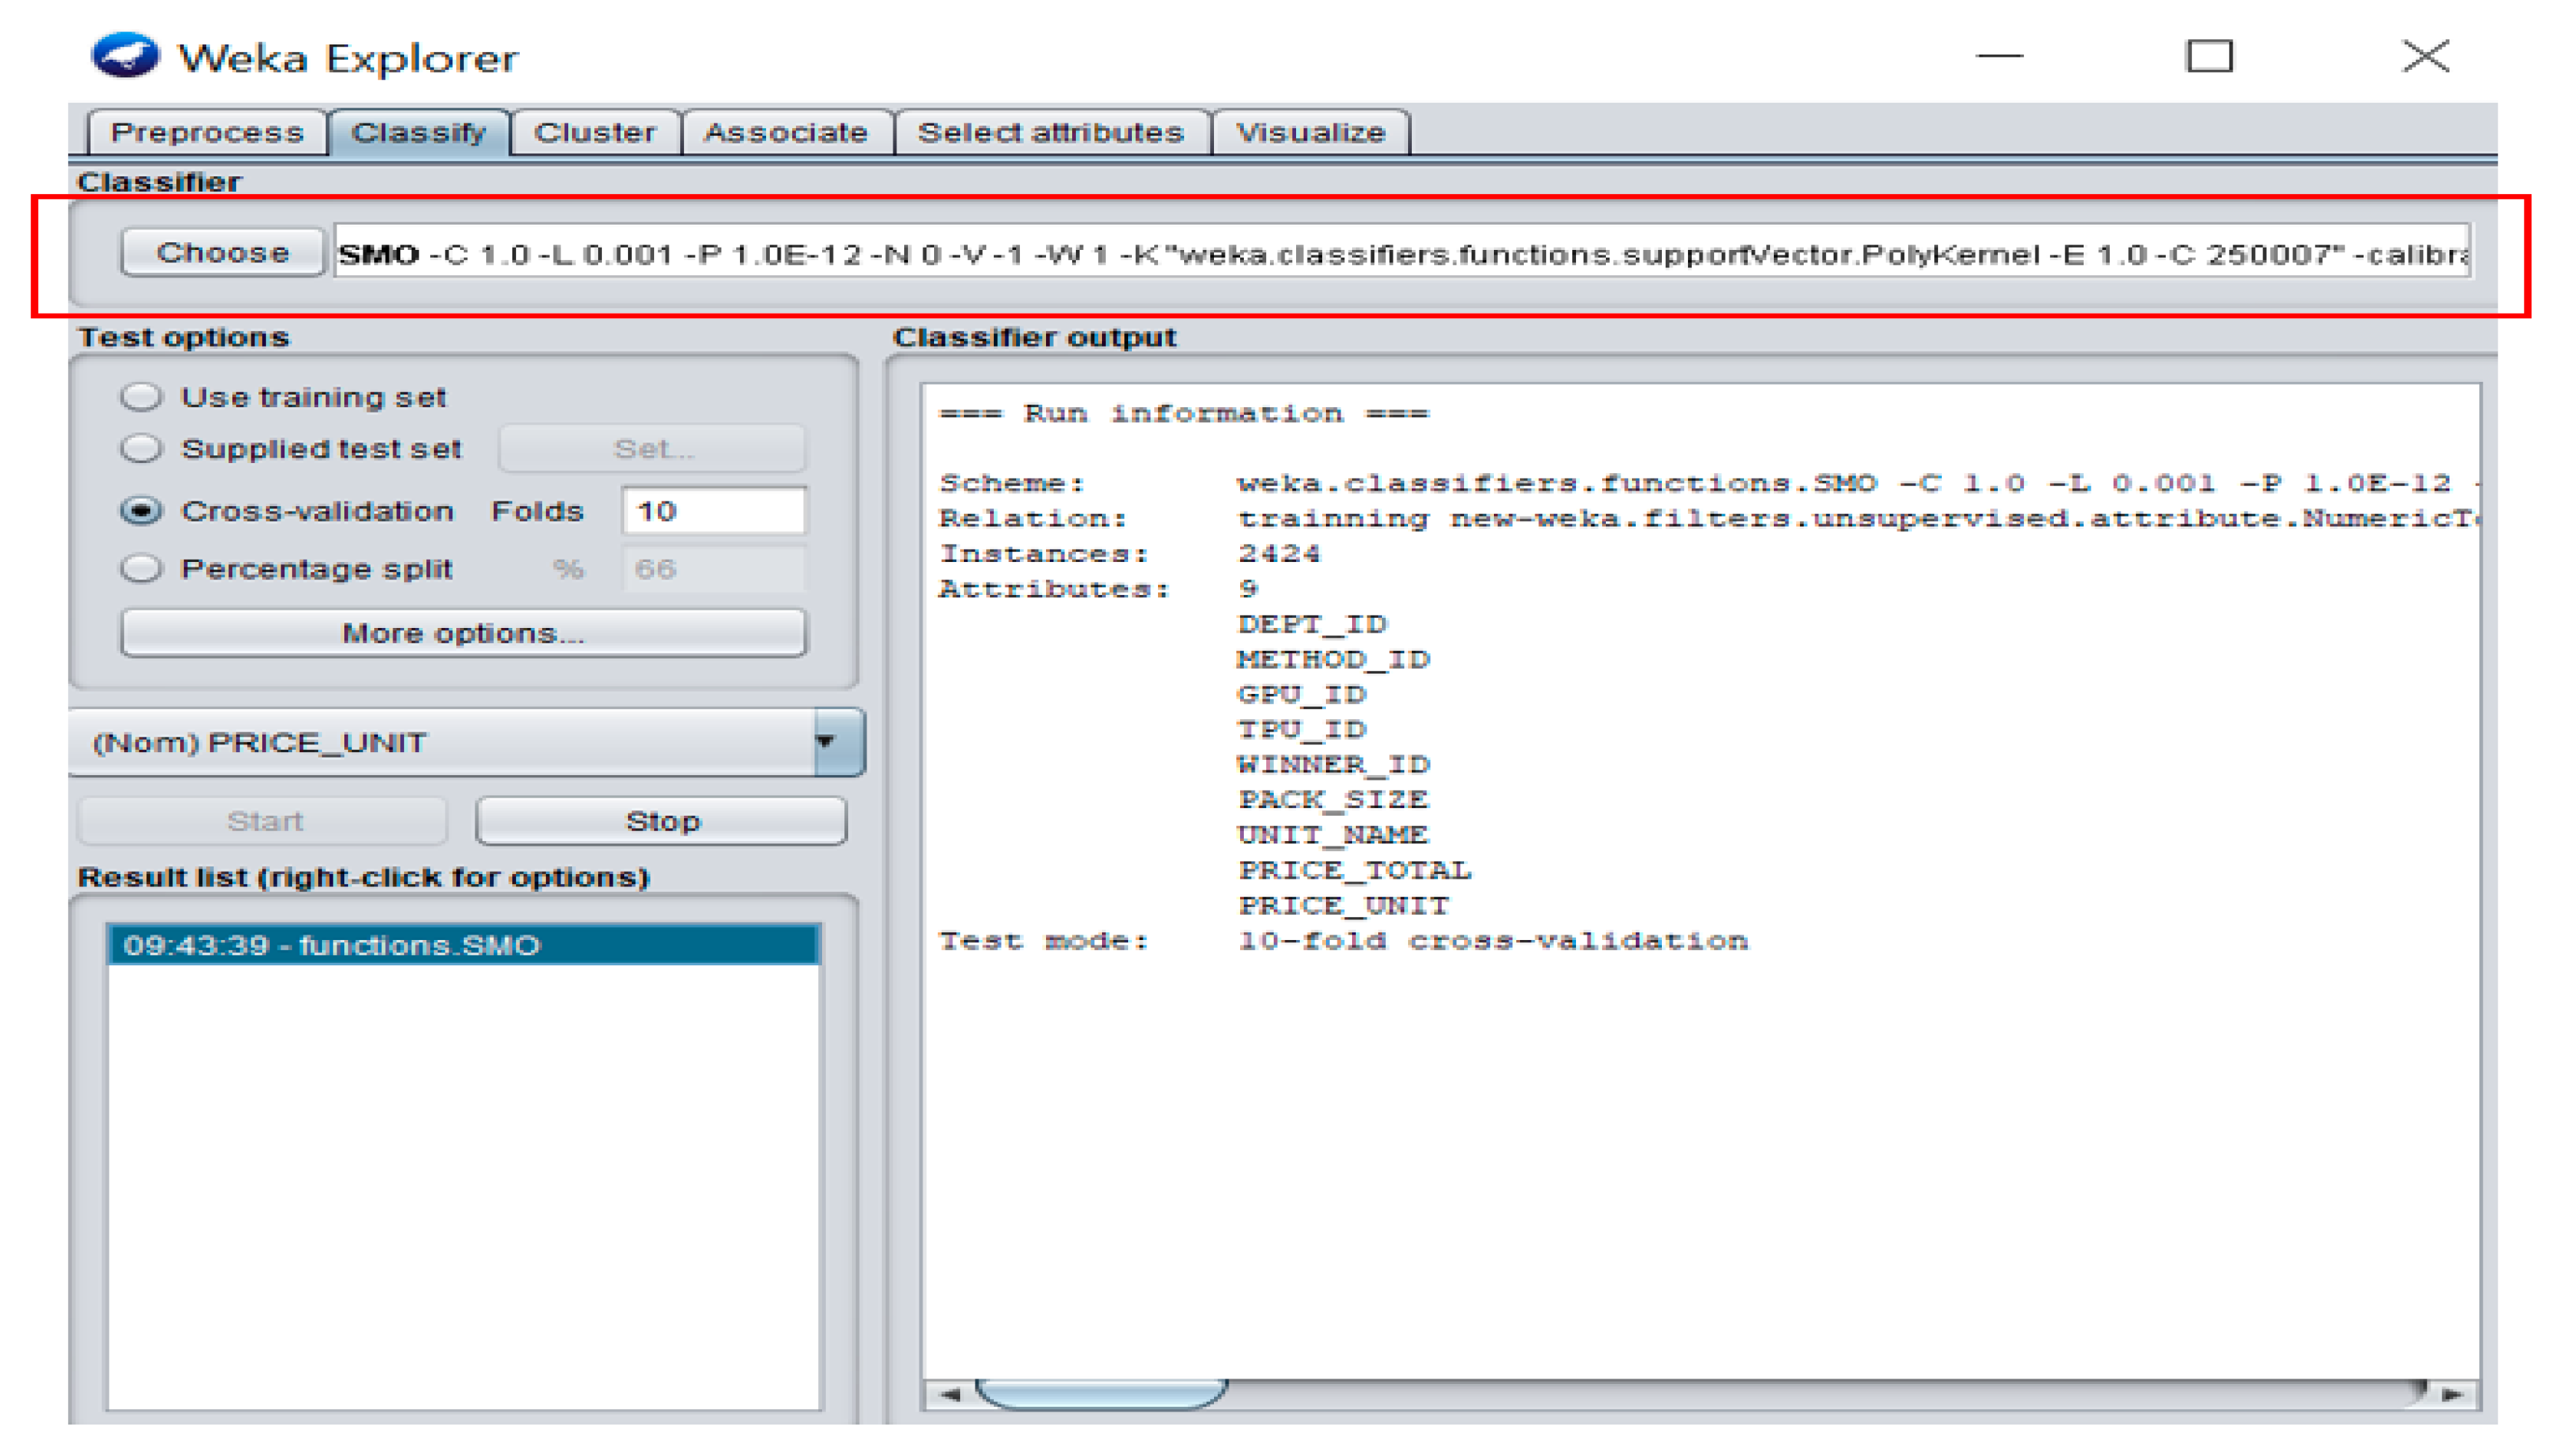
3.3. Classifier
3.4. Feature Selection
3.5. Test Options
3.6. Model Evaluation Metrics
4. Empirical Analysis
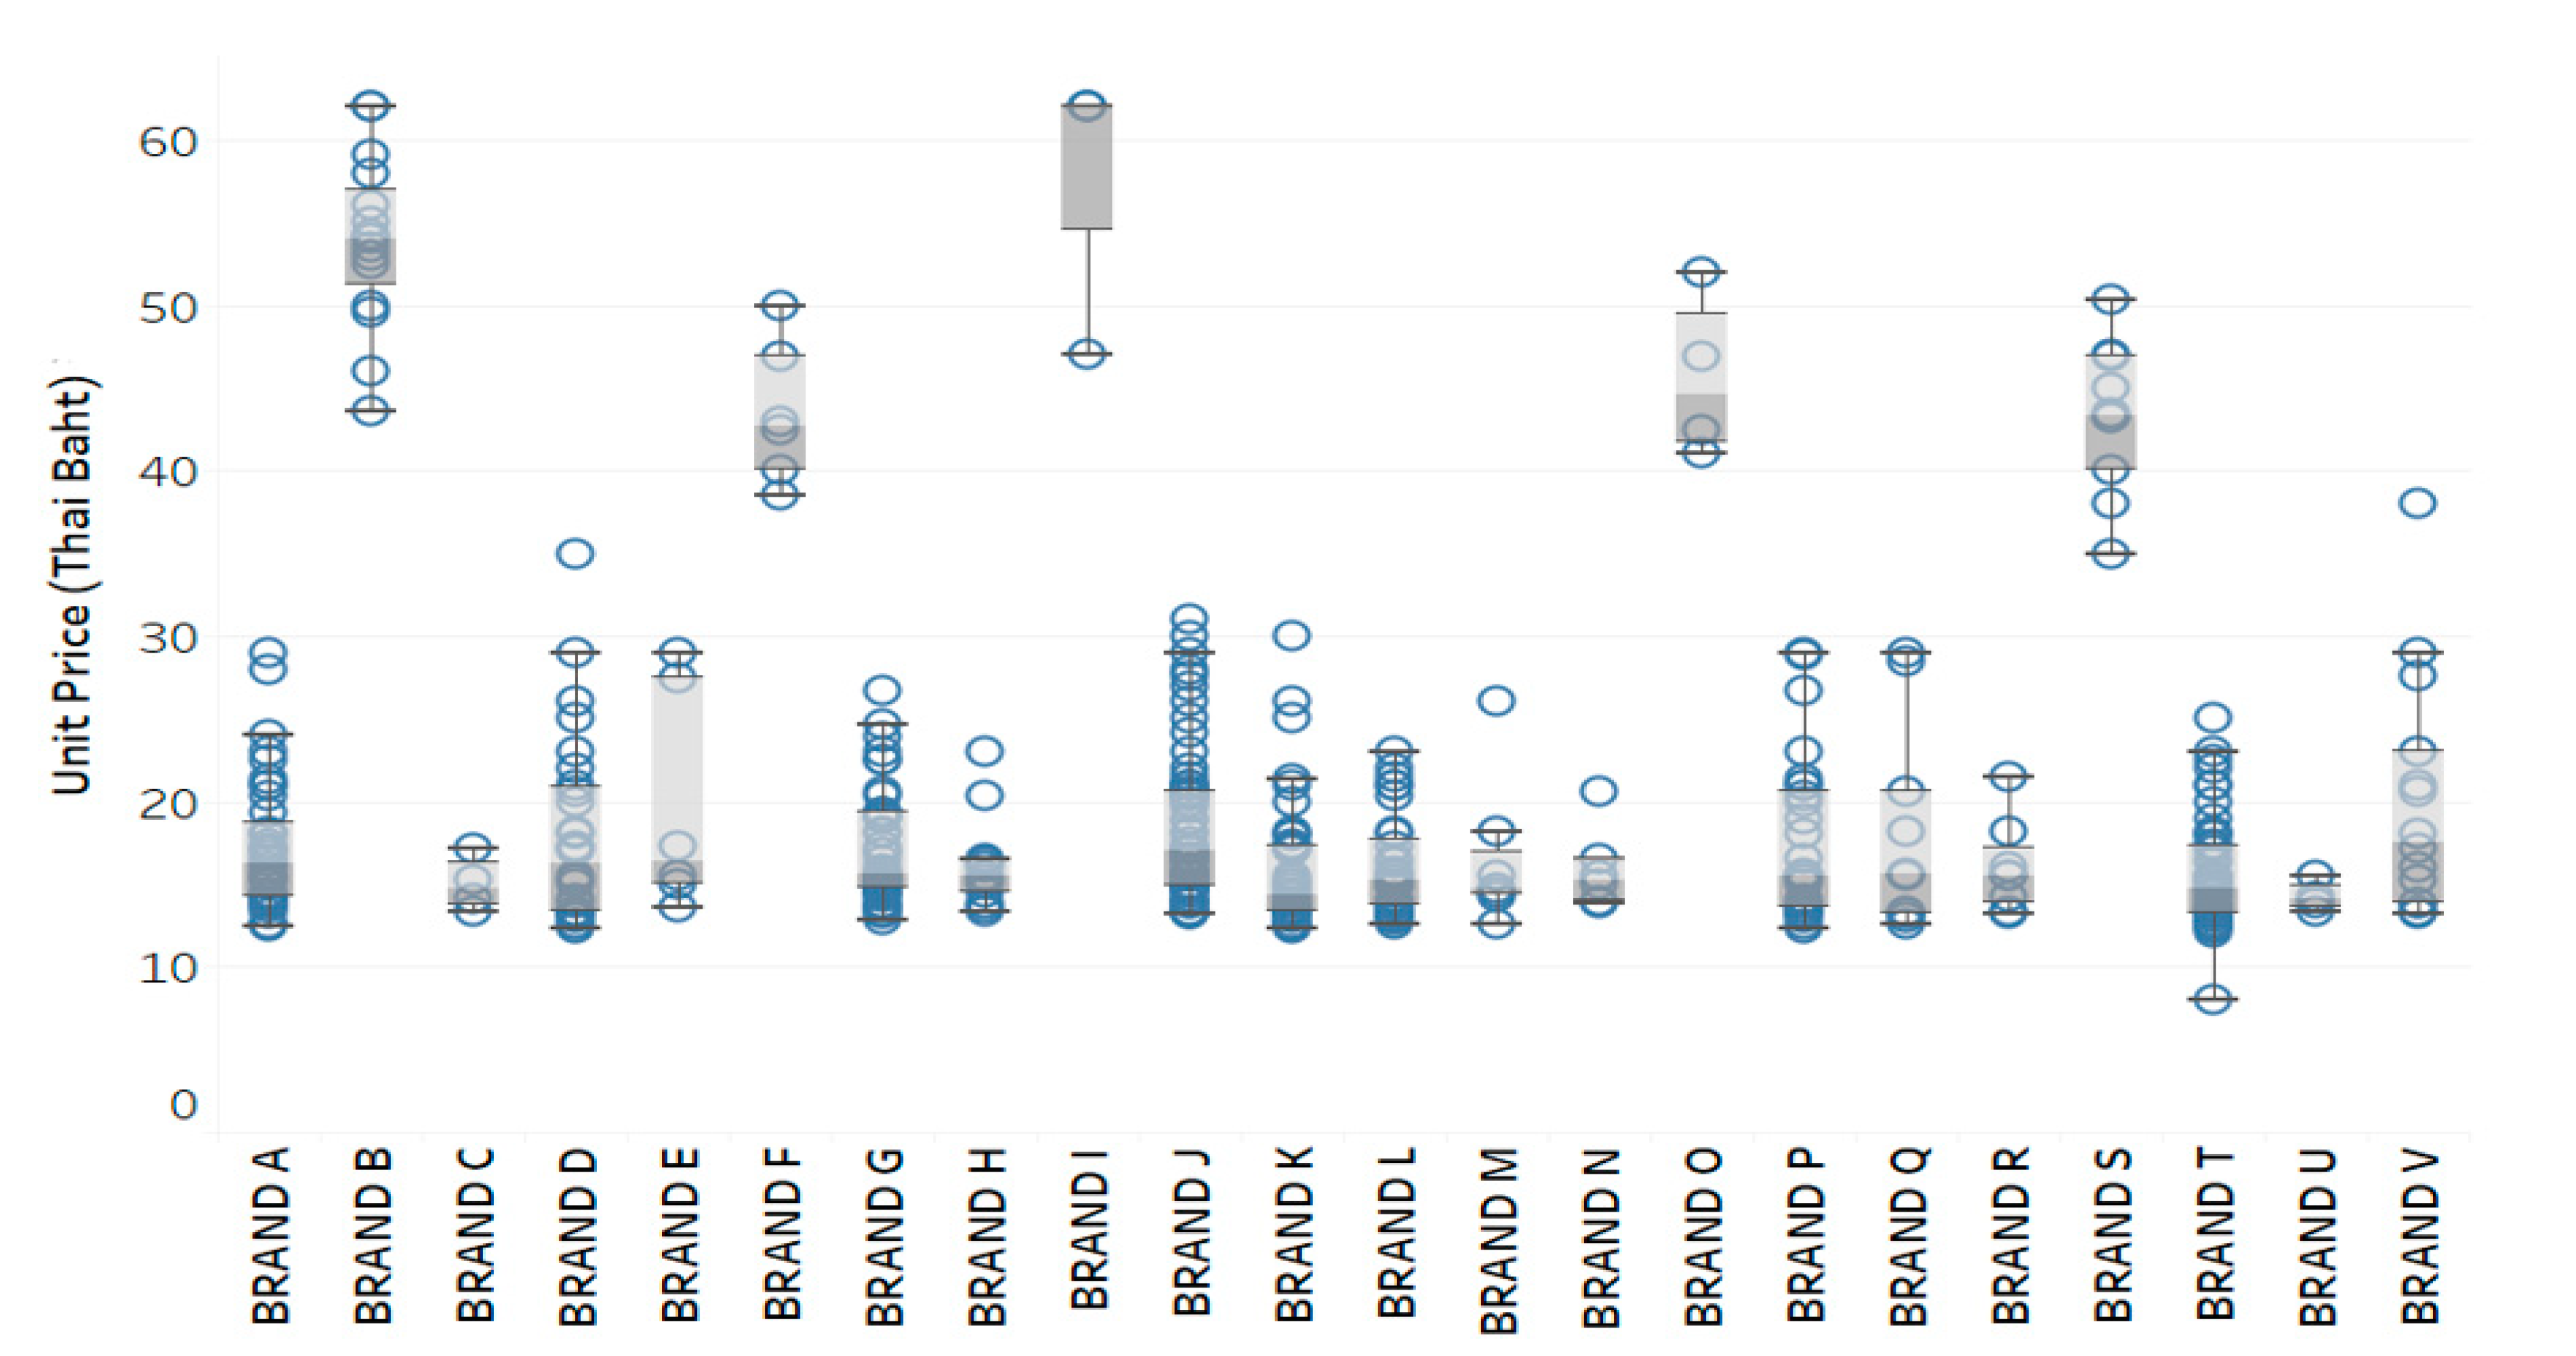
4.1. Descriptive Statistics
4.2. Feature Analysis
4.3. Performance Evaluation
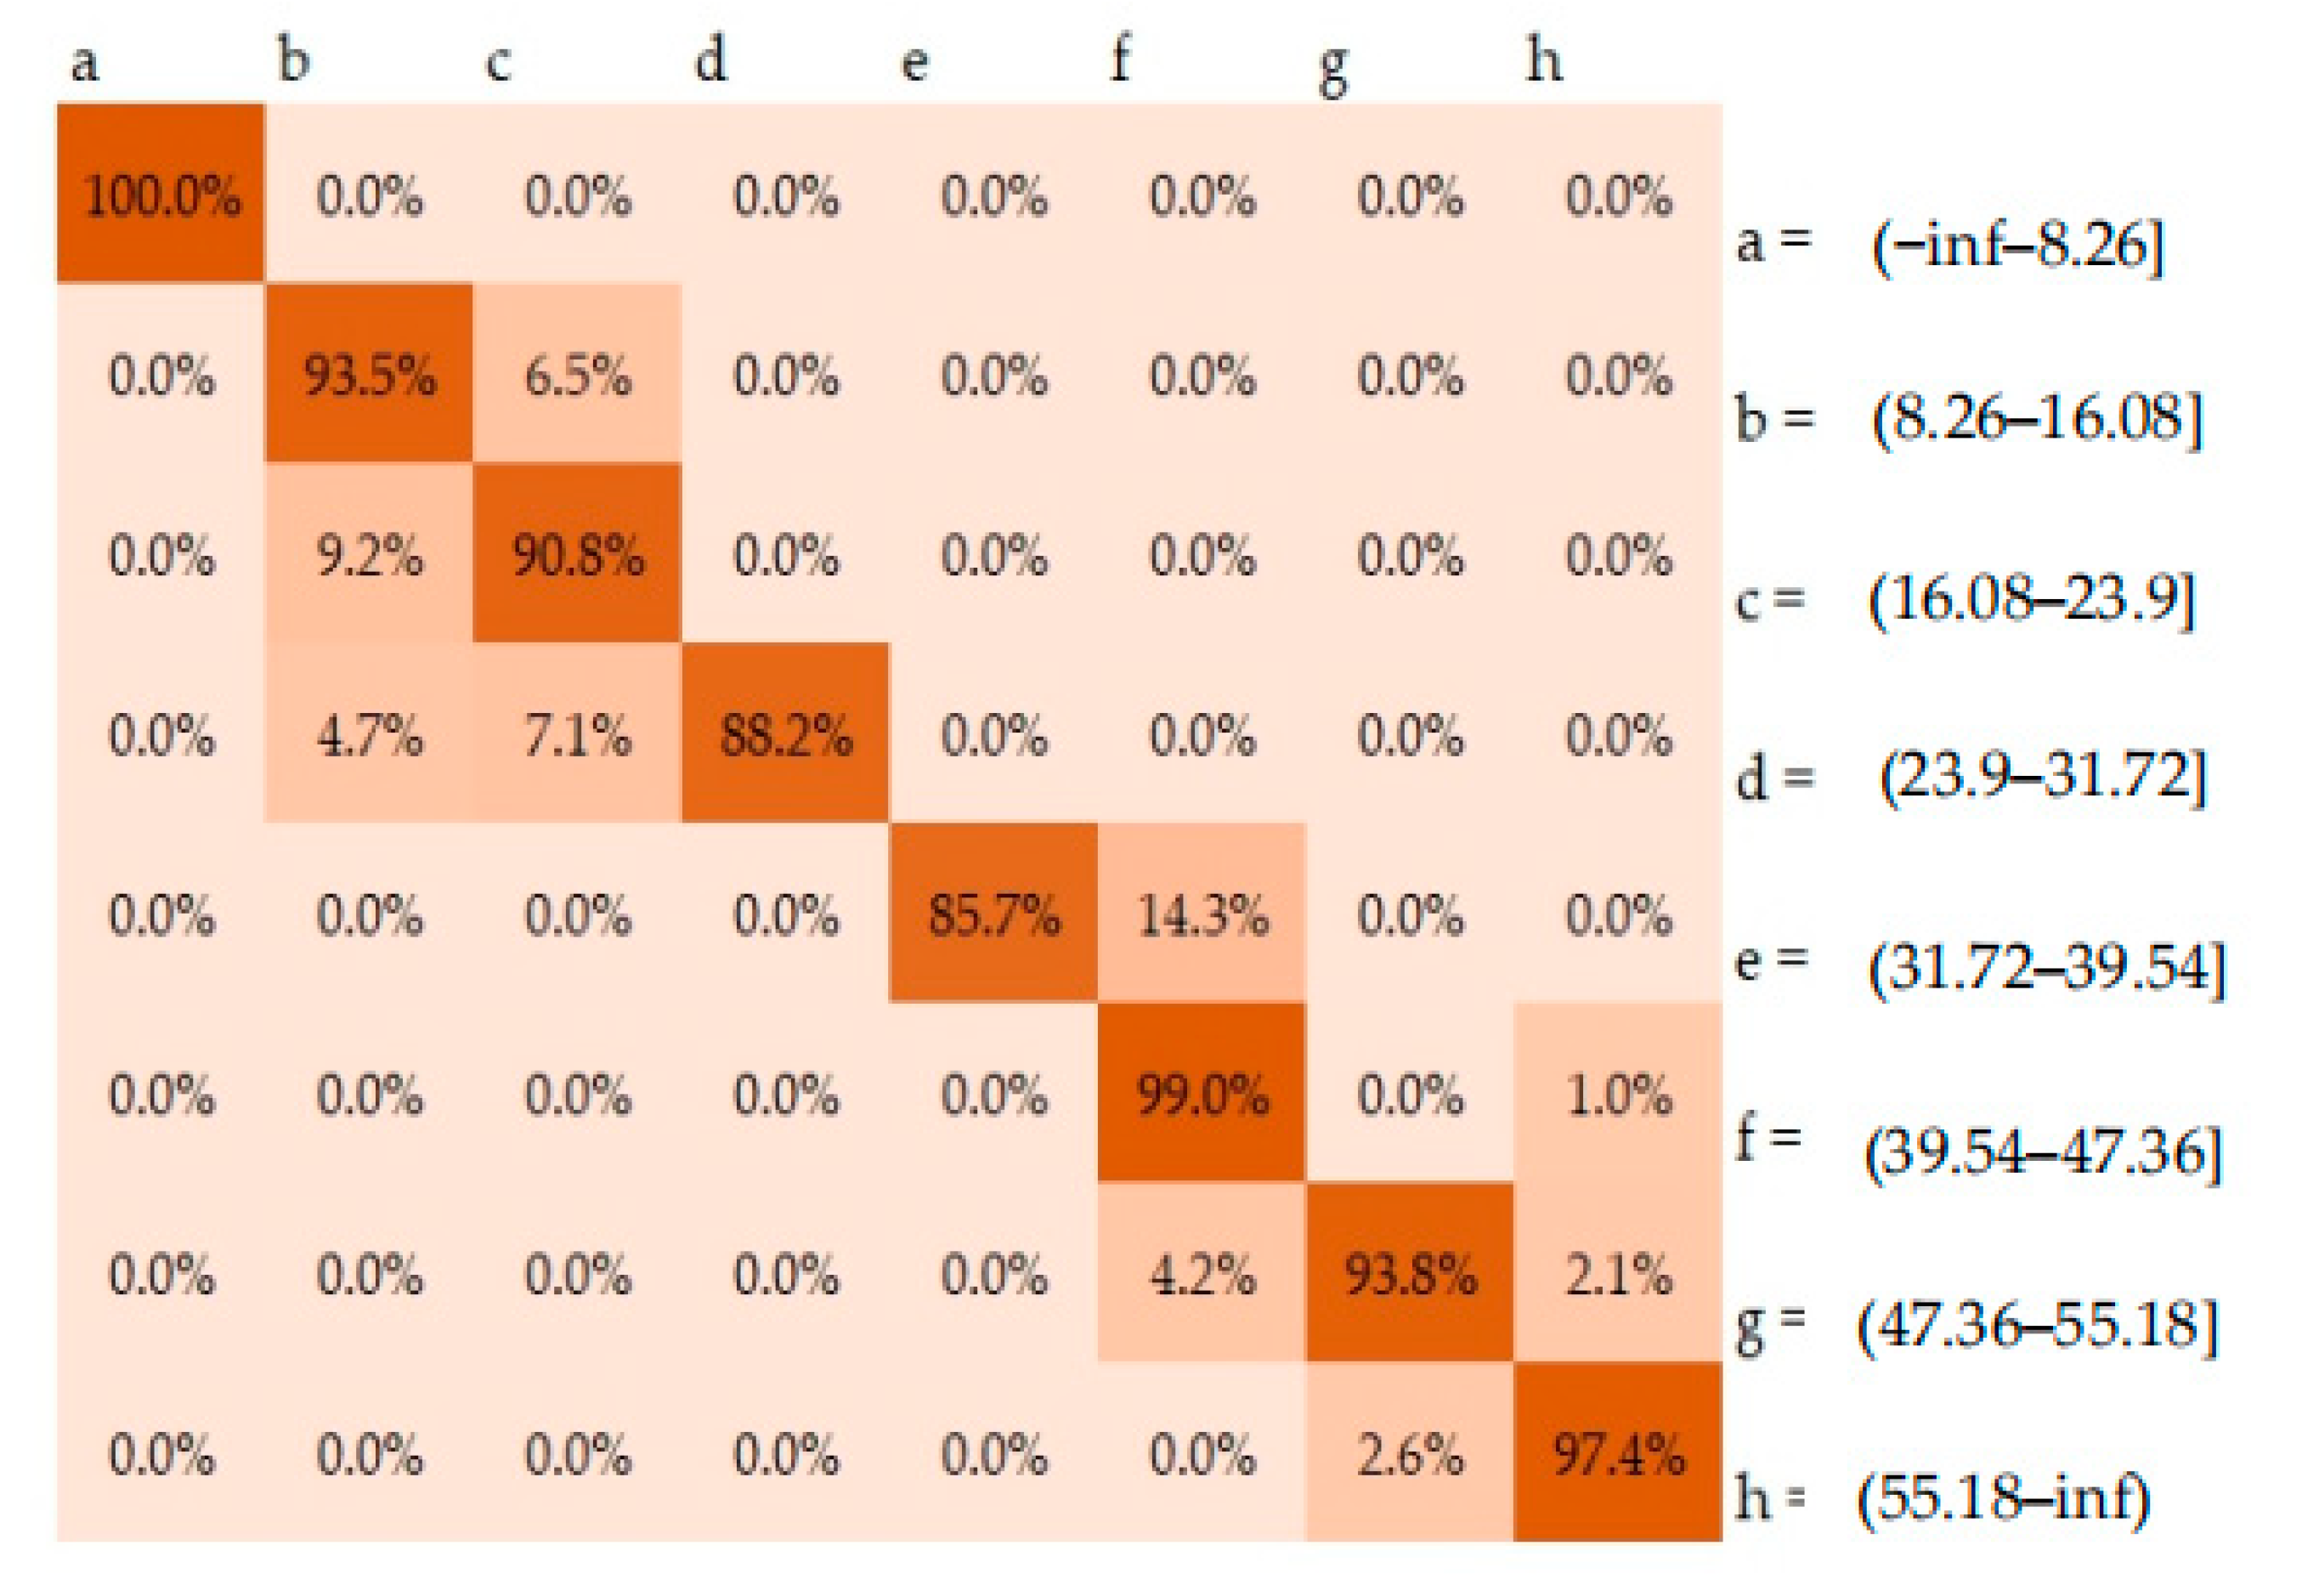
4.4. Confusion Matrix
5. Discussion and Concluding Remarks
6. Conclusions
Author Contributions
Funding
Institutional Review Board Statement
Informed Consent Statement
Data Availability Statement
Acknowledgments
Conflicts of Interest
Appendix A

| Trade Names | n (%) | Median | Mean | Minimum | Maximum | % CV |
|---|---|---|---|---|---|---|
| BRAND A | 278.0 | 16.1 | 17.1 | 12.4 | 29.0 | 16.9 |
| BRAND B | 117.0 | 56.0 | 55.1 | 43.6 | 62.1 | 10.0 |
| BRAND C | 4.0 | 14.7 | 15.0 | 13.4 | 17.1 | 10.9 |
| BRAND D | 56.0 | 17.1 | 18.4 | 12.4 | 35.0 | 35.6 |
| BRAND E | 8.0 | 15.2 | 18.2 | 13.7 | 29.0 | 35.1 |
| BRAND F | 24.0 | 42.4 | 42.9 | 38.5 | 50.0 | 7.4 |
| BRAND G | 255.0 | 15.3 | 16.6 | 12.8 | 26.8 | 17.4 |
| BRAND H | 19.0 | 16.2 | 17.0 | 13.4 | 23.0 | 18.7 |
| BRAND I | 15.0 | 62.1 | 61.1 | 47.1 | 62.1 | 6.3 |
| BRAND J | 719.0 | 18.0 | 18.8 | 13.2 | 31.0 | 22.5 |
| BRAND K | 195.0 | 13.2 | 14.4 | 12.4 | 30.0 | 21.6 |
| BRAND L | 68.0 | 15.3 | 15.9 | 12.5 | 23.0 | 18.7 |
| BRAND M | 12.0 | 15.5 | 18.7 | 12.5 | 26.0 | 29.5 |
| BRAND N | 10.0 | 15.0 | 15.4 | 13.9 | 20.7 | 13.0 |
| BRAND O | 22.0 | 46.9 | 46.7 | 41.0 | 52.0 | 5.2 |
| BRAND P | 50.0 | 15.5 | 17.8 | 12.4 | 29.0 | 28.0 |
| BRAND Q | 12.0 | 15.5 | 17.6 | 12.5 | 29.0 | 32.5 |
| BRAND R | 9.0 | 15.5 | 15.9 | 13.2 | 21.5 | 16.2 |
| BRAND S | 58.0 | 43.2 | 42.3 | 35.0 | 50.3 | 10.1 |
| BRAND T | 463.0 | 13.6 | 14.5 | 8.1 | 25.0 | 17.8 |
| BRAND U | 4.0 | 14.0 | 14.2 | 13.4 | 15.5 | 6.4 |
| BRAND V | 26.0 | 16.6 | 20.9 | 13.2 | 38.0 | 42.7 |
References
- World Health Organization (WHO). WHO Guideline on Country Pharmaceutical Pricing Policies. Available online: https://www.who.int/publications/i/item/9789240011878 (accessed on 27 June 2018).
- Gregson, N.; Sparrowhawk, K.; Mauskopf, J.; Paul, J. Pricing medicines: Theory and practice, challenges and opportunities. Nat. Rev. Drug Discov. 2005, 4, 121–130. [Google Scholar] [CrossRef]
- Das, S.C.; Mandal, M.; Mandal, S.C. A critical study on availability and price variation between different brands: Impact on access to medicines. Ind. J. Pharm. Sci. 2007, 69, 160–163. [Google Scholar]
- Danzon, P.M.; Kim, J.D. International price comparisons for pharmaceuticals: Measurement and policy issues. Pharmacoeconomics 1998, 14 (Suppl. 1), 115–128. [Google Scholar] [CrossRef]
- Udomaksorn, S.; Sakulbumrungsil, R.C.; Luangruangrong, P. The Investigation of Pharmaceutical Price Discrimination Among Public Hospitals in Thailand: A Case Study of Agent Acting on the Renin Angiotensin System (ACE) Inhibitors. Thai J. Pharm. Sci. 2008, 18, 128–138. [Google Scholar]
- Ngorsuraches, S.; Chaiyakan, K. Equitable Prices of Single-Source Drugs in Thailand. Appl. Health Econ. Health Policy 2015, 13, 389–397. [Google Scholar] [CrossRef]
- Songthung, P.; Sripanidkulchai, K.; Luangruangrong, P.; Sakulbumrungsil, R.C.; Udomaksorn, S.; Kessomboon, N.; Kanchanaphibool, I. An Innovative Decision Support Service for Improving Pharmaceutical Acquisition Capabilities. In Proceedings of the 2012 Annual SRII Global Conference, San Jose, CA, USA, 27 July 2012. [Google Scholar]
- Sooksriwong, C.; Suwattanapreeda, S.; Chanjaruporn, F. Medicine prices in Thailand: A result of no medicine pricing policy. South Med. Rev. 2009, 2, 10–14. [Google Scholar]
- Jung, S.; Bi, Y.; Davuluri, R.V. Evaluation of data discretization methods to derive platform independent isoform expression signatures for multi-class tumor subtyping. BMC Genom. 2015, 16, S3. [Google Scholar] [CrossRef] [Green Version]
- Sidey-Gibbons, J.A.M.; Sidey-Gibbons, C.J. Machine learning in medicine: A practical introduction. BMC Med. Res. Methodol. 2019, 19, 64. [Google Scholar] [CrossRef] [Green Version]
- Platt, J.C. Using sparseness and analytic QP to speed training of support vector machines. In Advances in Neural Information Processing Systems 1999; Kearns, M.S., Solla, S.A., Cohn, D.A., Eds.; MIT Press: Cambridge, MA, USA, 1999; pp. 557–563. [Google Scholar]
- Naveed, H.; Khan, G.; Khan, A.U.; Siddiqi, A.; Khan, M.U.G. Human activity recognition using mixture of heterogeneous features and sequential minimal optimization. Int. J. Mach. Learn Cybern. 2019, 10, 2329–2340. [Google Scholar] [CrossRef]
- Seidman, G.; Atun, R. Do changes to supply chains and procurement processes yield cost savings and improve availability of pharmaceuticals, vaccines or health products? A systematic review of evidence from low-income and middle-income countries. BMJ Glob. Health 2017, 2, e000243. [Google Scholar] [CrossRef] [PubMed]
- Kohler, J.C.; Dimancesco, D. The risk of corruption in public pharmaceutical procurement: How anti-corruption, transparency and accountability measures may reduce this risk. Glob. Health Action 2020, 13, 1694745. [Google Scholar] [CrossRef]
- Ioannides-Demos, L.L.; Ibrahim, J.E.; McNeil, J.J. Reference-Based Pricing Schemes. Pharmacoeconomics 2002, 20, 577–591. [Google Scholar] [CrossRef]
- Acosta, A.; Ciapponi, A.; Aaserud, M.; Vietto, V.; Austvoll-Dahlgren, A.; Kösters, J.P.; Vacca, C.; Machado, M.; Diaz Ayala, D.H.; Oxman, A.D. Pharmaceutical policies: Effects of reference pricing, other pricing, and purchasing policies. Cochrane Database Syst. Rev. 2014, 10, CD005979. [Google Scholar] [CrossRef]
- Andia, T.; Gaviria, A.; Gomez, C.; Jaramillo, L.F.; Marquez, S.; Rodríguez, I.; Vaca, C. First Evaluation of Colombian’s External Reference Pricing System. Value Health 2014, 17, 15. [Google Scholar] [CrossRef] [Green Version]
- Acosta, A.; Basto, S.; Fonseca, M.F.; Duran, C.; Vargas, C.; Rovira, J. Description of Drug Pricing and Procurement Information Web Portals in Some Latin American Countries. Pharmacoeconomics 2018, 3, 1–10. [Google Scholar] [CrossRef]
- Chen, L.; Yang, Y.; Luo, M.; Hu, B.; Yin, S.; Mao, Z. The Impacts of National Centralized Drug Procurement Policy on Drug Utilization and Drug Expenditures: The Case of Shenzhen, China. Int. J. Environ. Res. Public Health 2020, 17, 9415. [Google Scholar] [CrossRef] [PubMed]
- Dinov, I.D. Data Science and Predictive Analytics: Biomedical and Health Applications Using R, 1st ed.; Springer: Cham, Switzerland, 2018; pp. 398–408. [Google Scholar]
- Roumani, Y.F.; May, J.H.; Strum, D.P.; Vargas, L.G. Classifying highly imbalanced ICU data. Health Care Manag. Sci. 2012, 16, 119–128. [Google Scholar] [CrossRef] [PubMed]
- Keerthi, S.S.; Shevade, S.K.; Bhattacharyya, C.; Murthy, K.R.K. Improvements to Platt’s SMO Algorithm for SVM Classifier Design. Neural. Comput. 2001, 13, 637–649. [Google Scholar] [CrossRef]
- Pham, B.T.; Tien Bui, D.; Prakash, I.; Nguyen, L.H.; Dholakia, M.B. A comparative study of sequential minimal optimization-based support vector machines, vote feature intervals, and logistic regression in landslide susceptibility assessment using GIS. Environ. Earth Sci. 2017, 76, 371. [Google Scholar] [CrossRef]
- Mohammed, S.A.; Darrab, S.; Noaman, S.A.; Saake, G. Analysis of Breast Cancer Detection Using Different Machine Learning Techniques. In Data Mining and Big Data. Communications in Computer and Information Science; Tan, Y., Shi, Y., Tuba, M., Eds.; Springer: Singapore, 2020; pp. 108–117. [Google Scholar]
- Sunarya, A.; Henderi, H.; Tasyriqan, I. The comparison between sequential minimal optimization and multilayer perceptron neural network methods in predicting the commodity prices. In Proceedings of the 2019 Fourth International Conference on Informatics and Computing (ICIC), Semarang, Indonesia, 16–17 October 2019. [Google Scholar]
- Ince, H.; Trafalis, T.B. Short term forecasting with support vector machines and application to stock price prediction. Int. J. Gen. Syst. 2008, 37, 677–687. [Google Scholar] [CrossRef]
- Kwon, S.H.; Park, H.S.; Na, Y.J.; Park, C.; Shin, J.Y.; Kim, H.L. Price Reduction of Anticancer Drugs from 2007 to 2019 in South Korea: The Impact of Pharmaceutical Cost-Containment Policies. Appl. Health Econ. Health Policy 2020, 19, 1–12. [Google Scholar] [CrossRef]
- Ongarora, D.; Karumbi, J.; Minnaard, W.; Abuga, K.; Okungu, V.; Kibwage, I. Medicine prices, availability, and affordability in private health facilities in low-income settlements in Nairobi County, Kenya. Pharmacy 2019, 7, 40. [Google Scholar] [CrossRef] [Green Version]
- Kwon, H.Y.; Godman, B. Drug Pricing in South Korea. Appl. Health Econ. Health Policy 2017, 15, 447–453. [Google Scholar] [CrossRef] [Green Version]
- Emanuel, E.; Tanden, N.; Altman, S.; Armstrong, S.; Berwick, D.; Brantes, F.; Calsyn, M.; Chernew, M.; Colmers, J.; Cutler, D.; et al. A systemic approach to containing health care spending. N. Engl. J. Med. 2012, 367, 949–954. [Google Scholar] [CrossRef] [Green Version]
- Saleh, B.; Saedi, A.; Aqbi, A.; Salman, L. Analysis of Weka Data Mining Techniques for Heart Disease Prediction System. Int. J. Med. Rev. 2020, 7, 15–24. [Google Scholar]
- Patil, P.C.; Panchal, P.S.; Madiwale, S.; Tale, V.S. An analysis of non-cultivable bacteria using WEKA. Bioinformation 2020, 16, 620–624. [Google Scholar] [CrossRef]
- Platt, J.C. Fast training of support vector machines using sequential minimal optimization. In Advances in Kernel Methods: Support Vector Learning; MIT Press: Cambridge, MA, USA, 1999; pp. 185–208. [Google Scholar]
- Yao, W.F.; Jia, X.B. An Improved SVM Based on Feature Extension and Feature Selection. Appl. Mech. Mater. 2014, 552, 128–132. [Google Scholar] [CrossRef]
- Roobaert, D.; Karakoulas, G.; Chawla, N.V. Information gain, correlation and support vector machines. In Feature Extraction. Studies in Fuzziness and Soft Computing; Guyon, I., Nikravesh, M., Gunn, S., Zadeh, L.A., Eds.; Springer: Berlin/Heidelberg, Germany, 2006; Volume 207, pp. 463–470. [Google Scholar]
- Liu, Y.; Bi, J.W.; Fan, Z.P. Multi-class sentiment classification: The experimental comparisons of feature selection and machine learning algorithms. Expert Syst. Appl. 2017, 80, 323–339. [Google Scholar] [CrossRef] [Green Version]
- Sokolova, M.; Lapalme, G. A systematic analysis of performance measures for classification tasks. Inf. Process Manag. 2009, 45, 427–437. [Google Scholar] [CrossRef]
- MacDonald, K.; Potvin, K. Interprovincial Variation in Access to Publicly Funded Pharmaceuticals. Can. Pharm. J. 2004, 137, 29–34. [Google Scholar] [CrossRef]
- Bernstein, J.J.J.; Holt, G.B.; Bernstein, J. Price dispersion of generic medications. PLoS ONE 2019, 14, e0225280. [Google Scholar] [CrossRef]
- Brown, C.E. Coefficient of Variation. In Applied Multivariate Statistics in Geohydrology and Related Sciences; Springer: Berlin/Heidelberg, Germany, 2017; pp. 155–157. [Google Scholar]
- Hamzah, N.M.; Perera, P.N.; Rannan-Eliya, R.P. How well does Malaysia achieve value for money in public sector purchasing of medicines? Evidence from medicines procurement prices from 2010 to 2014. BMC Health Serv. Res. 2020, 20, 509. [Google Scholar] [CrossRef]
- Suchonwanich, N.; Laowahutannon, T.; Luangruangrong, P.; Techathawat, S.; Wongtangprasert, S. Drug Procurement and Distribution. J. Health Sci. 2020, 29, S45–S58. [Google Scholar]
- Al-Shahib, A.; Breitling, R.; Gilbert, D. Feature Selection and the Class Imbalance Problem in Predicting Protein Function from Sequence. Appl. Bioinform. 2005, 4, 195–203. [Google Scholar] [CrossRef] [PubMed]
- Gao, L.; Ye, M.; Lu, X.; Huang, D. Hybrid Method Based on Information Gain and Support Vector Machine for Gene Selection in Cancer Classification. Genom. Proteom. Bioinform. 2017, 15, 389–395. [Google Scholar] [CrossRef] [PubMed]
- Araújo, F.H.D.; Santana, A.M.; Santos Neto, P. Using machine learning to support healthcare professionals in making preauthorisation decisions. Int. J. Med. Inform. 2016, 94, 1–7. [Google Scholar] [CrossRef] [PubMed]
- Jiao, Y.; Du, P. Performance measures in evaluating machine learning based bioinformatics predictors for classifications. Quant. Biol. 2016, 4, 320–330. [Google Scholar] [CrossRef] [Green Version]
- Fawcett, T. An introduction to ROC analysis. Pattern. Recognit. Lett. 2006, 27, 861–874. [Google Scholar] [CrossRef]
- Luque, A.; Carrasco, A.; Martín, A.; Heras, A. The impact of class imbalance in classification performance metrics based on the binary confusion matrix. Pattern. Recognit. 2019, 91, 216–231. [Google Scholar] [CrossRef]
- Hu, Y.C.; Ansell, J. Retail default prediction by using sequential minimal optimization technique. J. Forecast. 2009, 28, 651–666. [Google Scholar] [CrossRef]
- Zhao, Z.; Li, X.Y. Study of Sequential Minimal Optimization Algorithm Type and Kernel Function Selection for Short-Term Load Forecasting. Appl. Mech. Mater. 2013, 329, 472–477. [Google Scholar] [CrossRef]


| Features | Descriptions |
|---|---|
| DEPT | Purchasing departments who purchase the medicines for hospitals |
| GPU | The name of generic product use in the database which involves the virtual therapeutic moiety and strength (e.g., Omeprazole 40 mg) |
| TPU | The name of trade product use or brand (e.g., Losec®, Omezole®) |
| METHOD | Procurement method (e.g., bidding method, specific selection method) |
| WINNER | Supplier who sells the medical product |
| UNIT | The dosage form of the drug product (e.g., powder for solution for injection) |
| SIZE | The number of units per pack (e.g., 14 or 28 tablets per box) |
| TOTAL | Purchase budget for each medical product (Thai Baht) |
| PRICE a | Procurement price per unit (Thai Baht) |
| Selection Methods | Selected Features | % Accuracy Measure |
|---|---|---|
| CFS | (1) GPU, (2) UNIT (3) DEPT | 84.15% |
| Wrapper Subset Evaluator | (1) GPU, (2) UNIT (3) DEPT, (4) TOTAL, (5) SIZE | 88.57% |
| Information Gain | (1) GPU, (2) UNIT (3) DEPT, (4) TOTAL, (5) SIZE (6) TPU, (7) WINNER | 89.21% |
| Gain Raito | (1) GPU, (2) UNIT (3) DEPT, (4) TOTAL, (5) SIZE (6) TPU, (7) WINNER, (8) METHOD | 92.62% |
| Class Labels | n (%) | TP Rate | FP Rate | Precision | Recall | F-Measure | ROC Area |
|---|---|---|---|---|---|---|---|
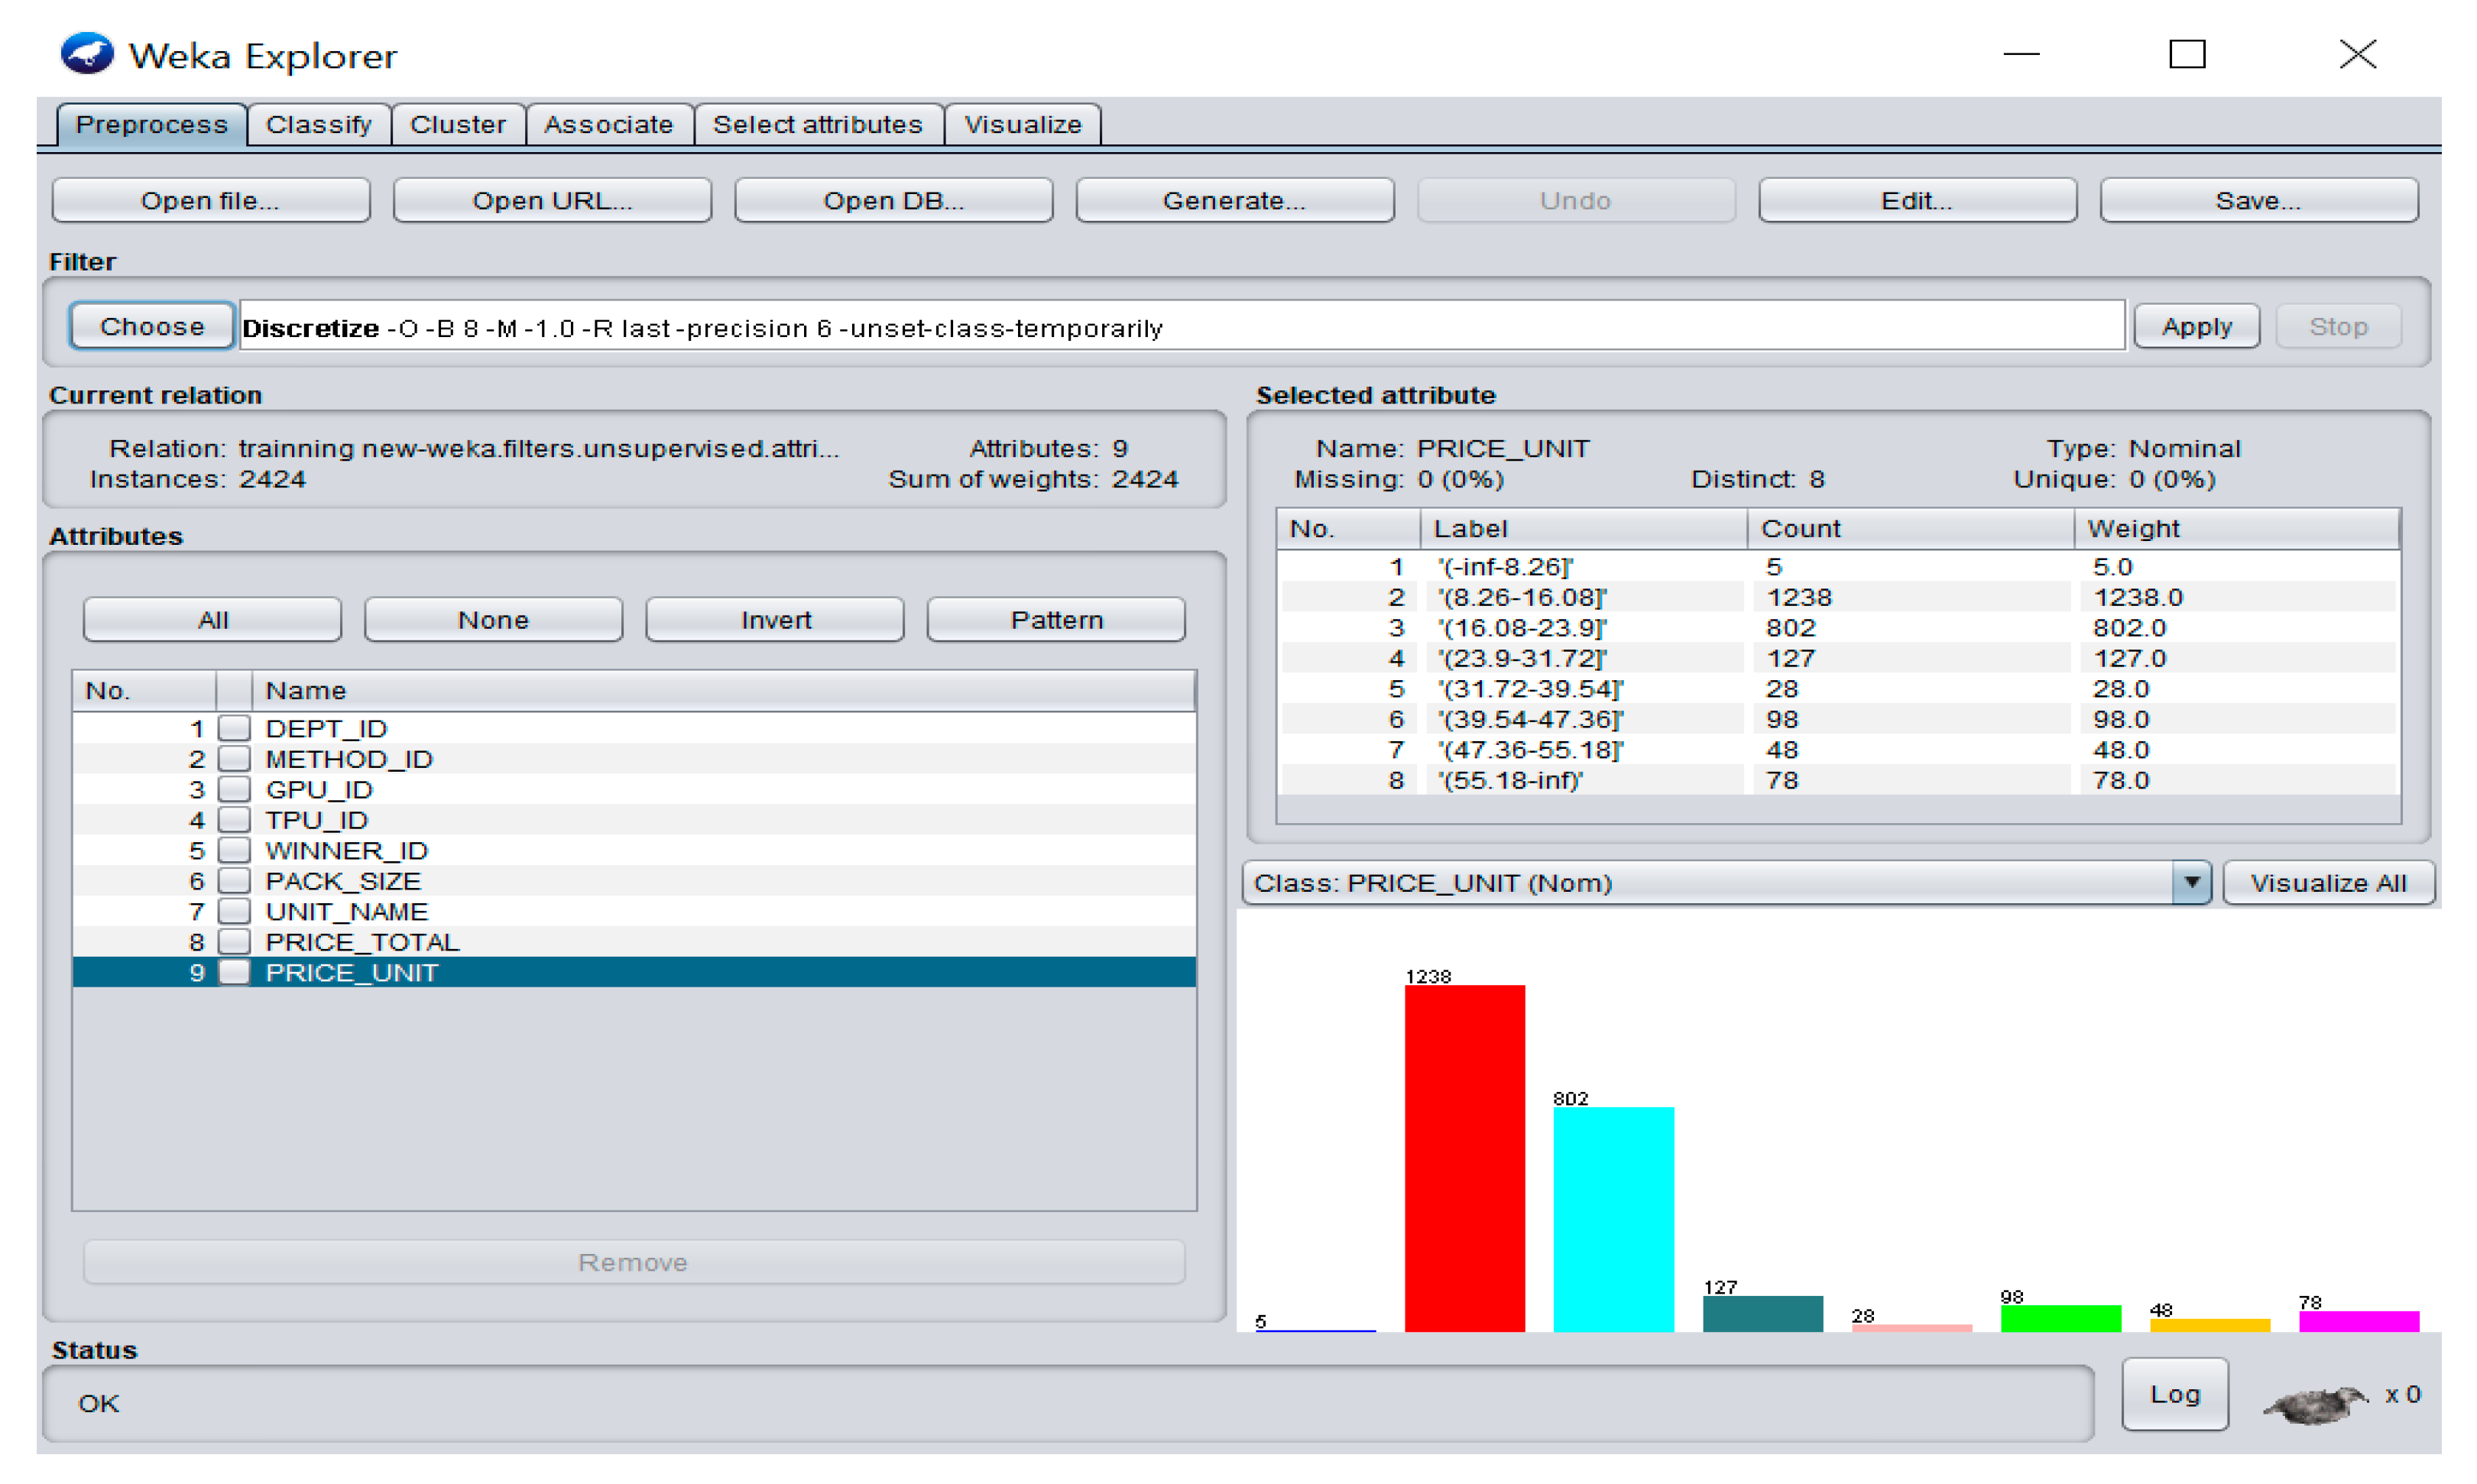
| class 1 = (−inf–8.26] | 5(0.2) | 1.000 | 0.000 | 1.000 | 1.000 | 1.000 | 1.000 |
| class 2 = (8.26–16.08] | 1238(51.1) | 0.935 | 0.067 | 0.935 | 0.935 | 0.935 | 0.943 |
| class 3 = (16.08–23.9] | 802(33.1) | 0.908 | 0.055 | 0.891 | 0.908 | 0.899 | 0.935 |
| class 4 = (23.9–31.72] | 127(5.2) | 0.882 | 0.000 | 1.000 | 0.882 | 0.937 | 0.978 |
| class 5 = (31.72–39.54] | 28(1.2) | 0.857 | 0.000 | 1.000 | 0.857 | 0.923 | 0.974 |
| class 6 = (39.54–47.36] | 98(4.0) | 0.990 | 0.003 | 0.942 | 0.990 | 0.965 | 0.990 |
| class 7 = (47.36–55.18] | 48(2.0) | 0.938 | 0.001 | 0.957 | 0.938 | 0.947 | 0.977 |
| class 8 = (55.18–inf) | 78(3.2) | 0.974 | 0.001 | 0.974 | 0.974 | 0.974 | 0.987 |
| Weighted Average | 0.926 | 0.053 | 0.927 | 0.926 | 0.926 | 0.947 |
| Parameters | Results |
|---|---|
| Correctly Classified Instances, n (%) | 2245 (92.62%) |
| Incorrectly Classified Instances, n (%) | 179 (7.38%) |
| Kappa statistic | 0.8813 |
| Mean absolute error | 0.1883 |
| Root mean squared error | 0.2925 |
| Total Number of Instances | 2424 |
Publisher’s Note: MDPI stays neutral with regard to jurisdictional claims in published maps and institutional affiliations. |
© 2021 by the authors. Licensee MDPI, Basel, Switzerland. This article is an open access article distributed under the terms and conditions of the Creative Commons Attribution (CC BY) license (https://creativecommons.org/licenses/by/4.0/).
Share and Cite
Pentrakan, A.; Yang, C.-C.; Wong, W.-K. How Well Does a Sequential Minimal Optimization Model Perform in Predicting Medicine Prices for Procurement System? Int. J. Environ. Res. Public Health 2021, 18, 5523. https://doi.org/10.3390/ijerph18115523
Pentrakan A, Yang C-C, Wong W-K. How Well Does a Sequential Minimal Optimization Model Perform in Predicting Medicine Prices for Procurement System? International Journal of Environmental Research and Public Health. 2021; 18(11):5523. https://doi.org/10.3390/ijerph18115523
Chicago/Turabian StylePentrakan, Amarawan, Cheng-Chia Yang, and Wing-Keung Wong. 2021. "How Well Does a Sequential Minimal Optimization Model Perform in Predicting Medicine Prices for Procurement System?" International Journal of Environmental Research and Public Health 18, no. 11: 5523. https://doi.org/10.3390/ijerph18115523