2. Results and Discussion
The organic extract of
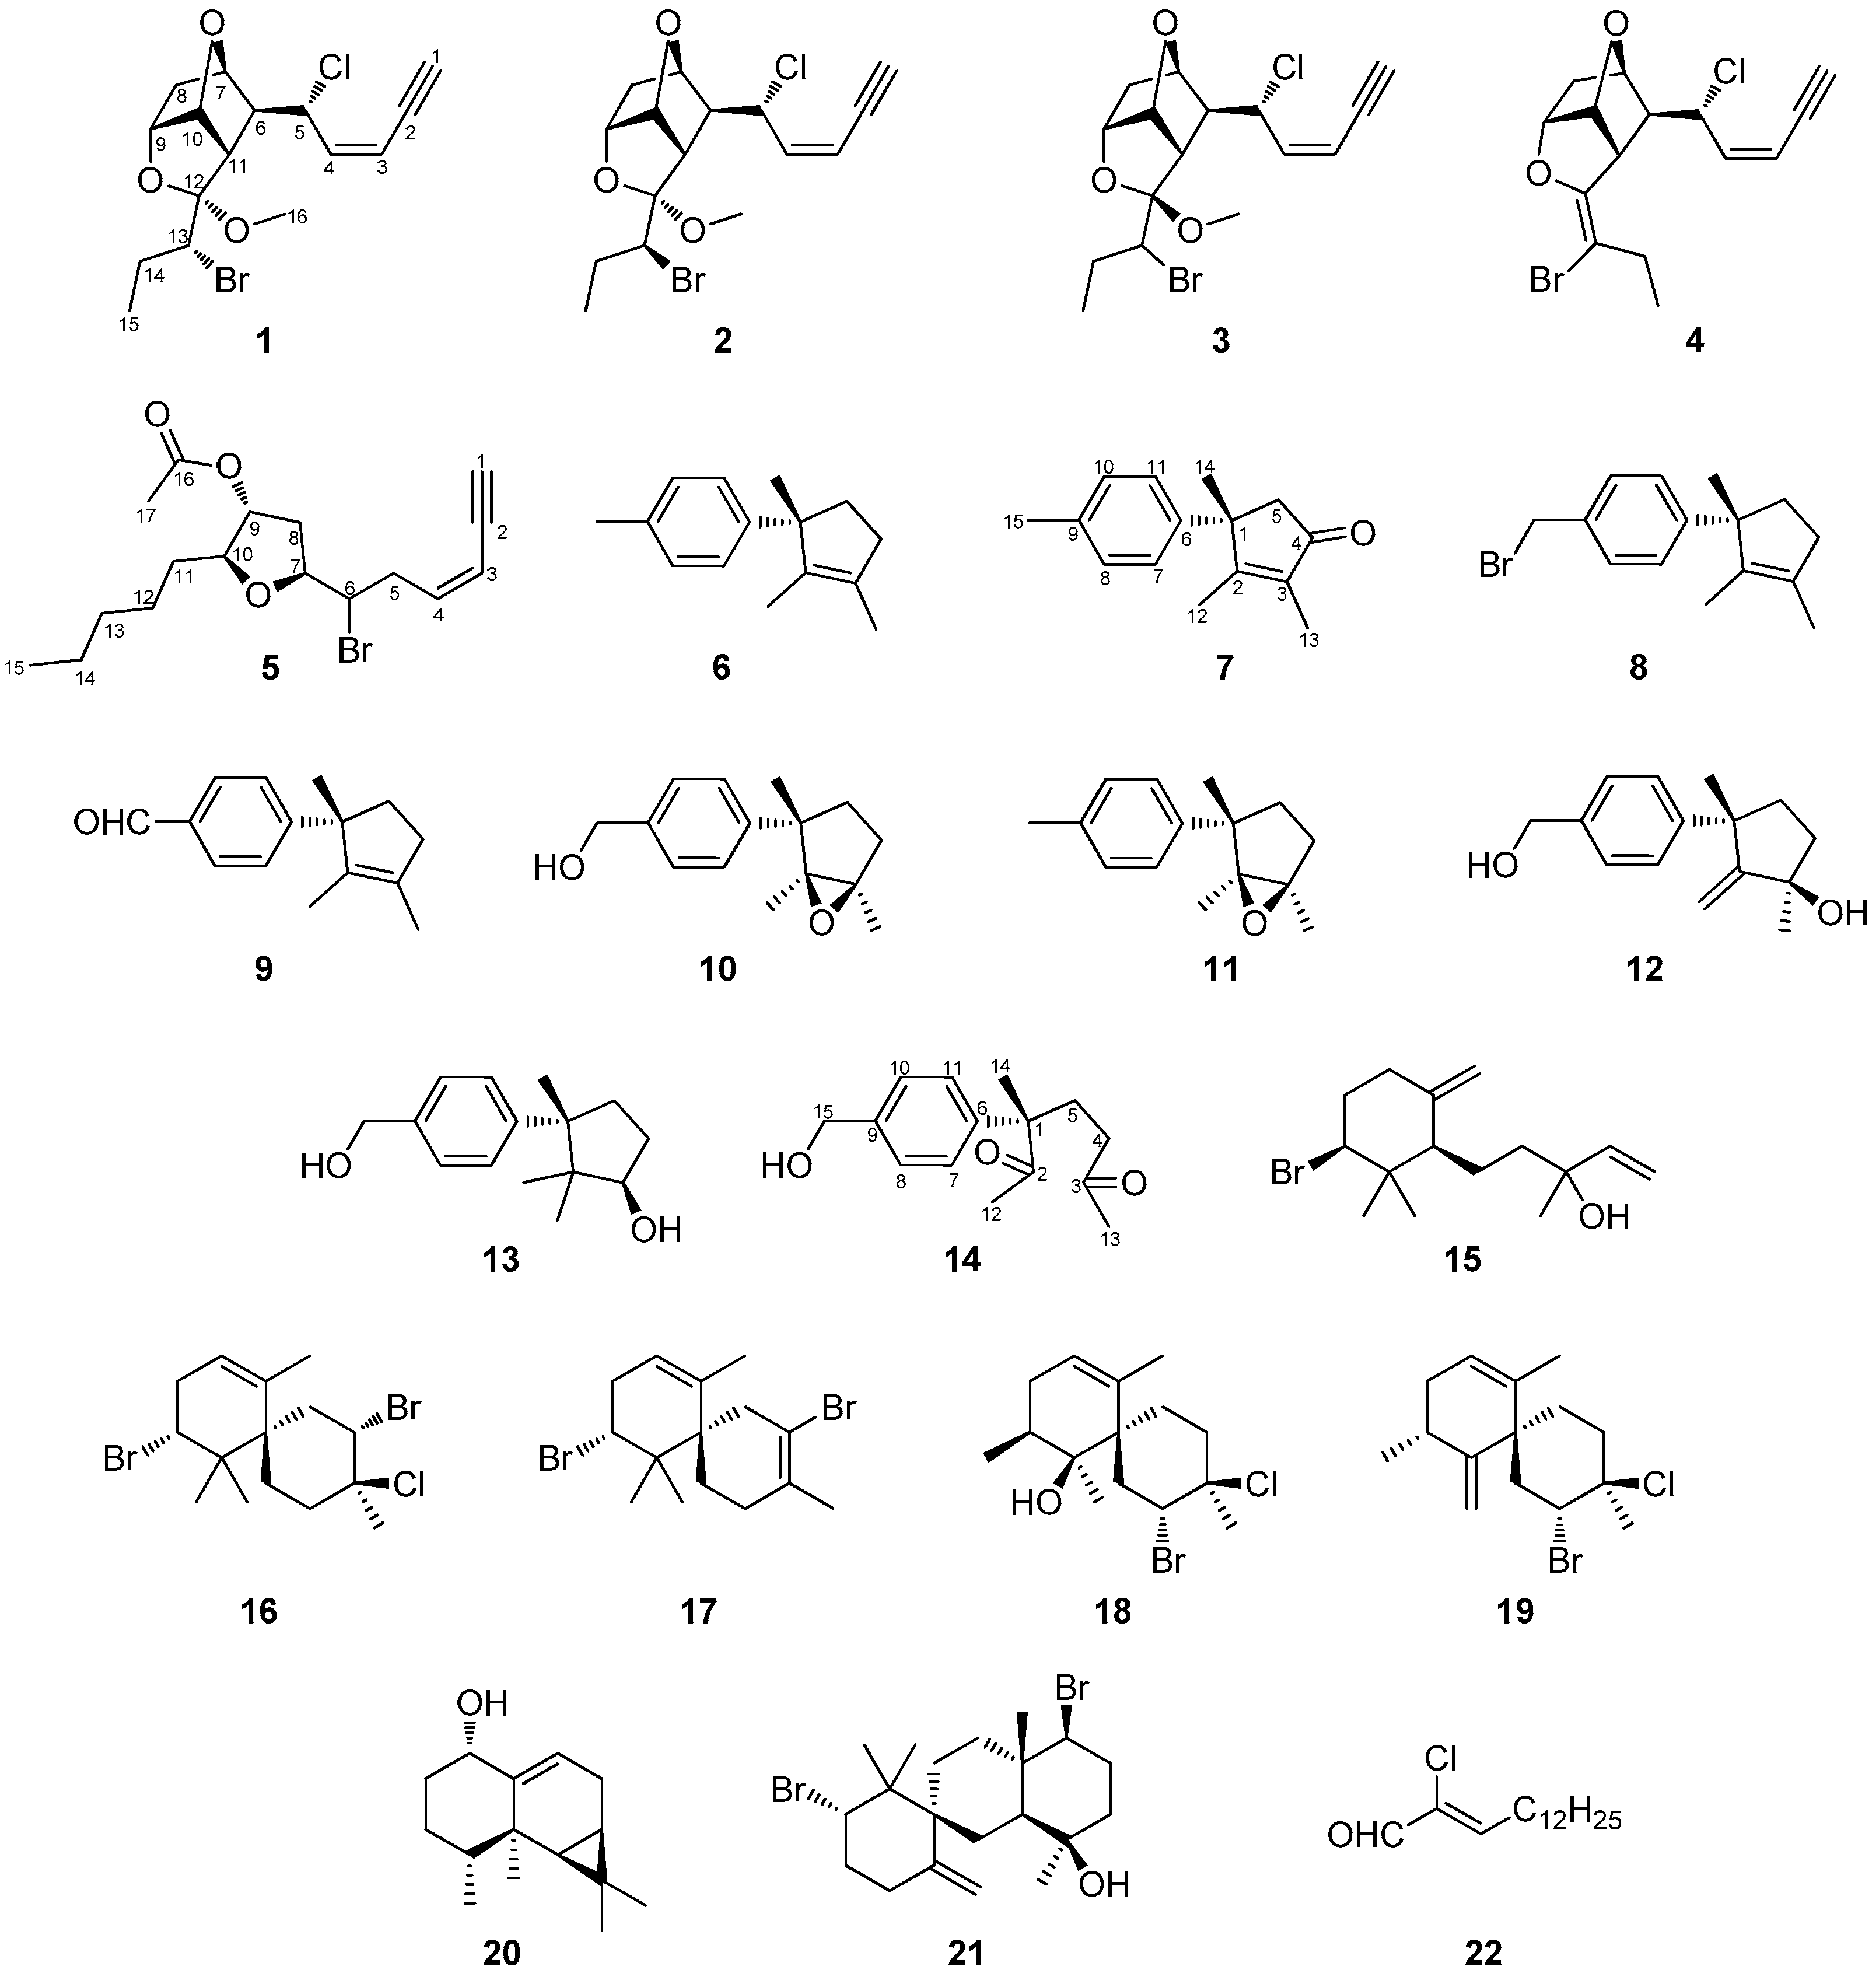
L. majuscula collected from the coral reef of Hurghada in Egypt was subjected to a series of chromatographic separations to yield 22 compounds (
1–
22). Among them, compounds
4,
6,
9,
12,
13 and
15–
22 were identified by comparison of their spectroscopic and physical characteristics with those reported in the literature as
cis-maneonene D (
4) [
6], isolaurene (
6) [
7], isolauraldehyde (
9) [
8], laur-2-ene-3,12-diol (
12) [
9], cuparene-3,12-diol (
13) [
9],
β-snyderol (
15) [
10], 2,10-dibromo-3-chloro-
a-chamigrene (
16) [
11], laurecomin C (
17) [
12], compositacin A (
18) [
13], laurokamin A (
19) [
13,
14], aristol-9-en-1
α-ol (
20) [
15], kahukuene B (
21) [
16] and (2
Z)-2-chloro-pentadec-2-enal (
22) [
17], previously isolated from different species of
Laurencia.
Maneonene F (
1) was obtained as a white amorphous solid, possessing the molecular formula C
16H
20BrClO
3 as deduced from the HR-APCIMS measurements. The presence of one bromine and one chlorine in the molecule was also evident in the LR-EIMS spectrum, as indicated by the fragment ion [M − OCH
3]
+ cluster at
m/z 343/345/347 with relative intensities 3:4:1. The spectroscopic data of metabolite
1 (
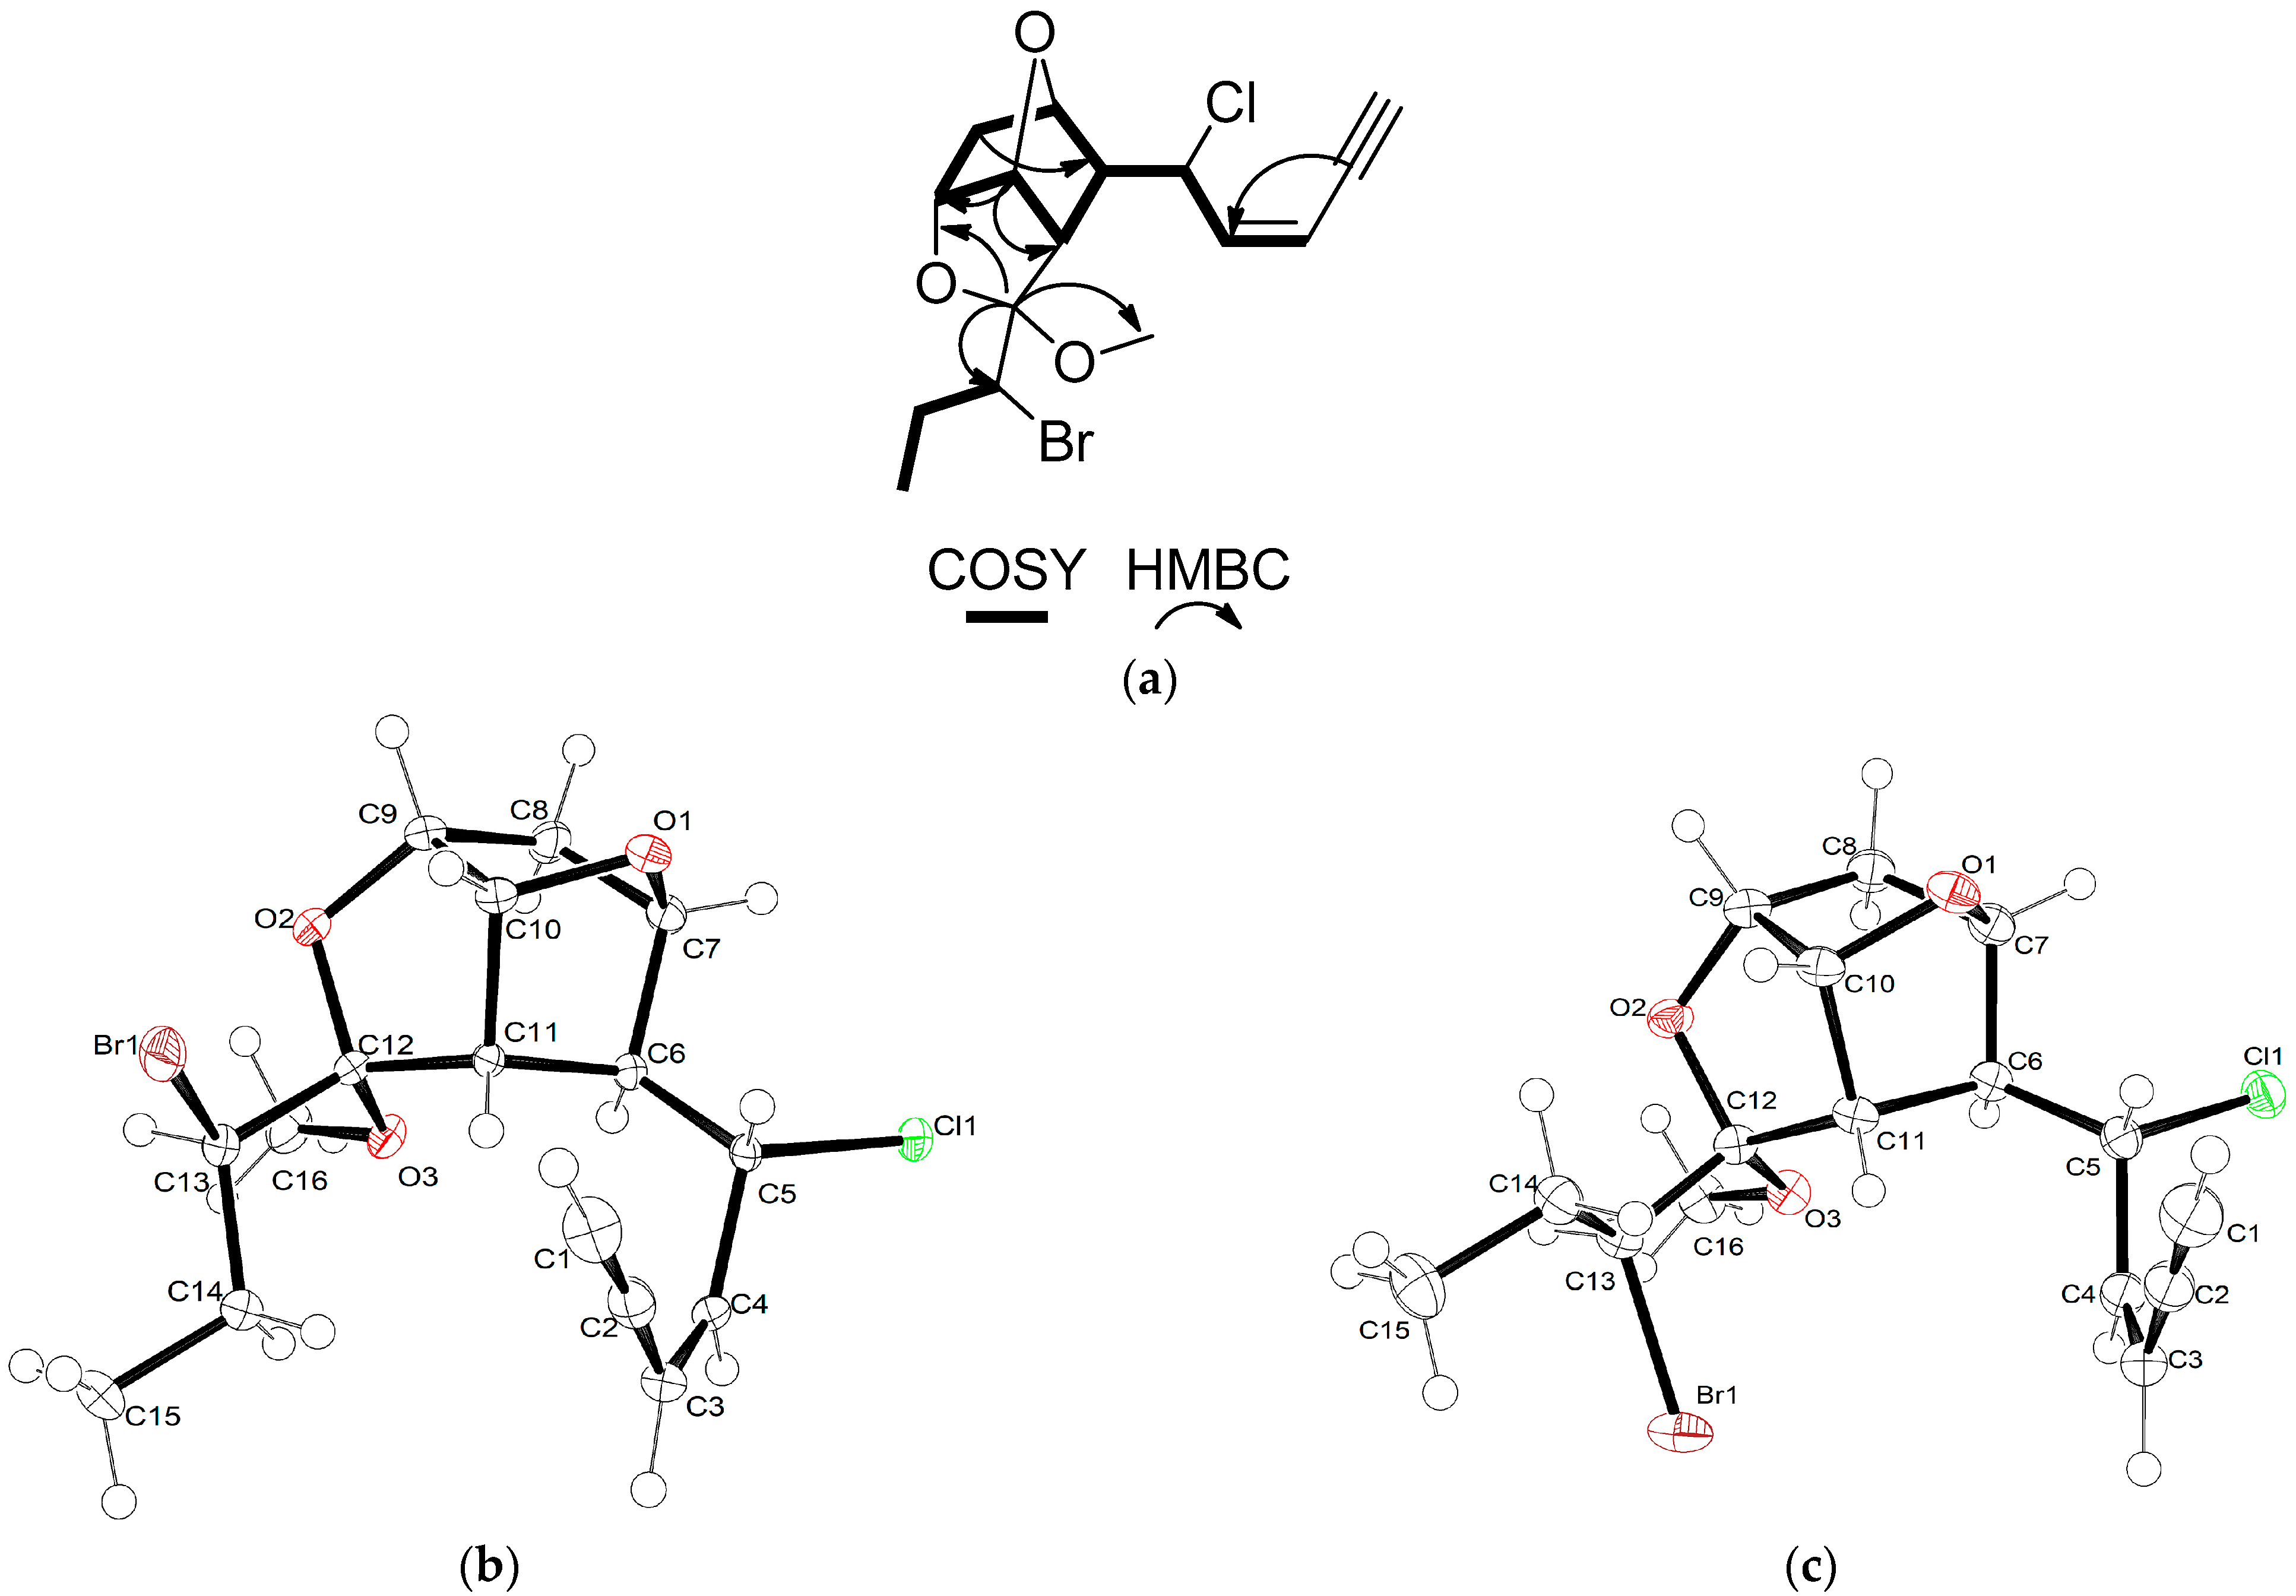
Table 1), in conjunction with the correlations observed in its HSQC, HMBC and COSY spectra, suggested a tricyclic C
15 acetogenin of the maneonene type. Specifically, the HSQC-DEPT and HMBC spectra revealed the presence of one methyl on a secondary carbon atom and an oxymethyl, two methylenes, ten methines and two non-protonated carbons. In the COSY spectrum, the presence of one extended spin system spanning from H-1 to H-11 and a shorter one from H-13 to H
3-15 (
Figure 2a) were evident. The HMBC correlations of H-10 (
δH 5.30) with C-7 (
δC 77.5), as well as of H-9 (
δH 4.40) with C-12 (
δC 108.2), confirmed the presence of two ether bridges between C-7 and C-10 and between C-9 and C-12, while the correlations of C-12 with H-6 (
δH 2.87), H-13 (
δH 4.04) and H
3-16 (
δH 3.27) connected the two spin systems concluding the tricyclic skeleton and secured the position of the methoxy group at C-12. In addition, the HMBC correlations of C-2 (
δC 78.3) with H-3 (
δH 5.60) and H-4 (
δH 5.90), as well as of C-4 (
δC 141.6) with H-1 (
δH 3.24), confirmed the presence of the terminal –enyne moiety, which is frequently encountered in C
15 acetogenins [
4]. The relative configuration of metabolite
1 was proposed on the basis of the cross-peaks observed in its NOESY spectrum. Specifically, the correlations of H
3-16 with H-13 and of H-11 with H-14b (
δH 1.48), as well as that of H-11 with H-10 and of H-10 with H-9, secured the relative configuration at C-9, C-10, C-11 and C-12. Furthermore, the absence of measurable coupling of H-6 with both H-7 and H-11, indicating an almost 90° dihedral angle between H-6–C-6–C-7–H-7, as well as between H-6–C-6–C-11–H-11, in conjunction with the NOE enhancement of H-5 with H-11, secured the relative configuration at C-6 and C-7. The
Z geometry of the double bond in the –enyne moiety was deduced from the coupling constant of H-3 with H-4 (
J = 10.6 Hz) and the chemical shift of the acetylenic proton (
δH 3.24). Single crystal X-ray diffraction analysis of a crystal of
1 (
Figure 2b) allowed for the verification of its proposed structure, including the unambiguous assignment of the relative configuration at C-5 and C-13, which could not be determined by analysis of the NMR spectroscopic data. The absolute stereochemistry of maneonene F (
1) was determined as 5
R,6
S,7
R,9
R,10
R,11
S,12
S,13
R.
The spectroscopic data of metabolites
2 and
3 (
Table 1), possessing the same molecular formulae as compound
1, closely resembled those of maneonene F (
1), suggesting the same planar structure for
2 and
3, as was further confirmed from the correlations observed in their respective HSQC-DEPT, HMBC and COSY spectra. The observed correlations in the NOESY spectrum of metabolite
2 were similar to those observed for metabolite
1, suggesting the same relative configuration in the rigid tricyclic scaffold of compound
2. However, the fact that H-10, H-13 and H-14a were shielded (
δH 4.88, 3.96 and 1.79, respectively, for
2 vs.
δH 5.30, 4.04 and 1.93, respectively, for (
1) suggested a change in the relative configuration at C-13. Indeed, single-crystal X-ray diffraction analysis of a crystal of
2 (
Figure 2c) verified that maneonene G (
2) was the 13-epimer of
1 and established its absolute stereochemistry as 5
R,6
S,7
R,9
R,10
R,11
S,12
S,13
S. In the NOESY spectrum of maneonene H (
3), the correlations of H-9 with H-10 and of H-10 with H-11, in combination with that of H-13 with H-6, secured the relative configuration at C-9, C-10 and C-11 and suggested the inversion of relative configuration at C-12. The fact that H-6 resonates in higher fields in
3 in comparison to
1 and
2 (
δH 2.43 in
3 vs.
δH 2.87 and 2.97 in
1 and
2, respectively) also corroborates the inversion of the orientation of the methoxy group at C-12. The relative configuration at C-6 and C-7 was determined, as in the case of
1 and
2, on the basis of the absence of coupling of H-6 with both H-7 and H-11 (
J6,7 ≈ 0 Hz and
J6,11 ≈ 0 Hz) and the NOE cross-peak of H-5 with H-11, whereas the relative configuration at C-5 and C-13 could not be unambiguously assigned on the basis of analysis of the NMR spectroscopic data.
Surprisingly, in comparison to
1 and
2, maneonene H (
3) proved unstable and rapidly converted upon standing to a mixture of compounds
1,
2 and
4, thus securing the absolute configuration for the asymmetric centers C-5, C-6, C-7, C-9, C-10 and C-11 in
3 and
4, as in the cases of
1 and
2. It can be hypothesized that
3, having a methoxy substituent at C-12 with an
R configuration, is less stable and, through demethoxylation and formation of
4 as an intermediate, results in the production of the more stable stereoisomers
1 and
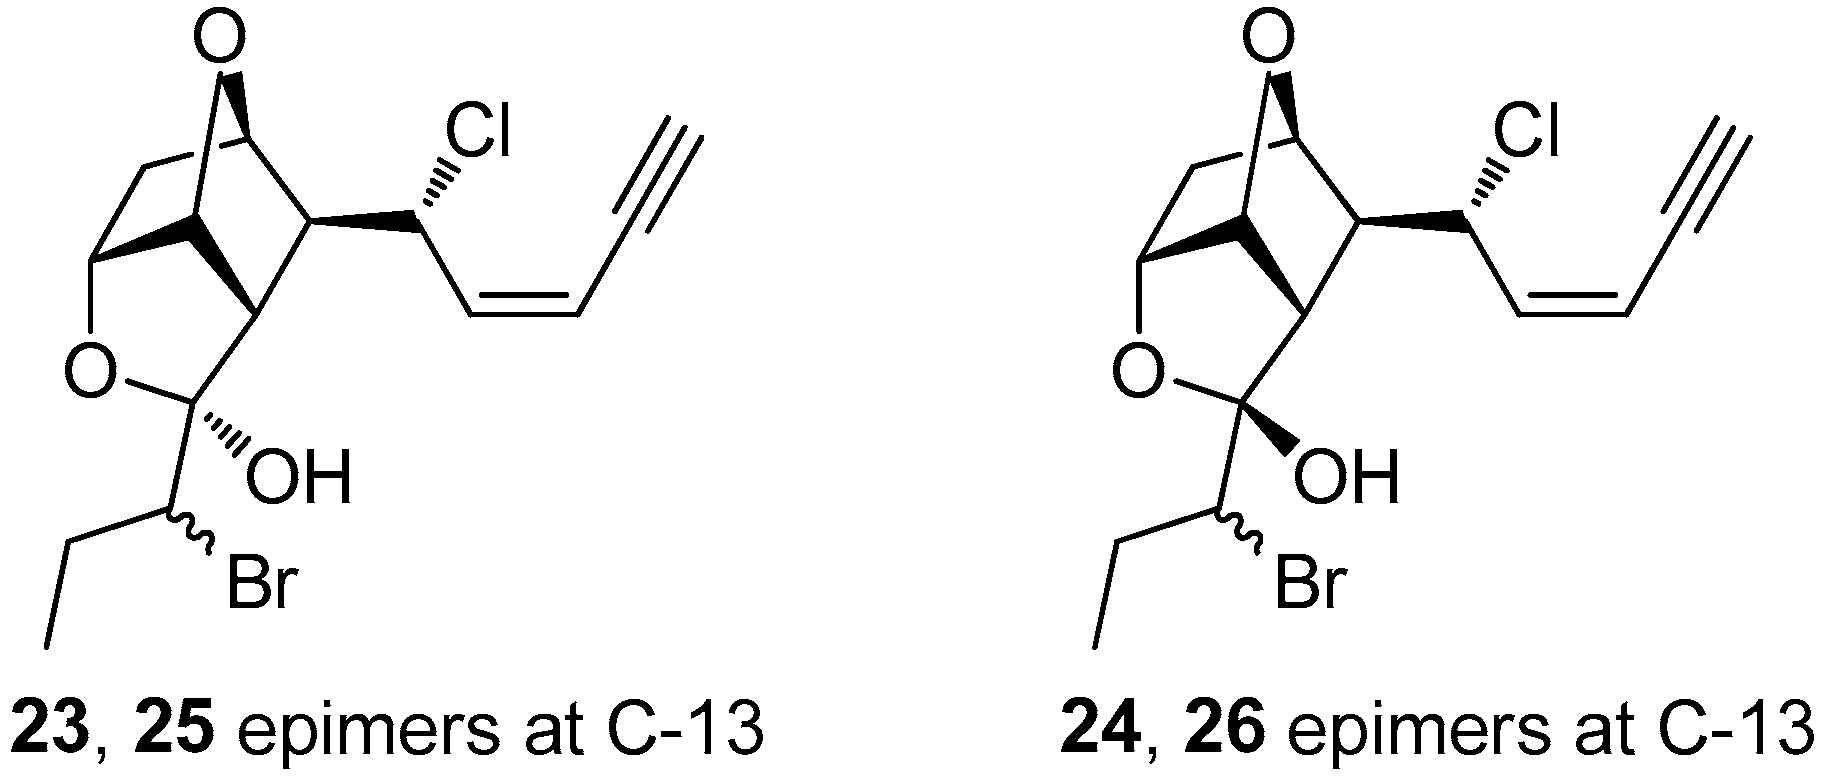
2. Interestingly, when compound
4 was subjected to reversed-phase HPLC, it afforded a mixture of the hydroxylated at C-12 derivatives
23–
26 (
Figure 3). Attempts to purify the four derivatives were proven unsuccessful, since it seems that these derivatives exist in a dynamic equilibrium. Specifically, even though four distinct peaks could be observed in normal-phase HPLC that were separately collected, the
1H NMR spectra of the individual peaks revealed their interconversion. Therefore, structure elucidation of these derivatives was based on 2D NMR and MS data of the mixture of
23–
26 (at a 1:2:1:2 ratio), as well as of the mixture of
23 and
24 (at a 1:1 ratio) (
Table S1). The
S configuration at C-12 for
23 and
25 was assigned on the basis of NOE interactions between H-10 and H-13, while the absence of the particular NOE cross-peak for
24 and
26 indicated an
R configuration at C-12. Based on the above observations, it cannot be excluded that compounds
1–
3 might not be the actual natural products present in the fresh algal tissues of the red alga, since the acetals
1–
3 could be produced during the extraction process upon addition of MeOH on the enol ether
4.
Compound
5, obtained as colorless oil, possessed the molecular formula C
17H
25BrO
3, as indicated by the HR-ESIMS and NMR data. The pseudomolecular ion peaks [M + H]
+ at
m/z 357.1057 and 359.1039, with relative intensities of 1:1, confirmed the presence of a bromine atom in the molecule. The absorption bands in the IR spectrum of compound
5 at
νmax 3293, 1735 and 1050 cm
−1 were indicative of the presence of a terminal alkyne moiety, an ester carbonyl and an ether functionality. The five degrees of unsaturation in combination with the presence of a double and a triple carbon–carbon bond and a carbonyl group, as evidenced from the
1H and
13C chemical shifts (
Table 1), indicated a monocyclic carbocycle. The HSQC-DEPT and HMBC spectra revealed the presence of one methyl on a secondary carbon atom and an acetyl methyl, six methylenes, seven methines, among which one was halogenated and three were oxygenated, as well as two non-protonated carbon atoms. The correlations in the COSY spectrum revealed the presence of a single extended spin system spanning from H-1 to H
3-15, positioning the bromine atom at C-6 and confirming the presence of the –enyne functionality. The HMBC correlation of H-7 (
δH 3.69) with C-10 (
δC 81.8) confirmed the ether bridge between C-7 and C-10. The acetoxy group was placed at C-9 on the basis of the HMBC correlation between H-9 (
δH 5.08) and the carbonyl carbon C-16 (
δC 169.2). The relative configurations of the asymmetric centers of metabolite
5 were proposed on the basis of the NOE correlations between H-7 and H-10 indicating their
cis orientation, while the lack of NOE correlation between H-7 and H-9 indicated their
trans orientation. The
Z geometry of the double bond in the –enyne moiety was dictated from the coupling constant of H-3 with H-4 (
J = 10.6 Hz) and the chemical shift of the acetylenic proton (
δH 2.75). Thus, metabolite
5 was identified as (3
Z,7
S*,9
R*,10
S*)-9-acetoxy-6-bromo-7,10-epoxypentadec-3-en-1-yne.
Metabolite
7, obtained as colorless oil, possessed the molecular formula C
15H
18O, as indicated by the HR-ESIMS and NMR spectroscopic data. The presence of a substituted benzene ring was suggested from the absorbances at 1648 and 1508 cm
−1 in the IR spectrum and the two doublets resonating at
δH 7.04 and 7.10 and integrating for two protons each, indicative for a
para-substituted aromatic ring. In addition, the intense absorption band at 1703 cm
−1 dictated the presence of a carbonyl group in the molecule. The HSQC-DEPT and HMBC spectra revealed the presence of four methyls, one methylene, four methines and six non-protonated carbon atoms. The spectroscopic features of metabolite
7 (
Table 2), in conjunction with the correlations observed in the HMBC and COSY spectra, suggested a laurane skeleton for compound
7. Specifically, the position of H
3-14 on C-1 was confirmed by the HMBC correlations of H
3-14 (
δH 1.56) with C-1 (
δC 47.8), C-2 (
δC 176.2), C-5 (
δC 53.3) and the aromatic carbon C-6 (
δC 142.0). The correlations of H
3-12 (
δH 1.71) with C-1, C-2 and C-3 (
δC 135.5) and those of H
3-13 (
δH 1.76) with C-2, C-3 and C-4 (
δC 208.6) secured the positions of H
3-12 on C-2 and H
3-13 on C-3, thus allowing for the identification of
7 as 4-oxoisolaurene.
Metabolite
8 was isolated as colorless oil and displayed molecular ion peaks [M]
+ at
m/z 278/280 (LR-EIMS) with relative intensities 1:1, suggesting the presence of one bromine atom. The HR-APCIMS measurements, in conjunction with the spectroscopic features (
Table 2) of metabolite
8, supported the molecular formula C
15H
19Br. Compound
8 shared quite similar spectroscopic features with isolaurene (
6). In particular, the signals of the vinylic methyls H
3-12 and H
3-13 (
δH 1.38 and 1.70, respectively), the aliphatic methyl H
3-14 (
δH 1.35) and the four aromatic protons H-7/H-11 and H-8/H-10 (
δH 7.18 and 7.28, respectively) were evident in the
1H NMR spectrum of compound
8. The most significant difference with compound
6 was the replacement of the methyl group at C-9 by a brominated methylene (
δH 4.46), confirmed by the correlations of H
2-15 with C-8/C-10 (
δC 128.8) and C-9 (
δC 133.0). Accordingly, metabolite
8 was identified as 15-bromoisolaurene.
Compound
10 was isolated as a white amorphous solid with molecular formula C
15H
20O
2, as indicated by its HR-ESIMS and NMR data. The intense IR absorption at 3427 cm
−1 was indicative of the presence of a hydroxy group. The
1H NMR spectrum of
10 exhibited two doublets at
δH 7.15 (d,
J = 8.1 Hz, 2H) and 7.30 (d,
J = 8.1 Hz, 2H), integrating for two protons each and indicating the presence of a 1,4-disubstituted benzene ring (
Table 2). The remaining signals included three singlet methyls, one on an aliphatic quaternary carbon (
δH 1.47) and two on oxygenated quaternary carbons (
δH 1.10 and 1.49), as well as an oxygenated aromatic methylene resonating at
δH 4.66 (H
2-15). The six degrees of unsaturation and the presence of an aromatic ring dictated a tricyclic skeleton. The presence of a 1,2,3-trimethylcyclopentanyl moiety was deduced from the COSY correlations between H
2-4 and H
2-5 and the correlations in the HMBC spectrum from H
3-12 to C-1, C-2 and C-3, from H
3-13 to C-2, C-3 and C-4, and from H
3-14 to C-1, C-2, C-5 and C-6, suggesting a laurane carbocycle. Furthermore, according to the molecular formula of compound
10, the remaining oxygen atom in the molecule was assigned to an oxirane ring between C-2 and C-3, as supported from the chemical shifts of C-2 (
δC 72.6) and C-3 (
δC 70.4) and the observed HMBC correlations. The relative configuration of the asymmetric centers of compound
10 was determined on the basis of the correlations observed in the NOESY spectrum. Specifically, the NOE correlations of the aromatic protons at
δH 7.15 (H-7/H-11) with H
3-12, H
3-13 and H-4b (
δH 1.83) suggested the anticoplanar orientation of H
3-14 in relation to H
3-12 and H
3-13, thus allowing for the identification of
10 as (1
S*,2
S*,3
R*)-2,3-epoxy-15-hydroxydihydroisolaurene.
Metabolite
11, isolated as colorless oil, possessed the molecular formula C
15H
20O, as suggested by its LR-EIMS and NMR data. The spectroscopic data of compound
11 were rather similar to those of compound
10, with the main differences being the absence of the singlet at
δH 4.66 attributed to the hydroxymethylene at C-9 of the aromatic ring and the presence of a singlet resonating at
δH 2.31 attributed to an aromatic methyl (
Table 2). The COSY and HMBC correlations verified the planar structure of
11. Compound
11 was proven quite unstable and degraded prior to the acquisition of a NOESY spectrum. Nevertheless, the high structural similarity of
11 with metabolite
10 rendered safe the assumption that both
10 and
11 share the same relative configuration. Therefore, metabolite
11 was identified as (1
S*,2
S*,3
R*)-2,3-epoxydihydroisolaurene.
Compound
14 was isolated as colorless oil. The pseudomolecular ion [M + H]
+ at
m/z 249.1487 observed in its HR-ESIMS was consistent with the molecular formula C
15H
20O
3. The absorption bands at 3428 and 1703 cm
−1 in the IR spectrum, in conjunction with the observed
13C signals at
δC 210.0, 208.1 and 64.8 (
Table 2), suggested the presence of two carbonyl moieties and one hydroxy group. The presence of a 1,4-disubstituted benzene ring was indicated by the two doublets at
δH 7.20 and 7.34 integrating for two protons each. Moreover, the presence of an aromatic hydroxymethylene at position C-9 was verified by the HMBC correlations of H
2-15 (
δH 4.69) with C-8/C-10 (
δC 127.7) and C-9 (
δC 139.2). The aliphatic methyl H
3-14 (
δH 1.45) was fixed at C-1 due to its correlations with C-1 (
δC 54.8), C-2 (
δC 210.0), C-5 (
δC 31.2) and C-6 (
δC 141.5) as observed in the HMBC spectrum. In addition, the HMBC correlations of H
3-12 (
δH 1.90) with the carbonyl carbon C-2 and of H
3-13 (
δH 2.07) with the carbonyl carbon C-3 (
δC 208.1) supported the cleavage of the C-2/C-3 bond of the cyclopentane ring. Thus, compound
14 was identified as 2,3-dioxo-15-hydroxy-
seco-laurene.
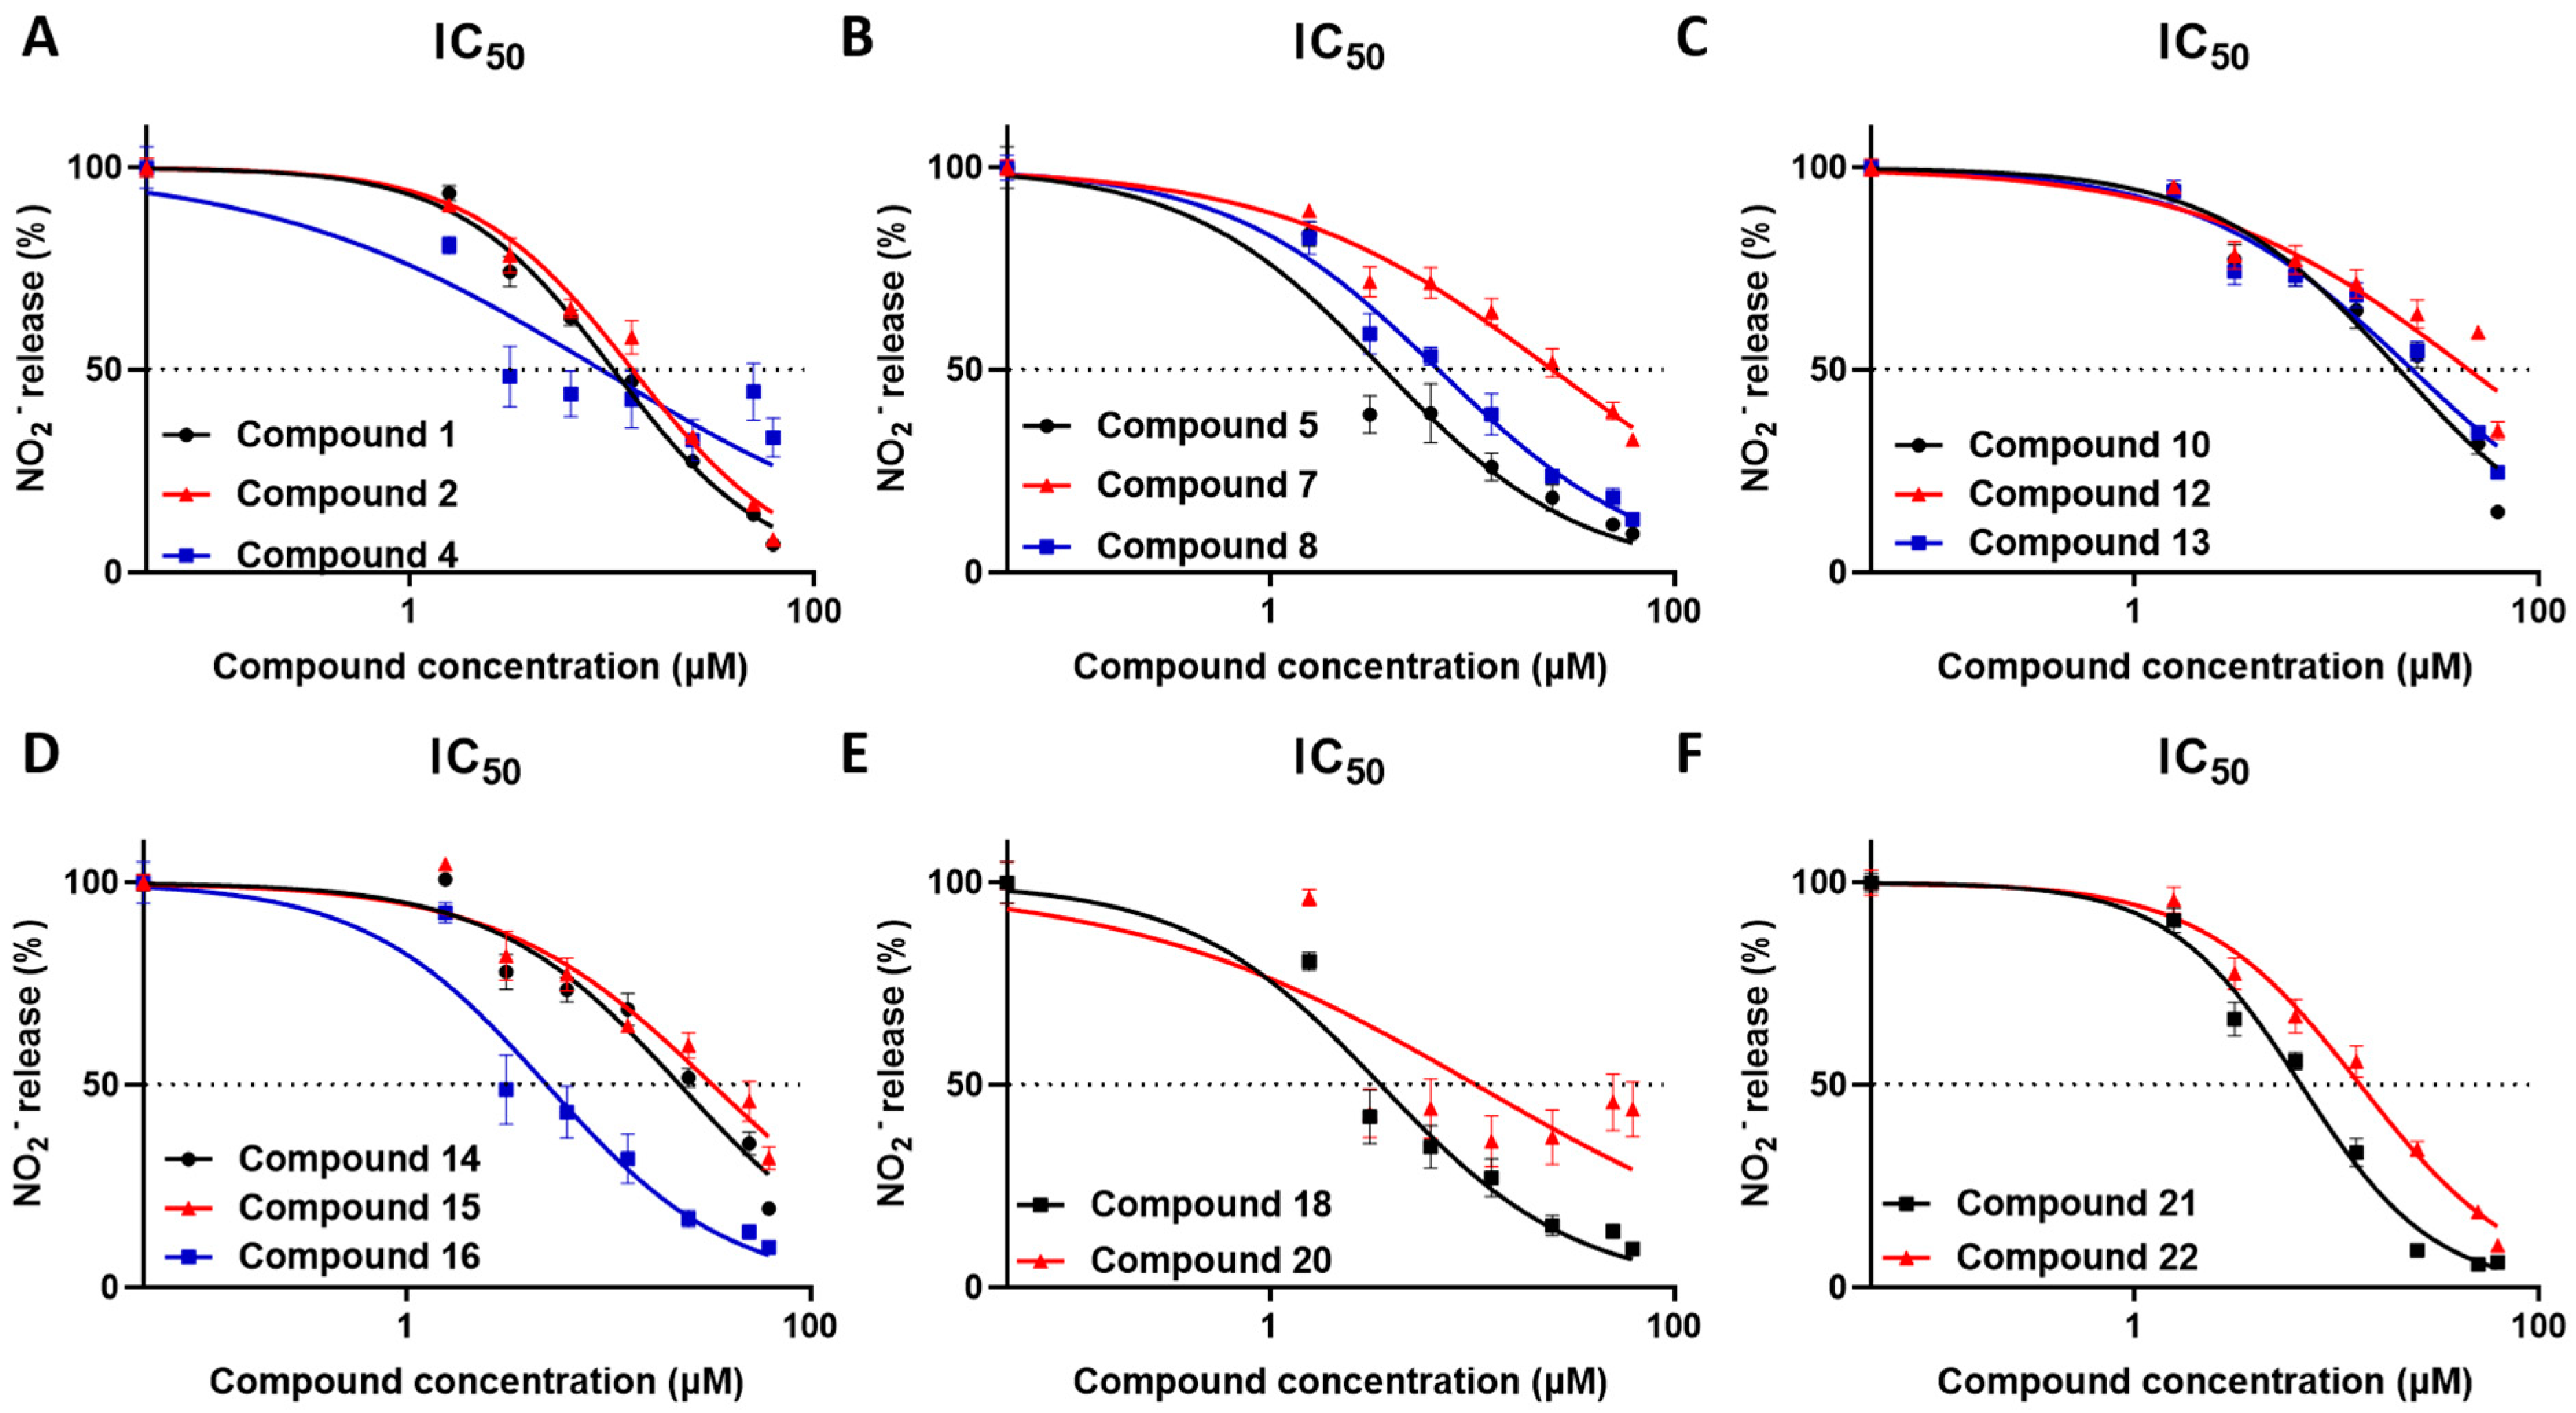
The anti-inflammatory activity of metabolites
1,
2,
4–
8,
10,
12–
16,
18 and
20–
22 was evaluated using the RAW 264.7 macrophage cell line, which has been proven to be a powerful tool for the detection of bioactivity of natural products [
18,
19]. The bioactivity of compounds
3,
9,
11,
17 and
19 was not evaluated since they were either proven unstable or isolated in insufficient amounts. RAW 264.7 macrophages were stimulated with the TLR4 ligand LPS, which triggers a pro-inflammatory signal that induces nitric oxide (NO) production, and simultaneously treated with increasing concentrations of the tested metabolites. The detection of NO was achieved using Griess reaction 48 h following cell activation and was used to determine the IC
50 values. Inhibition of NO production was determined by comparing metabolite-treated cells with cells exposed to the vehicle solvent only (0.1%
v/v Carbowax
TM 400 and 0.01%
v/v ethanol). All tested compounds revealed significant anti-inflammatory activity in the concentration range used (
Table 3,
Figure 4).
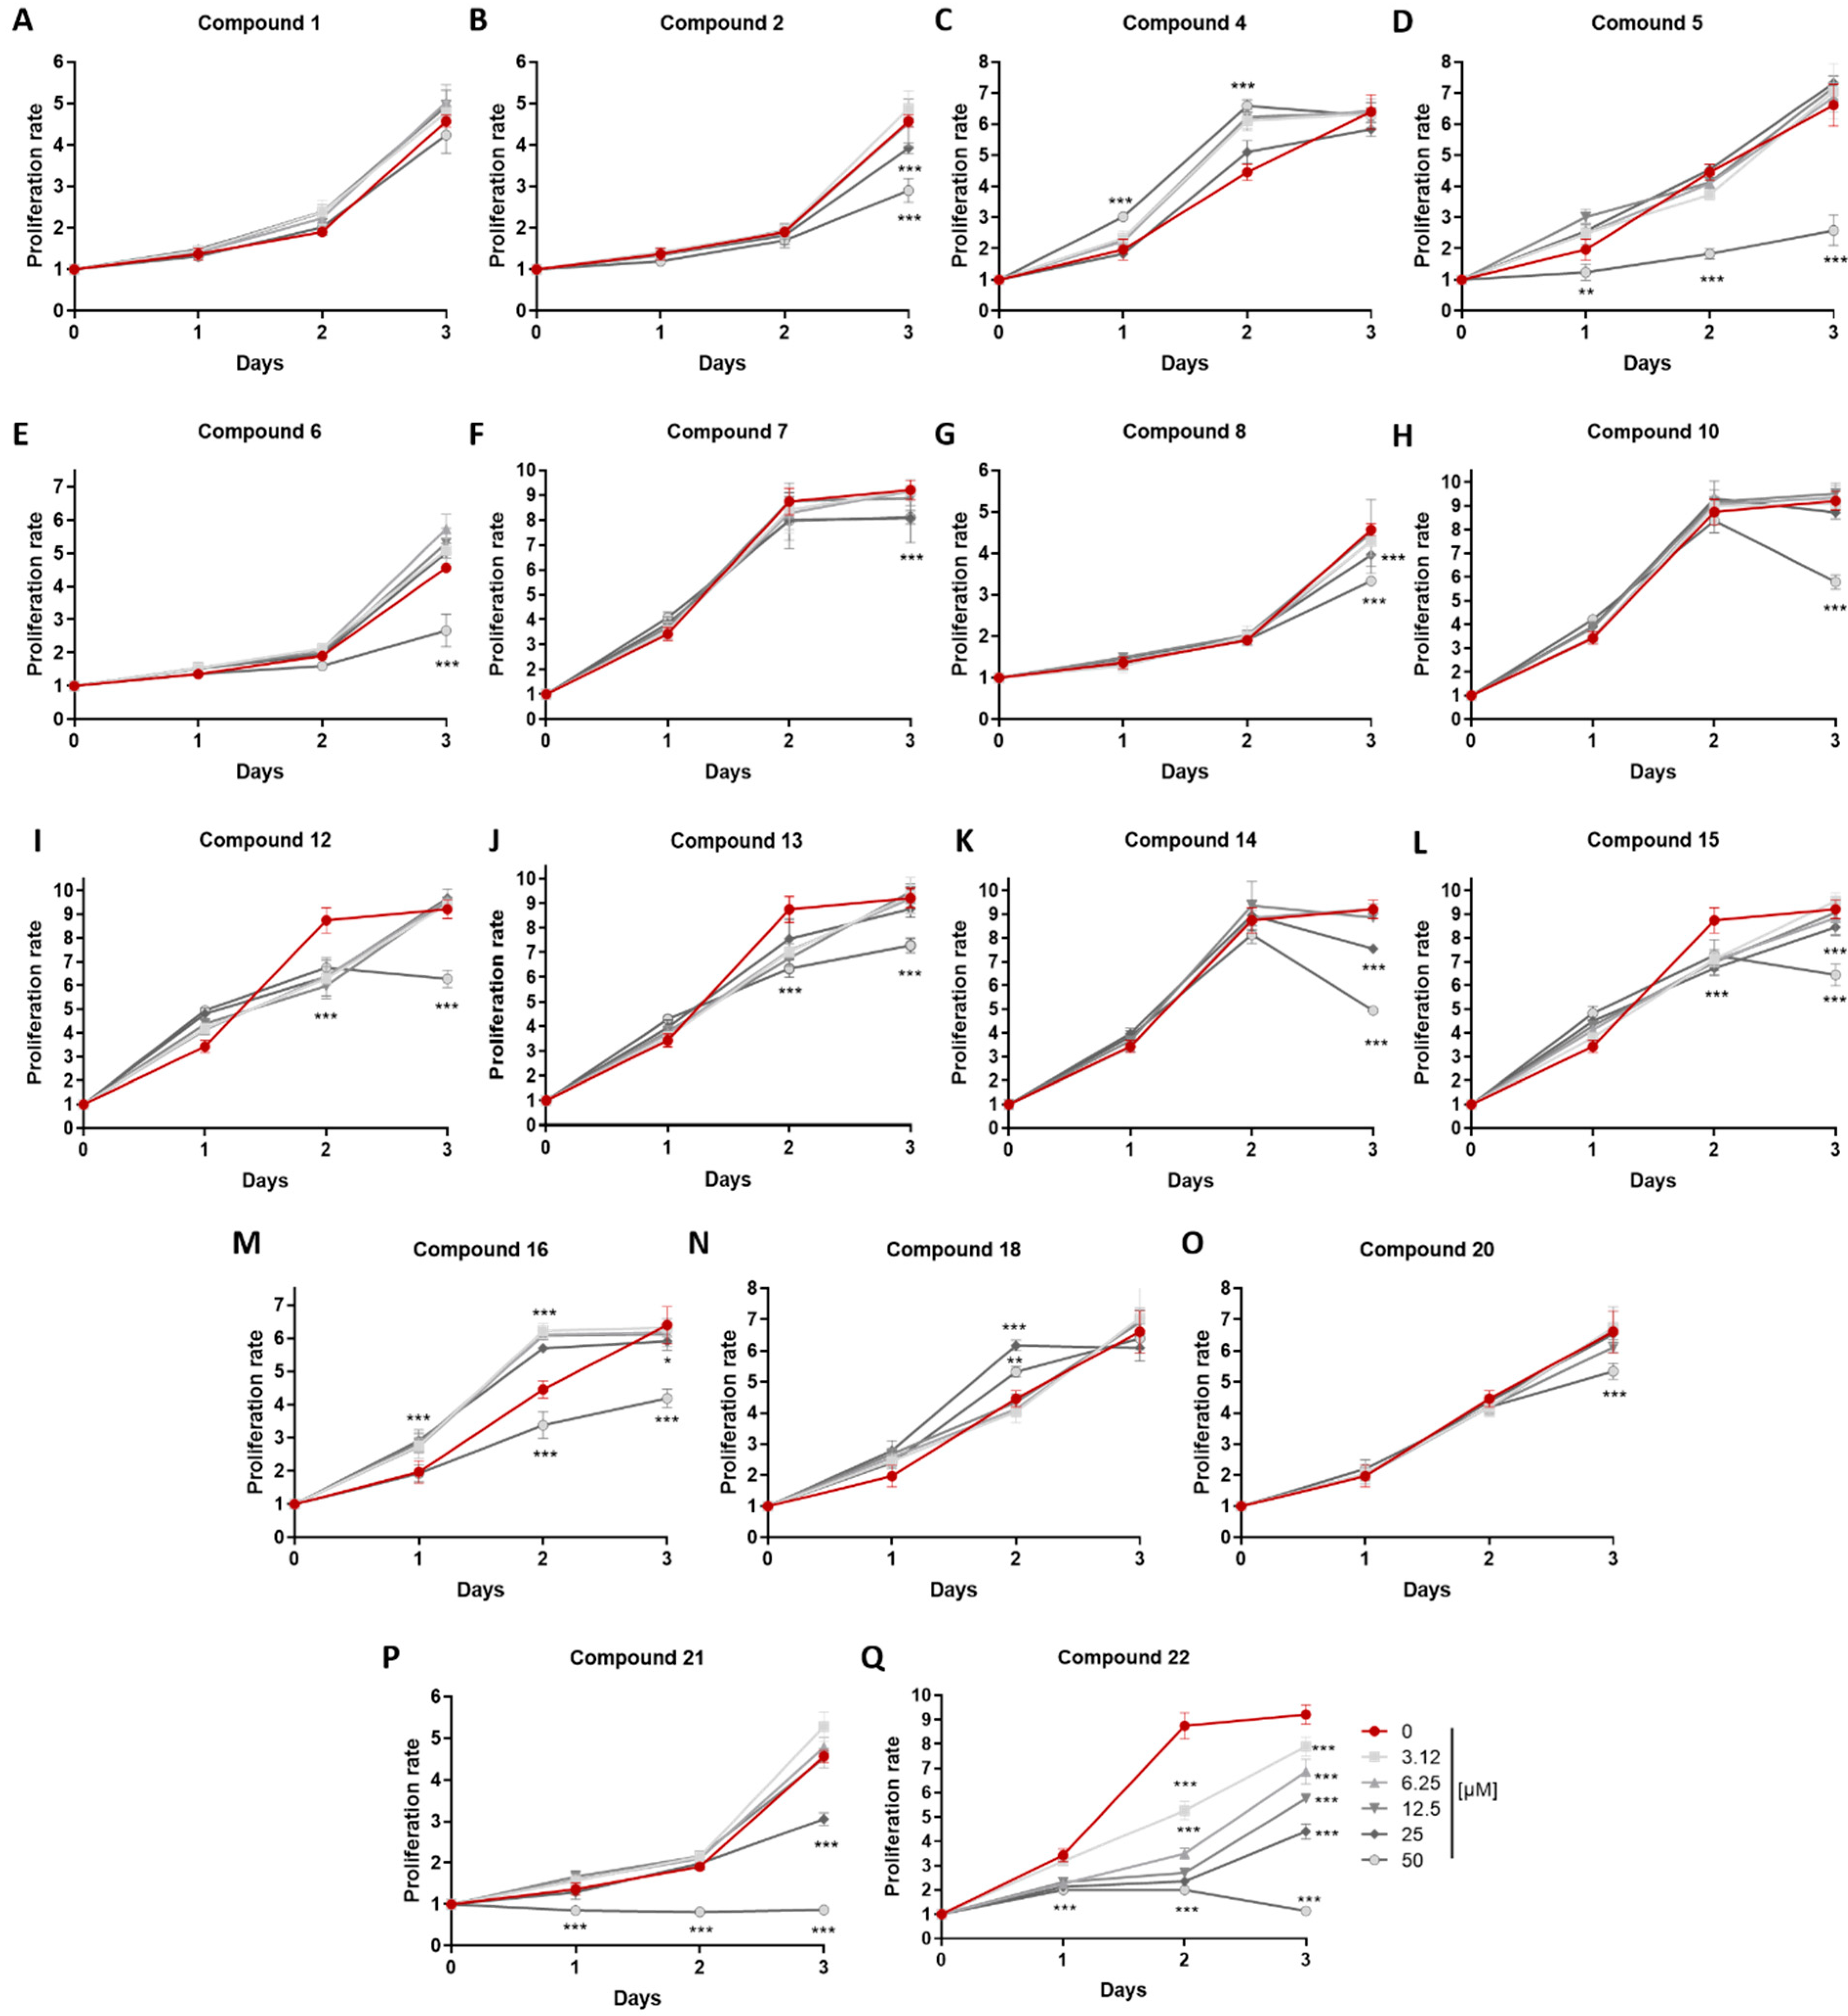
In order to verify that the anti-inflammatory activity observed was not due to a potential cytostatic effect of the metabolites, an MTT assay was performed in cells exposed to increasing concentrations of metabolites
1,
2,
4–
8,
10,
12–
16,
18 and
20–
22 for 24, 48 and 72 h (
Table 3,
Figure 5). The time point that the cytostatic activity was observed reflected its potency since cytotoxicity is a cumulative process.
Compounds 1 and 2 exhibited IC50 values of 10.17 and 12.66 μΜ, respectively, and although they differ only in the configuration at C-13, compound 1 did not show any cytostatic effect, in contrast to compound 2 exhibiting cytostatic activity above 25 μΜ. Compound 4 displayed an IC50 value of 8.91 μΜ with no significant cytostatic activity at the tested concentration. Interestingly, compound 5 exhibited significant anti-inflammatory activity with an IC50 value of 3.69 μΜ and cytostatic activity above 50 μΜ, further supporting its strong anti-inflammatory action. Although displaying structural similarities, compound 6 exhibited significant NO reduction only at 62.5 μΜ, which could be attributed to its cytostatic effect, whereas compounds 7 and 8 showed IC50 values of 25.27 and 6.92 μΜ, respectively, as well as cytostatic activity above 25 μΜ. Compounds 10 and 12–15 exhibited significant anti-inflammatory activity, but in rather high concentrations, with IC50 values of 20.46, 45.24, 23.81, 22.73 and 33.09 μΜ, respectively, and cytostatic activity above 50 μΜ for compounds 10, 12 and 13, and above 25 μΜ for compounds 14 and 15. Importantly, compound 16 displayed substantial anti-inflammatory activity with an IC50 value of 4.97 μΜ and cytostatic effect at concentrations over 25 μΜ. Compound 18 exhibited the most potent anti-inflammatory activity with an IC50 value of 3.55 μΜ, and it is noteworthy that no significant cytostatic activity was observed at any of the tested concentrations. Compounds 20–22 showed anti-inflammatory action with IC50 values of 10.51, 6.66 and 13.19 μΜ, respectively, and cytostatic activity above 50, 25 and 3.125 μΜ, respectively. It can be inferred that the anti-inflammatory activity of compound 22 is mainly due to its strong cytostatic activity. Overall, compounds that displayed minimal or no cytostatic activity and had the capacity to inhibit NO production have the potential to serve as lead molecules for novel anti-inflammatory compounds. NO is a central mediator of inflammation and its inhibition is a hallmark of anti-inflammatory activity; yet, further studies are required to determine the mechanisms of action, including evaluating their action on inflammatory cytokine production in macrophages and, furthermore, in in vivo models of inflammatory diseases.
3. Materials and Methods
3.1. General Experimental Procedures
Optical rotations were measured on a Krüss model P3000 polarimeter (A. KRÜSS Optronic GmbH, Hamburg, Germany) with a 0.5 dm cell. UV spectra were recorded on a Shimadzu UV-1900i UV-Vis spectrophotometer (Shimadzu Europa GmbH, Duisburg, Germany). IR spectra were recorded on a Bruker Alpha II FTIR spectrometer (Bruker Optik GmbH, Ettlingen, Germany). NMR spectra were recorded on Bruker DRX 400, Avance NEO 950 (Bruker BioSpin GmbH, Rheinstetten, Germany) and Varian 600 (Varian, Inc., Palo Alto, CA, USA) spectrometers. Chemical shifts are provided on the δ (ppm) scale with reference to the solvent signals. The 2D NMR experiments (HSQC, HMBC, COSY, NOESY) were performed using standard Bruker or Varian pulse sequences. Low-resolution EI mass spectra were measured on an Agilent Technologies 5977B mass spectrometer (Agilent Technologies, Santa Clara, CA, USA) or a Thermo Electron Corporation DSQ mass spectrometer (Thermo Fisher Scientific, Bremen, Germany). High-resolution APCI or ESI mass spectra were measured on a LTQ Orbitrap Velos mass spectrometer (Thermo Fisher Scientific, Bremen, Germany). Column chromatography separations were performed with Kieselgel 60 (Merck, Darmstadt, Germany). HPLC separations were conducted on a Waters 600 liquid chromatography pump equipped with a Waters 410 differential refractometer (Waters Corporation, Milford, MA, USA) or an Agilent 1100 series liquid chromatography pump equipped with an Agilent 1100 series refractive index detector, using (a) an Econosphere Silica 10µ (Grace, 25 cm × 10 mm i.d) column or (b) a Supelcosil Si (Supelco, 25 cm × 10 mm i.d). TLC were performed with Kieselgel 60 F254 aluminum plates (Merck, Darmstadt, Germany) and spots were detected after spraying with a 25% H2SO4 in MeOH reagent and heating at 100 °C for 1 min.
3.2. Biological Material
The biomass of L. majuscula was hand-picked by SCUBA diving at a depth of 10 m from the reefs near the National Institute of Oceanography and Fisheries (NOIF), Hurghada, Egypt (GPS coordinates 27°17′06″ N, 33°46′24″ E), in July 2016, and transported to the laboratory in ice chests, where they were stored at −20 °C until analyzed. A voucher specimen has been deposited at the Herbarium of NOIF in Hurghada and the Herbarium of the Section of Pharmacognosy and Chemistry of Natural Products, Department of Pharmacy, National and Kapodistrian University of Athens (ATPH/MP0548).
3.3. Extraction and Isolation
Fresh algal tissues (0.8 kg) were exhaustively extracted with mixtures of CH2Cl2/MeOH (1:2, 1:1 and 1:0) at room temperature. Evaporation of the solvents under vacuum yielded a dark green oily residue (9 g). The residue was subjected to vacuum column chromatography on silica gel, using a step gradient elution system of increasing polarity (cHex with increasing amounts of EtOAc and, finally, MeOH), to yield 14 fractions (A–N). Fraction B (10% EtOAc in cHex, 222.4 mg) was further fractionated by normal-phase gravity column chromatography, using cHex with increasing amounts of EtOAc, to afford 8 fractions (B1–B8), among which one was identified as 16 (76.7 mg). Fraction B1 (1% EtOAc in cHex, 9.7 mg) was fractionated by vacuum column chromatography on silica gel using as eluent cHex with increasing amounts of EtOAc to yield 4 fractions (B1a–B1d). Fraction B1a (100% cHex, 3.5 mg) was further purified by normal-phase HPLC using nHex (100%) as the mobile phase to yield 17 (0.7 mg) and 19 (2.1 mg). Fraction B6 was submitted to further purification by vacuum column chromatography on silica gel using cHex with increasing amounts of EtOAc as eluent to yield 5 fractions (B6a-B6e). Fraction B6b (10% EtOAc in cHex, 23.3 mg) was purified by normal-phase HPLC using cHex/EtOAc (96:4) as eluent to afford 18 (2.1 mg). Fraction C (15% EtOAc in cHex, 1.0 g) was fractionated by gravity column chromatography using cHex with increasing amounts of EtOAc to yield 9 fractions (C1–C9). Fraction C1 (3% EtOAc in cHex, 354.2 mg) was further fractionated by vacuum column chromatography on silica gel with nHex/EtOAc as the mobile phase to yield 3 fractions (C1a–C1c). Fraction C1a (1% EtOAc in nHex, 74.8 mg) was purified by normal-phase HPLC using nHex/EtOAc (98:2) as eluent to afford 9 (3.3 mg) and 22 (3.8 mg). Fraction C2 (5% EtOAc in cHex, 242.6 mg) was submitted to normal-phase HPLC using cHex/EtOAc (96:4) as eluent to yield 4 (29.8 mg). Fraction C3 (6% EtOAc in cHex, 124.4 mg) was fractionated by vacuum column chromatography on silica gel using cHex with increasing amounts of EtOAc as mobile phase to yield 4 fractions (C3a–C3d). Fractions C3b and C3c (5 and 10% EtOAc in cHex, 5 and 80 mg, respectively) were pooled together and subjected to further purification by normal-phase HPLC using cHex/EtOAc (96:4) as the mobile phase to afford 1 (7.6 mg), 2 (7.2 mg), 3 (19.5 mg) and 4 (12.3 mg). Fraction C4 (7% EtOAc in cHex, 108.6 mg) was purified by normal-phase HPLC using cHex/EtOAc (96:4) as the mobile phase to afford 4 (13.9 mg), 5 (3.6 mg) and 20 (2.6 mg). Fraction C5 (8% EtOAc in cHex, 62.3 mg) was subjected to further fractionation by vacuum column chromatography on silica gel using cHex with increasing amounts of EtOAc as eluent to yield 6 fractions (C5a–C5f). Fraction C5d (10% EtOAc in cHex, 20.4 mg) was subjected to normal-phase HPLC using cHex/EtOAc (90:10) and, subsequently, cHex/EtOAc (93:7) as eluent to yield 15 (2.0 mg). Fraction C5e was subjected to further purification by normal-phase HPLC analysis using cHex/EtOAc (90:10) as the mobile phase to afford 21 (0.8 mg). Fractions D and E (20 and 30% EtOAc in cHex, 591 and 595 mg, respectively), were pooled together and fractionated by gravity column chromatography using mixtures of cHex/EtOAc of increasing polarity as the mobile phase to yield 17 fractions (D1–D17). Fractions D2 and D3 (5% EtOAc in cHex, 69.4 and 8.7 mg, respectively) were pooled together and were further fractionated by vacuum column chromatography on silica gel using cHex with increasing amounts of EtOAc as eluent to afford 6 fractions (D2a–D2f). Fraction D2a (0–2% EtOAc in cHex, 22.9 mg) was purified by normal-phase HPLC using nHex (100%) as the mobile phase to yield 6 (5.2 mg) and 8 (3.4 mg). Fraction D2b (2% EtOAc in cHex, 3.8 mg) was subjected to normal phase-HPLC using cHex/EtOAc (96:4) to yield 11 (0.8 mg). Fraction D2c (2% EtOAc in cHex, 5.0 mg) was purified by normal-phase HPLC using cHex/EtOAc (90:10) as eluent to afford 7 (3.3 mg). Fraction D8 (9% EtOAc in cHex, 15.8 mg) was subjected to normal-phase HPLC using cHex/EtOAc (90:10) as the mobile phase to yield 21 (1 mg). Fractions D11 and D12 (12–15% EtOAc in cHex, 233.1 and 104.2 mg, respectively) were pooled together and further subjected to gravity column chromatography with mixtures of cHex/EtOAc of increasing polarity to afford 8 fractions (D11a–D11h). Fraction D11g (20% EtOAc in cHex, 9.9 mg) was subjected to normal-phase HPLC using cHex/EtOAc (80:20) as the mobile phase to yield 13 (3.0 mg). Fraction D11h (100% EtOAc, 95.2 mg) was further fractionated by vacuum column chromatography on silica gel using mixtures of cHex/EtOAc of increasing polarity to yield 4 fractions (D11h1–D11h4). Fraction D11h2 (20% EtOAc in cHex, 12.7 mg) was fractionated by normal-phase HPLC using cHex/EtOAc (75:25 and, subsequently, 82:18) as the mobile phase to afford 10 (1.5 mg). Fraction D11h3 (20% EtOAc in cHex, 10.0 mg) was purified by normal-phase HPLC using cHex/EtOAc (75:25) as eluent to yield 10 (1.2 mg). Fraction D11h4 (100% EtOAc, 33.0 mg) was further fractionated by vacuum column chromatography on silica gel using cHex/EtOAc mixtures of increasing polarity as eluent to afford 3 fractions (D11h4a–D11h4c). Fraction D11h4a was subjected to normal-phase HPLC using cHex/EtOAc (65:35) as the mobile phase to yield 12 (0.6 mg). Fraction D11h4b was purified by normal-phase HPLC using cHex/EtOAc (60:40) as eluent to afford 12 (1.1) and 14 (0.8 mg).
Maneonene F (
1): white amorphous solid;
+ 0.98 (
c 0.51, CHCl
3); UV (CHCl
3)
λmax (log
ε) 242.0 (3.75) nm; IR (thin film)
νmax 3296, 2974, 1461, 1283, 1160, 1034 cm
−1;
1H and
13C NMR data, see
Table 1; HR-APCIMS
m/z 375.0354 [M + H]
+ (calcd. for C
16H
2179Br
35ClO
3, 375.0357).
Maneonene G (
2): white amorphous solid;
− 5.49 (
c 0.55, CHCl
3); UV (CHCl
3)
λmax (log
ε) 242.0 (3.73); IR (thin film)
νmax 3290, 2974, 1460, 1075, 1020 cm
−1;
1H and
13C NMR data, see
Table 1; HR-APCIMS
m/z 375.0355 [M + H]
+ (calcd. for C
16H
2179Br
35ClO
3, 375.0357).
Maneonene H (
3): white amorphous solid;
1H and
13C NMR data, see
Table 1; HR-APCIMS
m/z 375.0356 [M + H]
+ (calcd. for C
16H
2179Br
35ClO
3, 375.0357).
(3
Z,7
S*,9
R*,10
S*)-9-Acetoxy-6-bromo-7,10-epoxypentadec-3-en-1-yne (
5): colorless oil;
+ 1.88 (
c 0.27, CHCl
3); UV (CHCl
3)
λmax (log
ε) 212.0 (4.32); IR (thin film)
νmax 3436, 3293, 2928, 1735, 1379, 1245, 1090, 1050 cm
−1;
1H and
13C NMR data, see
Table 1; HR-ESIMS
m/z 357.1057, 359.1039 [M + H]
+ (50:50) (calcd. for C
17H
2679BrO
3, 357.1065, C
17H
2681BrO
3, 359.1045).
4-Oxoisolaurene (
7): colorless oil;
+ 9.09 (
c 0.22, CHCl
3); UV (CHCl
3)
λmax (log
ε) 211.0 (3.92); IR (thin film)
νmax 2922, 1703, 1648, 1508 cm
−1;
1H and
13C NMR data, see
Table 2; HR-ESIMS
m/z 215.1438 [M + H]
+ (calcd. for C
15H
19O, 215.1436).
15-Bromoisolaurene (
8): colorless oil;
+10.0 (
c 0.20, CHCl
3); UV (CHCl
3)
λmax (log
ε) 211.0 (4.24); IR (thin film)
νmax 2960, 2919, 2849, 1508, 1461, 1066 cm
−1;
1H and
13C NMR data, see
Table 2; HR-APCIMS
m/z 277.0586, 279.0565 [M − H]
− (51: 49) (calcd. for C
15H
1879Br, 277.0597, C
15H
1881Br, 279.0577).
(1
S*,2
S*,3
R*)-2,3-Epoxy-15-hydroxydihydroisolaurene (
10): white amorphous solid;
+ 5.0 (
c 0.10, CHCl
3); UV (MeOH)
λmax (log
ε) 220.0 (3.81); IR (thin film)
νmax 3427, 2966, 2931, 1513, 1455, 1382, 1505, 1017, 818 cm
−1;
1H and
13C NMR data, see
Table 2; HR-ESIMS
m/z 233.1532 [M + H]
+ (calcd. for C
15H
21O
2, 233.1542).
(1
S*,2
S*,3
R*)-2,3-Epoxydihydroisolaurene (
11): colorless oil;
1H and
13C NMR data, see
Table 2; LR-EIMS
m/z 216 [M]
+.
2,3-Dioxo-15-hydroxy-
seco-laurene (
14): colorless oil;
+ 9.38 (
c 0.05, CHCl
3); UV (MeOH)
λmax (log
ε) 210.0 (3.71); IR (thin film)
νmax 3428, 2929, 2853, 1708, 1355, 1013 cm
−1;
1H and
13C NMR data, see
Table 2; HR-ESIMS
m/z 249.1487 [M + H]
+ (calcd. for C
15H
21O
3, 249.1491).
3.4. Single-Crystal X-ray Diffraction Analysis of Compounds 1 and 2
Compounds
1 (maneonene F) and
2 (maneonene G) were crystallized by slow evaporation of saturated solutions of MeOH, in both cases as colorless plates. Single crystal X-ray diffraction data were collected using a dual source Bruker D8-Venture diffractometer equipped with four-circle kappa goniometer, performing φ and ω scans to fill the Ewald sphere, and a Photon-III CMOS area detector at 100 K using an ImS Diamond Mo/Kα radiation source. Control of data collection, data processing and reduction were performed using the APEX 4 software suite. Data for both
1 and
2 were collected to a resolution of 0.7 Å. A multi-scan absorption correction was applied in both cases [
20]. Data solution and model refinement were performed using Olex2-1.5 and all software packages within [
21]. Collection and refinement details for compounds
1 and
2 are provided in
Table S2.
3.5. Cell Culture Maintenance and Treatments
Mouse macrophage RAW 264.7 cell line was cultured in DMEM medium (cat. # 21885-025, Gibco) supplemented with 10% v/v heat-inactivated fetal bovine serum (cat. # 10270-106, Gibco) and 1% v/v penicillin-streptomycin (cat. # 15070-063, Gibco). Cells were grown in stable conditions, 37 °C and 5% CO2, in a CO2 cell culture sterile incubator. In compound treatments, each compound tested was diluted in CarbowaxTM 400 + 10% abs. ethanol (E/0650DF/17, Fisher chemical), serving also as the control solvent. The final concentration of ethanol in cell culture was 0.01% v/v and of CarbowaxTM 400 0.1% v/v independently of the compound dilution prepared. Macrophage activation was performed using 100 ng/mL LPS (L2630, Sigma) and, in the case of compound-treated cells, macrophages were pre-treated for 1 h with the respective compounds before LPS stimulation.
3.6. Measurement of Nitric Oxide
30 × 104 RAW 264.7 mouse macrophages per sample were cultured overnight in 24-well plates. The following day, cells were pre-treated for 1 h with the respective compound concentration and then activated using LPS (100 ng/mL) for 48 h. The amount of nitrite, an oxidative product of NO, released in each culture supernatant was measured using Griess reaction. Accordingly, 50 µL of sulfanilamide solution (1% sulfanilamide in 5% H3PO4) was added to 50 µL of cell culture supernatant and the mix was incubated for 5 min at room temperature. Then, 50 µL of NED solution (0.1% N-1-napthylethylenediamine dihydrochlorite in H2O) was added and the absorbance was measured at 540 nm using an automated microplate reader (Infinite 200 PRO, Tecan). All incubations were performed in the dark and the nitrite concentration was estimated using a sodium nitrite standard curve.
3.7. MTT Assay
5 × 10³ RAW 264.7 mouse macrophages per sample were seeded in 96-well plates (one plate per measurement) and cultured overnight. Cells were treated with the respective compound concentration and incubated for 24, 48 or 72 h. The number of cells was measured prior to treatment and used as normalization control. Thiazolyl Blue Tetrazolium Bromide (MTT) (A2231.001, Applichem) was added to the cells in a final concentration of 500 µg/mL and then cells were incubated at 37 °C plus 5% CO2 for 4 h. The supernatant was removed, and cells were lysed in a mix of 100 μL of isopropanol with 0.4% HCl. The absorbance of each sample was measured using an automated microplate reader (Infinite 200 PRO, Tecan) at 600 nm. The average OD of each treated sample was normalized to the OD of the control sample.
3.8. Statistical Analysis
All data are presented as mean ± SEM. Statistical analysis was performed using Graphpad Prism 7.0. A two-way ANOVA test was performed for each treated sample to control. Differences with a p value < 0.05 are considered significant (* indicates p < 0.05, ** indicates p < 0.01, *** indicates p < 0.001).


 ,
, 


