Communication

Recovery of Fatty Acid and Volatile Flavor Compound Composition in Farmed Tiger Puffer (Takifugu rubripes) with a Fish Oil-Finishing Strategy

1
Yellow Sea Fisheries Research Institute, Chinese Academy of Fishery Sciences, Qingdao 266071, China
2
Laboratory for Marine Fisheries Science and Food Production Processes, Qingdao National Laboratory for Marine Science and Technology, Qingdao 266237, China
3
College of Fisheries and Life Sciences, Shanghai Ocean University, Shanghai 201306, China
*
Author to whom correspondence should be addressed.
Mar. Drugs 2023, 21(2), 122; https://doi.org/10.3390/md21020122
Submission received: 30 December 2022 / Revised: 8 February 2023 / Accepted: 10 February 2023 / Published: 13 February 2023
(This article belongs to the Special Issue Fatty Acids from Marine Organisms)

Abstract

:
Booming fish farming results in a relative shortage of fish oil (FO) supply, meaning that alternative oils are increasingly used in fish feeds, which leads to reduction of long-chain polyunsaturated fatty acids (LC-PUFAs) and other relevant changes in fish products. This study investigated the efficacy of an FO-finishing strategy in recovering the muscle quality of farmed tiger puffer. An eight-week feeding trial (growing-out period) was conducted with five experimental diets, in which graded levels (0 (control), 25, 50, 75, and 100%) of added FO were replaced by poultry oil (PO). Following the growing-out period was a four-week FO-finishing period, during which fish in all groups were fed the control diet. Dietary PO significantly decreased the muscle LC-PUFA content, whereas in general, the FO-finishing strategy recovered it to a level comparable with that of the group fed FO continuously. The recovery efficiency of EPA was higher than that of DHA. Dietary PO also led to changes of volatile flavor compounds in the muscle, such as butanol, pentenal, and hexenal, whereas the FO-finishing strategy mitigated the changes. In conclusion, the FO-finishing strategy is promising in recovering the LC-PUFA and volatile-flavor-compound composition in farmed tiger puffer after the feeding of PO-based diets.

Graphical Abstract

1. Introduction

Fish are the main source of n-3 long-chain polyunsaturated fatty acids (LC-PUFAs), mainly 22:6n-3 (docosahexaenoic acid, DHA) and 20:5n-3 (eicosapentaenoic acid, EPA) [1]. Aquaculture satisfies the growing global demand for fish, but also consumes an increasing share of the world’s wild-fish fishery via the use of fishmeal and fish oil (FO) in fish feeds [2]. Therefore, increasing levels of alternative sources such as plant ingredients, livestock processing by-products, and single-cell materials are being used in fish feeds.
Poultry oil (PO) is a by-product of chicken processing and has a relatively low price and a large annual production. With high contents of 16:0, 18:1n-9, and 18:2n-6, PO is a potential lipid source for fish feeds. Partial or complete FO replacement by PO has proved feasible in diets of many aquaculture fish species [3,4,5,6,7,8,9,10,11,12]. It has been widely accepted that the fatty-acid profile of farmed fish generally reflects that of their diets [13]. Therefore, as expected, dietary replacement of FO by PO in the aforementioned studies led to decreased LC-PUFA content in the fish.
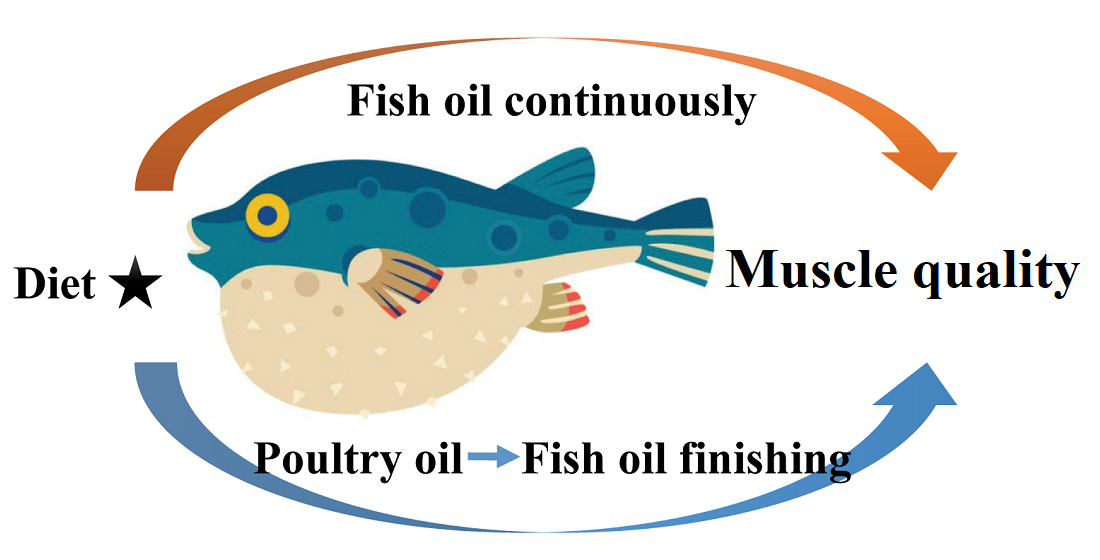
The FO-finishing strategy, namely, re-feeding FO for a period after long-term feeding with alternative oils, has been demonstrated to be an efficient way to restore the LC-PUFA content in farmed fish when alternative oils are used to replace FO in fish feeds [13]. This strategy has been practiced in sunshine bass (Morone chrysops × M. saxatilis) [14] and rainbow trout (Oncorhynchus mykiss) [15] when PO is used in the feeds, but the LC-PUFA recovery efficiency is not consistent between species. Moreover, the effects of dietary PO on the volatile-flavor-compound composition in farmed fish, as well as their response to FO-finishing, have not been studied.
Volatile flavor compounds, which consist of aldehyde, alcohol, acid, ketone, phenol, and heterocyclic compounds containing nitrogen and sulfur, are an important component of fish flavor. Polyunsaturated fatty acids are major substrates of volatile-flavor-compound formation. This has been demonstrated in a number of fish species such as crucian carp (Carassius auratus gibelio), Nile tilapia (Oreochromis niloticus), gilthead seabream (Sparus aurata), tench (Tinca tinca), brown trout (Salmo trutta), turbot (Psetta maxima), rainbow trout, and Senegal sole (Solea senegalensis) [16,17,18,19,20,21,22,23]. These studies also suggest that the dietary lipid source significantly affects the muscle-volatile-flavor-compound composition via changes in fatty-acid metabolism.
With these considerations in mind, the present study was aimed at comprehensively evaluating the efficacy of FO-finishing in recovering LC-PUFA and volatile-flavor-compound composition in farmed tiger puffer, which is an important aquaculture species in Asia [24]. Results of this study will provide new insights into the manipulation of fish-product quality via the feeding strategy.

2. Results

2.1. Fatty-Acid Composition in Muscle and Liver

Fish grew normally during the whole experiment [25]. The average fish body weight at the end of the growing-out period and FO-finishing period was 41.99 g and 82.37 g, respectively. At the end of the growing-out period, with increasing levels of dietary PO, the contents of monounsaturated fatty acid (MUFA) and n-6 PUFA in the muscle significantly (p < 0.05) increased; that of n-3 PUFA significantly decreased; but the content of saturated fatty acid (SFA) was stable (Table 1, Figure 1). In particular, the DHA content decreased from 21.32% TFA in the FO group to 15.06% in the PO group (71% of that in the FO group), and accordingly, the EPA content decreased from 8.32% to 6.18% (74% of that in the FO group). However, the 22:5n-3 content slightly increased from the FO group to the PO group. After FO-finishing, the change in MUFA and PUFA caused by PO was substantially mitigated (Table 2, Figure 1). The DHA and EPA was recovered to be 85% and 94% of that in the control group continuously fed FO, respectively.
The liver fatty-acid composition showed a similar trend in response to PO supplementation, but the change was more drastic compared to the muscle except that the n-6 PUFA was stable among different groups (Table 3, Figure 1). In particular, at the end of the growing-out period, the DHA and EPA in the PO group was only 38% and 46% of that in the FO control group, respectively. Similar mitigating effects of the FO-finishing strategy were observed in the liver (Table 4, Figure 1). After FO-finishing, the DHA and EPA in the PO group was recovered to be 73% and 82% of that in the FO control group, respectively.

2.2. Volatile Flavor Components in the Muscle

From all muscle samples, a total of 61 volatile flavor components were detected, of which 37 were successfully identified (Figure 2 and Figure 3, Table S1). Most of these compounds were small-molecular alcohols, ketones, or aldehydes. At the end of the growing-out period, the PO group had lower abundance of 1-butanol, 3-methyl butanol, 2-pentenal (E) dimer, (E)-2-hexenal monomer, (E)-2-hexenal dimer, 4-heptenal (Z), 3-pentanone, 1-octen-3-ol monomer, 1-octen-3-ol dimer, and octanal dimer, but higher abundance of ethanol, 1-pentanol dimer, and pentanal than the FO control group. At the end of the FO-finishing period, the difference between the PO and FO groups was smaller, but obvious differences in ethanol, 2-pentenal (E) dimer, (E)-2-hexenal monomer, (E)-2-hexenal monomer, (E)-2-hexenal dimer, 4-heptenal (Z), and octanal dimer could still be observed.

2.3. Determination of Muscle Odor with Electronic Nose

In general, the PCA (Figure S1) and LDA (Figure S2) in the muscle-odor analysis with electronic nose showed that at the end of the growing-out period, there was large distance between groups FO and PO, but this distance was substantially shortened at the end of the FO-finishing period.

3. Discussion

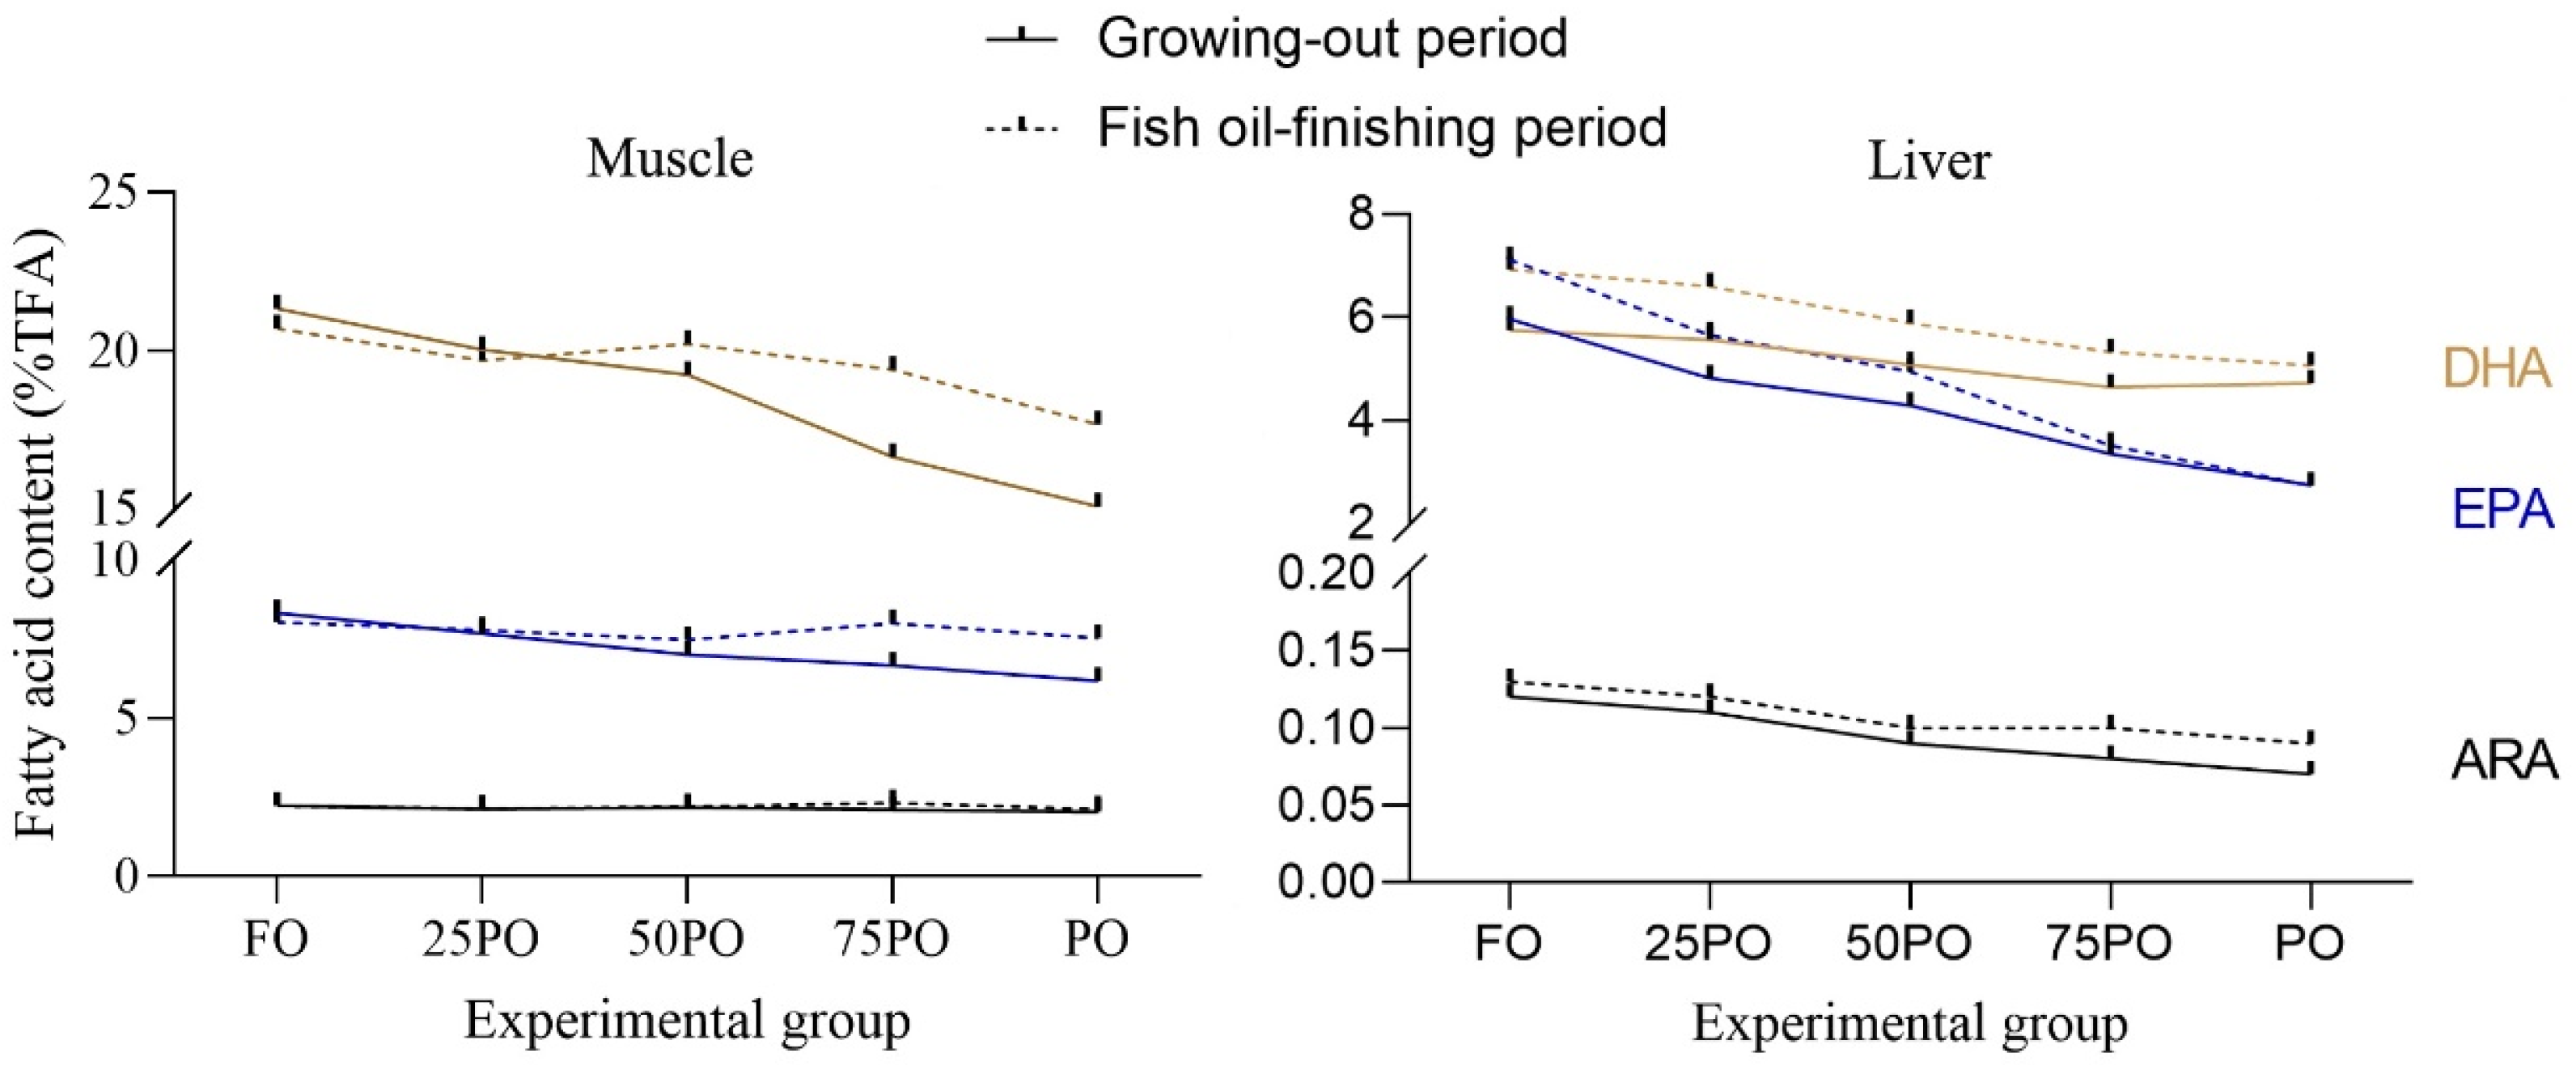
Poultry oil (PO) is increasingly used in fish feeds. However, a major concern of human consumers when fish oil (FO) is replaced by PO is the reduction of LC-PUFA in fish products. In the current study, increasing levels of dietary PO linearly decreased the n-3 LC-PUFA content in fish. At the end of the growing-out period, the muscle DHA content in the PO group was 70.6% of that in the FO control group. This ratio was higher than that observed in other fish species, namely, yellowtail kingfish (Seriola lalandi), 49.7% [6]; largemouth bass (Micropterus salmoides), 56.5% [7]; and European seabass (Dicentrarchus labrax), 30.5% [11]. The discrepancy could be mainly related to the fish species and most importantly, feeding duration. A longer period of PO feeding (12 weeks for largemouth bass; 16 weeks for European seabass) resulted in lower DHA content in fish muscle.
After FO-finishing, the DHA content in group PO was restored to be 85% of that in the FO control group. In most similar studies, an FO-finishing diet was able to restore the DHA content to between 70 and 90% of that in fish fed FO continuously [13]. However, in a study with smaller rainbow trout (initial body weight, 1.4 g), a 28-day FO-finishing period after 80 days of a growing-out feeding trial with PO completely restored the muscle DHA and EPA to levels comparable to those achieved via the continuous use of an FO-based diet [15]. Fish size is a clear determinant in the rate of fatty-acid turnover. Smaller fish have a higher rate of fatty-acid turnover and thus have higher capacity for restoring LC-PUFA. In another study on FO-finishing after PO feeding (50% FO replaced), 56 days of FO-finishing after 140 days of growing-out restored the muscle DHA, EPA, and ARA in sunshine bass to be 94%, 92%, and 100% of that in the FO control group, respectively [14]. These ratios were higher than those in the present study. It is clear that the duration of the finishing period is one of the most important factors influencing the final muscle LC-PUFA content. A longer finishing period resulted in higher restoration ratio of muscle LC-PUFA.
There are many studies regarding the use of an FO-finishing strategy after feeding diets based on other alternative oils such as rapeseed oil, palm oil, soybean oil, linseed oil, coconut oil, sunflower oil, and olive oil [14,26,27,28,29,30]. Overall, the effect of alternative oil type on the efficiency of LC-PUFA recovery during the subsequent FO-finishing period appears to be complicated and species-specific. Relevant results in farmed fish species have been summarized in a recent review article [13]. In other marine fish species such as gilthead sea bream (Sparus aurata) and European sea bass, differences were observed in the degree of LC-PUFA recovery during the FO-finishing period when different alternative lipid sources such as rapeseed oil, soybean oil, and linseed oil were previously fed to fish [26,27,28]. Specific to tiger puffer, a previous study revealed that washing-out the PO in the muscle was easier compared to soybean oil, but more difficult compared to beef tallow [24]. In the liver, however, washing-out the PO was easier compared to rapeseed oil, but also more difficult compared to beef tallow. In another study regarding washing-out PO, it was found that washing-out the PO in sunshine bass was more difficult compared to washing-out grape oil and linseed oil [14]. The LC-PUFA restoration efficiency could be closely related to the efficiency of washing-out the characteristic fatty acids in different terrestrially-sourced oils. However, to date, no clear conclusion has been made by previous studies regarding the difference in washing-out efficiency among different individual fatty acids or different fatty-acid types. In addition, different terrestrially-sourced oils may lead to different lipid deposition levels in fish body, which could also affect the LC-PUFA restoration efficiency.
For tiger puffer, liver is also an edible part, particularly considering that nowadays tetrodotoxin is nearly undetectable in farmed fish [31]. Therefore, the restoration of LC-PUFA in the liver should also not be neglected when the FO-finishing strategy is practiced. Compared to muscle, the LC-PUFA restoration efficiency in the liver after FO-finishing was lower. This may be due to the fact that a limited number of fatty acids, such as DHA, EPA, and 16:0, tend to be selectively incorporated into muscle which is rich in polar lipids [32]. In other tissues with conservative fatty-acid profiles such as the neural tissue, in which LC-PUFA is vital for chemical communication/homeostasis, the LC-PUFA restoration efficiency could also be high, although no tissues other than muscle and liver were analyzed in this study.
Regarding the difference in efficiency of LC-PUFA restoration among individual fatty acids, EPA showed a higher efficiency than DHA in both muscle and liver of tiger puffer. This was different from most other similar studies, which showed that DHA is generally more completely restored, compared to EPA [13]. The present result could be related to the fact that the EPA content in tiger puffer is much lower than DHA, and thus is easier to be restored.
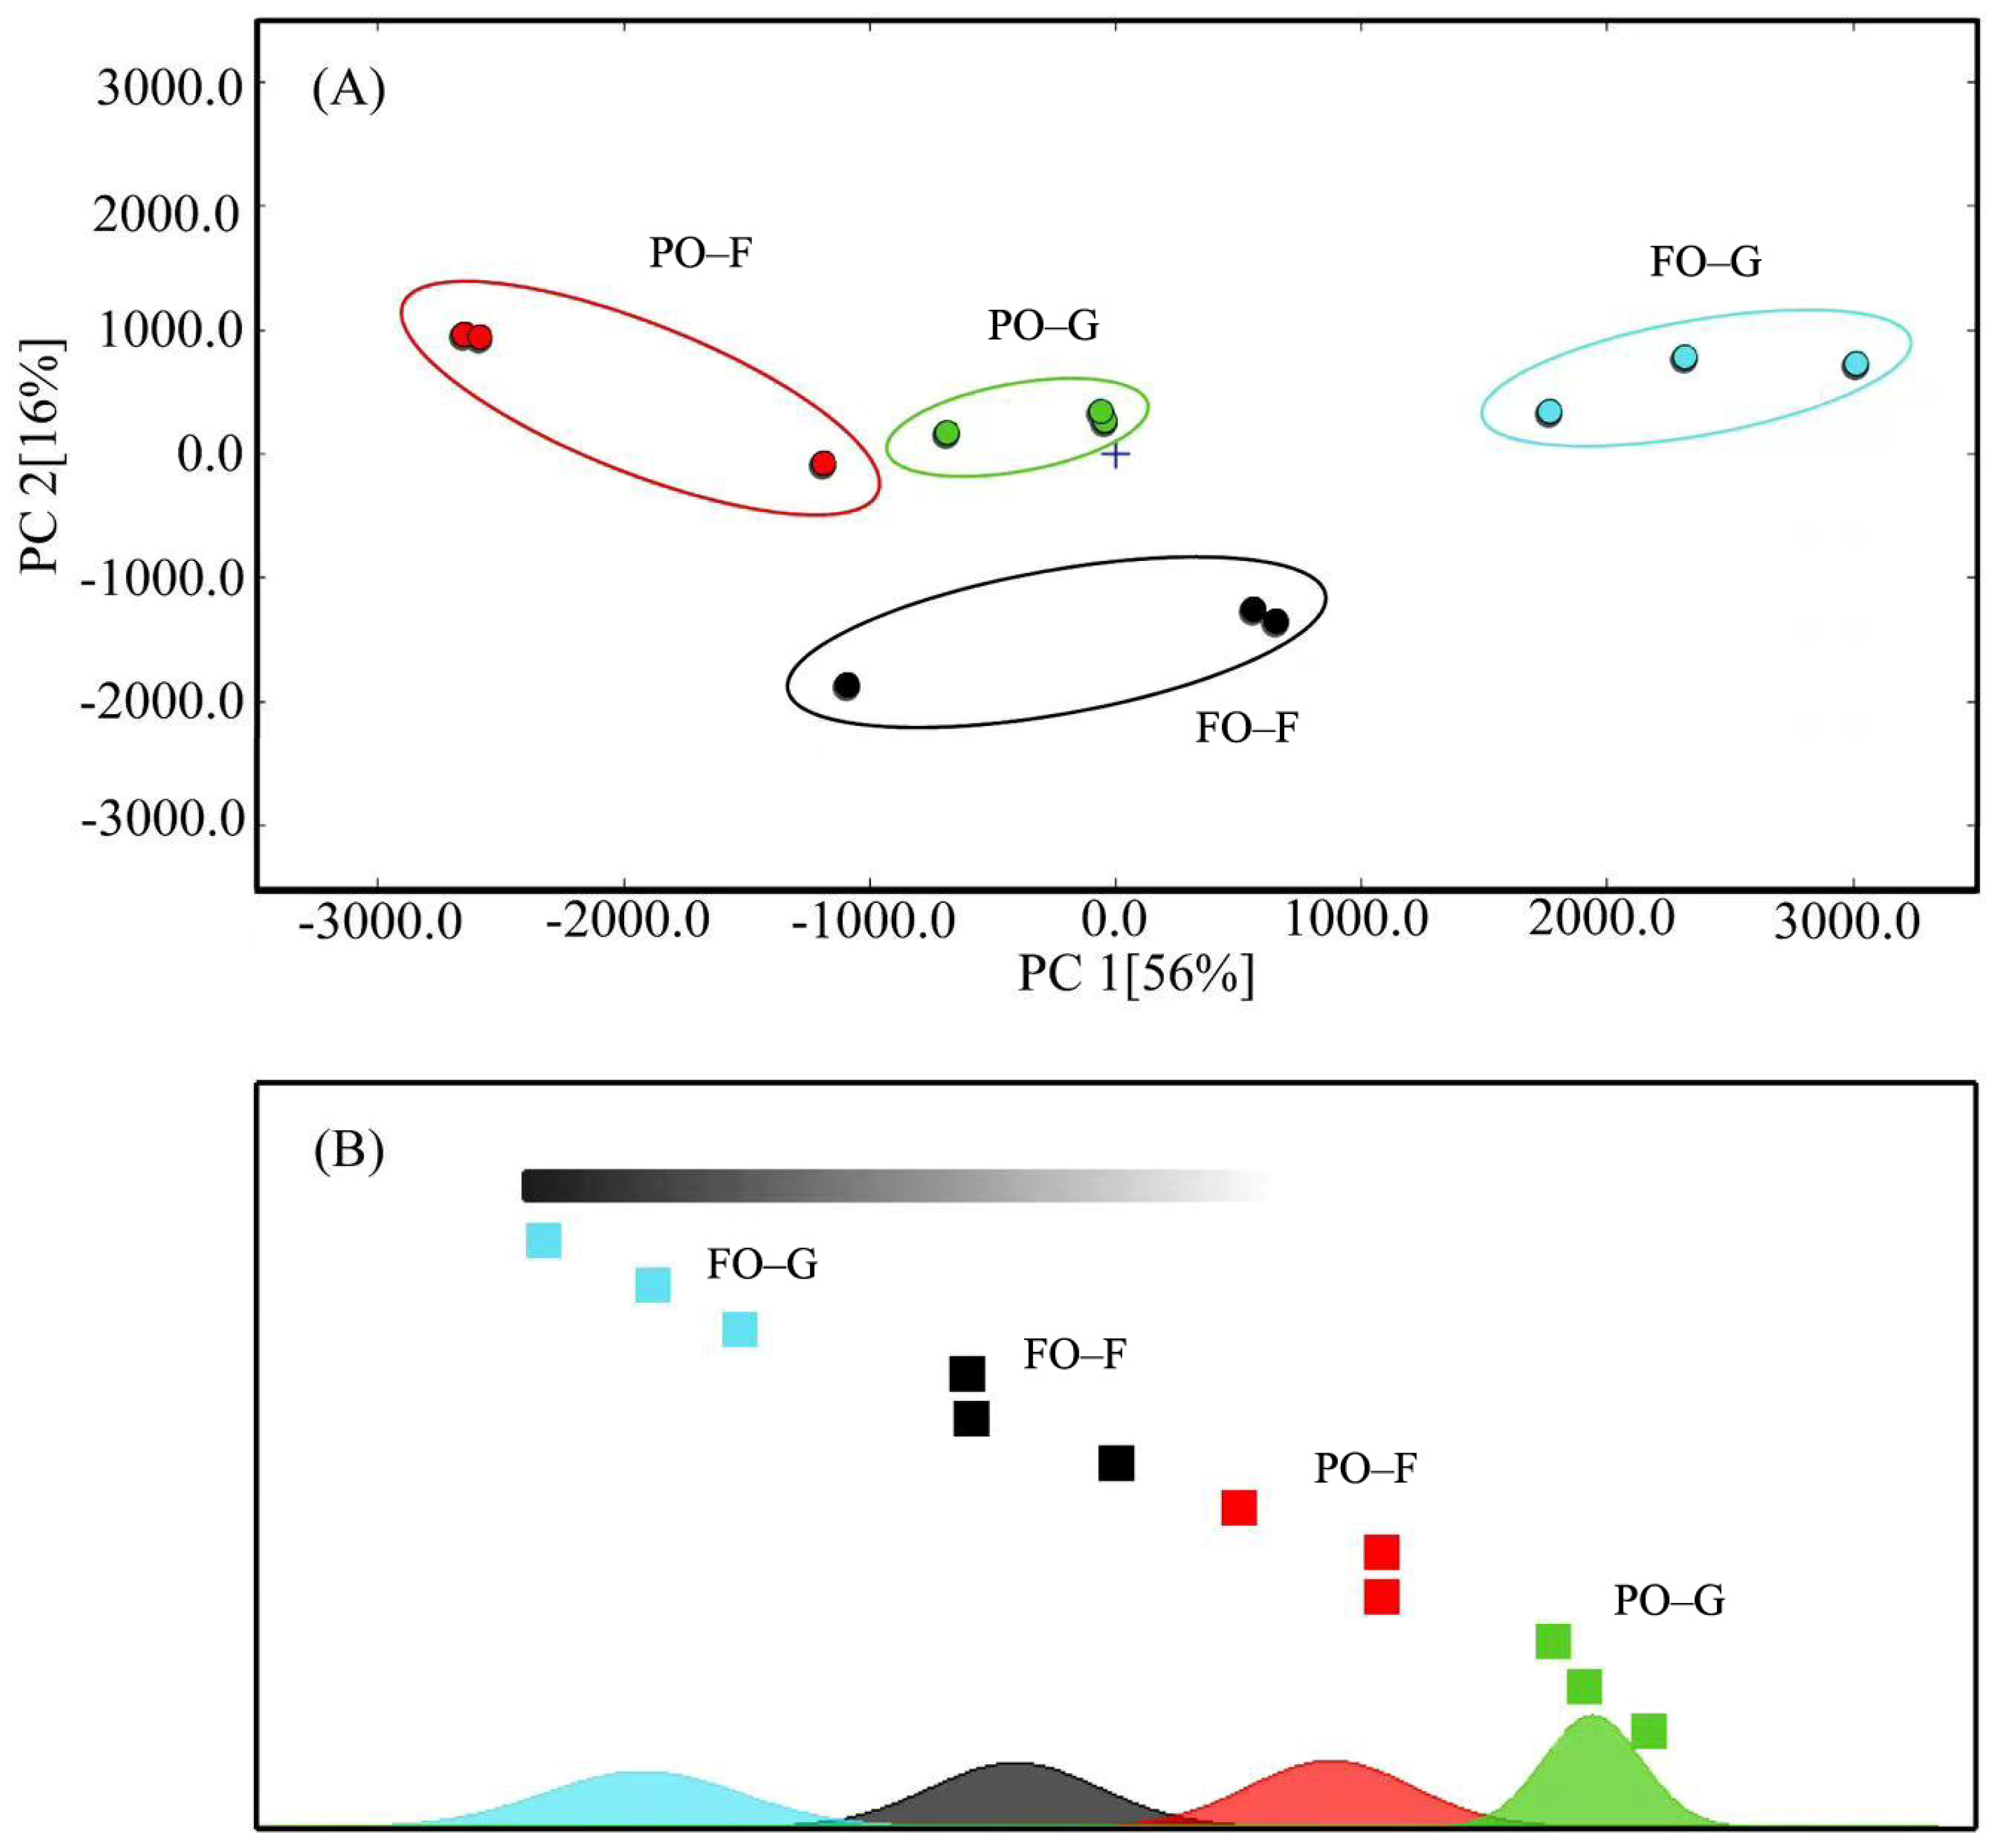
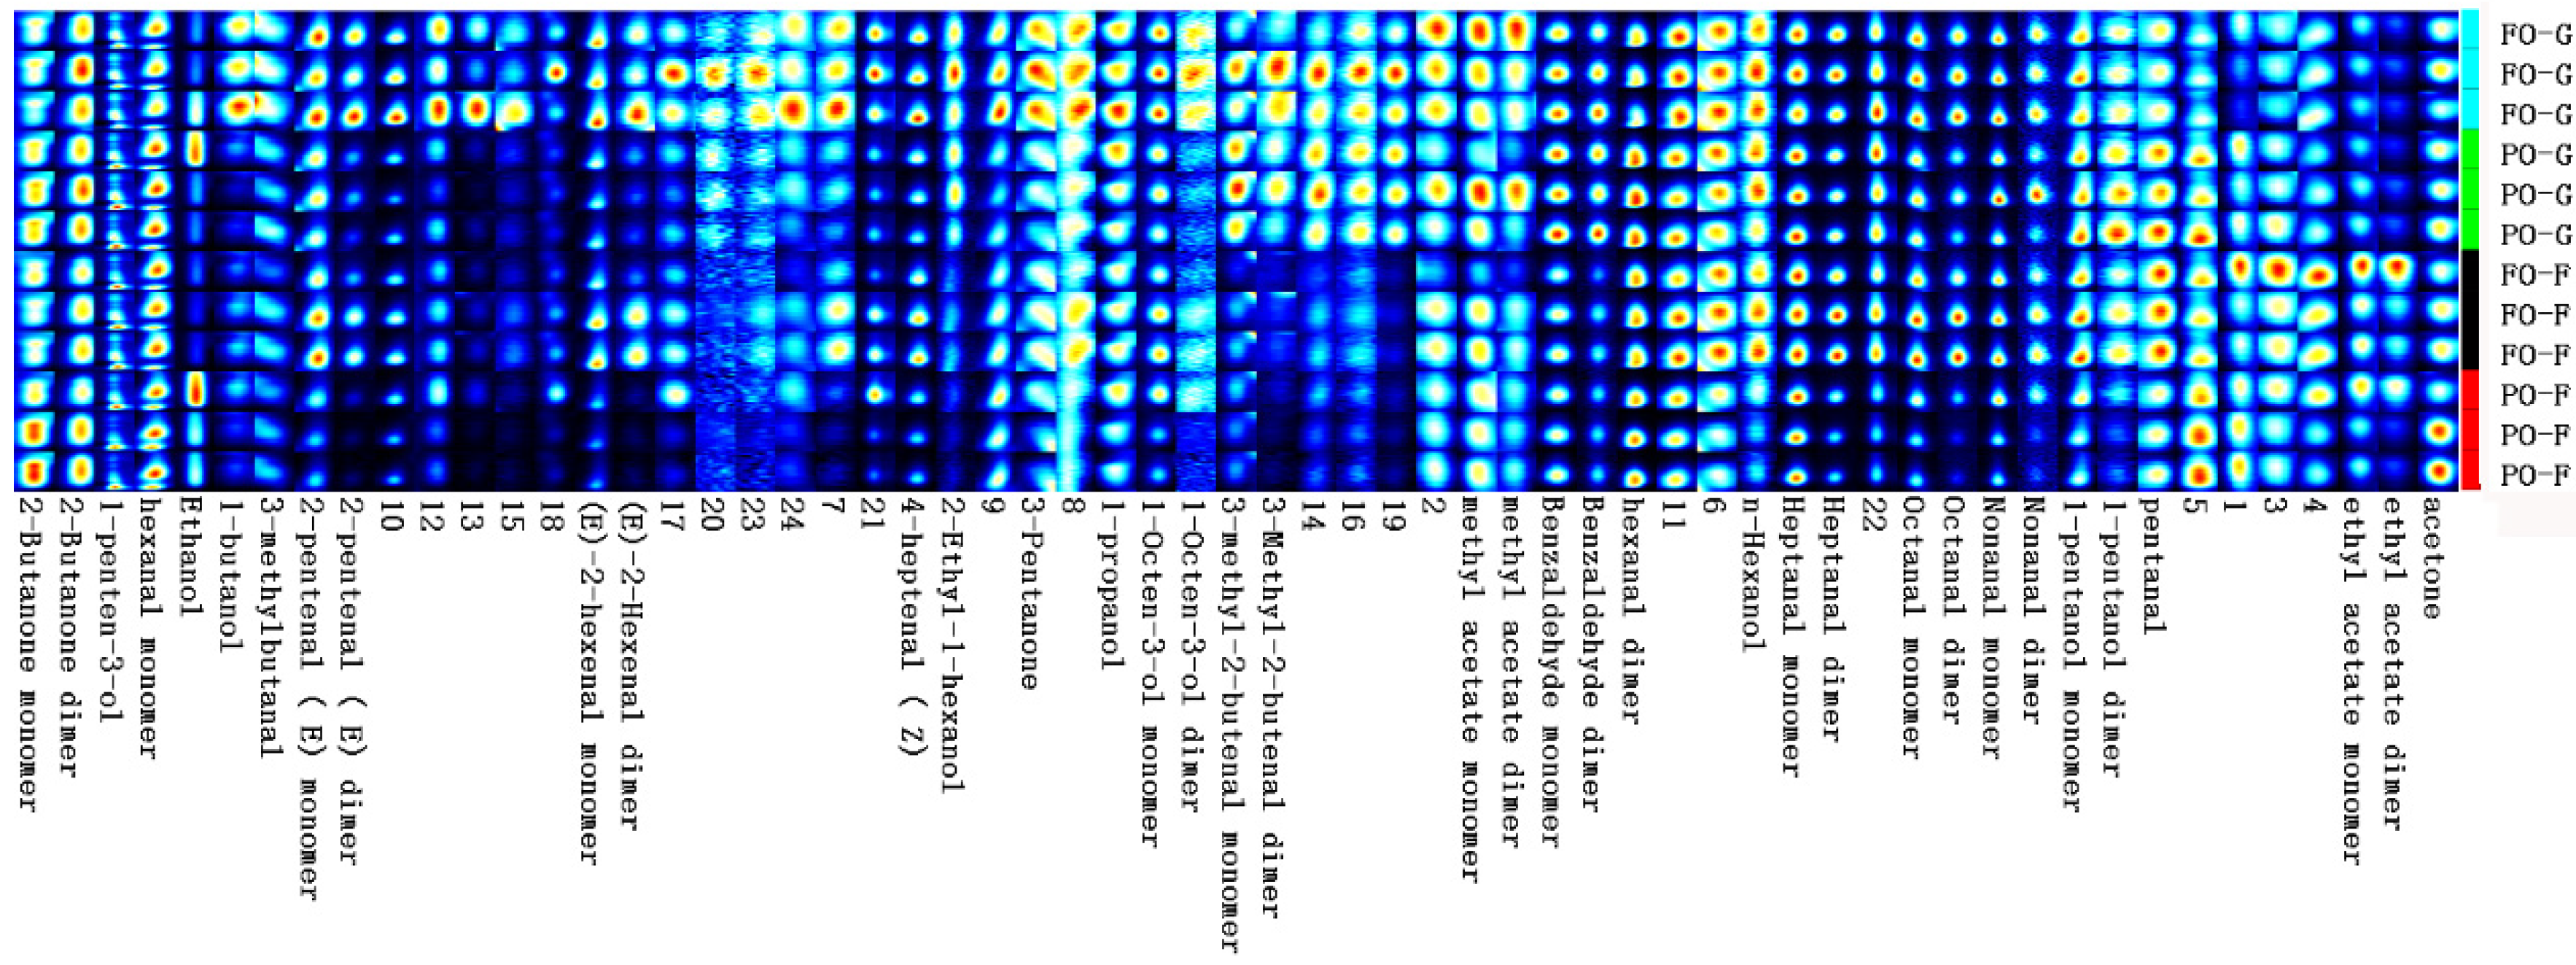
In addition to fatty-acid composition, the volatile-flavor-compound compositions also largely contribute to the fish-fillet quality. The identified volatile flavor compound in tiger puffer mainly consists of aldehyde, alcohol, ketone, phenol, and heterocyclic compounds containing nitrogen and sulfur. The volatile flavor compounds differentially abundant between the FO control group and the PO group were mainly flavor aldehydes and alcohols. Aldehydes have a lower odor threshold and a greater flavor effect on aquatic products, but alcohols have a higher odor threshold and a smaller contribution to flavor.
Many of the flavor aldehydes such as heptanal, octanal, and nonanal are products of the oxidation of oleic and linoleic acids [33,34,35,36]. At the end of the growing-out period, the volatile flavor compound profile was clearly different between the FO and PO groups. The high abundance of 1-pentanol dimer in the PO group may result in the flavors of mushroom, earth, and wax, which are generally considered “off tastes” in sensory-panel testing. The PO group also had higher abundance of pentanal, which could be derived from the oxidation of n-6 PUFA, and has almond, pungent, and malty flavors [35]. In contrast, in the muscle of the FO control group, the higher abundance of butanol, 2-pentenal, (E)-2-hexenal, and 4-heptenal (Z) would generate more flavor of butter, fruit (apple, orange, banana), cheese, boiled potato, and cooked fish. These compounds could also make the fillets taste sweeter and fattier. The adverse effects of PO supplementation on the volatile-flavor-compound profile of muscle were largely, but not completely, mitigated by the FO-finishing. At the end of the FO-finishing period, obvious differences in ethanol, 2-pentenal (E) dimer, (E)-2-hexenal monomer, (E)-2-hexenal monomer, (E)-2-hexenal dimer, 4-heptenal (Z), and octanal dimer could still be observed. In particular, after FO finishing, the PO group still had a lower abundance of heptanal, octanal, and hexanol than the FO control group. Heptanal and octanal usually have fatty, dry fish, grass, and fruit flavors. Hexanol arises from lipoxygenase and hydroperoxide-lyase activities and has the taste of grass [37]. Lower abundance of these compounds indicates that the muscle from the PO group may have had less fishy flavor but also less grass flavor. In addition, for the FO control group, the abundance of many volatile compounds at week 8 was lower than that at week 12, indicating the decrease of volatile compounds with fish growth. Similar results were found in Atlantic salmon (Salmo salar) [38].

4. Materials and Methods

4.1. Experimental Diets

Five experimental diets were formulated. Fish oil (FO) was used as the sole added oil in the control diet. In other diets, added FO was replaced by poultry oil (PO, refined from duck skin, Shandong Haiding Agriculture and Animal Husbandry Co., Ltd., Jinan, China) at different levels, namely, 25%, 50%, 75%, and 100%. The five experimental diets were designated as FO (control), 25PO, 50PO, 75PO, and PO, respectively (Table 5 and Table 6). The pellet feeds with a diameter of 2 mm were made with a laboratory-level single-screw pelleting machine and dried at 55 °C. The experimental diets were stored at −20 °C prior to use. The proximate composition analysis of experimental diets was performed according to the standard methods of the Association of Official Analytical Chemists (AOAC). In brief, the moisture content was measured by drying the samples to a constant weight at 105 °C; the protein content was assayed by measuring nitrogen content (N × 6:25) using the Kjeldahl method; the lipid content was assayed with petroleum ether extraction using the Soxhlet method; and the ash content was measured by incineration in a muffle furnace at 550 °C for 8 h.

4.2. Feeding Procedure and Sampling

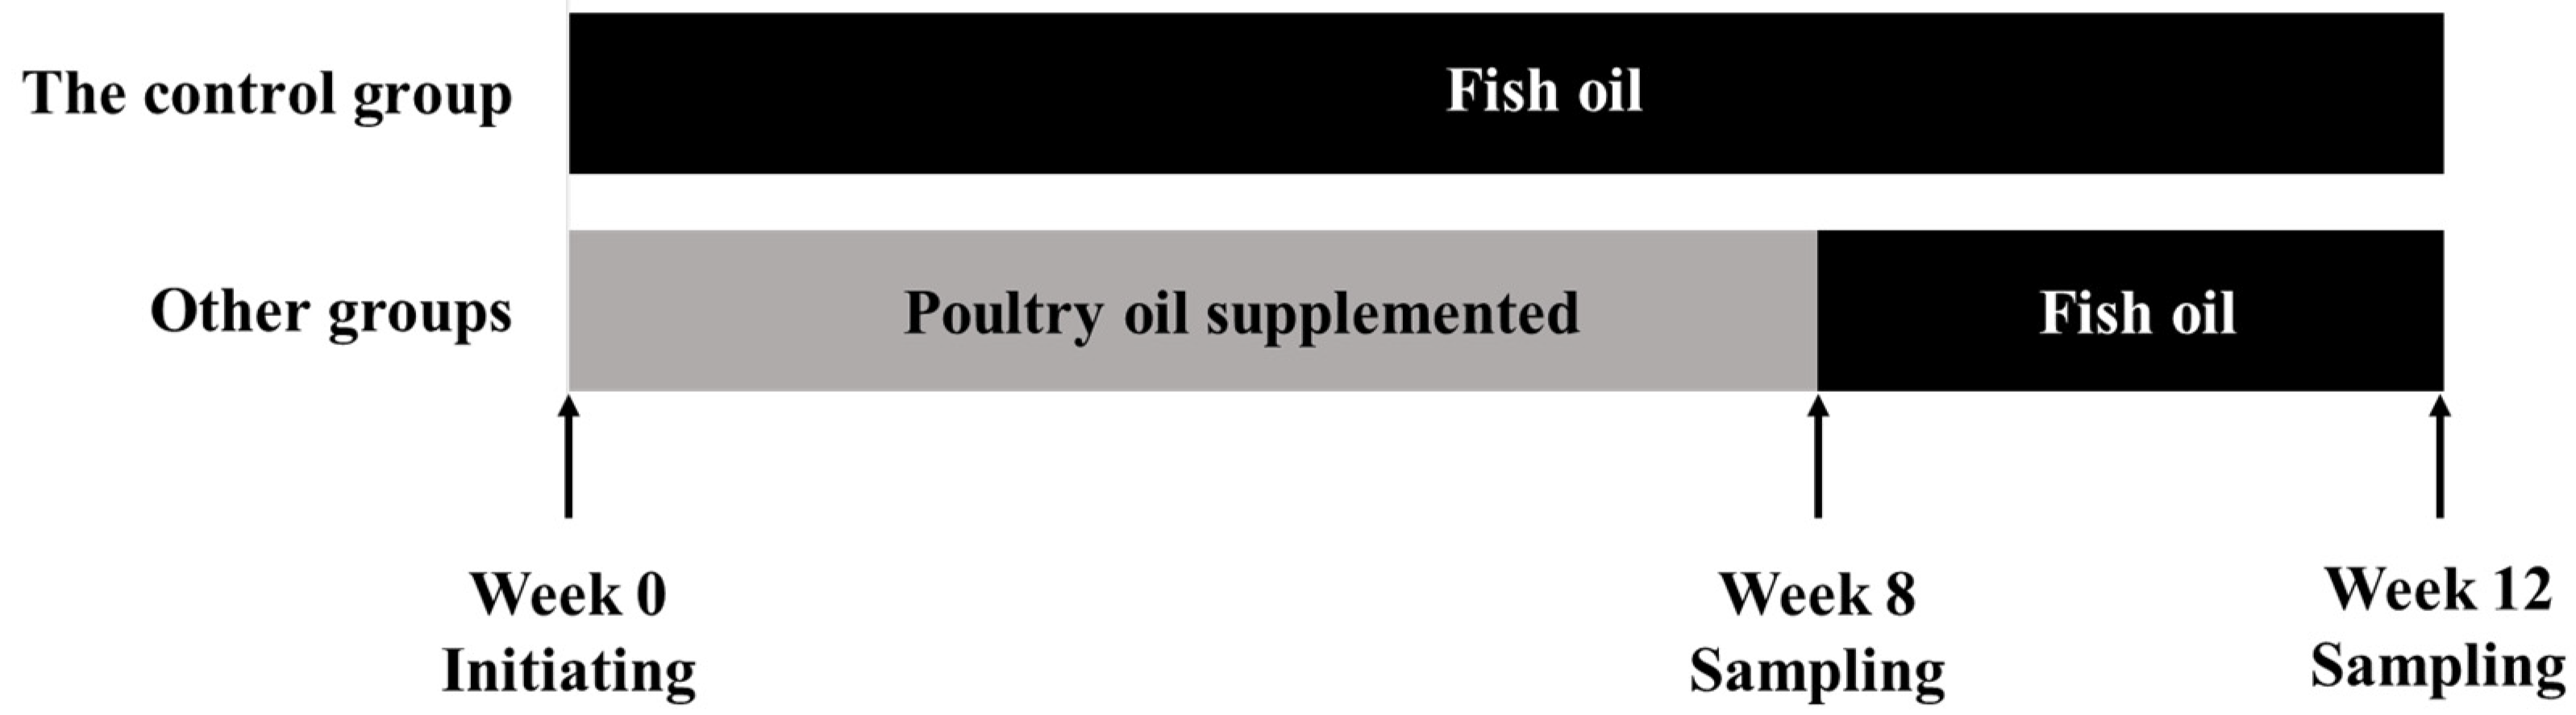
Tiger puffer juveniles (average initial body weight, 12.3 ± 0.5 g; average body length, 6.5 ± 0.5 cm) were purchased from Hongqi Modern Fishery Industrial Park (Rizhao, China), and transported to the Yellow Sea Aquaculture Co., Ltd. (Yantai, China), where the feeding trial was conducted. At the beginning of the experiment, 600 randomly selected healthy fish were divided into 15 polyethylene tanks (0.7 × 0.7 × 0.4 m). Each tank was stocked with 40 fish. Each diet was randomly fed to triplicate tanks. Fish were hand-fed to apparent satiation three times daily (7:00, 12:00, and 18:00). The feeding trial lasted 12 weeks (Figure 4). Following the first 8-week growing-out period, during which the five experiment diets were normally fed to experimental fish, was a four-week FO-finishing period, during which fish in all five groups were fed the FO control diet.
Sampling was conducted at the end of both the growing-out period (week 8) and the FO-finishing period (week 12). Before sampling, fish were fasted for 24 h. In each sampling point, four fish were randomly selected from each tank, and the muscle and liver samples were collected. The samples were immediately frozen with liquid nitrogen and then stored at −76 °C before use. All sampling protocols, as well as all fish rearing practices, were reviewed and approved by the Animal Care and Use Committee of Yellow Sea Fisheries Research Institute.

4.3. Analysis of Fatty-Acid Composition

The fatty-acid compositions of oils, diets, muscles, and livers were analyzed with gas chromatography, as previously described [39]. Lipids in the samples were firstly extracted with the chloroform methanol method. Fatty acids in the extracted oil were then saponified and methylated with KOH-methanol and HCL-methanol. Gas chromatograph (GC-2010 pro, Shimadzu, Kyoto, Japan) equipped with a quartz capillary column (SH-RT-2560, 100 m × 0.25 mm × 0.20 um) and a flame ionization detector was used in the analysis. The results are expressed as percentage of each fatty acid relative to the total fatty acids (%TFA).

4.4. Analysis of Volatile Organic Compounds in the Muscle

Two typical groups, FO and PO, was subjected to the analysis of volatile organic compounds in the muscle, which was conducted with gas chromatography−ion migration spectrometry (GC-IMS). A FlavourSpec® (G.A.S, Dordmund, Germany) platform equipped with a MXT-5 column (RESTEK, Bellefonte, PA, USA; 15 m × 0.53 mm × 1.0 μm) was used in this analysis. The column and IMS temperatures were 60 and 45 °C, respectively. High-purity nitrogen (purity, 99.999%) was used as the carrier gas. Three grams muscle samples were accurately weighed and placed in a 20 mL vial. The samples were incubated at 60 °C (500 r/min) for 15 min. The injection volume was 500 μL, and the temperature of the automatic injection needle was 85 °C. Built-in software VOCal and three tools including Reporter, Gallery Plot, and Dynamic PCA were used in the result report.

4.5. Electronic-Nose Analysis

The odor analysis for the muscle samples from groups FO and PO was performed with a PEN-3 portable electronic nose (Airsense, Schwerin, Germany). One gram of muscle sample was weighed and placed it in a 20 mL vial with lid and sealed. The samples were then heated at 50 °C in a water bath for 10 min, and finally subjected to electronic-nose analysis. Winmuster software was used for data collection and processing, generating results of principal component analysis (PCA) and linear discrimination method (LDA). Ten different metal-oxide sensors (W1C, benzene; W5S, nitrogen oxide; W3C, amine; W6S, hydride; W5C, short alkane; W1S, methyl; W1W, inorganic sulfide; W2S, alcohols; W2W, organic sulfide; and W3S, long chain alkanes) were used to detect the main volatile compounds in the samples.

4.6. Statistical Analyses

All data were analyzed by one-way ANOVA in SPSS 16.0. Multiple comparisons were performed using Tukey’s test, and the significance level was decided when p < 0.05. The results are expressed as mean ± standard error.

5. Conclusions

In conclusion, results of this study suggested that the adverse effects of dietary poultry oil on fatty acid and volatile flavor compound compositions of farmed tiger puffer can be largely mitigated by a fish-oil-finishing strategy. However, despite the high efficiency of the fish-oil-finishing strategy in this study, the efficiency when there is a very long period of poultry-oil feeding remains unknown and warrants further study.

Supplementary Materials

The following supporting information can be downloaded at: https://www.mdpi.com/article/10.3390/md21020122/s1, Table S1: Volatile flavor compounds detected in the muscle; Figure S1: Principal component analysis (PCA) of response values in the analysis with electronic nose; Figure S2: Linear discriminant analysis (LDA) of response values in the analysis with electronic nose.

Author Contributions

Methodology, data curation, and writing—original draft, L.L.; data curation and formal analysis, F.Z. and X.M.; methodology, X.C.; software and formal analysis, Q.M. and Y.W.; funding acquisition and conceptualization, M.L.; conceptualization, funding acquisition, and writing—review and editing, H.X. All authors have read and agreed to the published version of the manuscript.

Funding

This work was supported by Central Public-Interest Scientific Institution Basal Research Fund, CAFS/YSFRI (grant numbers 2022XT0403, 2020TD48, and 20603022022004), the Natural Science Foundation of Shandong Province Outstanding Youth Foundation (grant number ZR2021YQ24), and China Agriculture Research System (grant number CARS-47).

Institutional Review Board Statement

The animal-study protocol was approved by the Animal Care and Use Committee of Yellow Sea Fisheries Research Institute (protocol code ACUC202105234235; date of approval, 23 May 2021).

Data Availability Statement

The data that support the findings of this study are included in the text and in the tables. Raw data for all figures are available from the corresponding author upon reasonable request.

Acknowledgments

We would like to thank Yingming Yang for his help in fish-rearing.

Conflicts of Interest

The authors declare no conflict of interest.

References

  1. Alagawany, M.; Elnesr, S.S.; Farag, M.R.; El-Sabrout, K.; Alqaisi, O.; Dawood, M.A.O.; Soomro, H.; Abdelnour, S.A. Nutritional significance and health benefits of omega-3,-6 and-9 fatty acids in animals. Anim. Biotechnol. 2020, 33, 1678–1690. [Google Scholar] [CrossRef] [PubMed]
  2. Tveteras, S.; Tveteras, R. The Global Competition for Wild Fish Resources between Livestock and Aquaculture. J. Agric. Econ. 2010, 61, 381–397. [Google Scholar] [CrossRef]
  3. Rosenlund, G.; Obach, A.; Sandberg, M.G.; Standal, H.; Tveit, K. Effect of alternative lipid sources on long-term growth performance and quality of Atlantic salmon (Salmo salar L.). Aquac. Res. 2001, 32, 323–328. [Google Scholar] [CrossRef]
  4. Liu, K.K.M.; Barrows, F.T.; Hardy, R.W.; Dong, F.M. Body composition, growth performance, and product quality of rainbow trout (Oncorhynchus mykiss) fed diets containing poultry fat, soybean/corn lecithin, or menhaden oil. Aquaculture 2004, 238, 309–328. [Google Scholar] [CrossRef]
  5. Xue, M.; Luo, L.; Wu, X.; Ren, Z.; Gao, P.; Yu, Y.; Pearl, G. Effects of six alternative lipid sources on growth and tissue fatty acid composition in Japanese sea bass (Lateolabrax japonicus). Aquaculture 2006, 260, 206–214. [Google Scholar] [CrossRef]
  6. Bowyer, J.N.; Qin, J.; Smullen, R.P.; Stone, D.A.J. Replacement of fish oil by poultry oil and canola oil in yellowtail kingfish (Seriola lalandi) at optimal and suboptimal temperatures. Aquaculture 2012, 356, 211–222. [Google Scholar] [CrossRef]
  7. Yun, B.; Xue, M.; Wang, J.; Fan, Z.; Wu, X.; Zheng, Y.; Qin, Y. Effects of lipid sources and lipid peroxidation on feed intake, growth, and tissue fatty acid compositions of largemouth bass (Micropterus salmoides). Aquac. Int. 2012, 21, 97–110. [Google Scholar] [CrossRef]
  8. Ahmad, W.A.R.W.; Stone, D.A.J.; Schuller, K.A. Dietary fish oil replacement with palm or poultry oil increases fillet oxidative stability and decreases liver glutathione peroxidase activity in barramundi (Lates calcarifer). Fish Physiol. Biochem. 2013, 39, 1631–1640. [Google Scholar] [CrossRef] [PubMed]
  9. Friesen, E.; Balfry, S.K.; Skura, B.J.; Ikonomou, M.; Higgs, D.A. Evaluation of poultry fat and blends of poultry fat with cold-pressed flaxseed oil as supplemental dietary lipid sources for juvenile sablefish (Anoplopoma fimbria). Aquac. Res. 2013, 44, 300–316. [Google Scholar] [CrossRef]
  10. Rombenso, A.N.; Trushenski, J.T.; Schwarz, M.H. Fish oil replacement in feeds for juvenile Florida Pompano: Composition of alternative lipid influences degree of tissue fatty acid profile distortion. Aquaculture 2016, 458, 177–186. [Google Scholar] [CrossRef]
  11. Campos, I.; Matos, E.; Maia, M.R.G.; Marques, A.; Valente, L.M.P. Partial and total replacement of fish oil by poultry fat in diets for European seabass (Dicentrarchus labrax) juveniles: Effects on nutrient utilization, growth performance, tissue composition and lipid metabolism. Aquaculture 2019, 502, 107–120. [Google Scholar] [CrossRef]
  12. Carvalho, M.; Montero, D.; Rosenlund, G.; Fontanillas, R.; Gines, R.; Izquierdo, M. Effective complete replacement of fish oil by combining poultry and microalgae oils in practical diets for gilthead sea bream (Sparus aurata) fingerlings. Aquaculture 2020, 529, 735696. [Google Scholar] [CrossRef]
  13. Xu, H.; Turchini, G.M.; Francis, D.S.; Liang, M.; Mock, T.S.; Rombenso, A.; Ai, Q. Are fish what they eat? A fatty acid’s perspective. Prog. Lipid Res. 2020, 80, 101064. [Google Scholar] [CrossRef]
  14. Trushenski, J.T.; Lewis, H.A.; Kohler, C.C. Fatty acid profile of sunshine bass: I. Profile change is affected by initial composition and differs among tissues. Lipids 2008, 43, 629–641. [Google Scholar] [CrossRef] [PubMed]
  15. Pares-Sierra, G.; Durazo, E.; Antonio Ponce, M.; Badillo, D.; Correa-Reyes, G.; Teresa Viana, M. Partial to total replacement of fishmeal by poultry by-product meal in diets for juvenile rainbow trout (Oncorhynchus mykiss) and their effect on fatty acids from muscle tissue and the time required to retrieve the effect. Aquac. Res. 2014, 45, 1459–1469. [Google Scholar] [CrossRef]
  16. Liu, Y.; Jiao, J.; Shuang, G.; Li, J.; Limbu, S.M.; Fang, Q.; Li, Q.; Mei, L.; Zhen, Y. Dietary oils modify lipid molecules and nutritional value of fillet in Nile tilapia: A deep lipidomics analysis. Food Chem. 2019, 277, 515–523. [Google Scholar] [CrossRef] [PubMed]
  17. Grigorakis, K.; Fountoulaki, E.; Giogios, I.; Alexis, M.N. Volatile compounds and organoleptic qualities of gilthead sea bream (Sparus aurata) fed commercial diets containing different lipid sources. Aquaculture 2009, 290, 116–121. [Google Scholar] [CrossRef]
  18. Moreira, N.; Soares, S.; Valente, L.M.P.; Castro-Cunha, M.; Cunha, L.M.; Guedes de Pinho, P. Effect of two experimental diets (protein and lipid vegetable oil blends) on the volatile profile of Senegalese sole (Solea senegalensis Kaup, 1858) muscle. Food Chem. 2014, 153, 327–333. [Google Scholar] [CrossRef]
  19. Serot, T.; Regost, C.; Prost, C.; Robin, J.; Arzel, J. Effect of dietary lipid sources on odour-active compounds in muscle of turbot (Psetta maxima). J. Sci. Food Agric. 2001, 81, 1339–1346. [Google Scholar] [CrossRef]
  20. Timm-Heinrich, M.; Eymard, S.; Baron, C.P.; Nielsen, H.H.; Jacobsen, C. Oxidative changes during ice storage of rainbow trout (Oncorhynchus mykiss) fed different ratios of marine and vegetable feed ingredients. Food Chem. 2013, 136, 1220–1230. [Google Scholar] [CrossRef]
  21. Turchini, G.M.; Mentasti, T.; Caprino, F.; Panseri, S.; Moretti, V.M.; Valfrè, F. Effects of dietary lipid sources on flavour volatile compounds of brown trout (Salmo trutta L.) fillet. J. Appl. Ichthyol. 2004, 20, 71–75. [Google Scholar] [CrossRef]
  22. Turchini, G.M.; Moretti, V.M.; Mentasti, T.; Orban, E.; Valfrè, F. Effects of dietary lipid source on fillet chemical composition, flavour volatile compounds and sensory characteristics in the freshwater fish tench (Tinca tinca L.). Food Chem. 2007, 102, 1144–1155. [Google Scholar] [CrossRef]
  23. Zhou, L.; Han, D.; Zhu, X.; Yang, Y.; Jin, J.; Xie, S. Effects of total replacement of fish oil by pork lard or rapeseed oil and recovery by a fish oil finishing diet on growth, health and fish quality of gibel carp (Carassius auratus gibelio). Aquac. Res. 2016, 47, 2961–2975. [Google Scholar] [CrossRef]
  24. Liao, Z.; Sun, Z.; Bi, Q.; Gong, Q.; Sun, B.; Wei, Y.; Liang, M.; Xu, H. Application of the fish oil-finishing strategy in a lean marine teleost, tiger puffer (Takifugu rubripes). Aquaculture 2021, 534, 736306. [Google Scholar] [CrossRef]
  25. Li, L.; Zhang, F.; Meng, X.; Cui, X.; Ma, Q.; Wei, Y.; Liang, M.; Xu, H. Fish oil replacement with poultry oil in the diet of tiger puffer (Takifugu rubripes): Effects on growth performance, body composition, and lipid metabolism. Aquac. Nutr. 2022, 2022, 2337933. [Google Scholar] [CrossRef]
  26. Montero, D.; Robaina, L.; Caballero, M.J.; Gines, R.; Izquierdo, M.S. Growth, feed utilization and flesh quality of European sea bass (Dicentrarchus labrax) fed diets containing vegetable oils: A time-course study on the effect of a re-feeding period with a 100% fish oil diet. Aquaculture 2005, 248, 121–134. [Google Scholar] [CrossRef]
  27. Turchini, G.M.; Francis, D.S.; De Silva, S.S. Modification of tissue fatty acid composition in Murray cod (Maccullochella peelii peelii, Mitchell) resulting from a shift from vegetable oil diets to a fish oil diet. Aquac. Res. 2006, 37, 570–585. [Google Scholar] [CrossRef]
  28. Fountoulaki, E.; Vasilaki, A.; Hurtado, R.; Grigorakis, K.; Karacostas, I.; Nengas, I.; Rigos, G.; Kotzamanis, Y.; Venou, B.; Alexis, M.N. Fish oil substitution by vegetable oils in commercial diets for gilthead sea bream (Sparus aurata L.); effects on growth performance, flesh quality and fillet fatty acid profile: Recovery of fatty acid profiles by a fish oil finishing diet under fluctuating water temperatures. Aquaculture 2009, 289, 317–326. [Google Scholar] [CrossRef]
  29. Karanth, S.; Sharma, P.; Pal, A.K.; Venkateshwarlu, G. Effect of different vegetable oils on growth and fatty acid profile of rohu (Labeo rohita, Hamilton); evaluation of a return fish oil diet to restore human cardio-protective fatty acids. Asian-Australas. J. Anim. Sci. 2009, 22, 565–575. [Google Scholar] [CrossRef]
  30. Ng, W.K.; Chong, C.Y.; Wang, Y.; Romano, N. Effects of dietary fish and vegetable oils on the growth, tissue fatty acid composition, oxidative stability and vitamin E content of red hybrid tilapia and efficacy of using fish oil finishing diets. Aquaculture 2013, 372, 97–110. [Google Scholar] [CrossRef]
  31. Katikou, P.; Gokbulut, C.; Kosker, A.R.; Campas, M.; Ozogul, F. An updated review of tetrodotoxin and its peculiarities. Mar. Drugs 2022, 20, 47. [Google Scholar] [CrossRef] [PubMed]
  32. Sargent, J.R.; Tocher, D.R.; Bell, J.G. The lipids. In Fish Nutrition, 3rd ed.; Halver, J.E., Hardy, R.W., Eds.; Academic Press: Pittsburgh, PA, USA, 2002; Volume 4, pp. 181–257. ISBN 978-0-12-319652-1. [Google Scholar]
  33. De Quirós, A.R.-B.; López-Hernández, J.; González-Castro, M.; De la Cruz-Garcia, C.; Simal-Lozano, J. Comparison of volatile components in fresh and canned sea urchin (Paracentrotus lividus, Lamarck) gonads by GC-MS using dynamic headspace sampling and microwave desorption. Eur. Food Res. Technol. 2001, 212, 643–647. [Google Scholar] [CrossRef]
  34. Tao, N.; Wu, R.; Zhou, P.; Gu, S.; Wu, W. Characterization of odor-active compounds in cooked meat of farmed obscure puffer (Takifugu obscurus) using gas chromatography-mass spectrometry-olfactometry. J. Food Drug Anal. 2014, 22, 431–438. [Google Scholar] [CrossRef] [PubMed]
  35. Mu, H.; Wei, Z.; Yi, L.; Liang, H.; Zhao, L.; Zhang, W.; Mai, K. Dietary fishmeal levels affect the volatile compounds in cooked muscle of farmed large yellow croaker Larimichthys Crocea. Aquac. Res. 2017, 48, 5821–5834. [Google Scholar] [CrossRef]
  36. Wu, J.; Chen, X.; Chen, B.; Pan, N.; Qiao, K.; Wu, G.; Liu, Z. Collaborative analysis combining headspace-gas chromatography-ion mobility spectrometry (HS-GC-IMS) and intelligent (electronic) sensory systems to evaluate differences in the flavour of cultured pufferfish. Flavour Fragr. J. 2020, 36, 182–189. [Google Scholar] [CrossRef]
  37. Salum, P.; Guclu, G.; Selli, S. Comparative evaluation of key aroma-active compounds in raw and cooked red mullet (Mullus barbatus) by aroma extract dilution analysis. J. Agric. Food Chem. 2017, 65, 8402–8408. [Google Scholar] [CrossRef] [PubMed]
  38. Duan, Z.; Dong, S.; Sun, Y.; Dong, Y.; Gao, Q. Response of Atlantic salmon (Salmo salar) flavor to environmental salinity while culturing between freshwater and seawater. Aquaculture 2021, 530, 735953. [Google Scholar] [CrossRef]
  39. Meng, X.; Bi, Q.; Cao, L.; Ma, Q.; Wei, Y.; Duan, M.; Liang, M.; Xu, H. Evaluation of necessity of cholesterol supplementation in diets of two marine teleosts, turbot (Scophthalmus maximus) and tiger puffer (Takifugu rubripes): Effects on growth and lipid metabolism. Aquac. Nutr. 2022, 2022, 4160991. [Google Scholar] [CrossRef]
Figure 1. LC-PUFA contents in the muscle and liver of experimental tiger puffer.
Marinedrugs 21 00122 g001
Figure 2. Principal component analysis (PCA) (A) and Euclidean distance (B) of volatile flavor compounds in the muscle. FO–G and PO–G: the fish oil and poultry oil group at the end of growing-out period, respectively; FO–F and PO–F: the fish oil and poultry oil group after fish oil-finishing, respectively.
Marinedrugs 21 00122 g002
Figure 3. Gallery plot of the volatile flavor compounds in the muscle. The brightness indicates relative compound abundance. A column represents the signal peak of a certain volatile organic compound in different samples. A line represents all signal peaks of volatile organic compound selected from a certain sample. Compounds named as numbers were not successfully identified. The meanings of FO–G, PO–G, FO–F, and PO–F are the same as in Figure 3.
Marinedrugs 21 00122 g003
Figure 4. Experimental design and feeding periods.
Marinedrugs 21 00122 g004
Table 1. Fatty-acid compositions in the muscle at the end of the growing-out period (%TFA, mean ± standard error).
Fatty AcidFO25PO50PO75POPO
14:00.67 ± 0.05 c0.56 ± 0.05 bc0.50 ± 0.01 abc0.42 ± 0.03 ab0.36 ± 0.03 a
16:023.22 ± 0.2522.79 ± 0.3122.98 ± 0.0622.54 ± 0.1022.54 ± 0.25
18:012.39 ± 0.1512.51 ± 0.1812.13 ± 0.0512.12 ± 0.2811.92 ± 0.13
20:00.35 ± 0.150.42 ± 0.000.32 ± 0.000.25 ± 0.010.14 ± 0.03
∑SFA36.63 ± 0.54 b36.28 ± 0.18 ab35.92 ± 0.09 ab35.33 ± 0.34 ab34.96 ± 0.20 a
16:1n-71.12 ± 0.131.02 ± 0.080.93 ± 0.040.90 ± 0.050.86 ± 0.04
17:1n-70.53 ± 0.02 ab0.55 ± 0.03 b0.47 ± 0.01 ab0.45 ± 0.01 ab0.44 ± 0.04 a
18:1n-911.15 ± 0.18 a12.57 ± 0.08 b13.94 ± 0.11 c15.19 ± 0.11 d16.34 ± 0.31 e
24:1n-90.23 ± 0.050.41 ± 0.050.24 ± 0.080.72 ± 0.350.31 ± 0.11
∑MUFA13.02 ± 0.33 a14.54 ± 0.19 b15.57 ± 0.17 b17.27 ± 0.27 c 17.95 ± 0.47 c
18:2n-610.82 ± 0.22 a12.13 ± 0.30 b12.86 ± 0.09 b14.57 ± 0.20 c16.04 ± 0.11 d
20:2n-60.68 ± 0.03 a0.77 ± 0.01 b0.78 ± 0.01 b0.83 ± 0.02 bc0.88 ± 0.01 c
20:4n-62.23 ± 0.082.12 ± 0.072.18 ± 0.042.10 ± 0.022.02 ± 0.04
∑n-6 PUFA13.73 ± 0.17 a15.01 ± 0.30 b15.82 ± 0.08 b17.50 ± 0.19 c18.94 ± 0.13 d
18:3n-30.28 ± 0.050.24 ± 0.030.26 ± 0.000.24 ± 0.020.20 ± 0.01
20:5n-38.32 ± 0.04 d7.67 ± 0.11 c7.00 ± 0.02 b6.66 ± 0.10 ab6.18 ± 0.23 a
22:5n-34.89 ± 0.154.86 ± 0.054.81 ± 0.075.11 ± 0.135.22 ± 0.09
22:6n-321.32 ± 0.73 b20.01 ± 0.59 b19.22 ± 0.14 b16.63 ± 0.44 a15.06 ± 0.23 a
∑n-3 PUFA34.81 ± 0.81 c32.79 ± 0.53 bc31.3 ± 0.06 b28.64 ± 0.20 a26.65 ± 0.54 a
∑n-3/∑n-62.54 ± 0.08 c2.19 ± 0.07 b1.98 ± 0.01 b1.64 ± 0.03 a1.41 ± 0.02 a
Data in a same row not sharing a same superscript letter are significantly different (p ˂ 0.05). TFA: total fatty acid; SFA: saturated fatty acid; MUFA: monounsaturated fatty acid; n-6 PUFA: n-6 poly-unsaturated fatty acid; n-3 PUFA: n-3 polyunsaturated fatty acid.
Table 2. Fatty-acid compositions in the muscle after fish oil-finishing (%TFA, mean ± standard error).
Fatty AcidFO25PO50PO75POPO
14:00.75 ± 0.020.80 ± 0.090.67 ± 0.020.62 ± 0.030.65 ± 0.01
16:023.39 ± 0.20 b22.47 ± 0.39 ab22.3 ± 0.30 ab22.38 ± 0.14 ab22.04 ± 0.19 a
18:012.61 ± 0.3012.52 ± 0.4412.80 ± 0.4512.46 ± 0.1312.73 ± 0.35
20:00.53 ± 0.010.54 ± 0.030.52 ± 0.060.44 ± 0.010.44 ± 0.02
∑SFA37.28 ± 0.4736.33 ± 0.7436.28 ± 0.7635.89 ± 0.1035.86 ± 0.38
16:1n-71.11 ± 0.021.23 ± 0.121.05 ± 0.030.97 ± 0.060.99 ± 0.03
17:1n-70.63 ± 0.060.59 ± 0.030.63 ± 0.040.54 ± 0.000.55 ± 0.04
18:1n-910.69 ± 0.15 a11.43 ± 0.26 ab11.51 ± 0.25 abc11.64 ± 0.08 bc12.35 ± 0.11 c
24:1n-90.29 ± 0.030.34 ± 0.030.40 ± 0.020.37 ± 0.030.50 ± 0.09
∑MUFA12.72 ± 0.19 a13.59 ± 0.38 ab13.59 ± 0.26 ab13.52 ± 0.06 ab14.39 ± 0.16 b
18:2n-610.81 ± 0.23 a11.37 ± 0.09 a11.54 ± 0.13 ab12.19 ± 0.24 bc12.79 ± 0.10 c
20:2n-60.70 ± 0.04 a0.87 ± 0.04 b0.85 ± 0.01 b0.90 ± 0.03 b0.92 ± 0.03 b
20:4n-62.23 ± 0.022.13 ± 0.102.19 ± 0.082.32 ± 0.062.12 ± 0.04
∑n-6 PUFA13.74 ± 0.24 a14.37 ± 0.02 ab14.57 ± 0.07 b15.41 ± 0.21 c15.83 ± 0.16 c
18:3n-30.11 ± 0.110.29 ± 0.070.16 ± 0.080.21 ± 0.050.15 ± 0.08
20:5n-38.02 ± 0.297.78 ± 0.287.46 ± 0.247.99 ± 0.057.52 ± 0.17
22:5n-35.26 ± 0.10 a5.63 ± 0.18 ab5.71 ± 0.06 ab5.63 ± 0.16 ab6.02 ± 0.10 b
22:6n-320.69 ± 0.32 b19.68 ± 0.42 b20.19 ± 0.71 b19.38 ± 0.20 ab17.65 ± 0.23 a
∑n-3 PUFA34.08 ± 0.43 b33.38 ± 0.49 ab33.52 ± 0.93 ab33.22 ± 0.09 ab31.33 ± 0.54 a
∑n-3/∑n-62.48 ± 0.04 c2.32 ± 0.03 bc2.30 ± 0.06 bc2.16 ± 0.04 ab1.98 ± 0.02 a
Data in a same row not sharing a same superscript letter are significantly different (p ˂ 0.05). TFA: total fatty acid; SFA: saturated fatty acid; MUFA: monounsaturated fatty acid; n-6 PUFA: n-6 poly-unsaturated fatty acid; n-3 PUFA: n-3 polyunsaturated fatty acid. Data in a same row not sharing a same superscript letter are significantly different (p ˂ 0.05).
Table 3. Fatty-acid compositions in the liver at the end of the growing-out period (%TFA, mean ± standard error).
Fatty AcidFO25PO50PO75POPO
14:03.49 ± 0.09 c3.20 ± 0.08 c2.55 ± 0.02 b2.29 ± 0.05 b1.84 ± 0.02 a
16:019.51 ± 0.6320.65 ± 0.2419.15 ± 0.2619.93 ± 0.3819.58 ± 0.13
18:08.63 ± 0.769.47 ± 0.487.91 ± 0.199.14 ± 0.758.68 ± 0.63
20:00.52 ± 0.03 c0.48 ± 0.01 c0.35 ± 0.02 b0.31 ± 0.01 ab0.24 ± 0.01 a
∑SFA32.15 ± 1.3233.80 ± 0.6629.96 ± 0.2531.66 ± 1.0330.34 ± 0.60
16:1n-78.53 ± 0.21 b8.31 ± 0.23 ab8.41 ± 0.12 ab7.15 ± 0.40 a7.32 ± 0.35 ab
18:1n-923.90 ± 0.18 a26.54 ± 0.46 b30.83 ± 0.47 c34.43 ± 0.26 d37.25 ± 0.57 e
20:1n-92.22 ± 0.222.03 ± 0.222.39 ± 0.041.98 ± 0.172.01 ± 0.08
22:1n-90.25 ± 0.00 d0.24 ± 0.01 cd0.21 ± 0.01 bc0.18 ± 0.00 ab0.17 ± 0.01 a
∑MUFA34.90 ± 0.31 a37.12 ± 0.63 b41.85 ± 0.30 c43.74 ± 0.51 c46.74 ± 0.37 d
18:2n-612.26 ± 0.2812.27 ± 0.1212.84 ± 0.1912.58 ± 0.3512.74 ± 0.25
18:3n-60.19 ± 0.01 d0.17 ± 0.00 cd0.15 ± 0.00 bc0.13 ± 0.01 ab0.13 ± 0.01 a
20:2n-60.79 ± 0.030.83 ± 0.030.84 ± 0.030.76 ± 0.020.78 ± 0.05
20:4n-60.12 ± 0.00 b0.11 ± 0.00 b0.09 ± 0.01 a0.08 ± 0.01 a0.07 ± 0.01 a
∑n-6 PUFA13.35 ± 0.3113.37 ± 0.1413.91 ± 0.2313.54 ± 0.3713.72 ± 0.31
20:3n-30.58 ± 0.03 b0.58 ± 0.05 b0.51 ± 0.01 ab0.46 ± 0.03 ab0.42 ± 0.01 a
20:5n-35.96 ± 0.25 c4.82 ± 0.11 b4.29 ± 0.14 b3.35 ± 0.23 a2.74 ± 0.07 a
22:5n-34.14 ± 0.13 c3.48 ± 0.08 b3.42 ± 0.14 b2.85 ± 0.02 a2.45 ± 0.03 a
22:6n-37.12 ± 0.31 c5.65 ± 0.04 b4.95 ± 0.23 b3.51 ± 0.04 a2.73 ± 0.06 a
∑n-3 PUFA17.78 ± 0.69 d14.52 ± 0.25 c13.17 ± 0.33 c10.17 ± 0.23 b8.34 ± 0.12 a
∑n-3/∑n-61.33 ± 0.02 e1.09 ± 0.01 d0.95 ± 0.03 c0.75 ± 0.01 b0.61 ± 0.01 a
Data in a same row not sharing a same superscript letter are significantly different (p ˂ 0.05). TFA: total fatty acid; SFA: saturated fatty acid; MUFA: monounsaturated fatty acid; n-6 PUFA: n-6 poly-unsaturated fatty acid; n-3 PUFA: n-3 polyunsaturated fatty acid.
Table 4. Fatty-acid compositions in the liver after fish oil-finishing (%TFA, mean ± standard error).
Fatty AcidFO25PO50PO75POPO
14:03.49 ± 0.11 b3.28 ± 0.03 b3.14 ± 0.12 ab2.79 ± 0.10 a2.84 ± 0.07 a
16:020.06 ± 0.2019.44 ± 0.1420.12 ± 0.3020.10 ± 0.1119.53 ± 0.21
18:09.52 ± 0.399.55 ± 0.169.72 ± 0.2010.35 ± 0.379.35 ± 0.64
20:00.55 ± 0.01 c0.50 ± 0.01 bc0.46 ± 0.01 ab0.47 ± 0.02 abc0.40 ± 0.03 a
∑SFA33.63 ± 0.4732.76 ± 0.1333.44 ± 0.4233.71 ± 0.5332.13 ± 0.77
16:1n-78.19 ± 0.218.02 ± 0.097.73 ± 0.217.32 ± 0.357.69 ± 0.11
18:1n-923.86 ± 0.39 a25.22 ± 0.37 ab27.04 ± 0.23 bc28.54 ± 0.76 cd29.94 ± 0.64 d
20:1n-91.95 ± 0.102.02 ± 0.041.74 ± 0.131.66 ± 0.061.85 ± 0.05
22:1n-90.24 ± 0.01 b0.23 ± 0.00 b0.21 ± 0.01 ab0.22 ± 0.01 b0.19 ± 0.01 a
∑MUFA34.24 ± 0.23 a35.49 ± 0.29 ab36.73 ± 0.55 bc37.74 ± 0.52 cd39.67 ± 0.63 d
18:2n-611.89 ± 0.1812.16 ± 0.0611.96 ± 0.0911.85 ± 0.1112.22 ± 0.33
18:3n-60.18 ± 0.01 c0.18 ± 0.00 bc0.16 ± 0.01 ab0.15 ± 0.00 a0.16 ± 0.00 ab
20:2n-60.76 ± 0.020.81 ± 0.010.77 ± 0.010.79 ± 0.030.76 ± 0.01
20:4n-60.13 ± 0.01 b0.12 ± 0.01 ab0.10 ± 0.01 ab0.10 ± 0.00 ab0.09 ± 0.01 a
∑n-6 PUFA12.96 ± 0.1913.27 ± 0.0612.99 ± 0.0912.90 ± 0.1413.23 ± 0.33
20:3n-30.61 ± 0.010.61 ± 0.030.55 ± 0.010.54 ± 0.010.55 ± 0.03
20:5n-35.75 ± 0.10 c5.56 ± 0.07 bc5.08 ± 0.21 ab4.64 ± 0.05 a4.72 ± 0.17 a
22:5n-34.23 ± 0.17 b4.15 ± 0.07 ab3.88 ± 0.20 ab3.72 ± 0.09 ab3.55 ± 0.09 a
22:6n-36.92 ± 0.22 c6.60 ± 0.16 c5.89 ± 0.06 b5.32 ± 0.11 ab5.07 ± 0.10 a
∑n-3 PUFA17.51 ± 0.49 c16.92 ± 0.14 c15.40 ± 0.14 b14.22 ± 0.08 ab13.88 ± 0.25 a
∑n-3/∑n-61.35 ± 0.02 d1.28 ± 0.00 c1.19 ± 0.01 b1.10 ± 0.01 a1.05 ± 0.02 a
Data in a same row not sharing a same superscript letter are significantly different (p ˂ 0.05). TFA: total fatty acid; SFA: saturated fatty acid; MUFA: monounsaturated fatty acid; n-6 PUFA: n-6 poly-unsaturated fatty acid; n-3 PUFA: n-3 polyunsaturated fatty acid.
Table 5. Formulation and proximate composition of the experimental diets (% dry matter basis).
IngredientsFO25PO50PO75POPO
Fish meal4242424242
Corn gluten meal88888
Soybean meal1414141414
Wheat meal20.6820.6820.6820.6820.68
Brewer’s yeast55555
Mineral premix 10.50.50.50.50.5
Vitamin premix 111111
Monocalcium phosphate11111
L-ascorbyl-2-polyphosphate0.20.20.20.20.2
Choline chloride0.20.20.20.20.2
Betaine0.30.30.30.30.3
Ethoxyquin0.020.020.020.020.02
Mold inhibitor 20.10.10.10.10.1
Soya lecithin11111
Fish oil 364.531.50
Poultry oil01.534.56
Proximate composition
Crude protein45.4045.8445.6546.2646.23
Crude lipid9.3110.069.9910.089.89
Ash9.419.479.569.569.47
1 Mineral premix and vitamin premix, designed for marine fish, were purchased from Qingdao Master Biotech Co., Ltd., Qingdao, China. 2 Contained 50% calcium propionic acid and 50% fumaric acid. 3 Fish oil, purchased from Qingdao Surgreen Bioengineering Co., Ltd., is on-board processed anchovy oil.
Table 6. Fatty acid composition of fish oil, poultry oil, and experimental diets (%TFA).
Fatty AcidOilDiet
Fish OilPoultry OilFO25PO50PO75POPO
14:05.330.585.554.764.063.352.69
16:018.6026.6121.2422.3222.9923.6424.99
18:04.585.604.584.764.794.764.94
∑SFA28.5132.7931.3731.8431.8431.7532.62
16:1n-75.342.916.175.745.154.754.60
18:1n-916.1244.3015.1218.7622.1125.5129.73
20:1n-91.480.420.970.850.710.570.46
∑MUFA22.9447.6322.2525.3527.9730.8434.80
18:2n-612.2815.1113.2514.2014.4114.6315.11
20:2n-60.220.120.220.220.190.180.17
20:4n-60.550.210.680.690.600.580.52
22:2n-60.38ND0.330.280.240.170.12
∑n-6 PUFA13.4315.4414.4815.3815.4515.5615.92
18:3n-31.690.691.521.381.281.121.03
20:5n-38.150.069.668.387.246.075.11
22:5n-30.820.031.171.050.980.850.77
22:6n-38.970.027.366.175.244.022.95
∑n-3 PUFA19.630.8019.7016.9814.7412.069.87
∑n-3/∑n-61.460.051.361.100.950.770.62
TFA: total fatty acid; SFA: saturated fatty acid; MUFA: mono-unsaturated fatty acid; n-6 PUFA: n-6 poly-unsaturated fatty acid; n-3 PUFA: n-3 polyunsaturated fatty acid; ND: nondetectable.
Disclaimer/Publisher’s Note: The statements, opinions and data contained in all publications are solely those of the individual author(s) and contributor(s) and not of MDPI and/or the editor(s). MDPI and/or the editor(s) disclaim responsibility for any injury to people or property resulting from any ideas, methods, instructions or products referred to in the content.

