
Bioinformatics and Next-Generation Data Analysis for Identification of Genes and Molecular Pathways Involved in Subjects with Diabetes and Obesity
 , , and
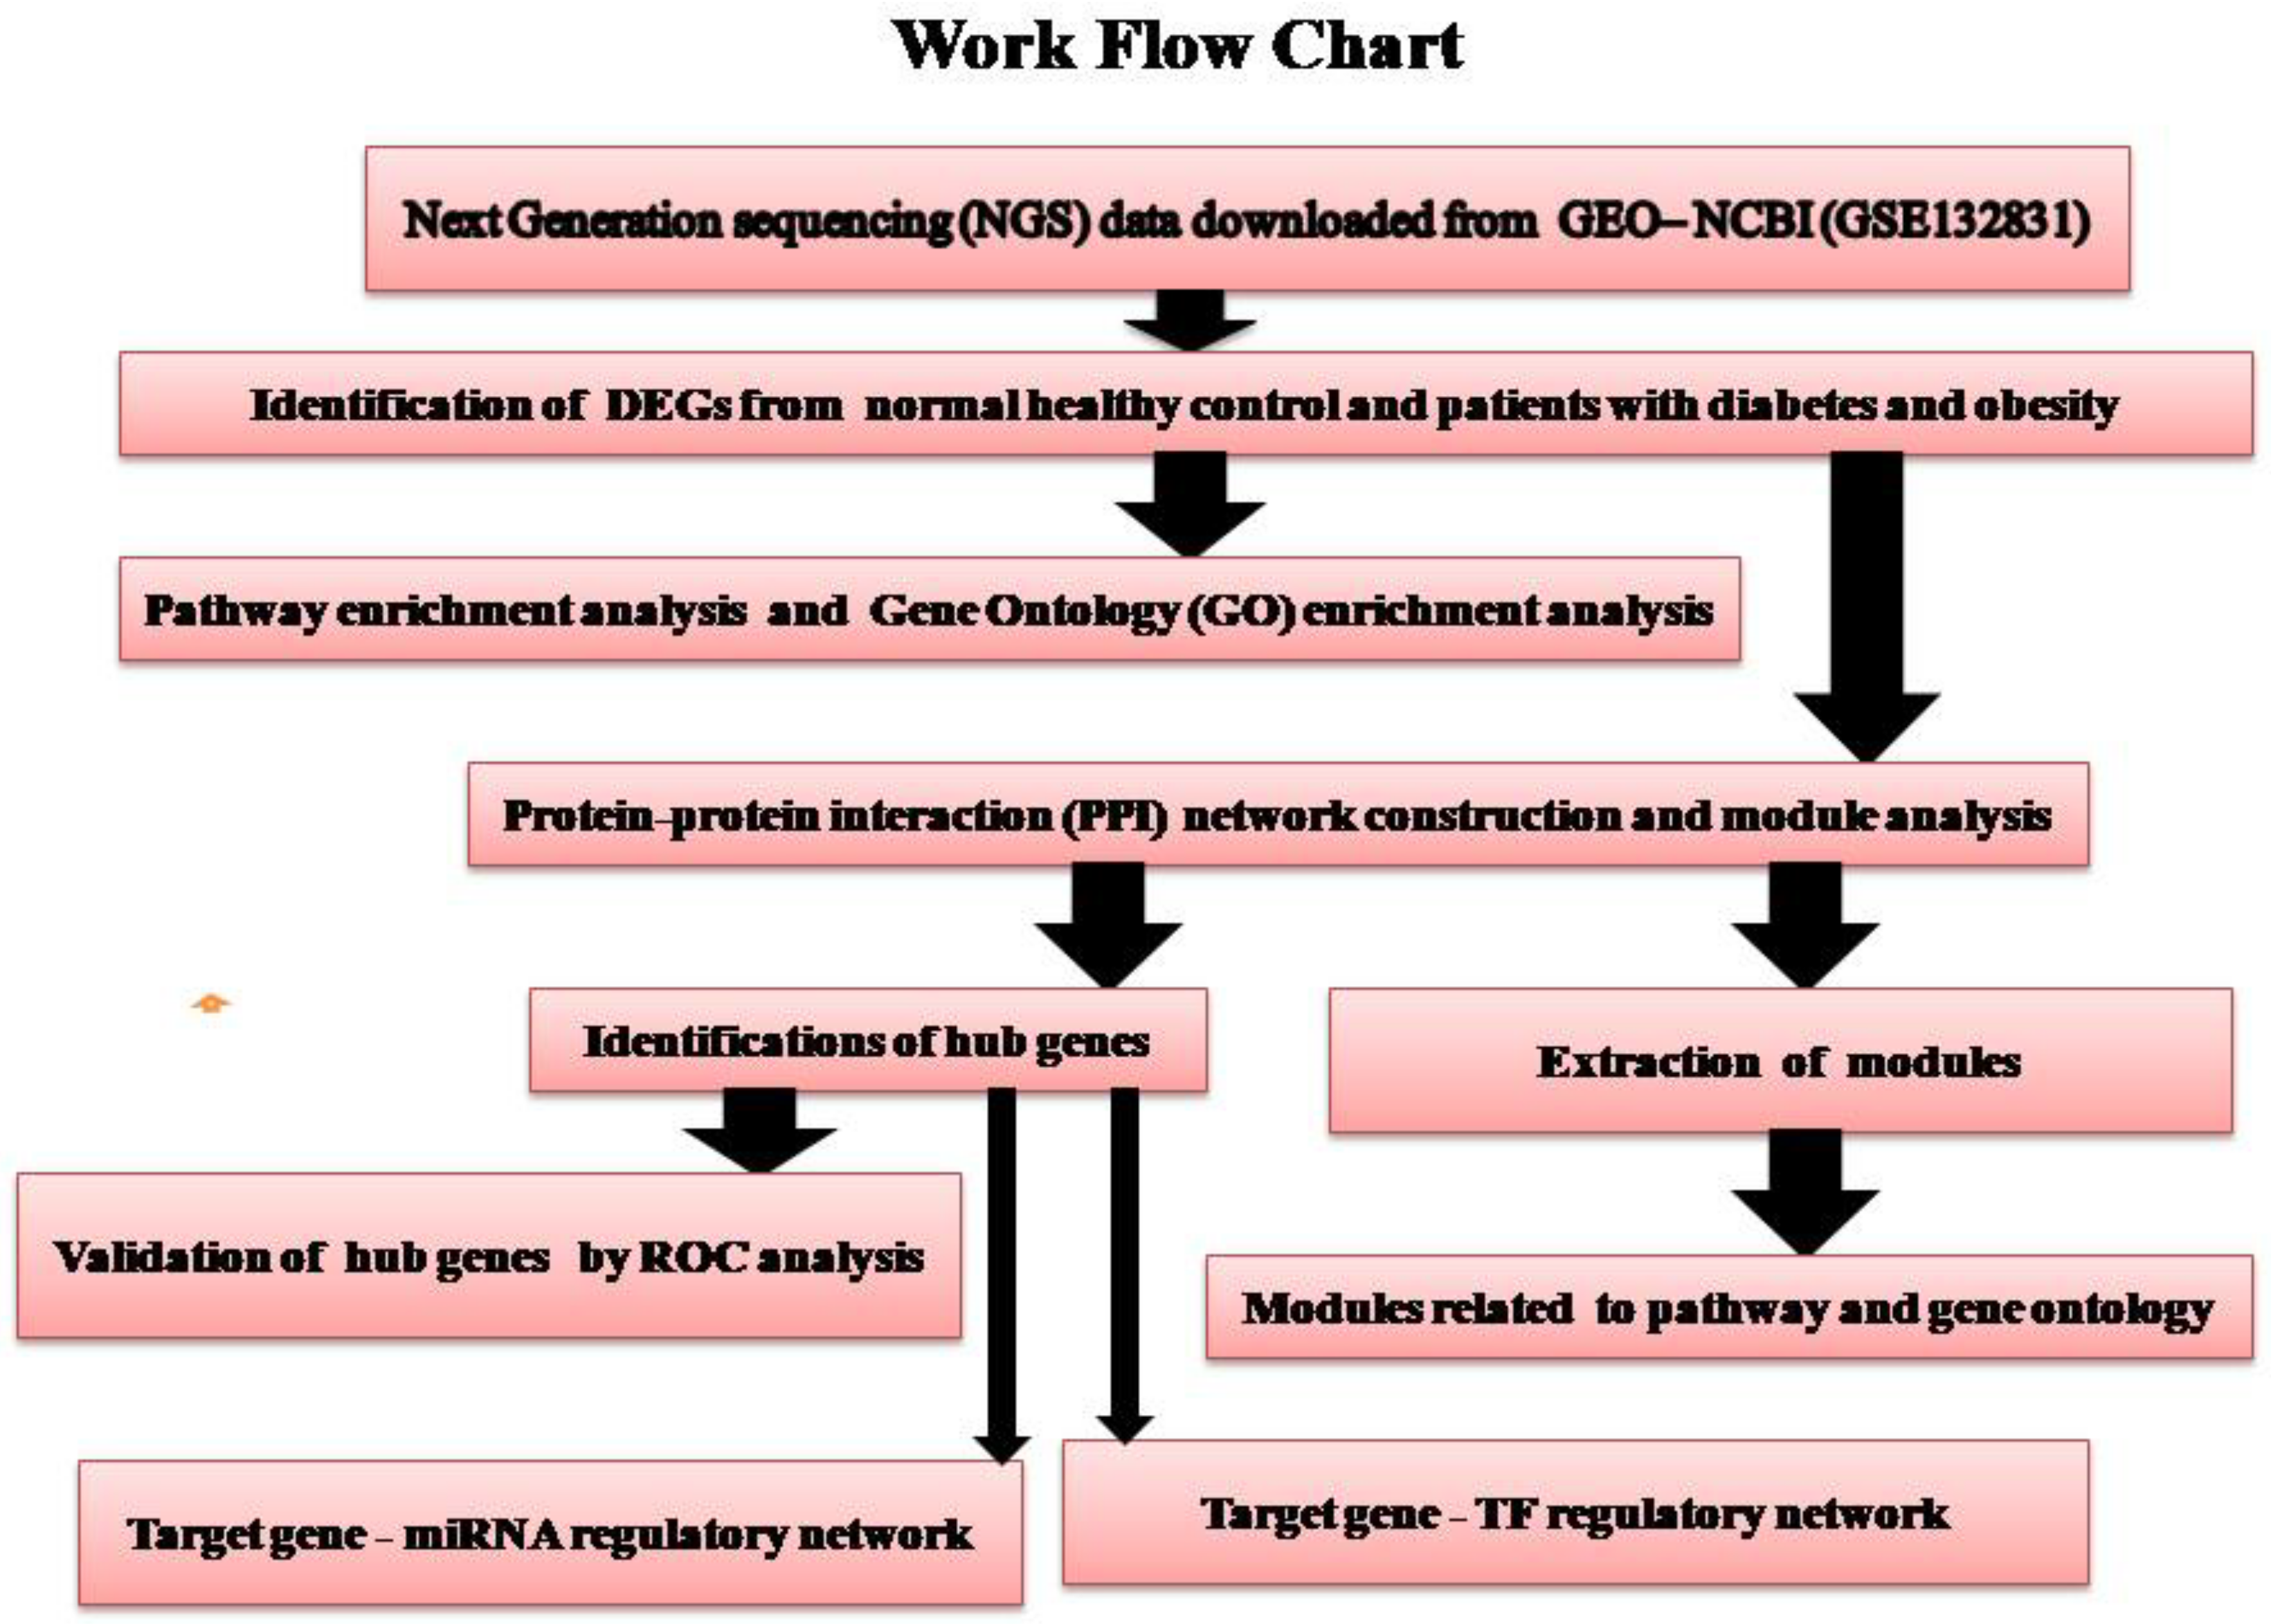
Abstract
:1. Introduction
2. Materials and Methods
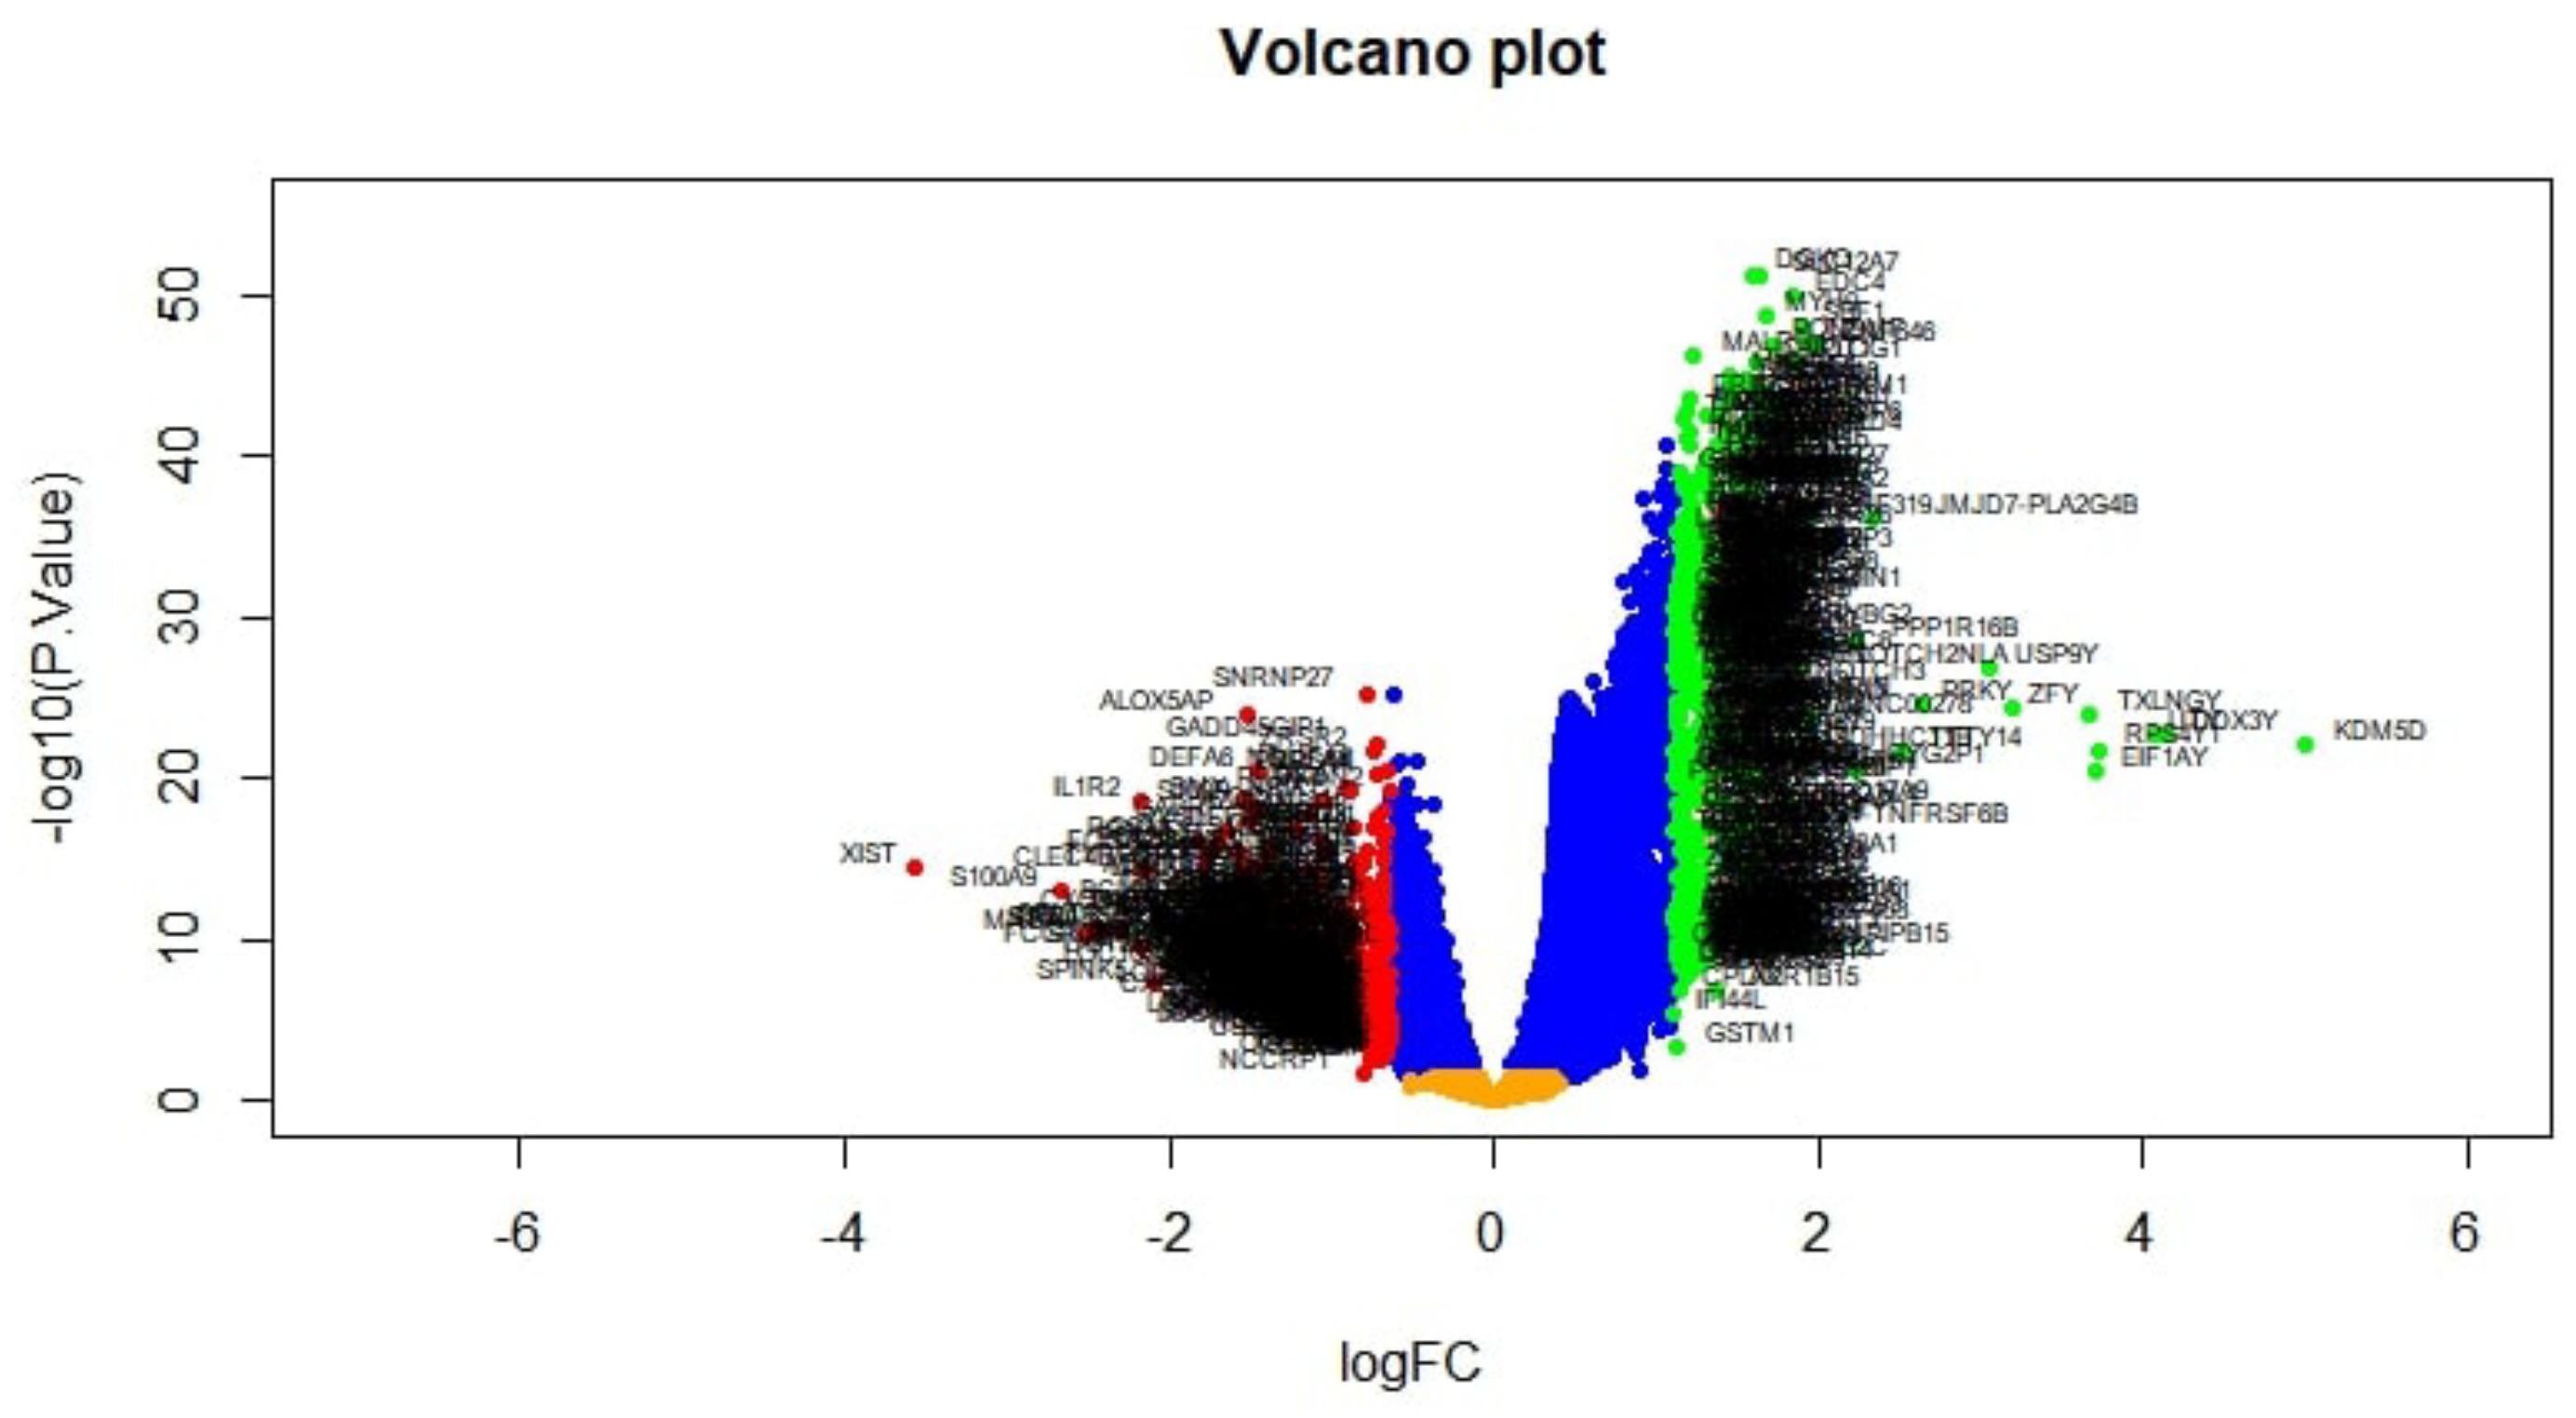
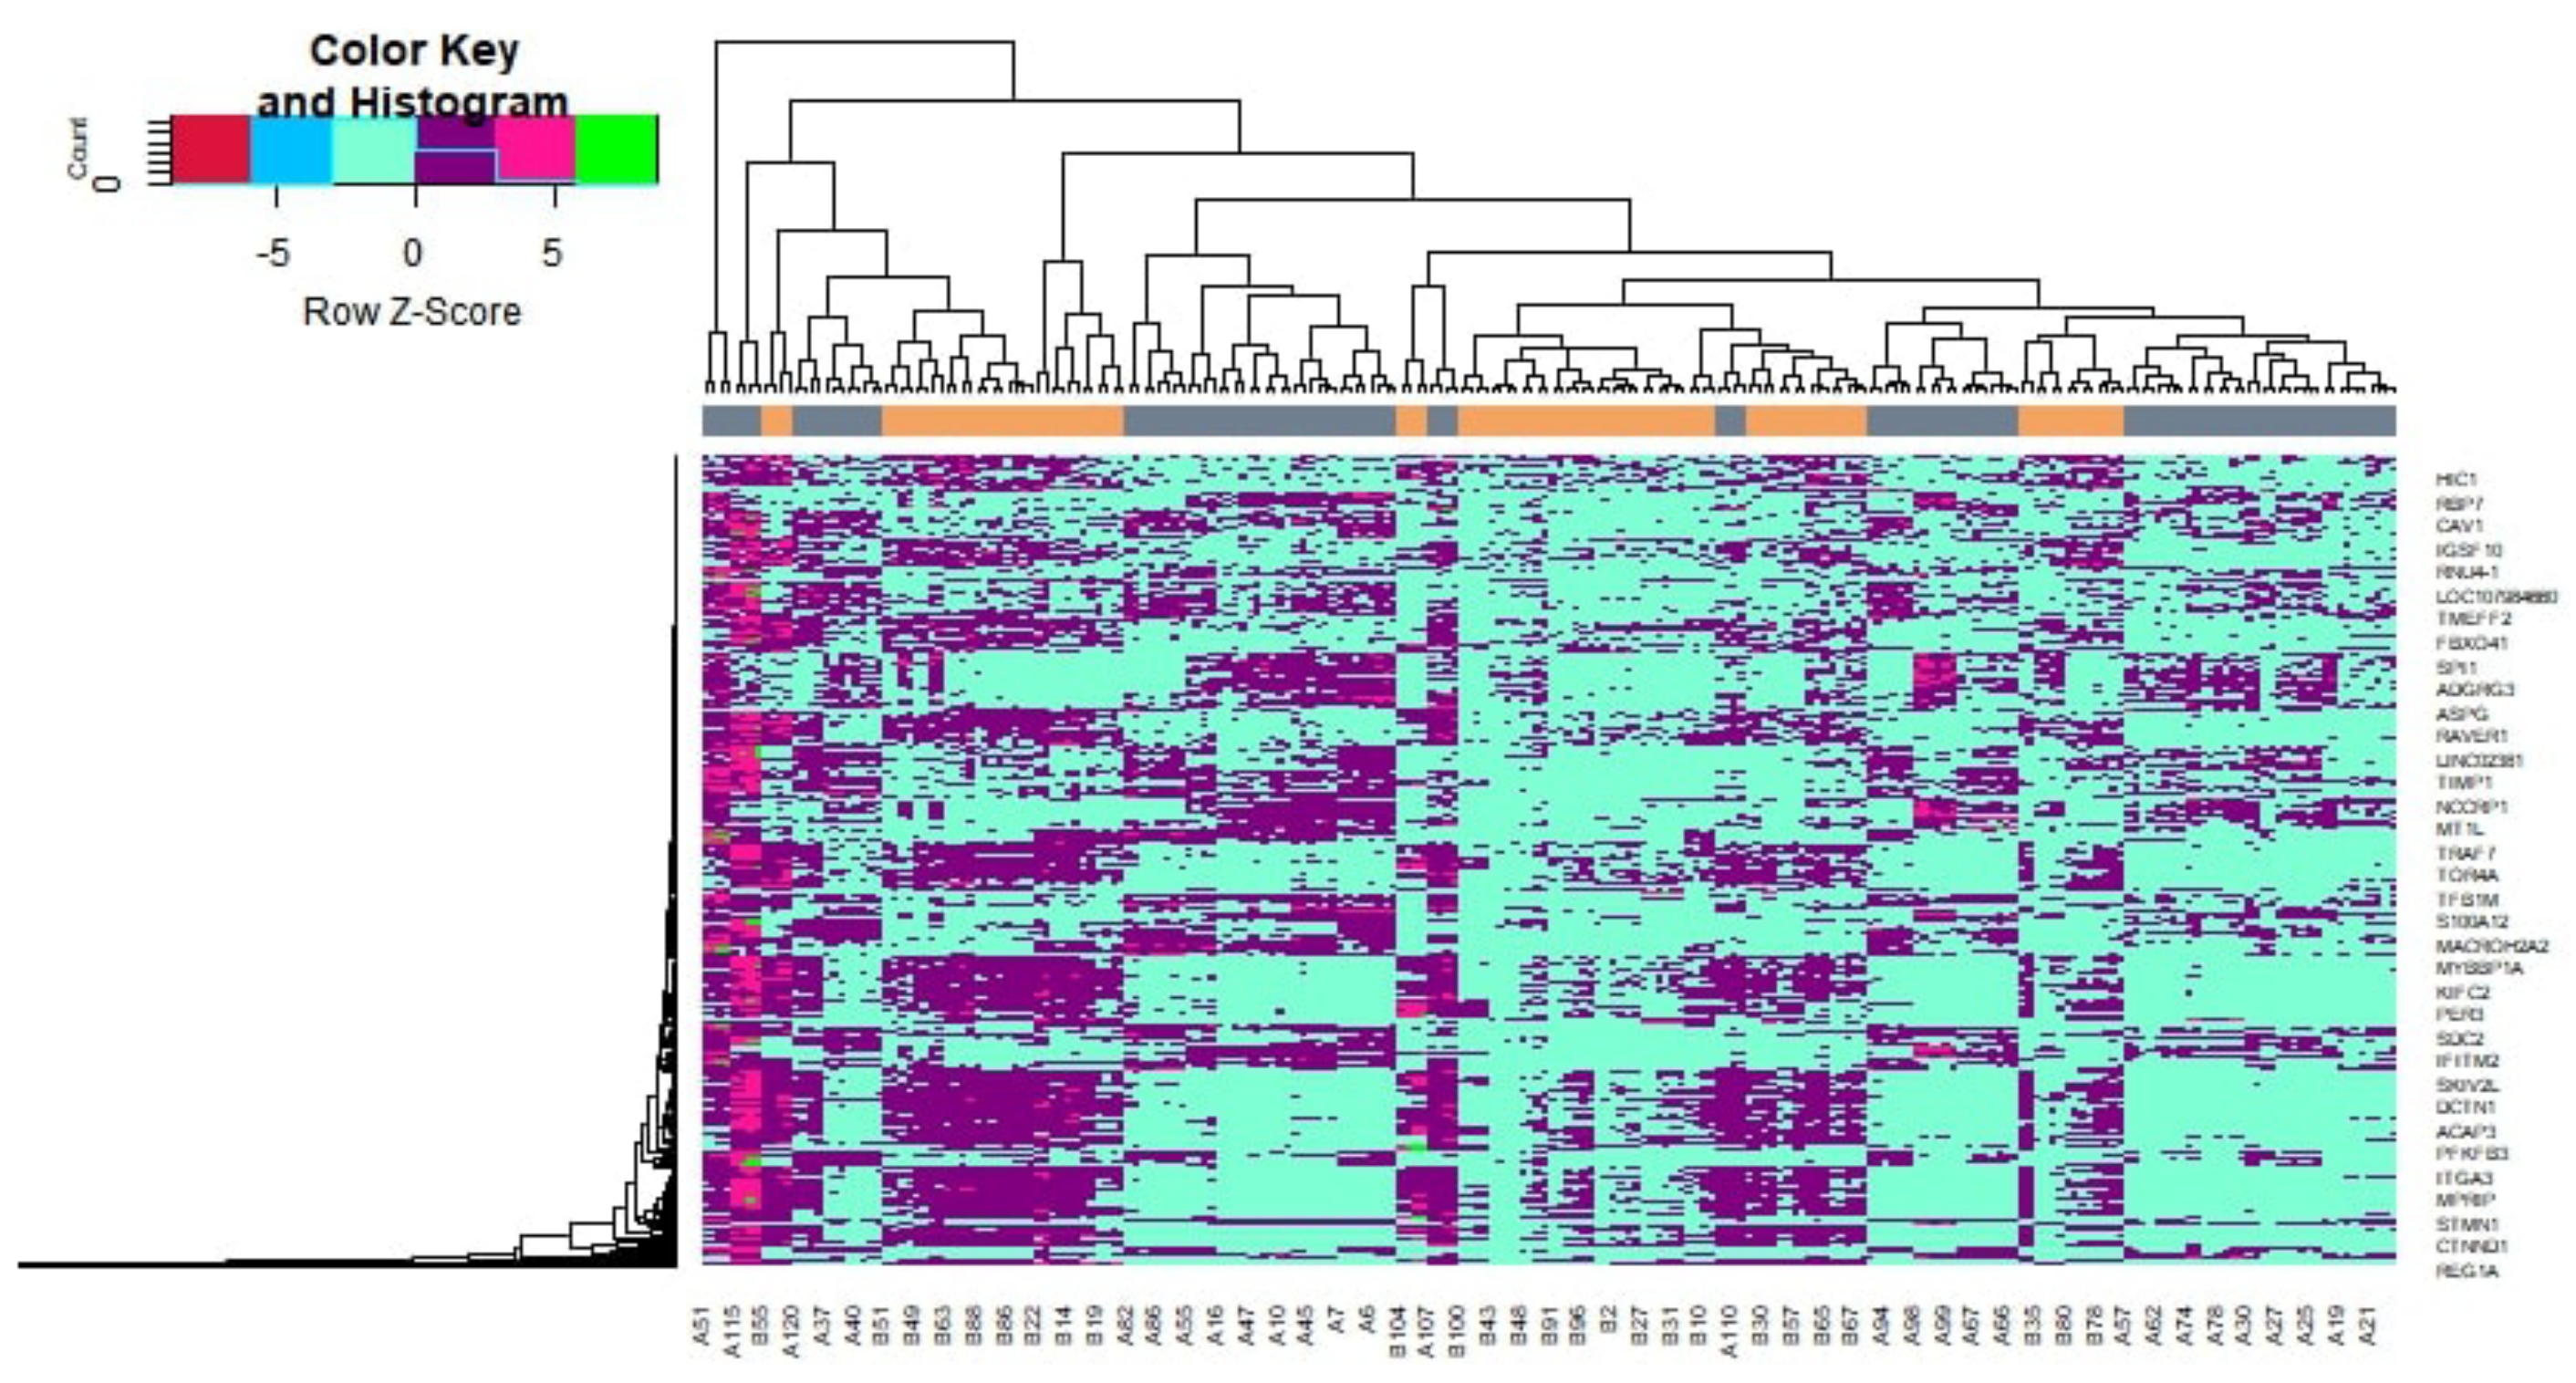
2.1. RNA Sequencing Data
2.2. Identification of DEGs
2.3. GO and Pathway Enrichment Analyses of DEGs
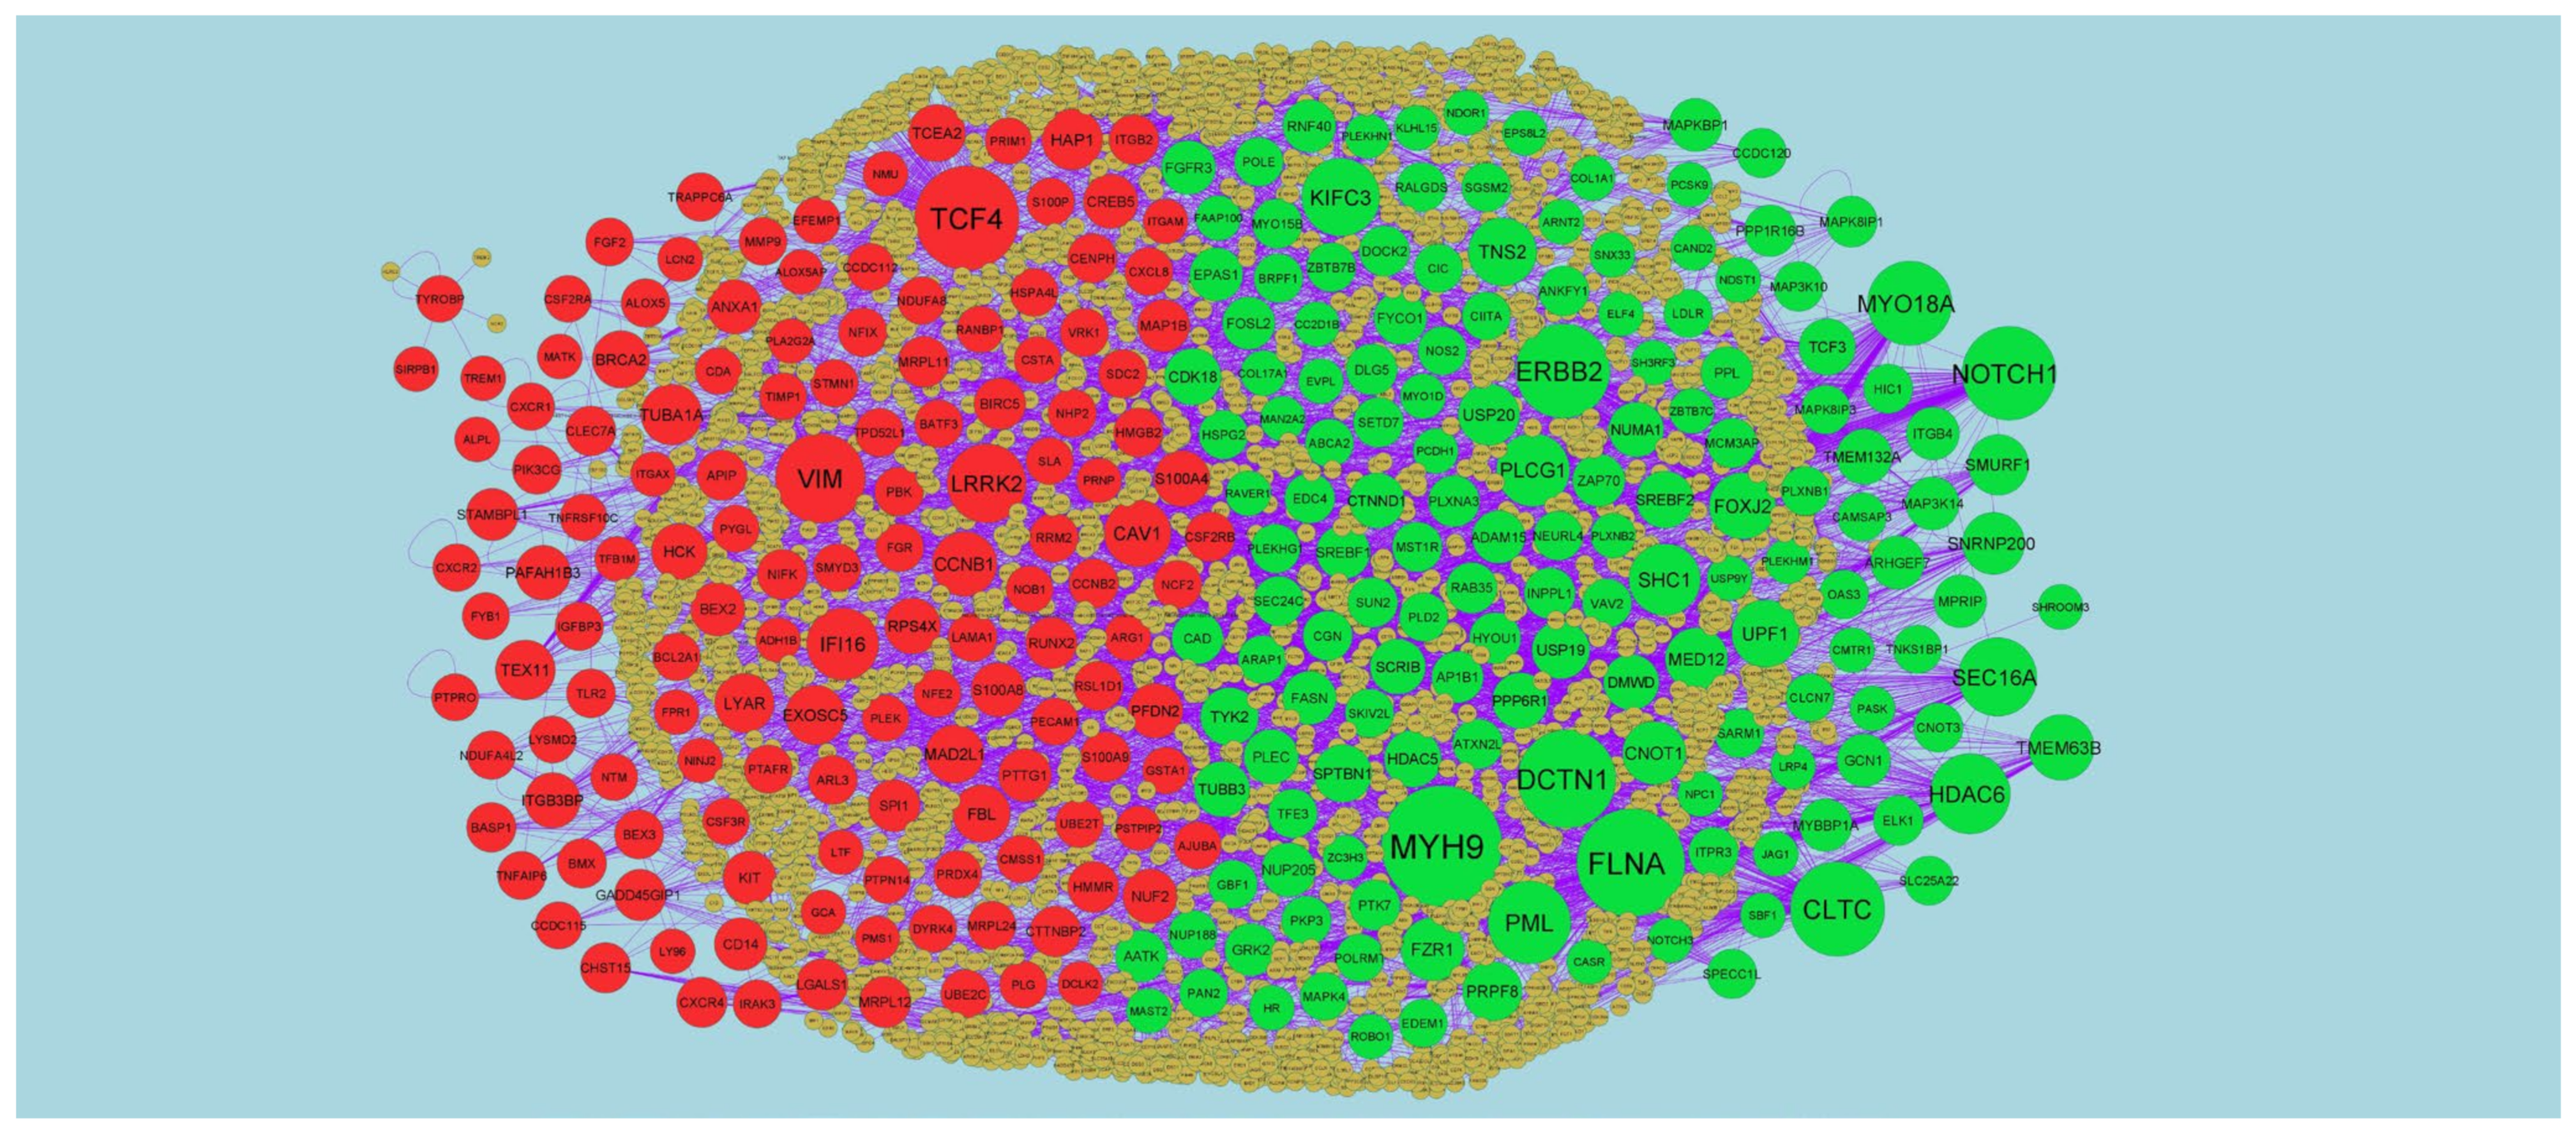
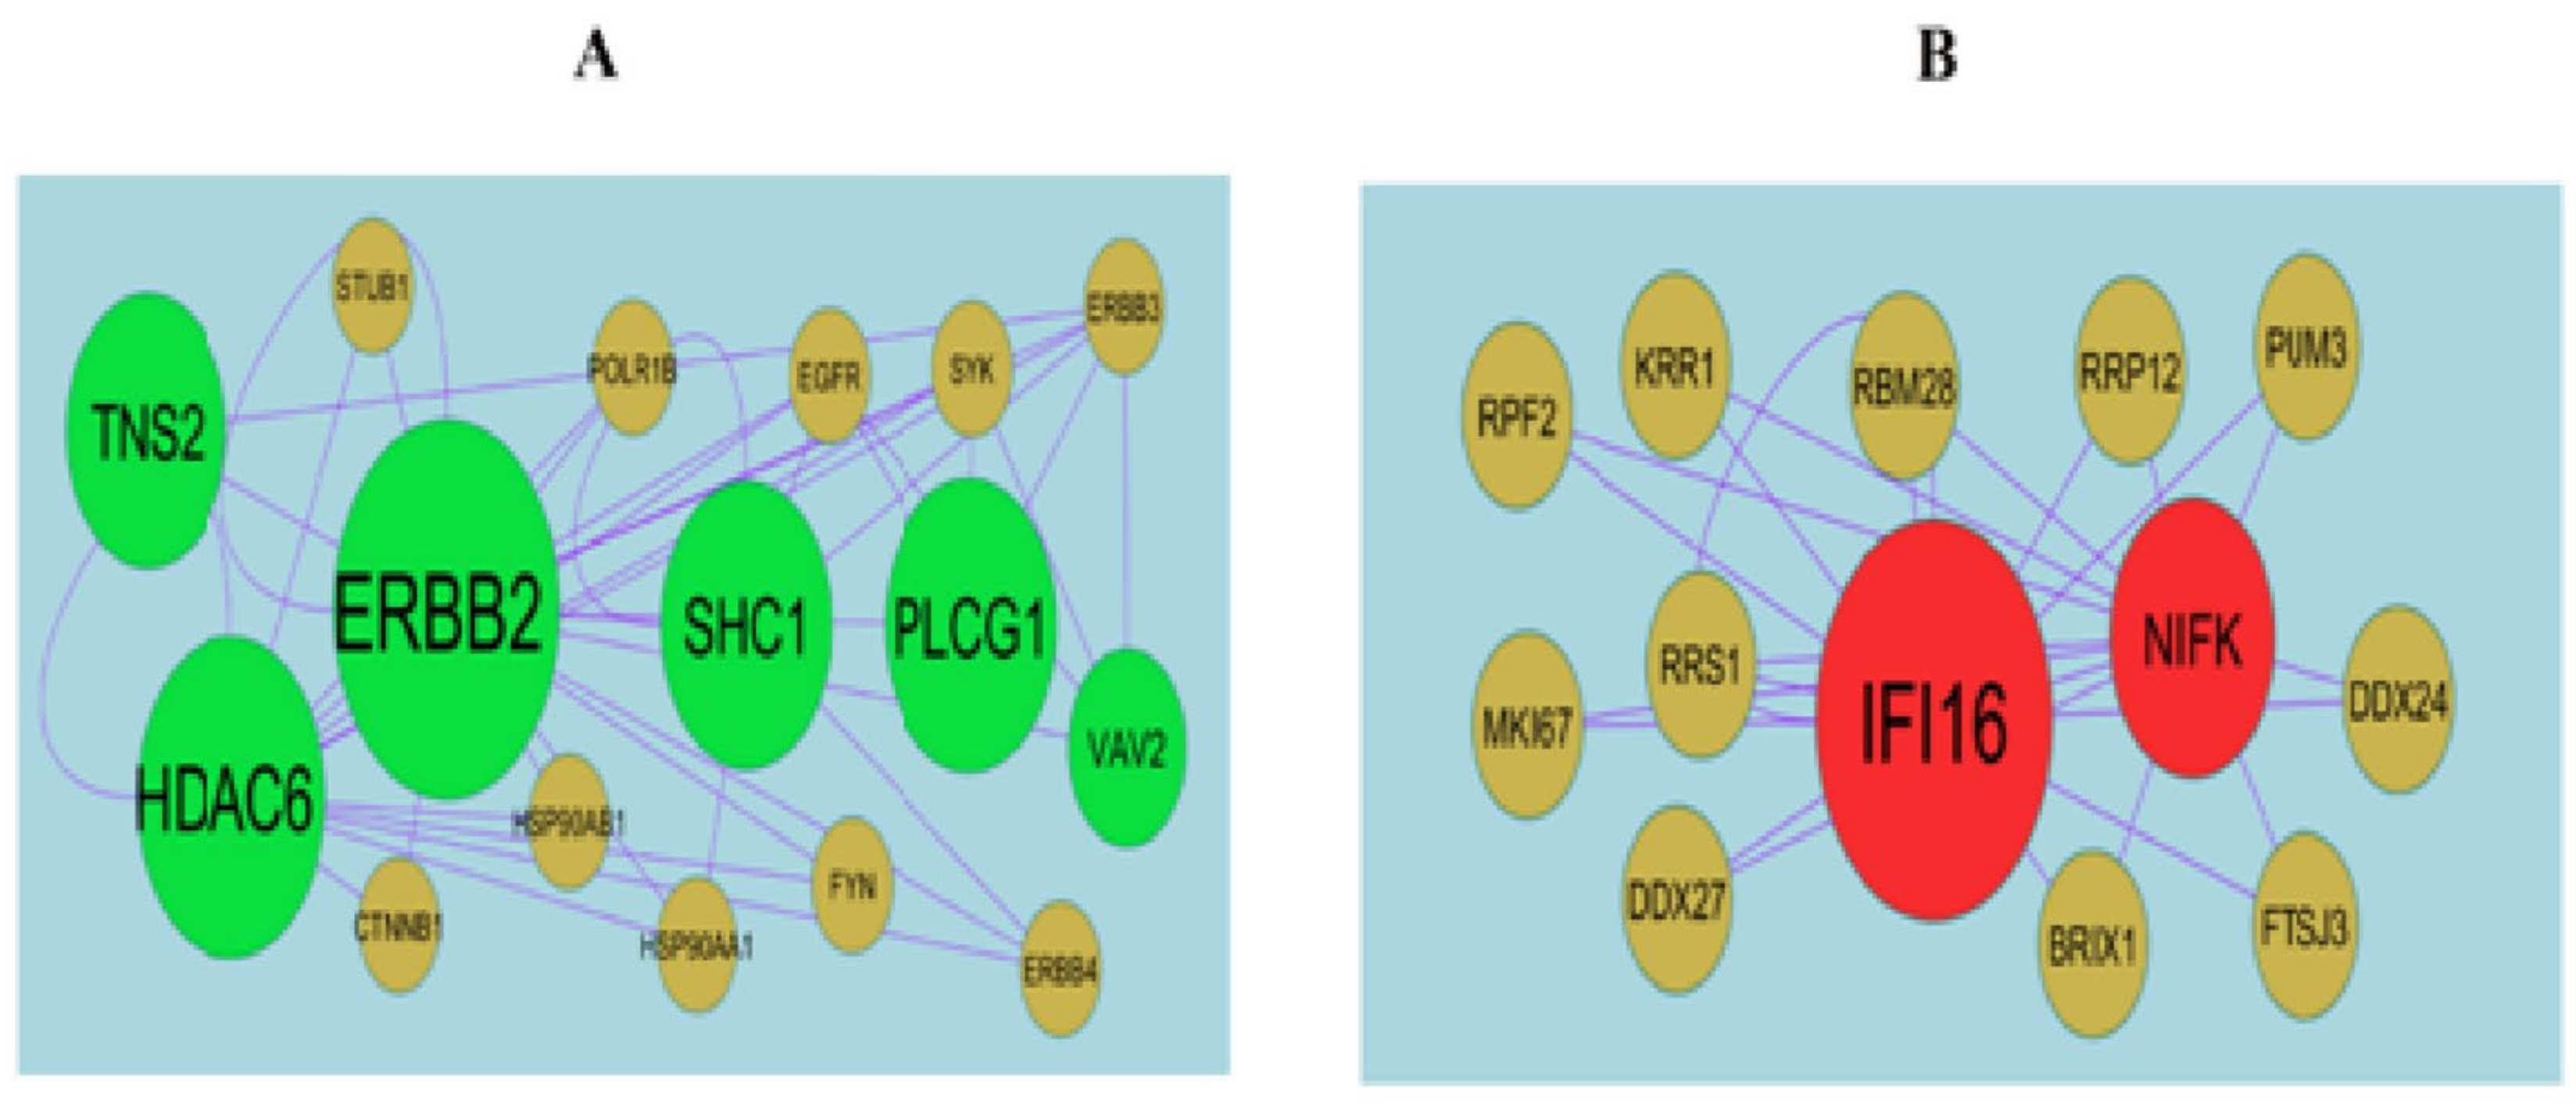
2.4. Protein–Protein Interaction (PPI) Network and Module Analysis
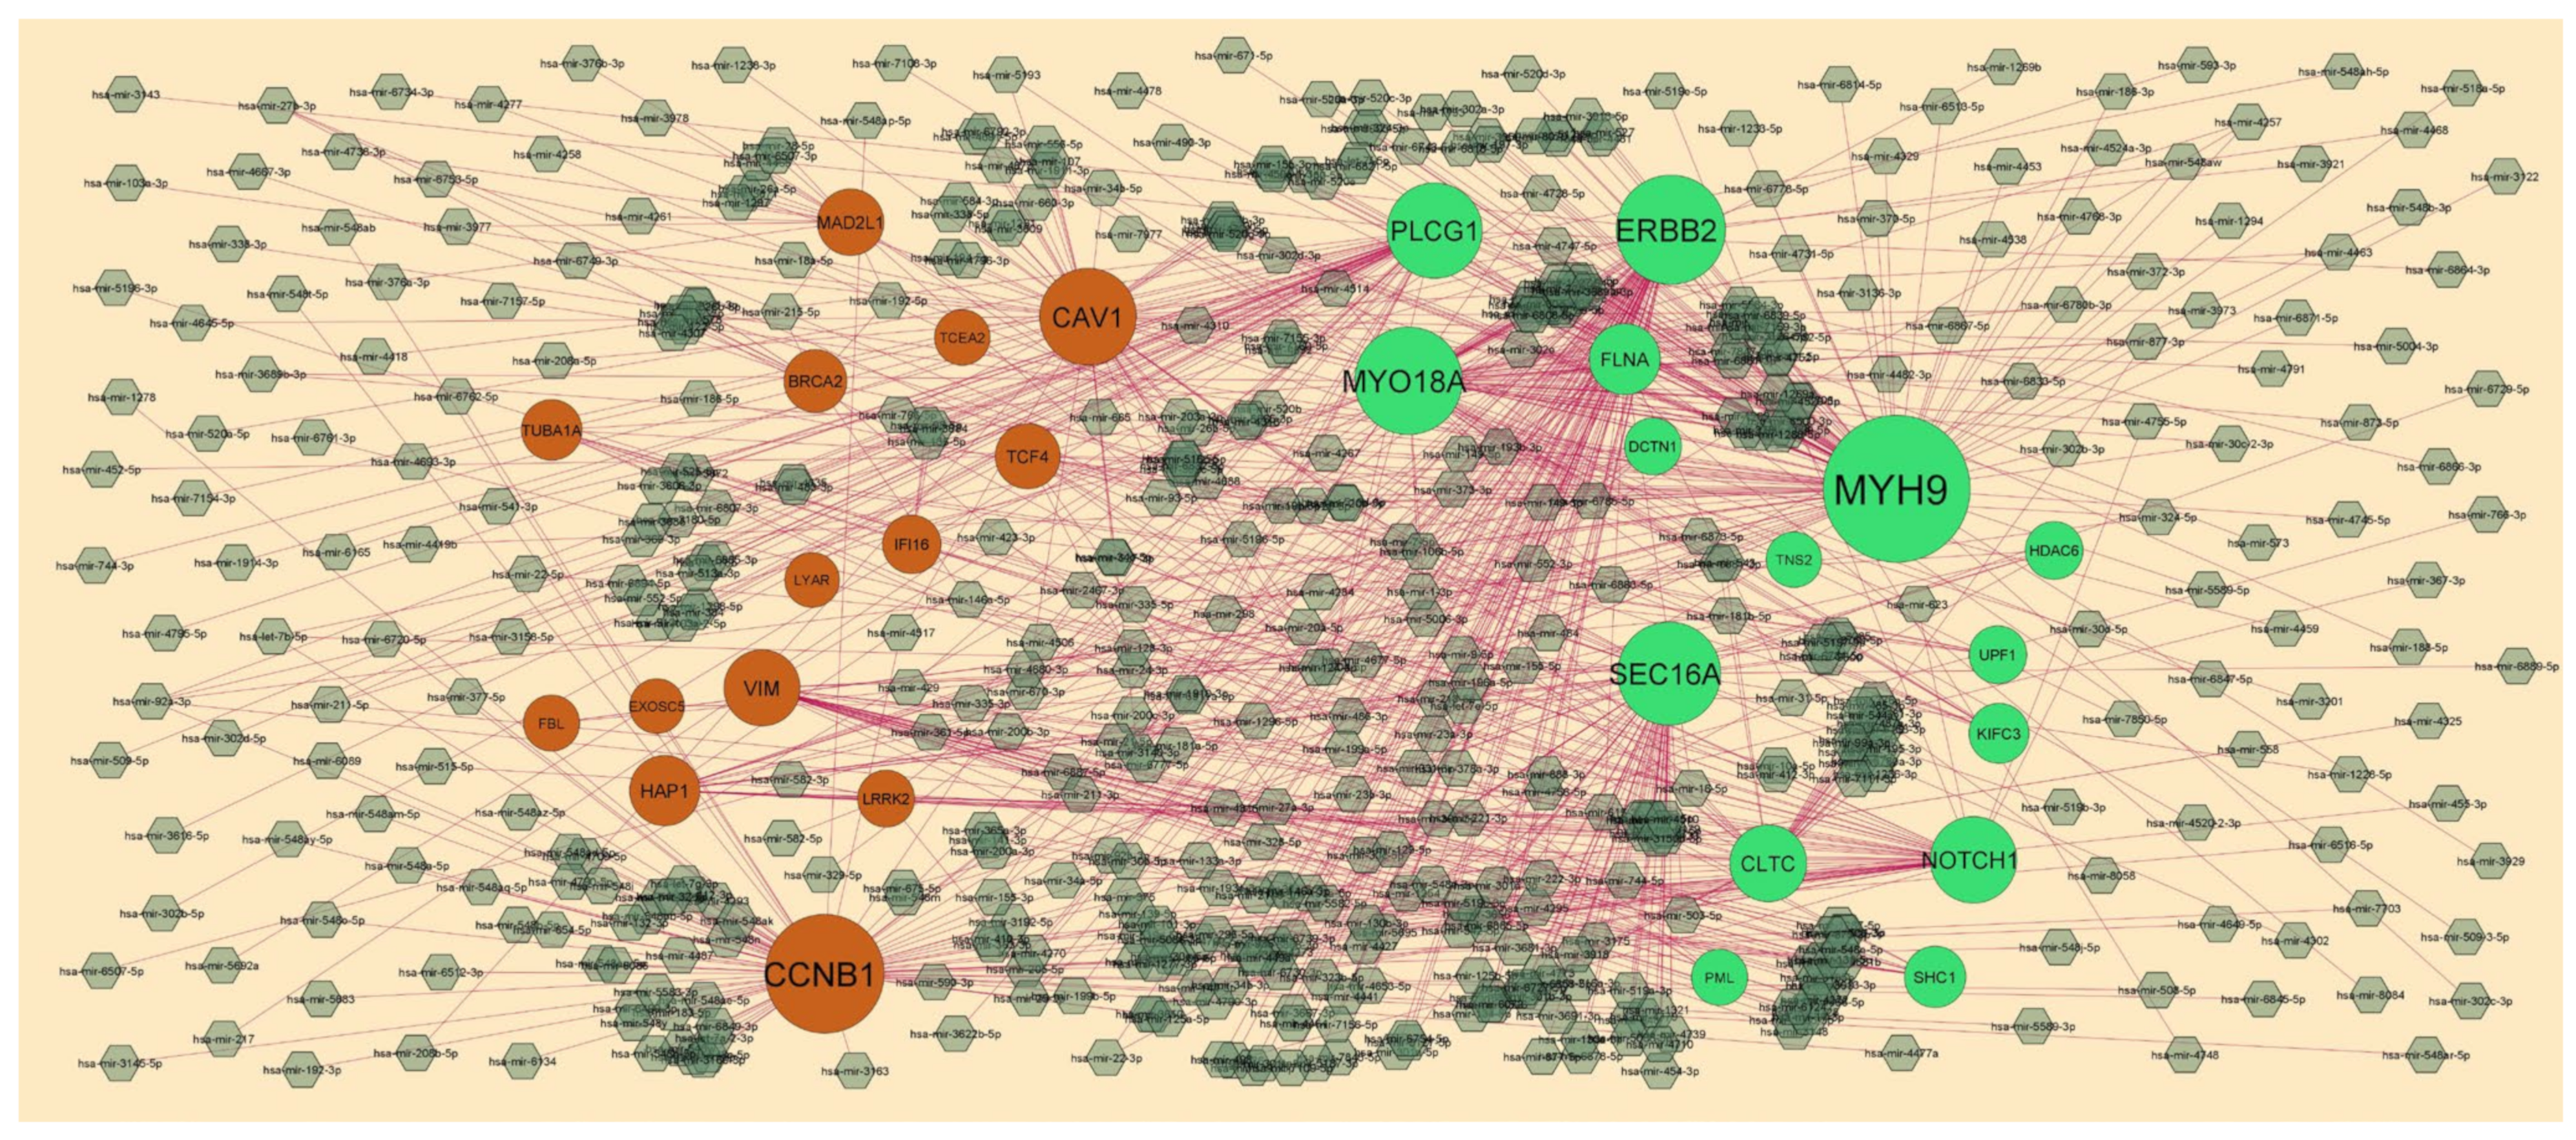
2.5. Target Gene–miRNARegulatory Network
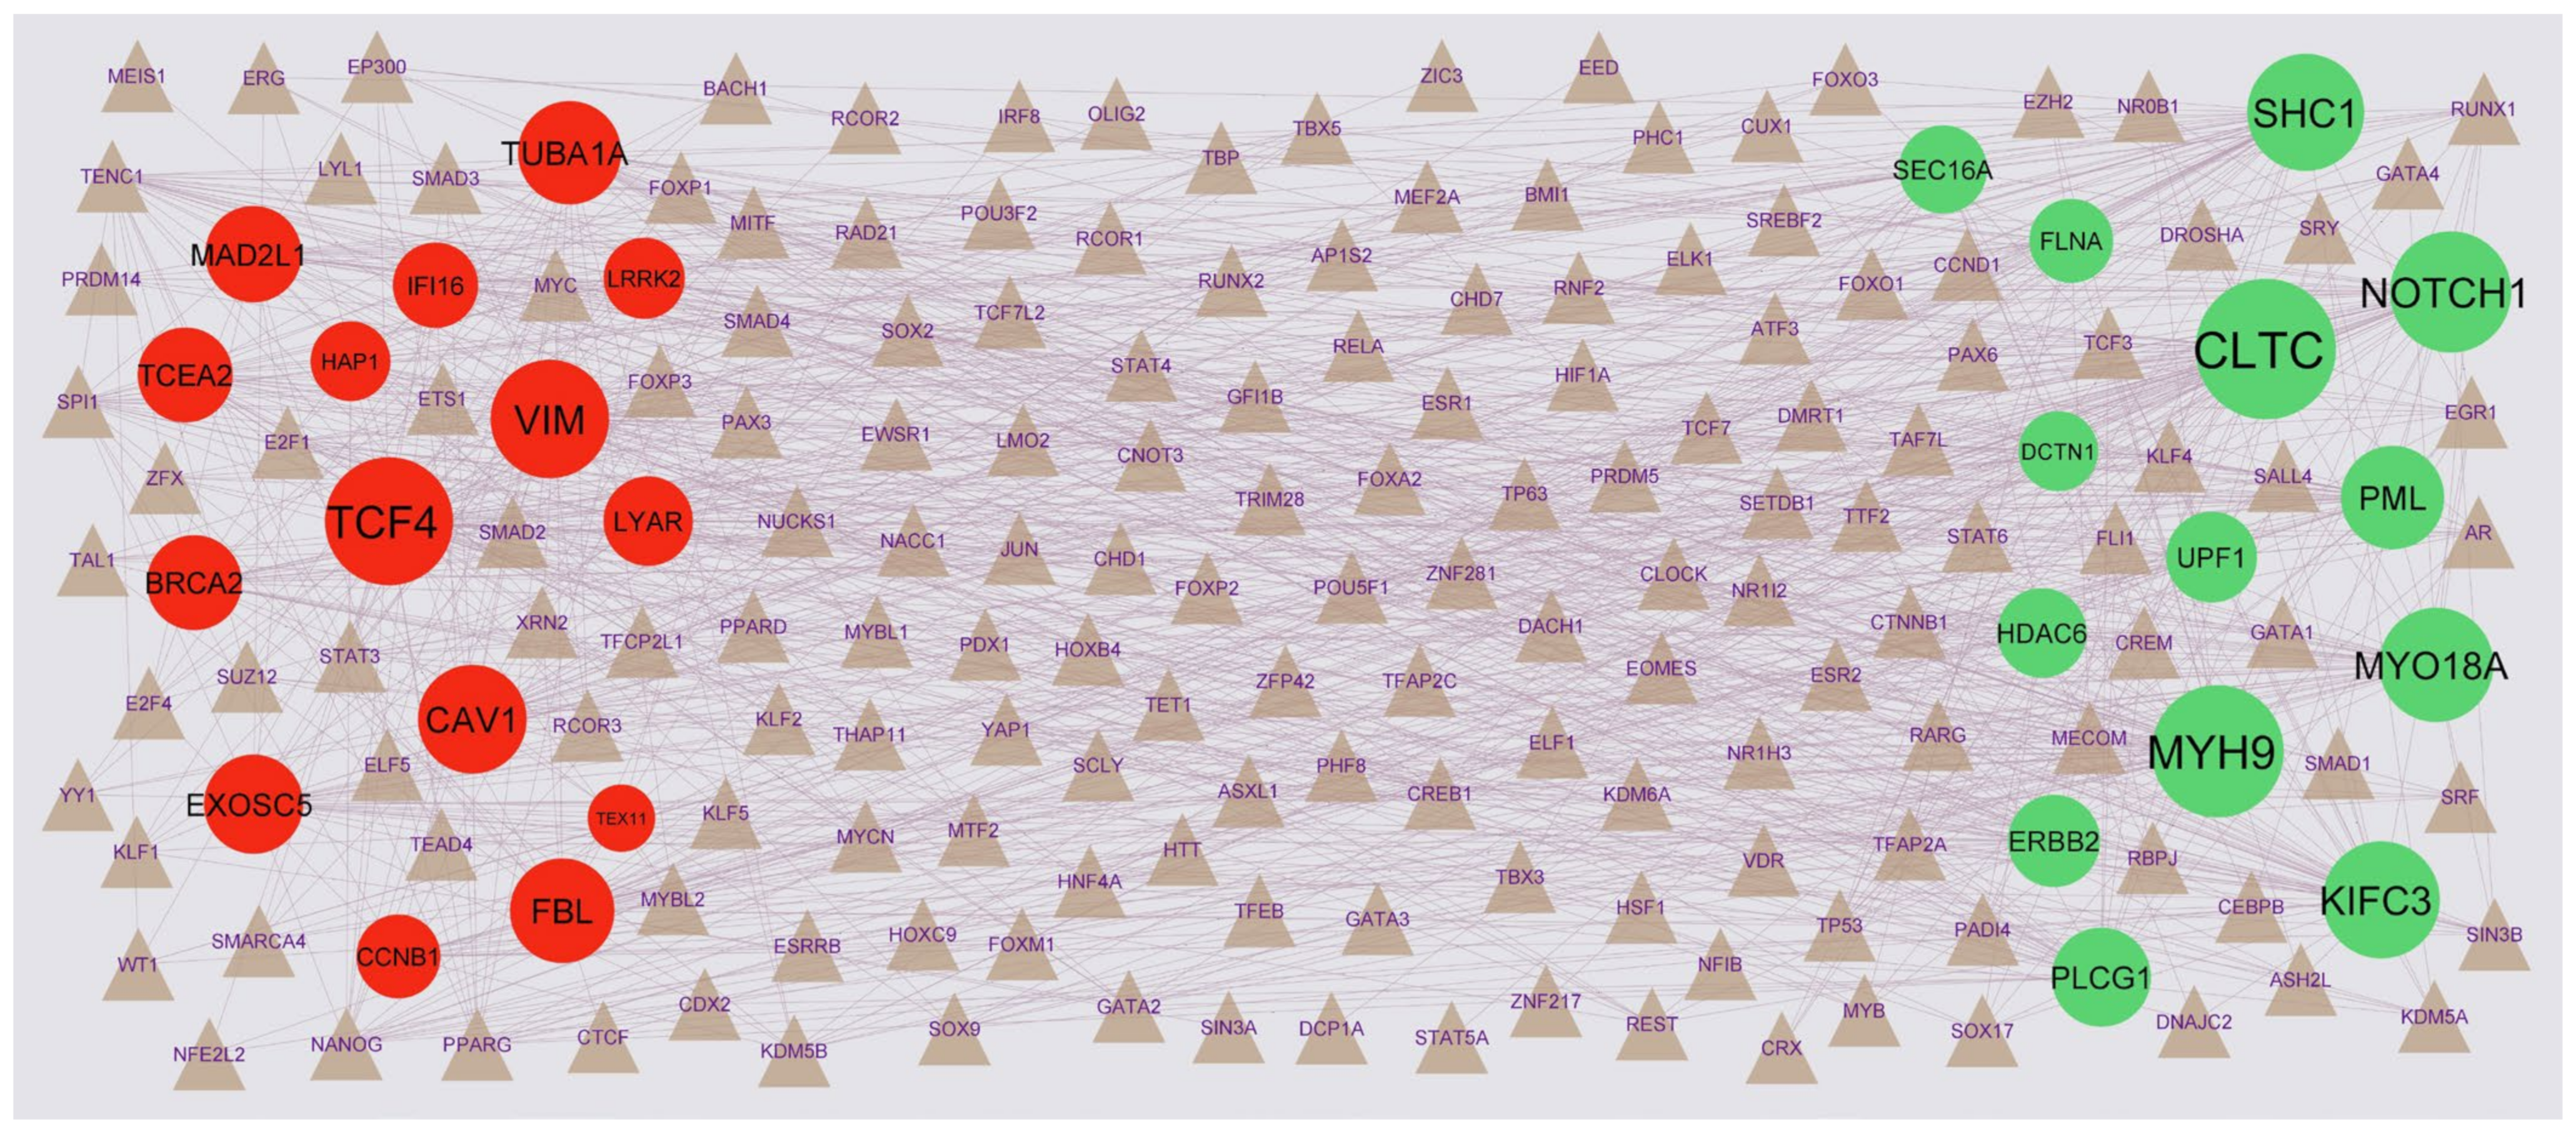
2.6. Target Gene–TF Regulatory Network
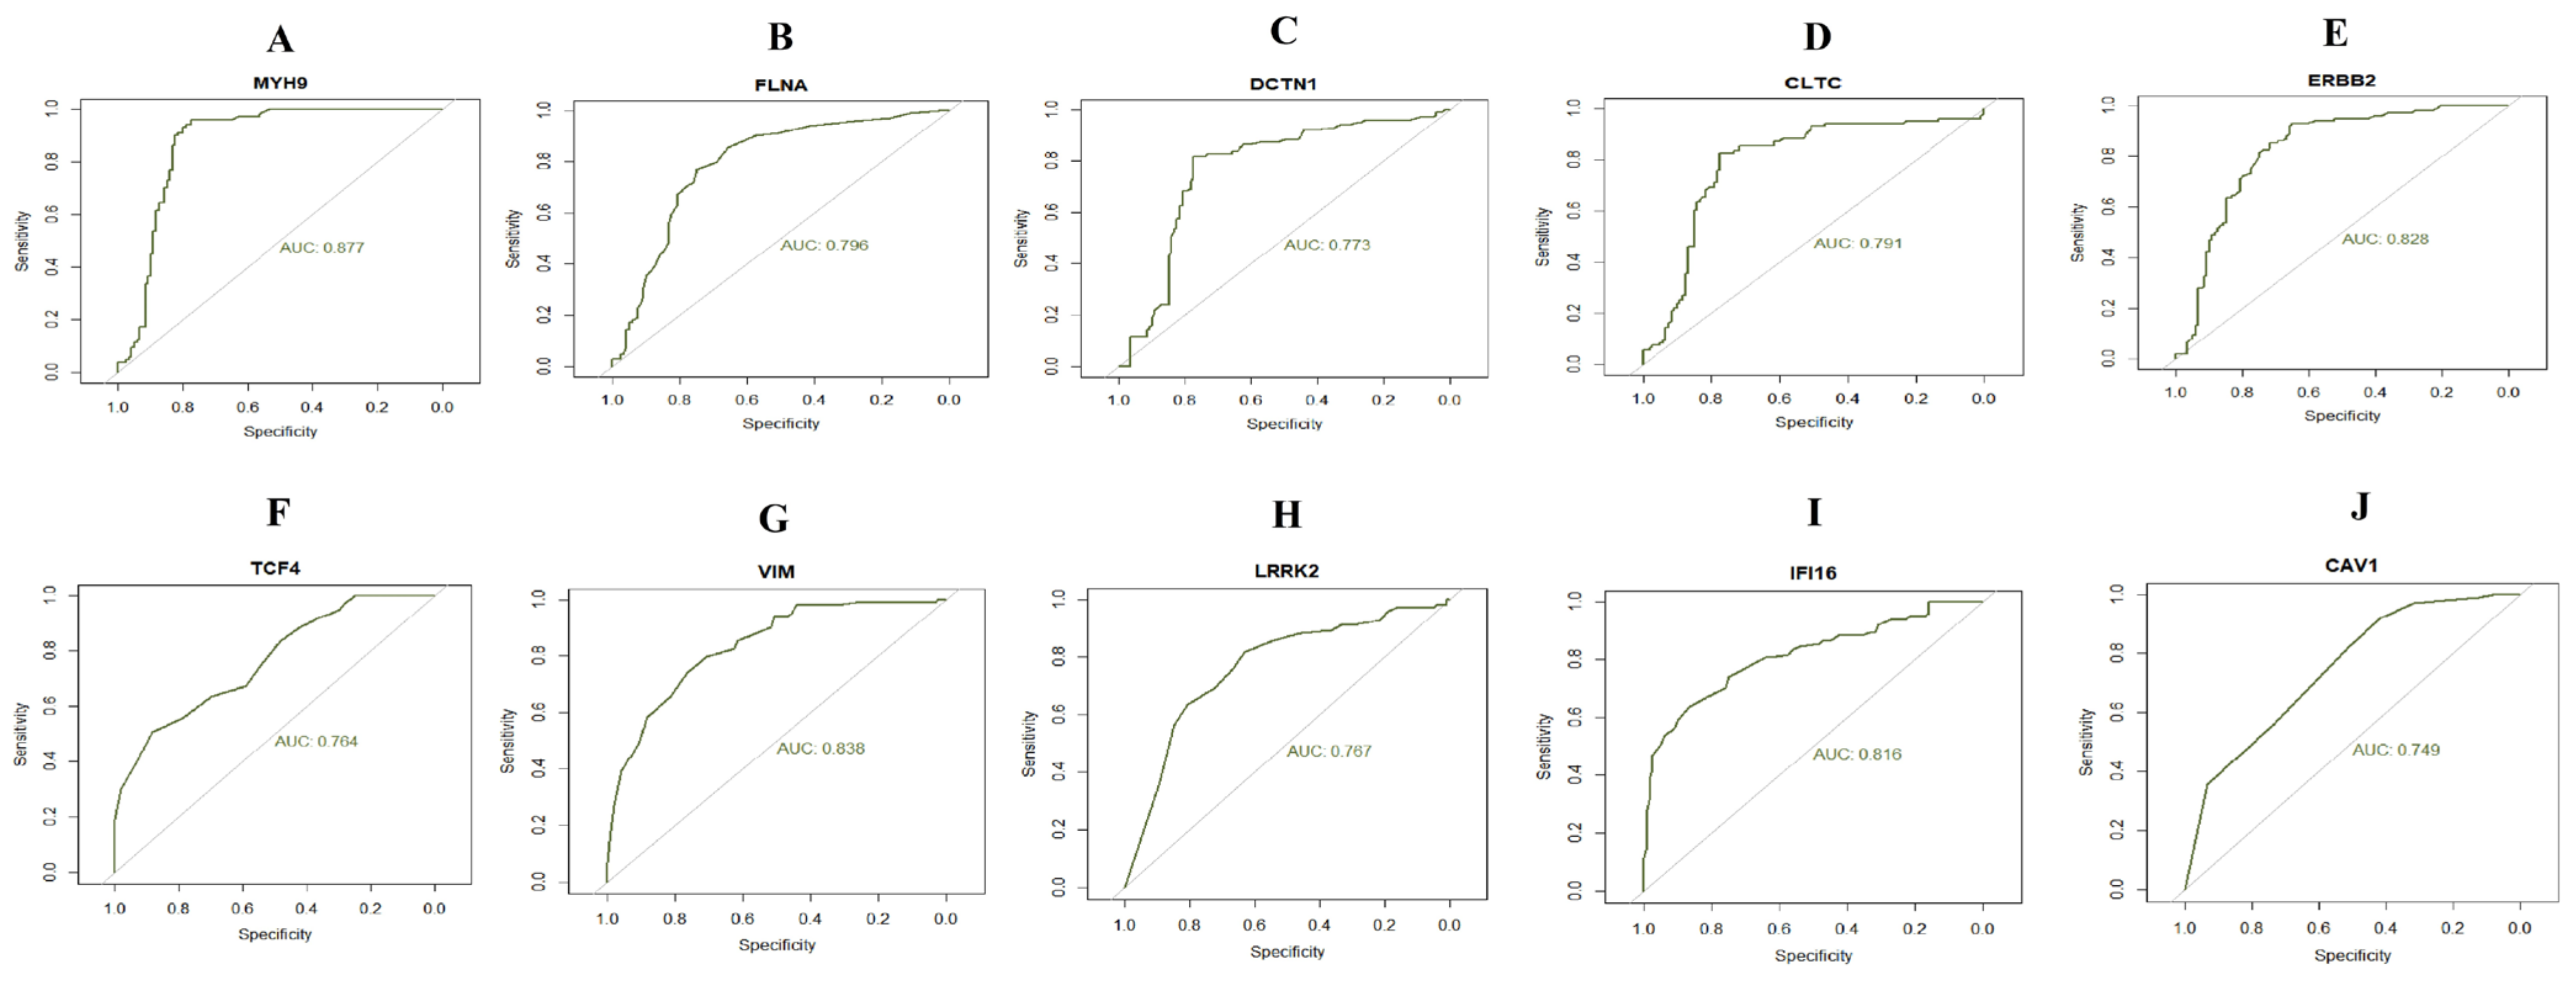
2.7. Receiver Operating Characteristic (ROC) Analysis
3. Results
3.1. Identification of DEGs
3.2. GO and Pathway Enrichment Analyses of DEGs
3.3. Protein–Protein Interaction (PPI) Network and Module Analysis
3.4. Target Gene–miRNA Regulatory Network
3.5. Target Gene–TF Regulatory Network
3.6. Receiver Operating Characteristic (ROC) Analysis
4. Discussion
5. Conclusions
Supplementary Materials
Author Contributions
Funding
Institutional Review Board Statement
Informed Consent Statement
Data Availability Statement
Acknowledgments
Conflicts of Interest
References
- Hossain, P.; Kawar, B.; El Nahas, M. Obesity and Diabetes in the Developing World—A Growing Challenge. N. Engl. J. Med. 2007, 356, 213–215. [Google Scholar] [CrossRef]
- Daousi, C.; Casson, I.F.; Gill, G.V.; MacFarlane, I.A.; Wilding, J.P.; Pinkney, J.H. Prevalence of obesity in type 2 diabetes in secondary care: Association with cardiovascular risk factors. Postgrad Med. J. 2006, 82, 280–284. [Google Scholar] [CrossRef] [PubMed]
- Scherer, P.E.; Hill, J.A. Obesity, Diabetes, and Cardiovascular Diseases: A Compendium. Circ. Res. 2016, 118, 1703–1705. [Google Scholar] [CrossRef]
- Babu, G.R.; Murthy, G.V.S.; Ana, Y.; Patel, P.; Deepa, R.; Neelon, S.E.B.; Kinra, S.; Reddy, K.S. Association of obesity with hypertension and type 2 diabetes mellitus in India: A meta-analysis of observational studies. World J. Diabetes 2018, 9, 40–52. [Google Scholar] [CrossRef]
- Naseer, M.; Bibi, F.; Alqahtani, M.H.; Chaudhary, A.G.; Azhar, E.I.; Kamal, M.A.; Yasir, M. Role of Gut Microbiota in Obesity, Type 2 Diabetes and Alzheimer’s Disease. CNS Neurol. Disord. Drug Targets 2014, 13, 305–311. [Google Scholar] [CrossRef] [PubMed]
- Medina-Remón, A.; Kirwan, R.; Lamuela-Raventós, R.M.; Estruch, R. Dietary patterns and the risk of obesity, type 2 diabetes mellitus, cardiovascular diseases, asthma, and neurodegenerative diseases. Crit. Rev. Food Sci. Nutr. 2018, 58, 262–296. [Google Scholar] [CrossRef] [PubMed]
- Romao, I.; Roth, J. Genetic and Environmental Interactions in Obesity and Type 2 Diabetes. J. Am. Diet. Assoc. 2008, 108 (Suppl. 1), S24–S28. [Google Scholar] [CrossRef]
- Meyre, D.; Bouatia-Naji, N.; Tounian, A.; Samson, C.; Lecoeur, C.; Vatin, V.; Ghoussaini, M.; Wachter, C.; Hercberg, S.; Charpentier, G.; et al. Variants of ENPP1 are associated with childhood and adult obesity and increase the risk of glucose intolerance and type 2 diabetes. Nat. Genet. 2005, 37, 863–867. [Google Scholar] [CrossRef]
- Ramya, K.; Radha, V.; Ghosh, S.; Majumder, P.P.; Mohan, V. Genetic Variations in the FTO Gene Are Associated with Type 2 Diabetes and Obesity in South Indians (CURES-79). Diabetes Technol. Ther. 2011, 13, 33–42. [Google Scholar] [CrossRef]
- Huang, X.; Liu, G.; Guo, J.; Su, Z. The PI3K/AKT pathway in obesity and type 2 diabetes. Int. J. Biol. Sci. 2018, 14, 1483–1496. [Google Scholar] [CrossRef] [Green Version]
- Aamir, K.; Khan, H.U.; Sethi, G.; Hossain, M.A.; Arya, A. Wnt signaling mediates TLR pathway and promote unrestrained adipogenesis and metaflammation: Therapeutic targets for obesity and type 2 diabetes. Pharmacol. Res. 2020, 152, 104602. [Google Scholar] [CrossRef]
- Kumar, S.U.; Kumar, D.T.; Siva, R.; Doss, C.G.P.; Zayed, H. Integrative Bioinformatics Approaches to Map Potential Novel Genes and Pathways Involved in Ovarian Cancer. Front. Bioeng. Biotechnol. 2019, 7, 391. [Google Scholar] [CrossRef]
- Udhaya Kumar, S.; Thirumal Kumar, D.; Bithia, R.; Sankar, S.; Magesh, R.; Sidenna, M.; George Priya Doss, C.; Zayed, H. Analysis of Differentially Expressed Genes and Molecular Pathways in Familial Hypercholesterolemia Involved in Atherosclerosis: A Systematic and Bioinformatics Approach. Front. Genet. 2020, 11, 734. [Google Scholar] [CrossRef]
- Fu, D.; Zhang, B.; Yang, L.; Huang, S.; Xin, W. Development of an Immune-Related Risk Signature for Predicting Prognosis in Lung Squamous Cell Carcinoma. Front. Genet. 2020, 11, 978. [Google Scholar] [CrossRef]
- Li, X.; Liao, Z.; Deng, Z.; Chen, N.; Zhao, L. Combining bulk and single-cell RNA-sequencing data to reveal gene expression pattern of chondrocytes in the osteoarthritic knee. Bioengineered 2021, 12, 997–1007. [Google Scholar] [CrossRef]
- Prashanth, G.; Vastrad, B.; Tengli, A.; Vastrad, C.; Kotturshetti, I. Investigation of candidate genes and mechanisms underlying obesity associated type 2 diabetes mellitus using bioinformatics analysis and screening of small drug molecules. BMC Endocr. Disord. 2021, 21, 80. [Google Scholar] [CrossRef]
- Osinski, C.; Le Gléau, L.; Poitou, C.; de Toro-Martin, J.; Genser, L.; Fradet, M.; Soula, H.A.; Leturque, A.; Blugeon, C.; Jourdren, L.; et al. Type 2 diabetes is associated with impaired jejunal enteroendocrine GLP-1 cell lineage in human obesity. Int. J. Obes. 2020, 45, 170–183. [Google Scholar] [CrossRef]
- Clough, E.; Barrett, T. The Gene Expression Omnibus Database. Methods Mol. Biol. 2016, 1418, 93–110. [Google Scholar]
- Ritchie, M.E.; Phipson, B.; Wu, D.; Hu, Y.; Law, C.W.; Shi, W.; Smyth, G.K. Limma powers differential expression analyses for RNA-sequencing and microarray studies. Nucleic Acids Res. 2015, 43, e47. [Google Scholar] [CrossRef]
- Chen, J.; Bardes, E.E.; Aronow, B.J.; Jegga, A.G. ToppGene Suite for gene list enrichment analysis and candidate gene prioritization. Nucleic Acids Res. 2009, 37, W305–W311. [Google Scholar] [CrossRef]
- Thomas, P.D. The Gene Ontology and the Meaning of Biological Function. Methods Mol. Biol. 2017, 1446, 15–24. [Google Scholar] [PubMed] [Green Version]
- Fabregat, A.; Jupe, S.; Matthews, L.; Sidiropoulos, K.; Gillespie, M.; Garapati, P.; Haw, R.; Jassal, B.; Korninger, F.; May, B.; et al. The Reactome Pathway Knowledgebase. Nucleic Acids Res. 2018, 46, D649–D655. [Google Scholar] [CrossRef] [PubMed]
- Kotlyar, M.; Pastrello, C.; Malik, Z.; Jurisica, I. IID 2018 update: Context-specific physical protein–protein interactions in human, model organisms and domesticated species. Nucleic Acids Res. 2019, 47, D581–D589. [Google Scholar] [CrossRef] [PubMed]
- Shannon, P.; Markiel, A.; Ozier, O.; Baliga, N.S.; Wang, J.T.; Ramage, D.; Amin, N.; Schwikowski, B.; Ideker, T. Cytoscape: A software environment for integrated models of Biomolecular Interaction Networks. Genome Res. 2003, 13, 2498–2504. [Google Scholar] [CrossRef] [PubMed]
- Przulj, N.; Wigle, D.A.; Jurisica, I. Functional topology in a network of protein interactions. Bioinformatics 2004, 20, 340–348. [Google Scholar] [CrossRef]
- Nguyen, T.-P.; Liu, W.-C.; Jordán, F. Inferring pleiotropy by network analysis: Linked diseases in the human PPI network. BMC Syst. Biol. 2011, 5, 179. [Google Scholar] [CrossRef]
- Shi, Z.; Zhang, B. Fast network centrality analysis using GPUs. BMC Bioinform. 2011, 12, 149. [Google Scholar] [CrossRef]
- Fadhal, E.; Gamieldien, J.; Mwambene, E.C. Protein interaction networks as metric spaces: A novel perspective on distribution of hubs. BMC Syst. Biol. 2014, 8, 6. [Google Scholar] [CrossRef]
- Zaki, N.; Efimov, D.; Berengueres, J. Protein complex detection using interaction reliability assessment and weighted clustering coefficient. BMC Bioinform. 2013, 14, 163. [Google Scholar] [CrossRef]
- Fan, Y.; Xia, J. miRNet—Functional Analysis and Visual Exploration of miRNA–Target Interactions in a Network Context. Methods Mol. Biol. 2018, 1819, 215–233. [Google Scholar] [CrossRef]
- Zhou, G.; Soufan, O.; Ewald, J.; Hancock, R.E.W.; Basu, N.; Xia, J. NetworkAnalyst 3.0: A visual analytics platform for comprehensive gene expression profiling and meta-analysis. Nucleic Acids Res. 2019, 47, W234–W241. [Google Scholar] [CrossRef] [Green Version]
- Robin, X.; Turck, N.; Hainard, A.; Tiberti, N.; Lisacek, F.; Sanchez, J.-C.; Müller, M. pROC: An open-source package for R and S+ to analyze and compare ROC curves. BMC Bioinform. 2011, 12, 77. [Google Scholar] [CrossRef]
- Sohrabifar, N.; Ghaderian, S.M.H.; Parsa, S.A.; Ghaedi, H.; Jafari, H. Variation in the expression level of MALAT1, MIAT and XIST lncRNAs in coronary artery disease patients with and without type 2 diabetes mellitus. Arch. Physiol. Biochem. 2020, 128, 1308–1315. [Google Scholar] [CrossRef]
- Stavarachi, M.; Panduru, N.M.; Serafinceanu, C.; Moţa, E.; Moţa, M.; Cimponeriu, D.; Ion, D.A. Investigation of P213S SELL gene polymorphism in type 2 diabetes mellitus and related end stage renal disease. A case-control study. Romanian J. Morphol. Embryol. 2011, 52 (Suppl. 3), 995–998. [Google Scholar]
- Lylloff, L.; Bathum, L.; Madsbad, S.; Grundtvig, J.L.G.; Nordgaard-Lassen, I.; Fenger, M. S100A8/A9 (Calprotectin), Interleukin-6, and C-Reactive Protein in Obesity and Diabetes before and after Roux-en-Y Gastric Bypass Surgery. Obes. Facts 2017, 10, 386–395. [Google Scholar] [CrossRef]
- Gagné-Ouellet, V.; Guay, S.-P.; Boucher-Lafleur, A.-M.; Bouchard, L.; Laprise, C. DNA methylation signature of interleukin 1 receptor type II in asthma. Clin. Epigenet. 2015, 7, 80. [Google Scholar] [CrossRef]
- Martínez-Aguilar, N.E.; Del Río-Navarro, B.E.; Navarro-Olivos, E.; García-Ortíz, H.; Orozco, L.; Jiménez-Morales, S. SPINK5 and ADRB2 haplotypes are risk factors for asthma in Mexican pediatric patients. J. Asthma 2015, 52, 232–239. [Google Scholar] [CrossRef]
- Muhammad, I.F.; Borné, Y.; Bao, X.; Melander, O.; Orho-Melander, M.; Nilsson, P.M.; Nilsson, J.; Engström, G. Circulating HER2/ErbB2 Levels Are Associated With Increased Incidence of Diabetes: A Population-Based Cohort Study. Diabetes Care 2019, 42, 1582–1588. [Google Scholar] [CrossRef]
- Yu, C.-Y.; Yang, C.-Y.; Rui, Z.-L. MicroRNA-125b-5p improves pancreatic β-cell function through inhibiting JNK signaling pathway by targeting DACT1 in mice with type 2 diabetes mellitus. Life Sci. 2019, 224, 67–75. [Google Scholar] [CrossRef]
- Kulzer, J.R.; Stitzel, M.L.; Morken, M.A.; Huyghe, J.R.; Fuchsberger, C.; Kuusisto, J.; Laakso, M.; Boehnke, M.; Collins, F.S.; Mohlke, K.L. A Common Functional Regulatory Variant at a Type 2 Diabetes Locus Upregulates ARAP1 Expression in the Pancreatic Beta Cell. Am. J. Hum. Genet. 2014, 94, 186–197. [Google Scholar] [CrossRef]
- Freedman, B.I.; Langefeld, C.D.; Lu, L.; Divers, J.; Comeau, M.E.; Kopp, J.; Winkler, C.A.; Nelson, G.W.; Johnson, R.C.; Palmer, N.D.; et al. Differential Effects of MYH9 and APOL1 Risk Variants on FRMD3 Association with Diabetic ESRD in African Americans. PLoS Genet. 2011, 7, e1002150. [Google Scholar] [CrossRef] [PubMed]
- Marion, E.; Kaisaki, P.J.; Pouillon, V.; Gueydan, C.; Levy, J.C.; Bodson, A.; Krzentowski, G.; Daubresse, J.-C.; Mockel, J.; Behrends, J.; et al. The Gene INPPL1, Encoding the Lipid Phosphatase SHIP2, Is a Candidate for Type 2 Diabetes In Rat and Man. Diabetes 2002, 51, 2012–2017. [Google Scholar] [CrossRef] [PubMed] [Green Version]
- Cheng, Y.; Liu, J.; Luan, Y.; Liu, Z.; Lai, H.; Zhong, W.; Yang, Y.; Yu, H.; Feng, N.; Wang, H.; et al. Sarm1 Gene Deficiency Attenuates Diabetic Peripheral Neuropathy in Mice. Diabetes 2019, 68, 2120–2130. [Google Scholar] [CrossRef] [PubMed]
- DiNicolantonio, J.J.; Mccarty, M. Autophagy-induced degradation of Notch1, achieved through intermittent fasting, may promote beta cell neogenesis: Implications for reversal of type 2 diabetes. Open Heart 2019, 6, e001028. [Google Scholar] [CrossRef] [PubMed]
- Liu, J.; Hou, W.; Guan, T.; Tang, L.; Zhu, X.; Li, Y.; Hou, S.; Zhang, J.; Chen, H.; Huang, Y. Slit2/Robo1 signaling is involved in angiogenesis of glomerular endothelial cells exposed to a diabetic-like environment. Angiogenesis 2018, 21, 237–249. [Google Scholar] [CrossRef]
- Waeber, G.; Delplanque, J.; Bonny, C.; Mooser, V.; Steinmann, M.; Widmann, C.; Maillard, A.; Miklossy, J.; Dina, C.; Hani, E.H.; et al. The gene MAPK8IP1, encoding islet-brain-1, is a candidate for type 2 diabetes. Nat. Genet. 2000, 24, 291–295. [Google Scholar] [CrossRef]
- Sun, L.; Zhang, X.; Wang, T.; Chen, M.; Qiao, H. Association of ANK1 variants with new-onset type 2 diabetes in a Han Chinese population from northeast China. Exp. Ther. Med. 2017, 14, 3184–3190. [Google Scholar] [CrossRef]
- Galavi, H.; Noorzehi, N.; Saravani, R.; Sargazi, S.; Mollashahee-Kohkan, F.; Shahraki, H. Association study of SREBF-2 gene polymorphisms and the risk of type 2 diabetes in a sample of Iranian population. Gene 2018, 660, 145–150. [Google Scholar] [CrossRef]
- Song, D.; Yin, L.; Wang, C.; Wen, X. Adenovirus-mediated expression of SIK1 improves hepatic glucose and lipid metabolism in type 2 diabetes mellitus rats. PLoS ONE 2019, 14, e0210930. [Google Scholar] [CrossRef]
- Da Silva Xavier, G.; Farhan, H.; Kim, H.; Caxaria, S.; Johnson, P.; Hughes, S.; Bugliani, M.; Marselli, L.; Marchetti, P.; Birzele, F.; et al. Per-arnt-sim (PAS) domain-containing protein kinase is downregulated in human islets in type 2 diabetes and regulates glucagon secretion. Diabetologia 2011, 54, 819–827. [Google Scholar] [CrossRef]
- Chen, F.; Li, Y.-M.; Yang, L.-Q.; Zhong, C.-G.; Zhuang, Z.-X. Association of NOS2 and NOS3 gene polymorphisms with susceptibility to type 2 diabetes mellitus and diabetic nephropathy in the Chinese Han population. IUBMB Life 2016, 68, 516–525. [Google Scholar] [CrossRef]
- Park, S.; Liu, M.; Kang, S. Alcohol Intake Interacts with CDKAL1, HHEX, and OAS3 Genetic Variants, Associated with the Risk of Type 2 Diabetes by Lowering Insulin Secretion in Korean Adults. Alcohol. Clin. Exp. Res. 2018, 42, 2326–2336. [Google Scholar] [CrossRef]
- Donate-Correa, J.; Martín-Núñez, E.; Ferri, C.; Hernández-Carballo, C.; Tagua, V.G.; Delgado-Molinos, A.; López-Castillo, Á.; Rodríguez-Ramos, S.; Cerro-López, P.; López-Tarruella, V.C.; et al. FGF23 and Klotho Levels are Independently Associated with Diabetic Foot Syndrome in Type 2 Diabetes Mellitus. J. Clin. Med. 2019, 8, 448. [Google Scholar] [CrossRef]
- Završnik, M.; Kariž, S.; Makuc, J.; Šeruga, M.; Cilenšek, I.; Petrovič, D. PECAM-1 Leu125Val (rs688) Polymorphism and Diabetic Nephropathy in Caucasians with Type 2 Diabetes Mellitus. Anal. Cell. Pathol. 2016, 2016, 3152967. [Google Scholar] [CrossRef]
- Dong, N.; Shi, H.; Xu, B.; Cai, Y. Increased Plasma S100A12 Levels Are Associated with Diabetic Retinopathy and Prognostic Biomarkers of Macrovascular Events in Type 2 Diabetic Patients. Investig. Opthalmology Vis. Sci. 2015, 56, 4177–4185. [Google Scholar] [CrossRef]
- Afarideh, M.; Esteghamati, V.Z.; Ganji, M.; Heidari, B.; Esteghamati, S.; Lavasani, S.; Ahmadi, M.; Tafakhori, A.; Nakhjavani, M.; Esteghamati, A. Associations of Serum S100B and S100P With the Presence and Classification of Diabetic Peripheral Neuropathy in Adults with Type 2 Diabetes: A Case-Cohort Study. Can. J. Diabetes 2019, 43, 336–344.e2. [Google Scholar] [CrossRef]
- Ferris, S.T.; Carrero, J.A.; Mohan, J.F.; Calderon, B.; Murphy, K.M.; Unanue, E.R. A Minor Subset of Batf3-Dependent Antigen-Presenting Cells in Islets of Langerhans Is Essential for the Development of Autoimmune Diabetes. Immunity 2014, 41, 657–669. [Google Scholar] [CrossRef]
- Ding, Y.; Kantarci, A.; Badwey, J.A.; Hasturk, H.; Malabanan, A.; Van Dyke, T.E. Phosphorylation of Pleckstrin Increases Proinflammatory Cytokine Secretion by Mononuclear Phagocytes in Diabetes Mellitus. J. Immunol. 2007, 179, 647–654. [Google Scholar] [CrossRef]
- Nejatian, N.; Häfner, A.-K.; Shoghi, F.; Badenhoop, K.; Penna-Martinez, M. 5-Lipoxygenase (ALOX5): Genetic susceptibility to type 2 diabetes and vitamin D effects on monocytes. J. Steroid Biochem. Mol. Biol. 2019, 187, 52–57. [Google Scholar] [CrossRef]
- Shah, S.F.A.; Iqbal, T.; Naveed, N.; Akram, S.; Rafiq, M.A.; Hussain, S. ARG1 single nucleotide polymorphisms rs2781666 and rs2781665 confer risk of Type 2 diabetes mellitus. EXCLI J. 2018, 17, 847–855. [Google Scholar] [CrossRef]
- Da Silva, B.R.; Cirelli, T.; Nepomuceno, R.; Theodoro, L.H.; Orrico, S.R.; Cirelli, J.A.; Barros, S.P.; Scarel-Caminaga, R.M. Functional haplotype in the Interleukin8 (CXCL8) gene is associated with type 2 Diabetes Mellitus and Periodontitis in Brazilian population. Diabetes Metab. Syndr. 2020, 14, 1665–1672. [Google Scholar] [CrossRef] [PubMed]
- Gond, D.P.; Singh, S.; Agrawal, N. Testing an association between TLR4 and CXCR1 gene polymorphisms with susceptibility to urinary tract infection in type 2 diabetes in north Indian population. Gene 2018, 641, 196–202. [Google Scholar] [CrossRef] [PubMed]
- Yamaguchi, M.; Matsui, M.; Higa, R.; Yamazaki, Y.; Ikari, A.; Miyake, M.; Miwa, M.; Ishii, S.; Sugatani, J.; Shimizu, T. A platelet-activating factor (PAF) receptor deficiency exacerbates diet-induced obesity but PAF/PAF receptor signaling does not contribute to the development of obesity-induced chronic inflammation. Biochem. Pharmacol. 2015, 93, 482–495. [Google Scholar] [CrossRef] [PubMed]
- Nagy, L.; Docsa, T.; Szántó, M.; Brunyánszki, A.; Hegedűs, C.; Márton, J.; Kónya, B.; Virág, L.; Somsák, L.; Gergely, P.; et al. Glycogen Phosphorylase Inhibitor N-(3,5-Dimethyl-Benzoyl)-N’-(β-D-Glucopyranosyl)Urea Improves Glucose Tolerance under Normoglycemic and Diabetic Conditions and Rearranges Hepatic Metabolism. PLoS ONE 2013, 8, e69420. [Google Scholar] [CrossRef] [PubMed]
- Boj, S.F.; van Es, J.H.; Huch, M.; Li, V.S.; José, A.; Hatzis, P.; Mokry, M.; Haegebarth, A.; Born, M.V.D.; Chambon, P.; et al. Diabetes Risk Gene and Wnt Effector Tcf7l2/TCF4 Controls Hepatic Response to Perinatal and Adult Metabolic Demand. Cell 2012, 151, 1595–1607. [Google Scholar] [CrossRef]
- Patrick, C.; Wang, G.-S.; Lefebvre, D.E.; Crookshank, J.A.; Sonier, B.; Eberhard, C.; Mojibian, M.; Kennedy, C.R.; Brooks, S.P.; Kalmokoff, M.L.; et al. Promotion of Autoimmune Diabetes by Cereal Diet in the Presence or Absence of Microbes Associated with Gut Immune Activation, Regulatory Imbalance, and Altered Cathelicidin Antimicrobial Peptide. Diabetes 2013, 62, 2036–2047. [Google Scholar] [CrossRef]
- Zhang, G.; Li, H.; Zhao, W.; Li, M.; Tian, L.; Ju, W.; Li, X. miR-205 regulates bone turnover in elderly female patients with type 2 diabetes mellitus through targeted inhibition of Runx2. Exp. Ther. Med. 2020, 20, 1557–1565. [Google Scholar] [CrossRef]
- Khajeniazi, S.; Marjani, A.; Shakeri, R.; Hakimi, S. Polymorphism of Secretary PLA2G2A Gene Associated with Its Serum Level in Type2 Diabetes Mellitus Patients in Northern Iran. Endocrine Metab. Immune Disord. Drug Targets 2019, 19, 1192–1197. [Google Scholar] [CrossRef]
- Li, L.; Gao, K.; Zhao, J.; Feng, T.; Yin, L.; Wang, J.; Wang, C.; Li, C.; Wang, Y.; Wang, Q.; et al. Glucagon gene polymorphism modifies the effects of smoking and physical activity on risk of type 2 diabetes mellitus in Han Chinese. Gene 2014, 534, 352–355. [Google Scholar] [CrossRef]
- Zhao, K.; Ding, W.; Zhang, Y.; Ma, K.; Wang, D.; Hu, C.; Liu, J.; Zhang, X. Variants in the RARRES2 gene are associated with serum chemerin and increase the risk of diabetic kidney disease in type 2 diabetes. Int. J. Biol. Macromol. 2020, 165, 1574–1580. [Google Scholar] [CrossRef]
- Gong, Y.-J.; Feng, Y.; Cao, Y.-Y.; Zhao, J.; Wu, W.; Zheng, Y.-Y.; Wu, J.-R.; Li, X.; Yang, G.-Z.; Zhou, X. Huntingtin-associated protein 1 plays an essential role in the pathogenesis of type 2 diabetes by regulating the translocation of GLUT4 in mouse adipocytes. BMJ Open Diabetes Res. Care 2020, 8, e001199. [Google Scholar] [CrossRef]
- Shenhar-Tsarfaty, S.; Sherf-Dagan, S.; Berman, G.; Webb, M.; Raziel, A.; Keidar, A.; Goitein, D.; Sakran, N.; Zwang, E.; Shapira, I.; et al. Obesity-related acetylcholinesterase elevation is reversed following laparoscopic sleeve gastrectomy. Int. J. Obes. 2019, 43, 297–305. [Google Scholar] [CrossRef]
- Saint-Laurent, C.; Garcia, S.; Sarrazy, V.; Dumas, K.; Authier, F.; Sore, S.; Tran, A.; Gual, P.; Gennero, I.; Salles, J.-P.; et al. Early postnatal soluble FGFR3 therapy prevents the atypical development of obesity in achondroplasia. PLoS ONE 2018, 13, e0195876. [Google Scholar] [CrossRef]
- Kim, O.Y.; Lee, S.-M.; Chung, J.H.; Do, H.J.; Moon, J.; Shin, M.-J. Arginase I and the very low-density lipoprotein receptor are associated with phenotypic biomarkers for obesity. Nutrition 2012, 28, 635–639. [Google Scholar] [CrossRef]
- Feigelson, H.S.; Teras, L.R.; Diver, W.R.; Tang, W.; Patel, A.V.; Stevens, V.L.; Calle, E.E.; Thun, M.J.; Bouzyk, M. Genetic variation in candidate obesity genes ADRB2, ADRB3, GHRL, HSD11B1, IRS1, IRS2, and SHC1 and risk for breast cancer in the Cancer Prevention Study II. Breast Cancer Res. 2008, 10, R57. [Google Scholar] [CrossRef]
- Lieber, A.D.; Beier, U.H.; Xiao, H.; Wilkins, B.J.; Jiao, J.; Li, X.S.; Schugar, R.C.; Strauch, C.M.; Wang, Z.; Brown, J.M.; et al. Loss of HDAC6 alters gut microbiota and worsens obesity. FASEB J. 2019, 33, 1098–1109. [Google Scholar] [CrossRef]
- Kim, J. Association of CHRNA2 polymorphisms with overweight/obesity and clinical characteristics in a Korean population. Clin. Chem. Lab. Med. 2008, 46, 1085–1089. [Google Scholar] [CrossRef]
- Mattar, P.; Sanhueza, S.; Yuri, G.; Briones, L.; Perez-Leighton, C.; Rudich, A.; Lavandero, S.; Cifuentes, M. Calcium-Sensing Receptor in Adipose Tissue: Possible Association with Obesity-Related Elevated Autophagy. Int. J. Mol. Sci. 2020, 21, 7617. [Google Scholar] [CrossRef]
- Pang, L.; You, L.; Ji, C.-B.; Shi, C.; Chen, L.; Yang, L.; Huang, F.; Zhou, Y.; Zhang, J.; Chen, X.; et al. miR-1275 inhibits adipogenesis via ELK1 and its expression decreases in obese subjects. J. Mol. Endocrinol. 2016, 57, 33–43. [Google Scholar] [CrossRef]
- Derecka, M.; Gornicka, A.; Koralov, S.B.; Szczepanek, K.; Morgan, M.; Raje, V.; Sisler, J.; Zhang, Q.; Otero, D.; Cichy, J.; et al. Tyk2 and Stat3 Regulate Brown Adipose Tissue Differentiation and Obesity. Cell Metab. 2012, 16, 814–824. [Google Scholar] [CrossRef]
- Deng, T.; Lyon, C.J.; Minze, L.J.; Lin, J.; Zou, J.; Liu, J.Z.; Ren, Y.; Yin, Z.; Hamilton, D.J.; Reardon, P.R.; et al. Class II Major Histocompatibility Complex Plays an Essential Role in Obesity-Induced Adipose Inflammation. Cell Metab. 2013, 17, 411–422. [Google Scholar] [CrossRef] [PubMed]
- Torres, K.; Torres, A.; Chrościcki, A.; Maciejewski, R.; Radej, S.; Roliński, J.; Pietrzyk, Ł.; Wallner, G. Evaluation of lymphocytes CD4+ and CD8+ and expression of ZAP-70 kinase on CD3+ and CD19+ lymphocytes in obese patients undergoing laparoscopic cholecystectomy. Surg. Endosc. 2013, 27, 872–879. [Google Scholar] [CrossRef] [PubMed] [Green Version]
- Nakamura, S.; Takezawa, Y.; Nakajima, Y.; Maeda, T. Elevation of glutamic pyruvic transaminase and .GAMMA.-glutamyl transpeptidase in obesity. Tohoku J. Exp. Med. 1980, 132, 473–478. [Google Scholar] [CrossRef] [PubMed]
- Teitsdottir, U.D.; Arnardottir, E.S.; Bjornsdottir, E.; Gislason, T.; Petersen, P.H. Obesity modulates the association between sleep apnea treatment and CHI3L1 levels but not CHIT1 activity in moderate to severe OSA: An observational study. Sleep Breath. 2018, 22, 1101–1109. [Google Scholar] [CrossRef] [PubMed]
- Parikh, D.; Riascos-Bernal, D.F.; Egaña-Gorroño, L.; Jayakumar, S.; Almonte, V.; Chinnasamy, P.; Sibinga, N.E.S. Allograft inflammatory factor-1-like is not essential for age dependent weight gain or HFD-induced obesity and glucose insensitivity. Sci. Rep. 2020, 10, 3594. [Google Scholar] [CrossRef]
- Allott, E.H.; Lysaght, J.; Cathcart, M.C.; Donohoe, C.L.; Cummins, R.; McGarrigle, S.A.; Kay, E.; Reynolds, J.V.; Pidgeon, G.P. MMP9 expression in oesophageal adenocarcinoma is upregulated with visceral obesity and is associated with poor tumour differentiation. Mol. Carcinog. 2013, 52, 144–154. [Google Scholar] [CrossRef]
- Awaya, T.; Yokosaki, Y.; Yamane, K.; Usui, H.; Kohno, N.; Eboshida, A. Gene-environment Association of an ITGB2 Sequence Variant With Obesity in Ethnic Japanese. Obesity 2008, 16, 1463–1466. [Google Scholar] [CrossRef]
- Mathews, J.A.; Wurmbrand, A.P.; Ribeiro, L.; Neto, F.L.; Shore, S.A. Induction of IL-17A Precedes Development of Airway Hyperresponsiveness during Diet-Induced Obesity and Correlates with Complement Factor D. Front. Immunol. 2014, 5, 440. [Google Scholar] [CrossRef]
- Cero, C.; Razzoli, M.; Han, R.; Sahu, B.S.; Patricelli, J.; Guo, Z.; Zaidman, N.A.; Miles, J.M.; O’Grady, S.M.; Bartolomucci, A. The neuropeptide TLQP-21 opposes obesity via C3aR1-mediated enhancement of adrenergic-induced lipolysis. Mol. Metab. 2016, 6, 148–158. [Google Scholar] [CrossRef]
- Mukherjee, R.; Kim, S.W.; Park, T.; Choi, M.S.; Yun, J.W. Targeted inhibition of galectin 1 by thiodigalactoside dramatically reduces body weight gain in diet-induced obese rats. Int. J. Obes. 2015, 39, 1349–1358. [Google Scholar] [CrossRef]
- Leite, F.; Leite, Â.; Santos, A.; Lima, M.; Barbosa, J.; Cosentino, M.; Ribeiro, L. Predictors of Subclinical Inflammatory Obesity: Plasma Levels of Leptin, Very Low-Density Lipoprotein Cholesterol and CD14 Expression of CD16+ Monocytes. Obes. Facts 2017, 10, 308–322. [Google Scholar] [CrossRef]
- Andrade, V.L.; Petruceli, E.; Belo, V.A.; Andrade-Fernandes, C.M.; Russi, C.V.C.; Bosco, A.A.; Tanus-Santos, J.E.; Sandrim, V.C. Evaluation of plasmatic MMP-8, MMP-9, TIMP-1 and MPO levels in obese and lean women. Clin. Biochem. 2012, 45, 412–415. [Google Scholar] [CrossRef]
- Martínez-García, M.; Ojeda-Ojeda, M.; Rodríguez-Martín, E.; Insenser, M.; Moncayo, S.; Álvarez-Blasco, F.; Luque-Ramírez, M.; Escobar-Morreale, H.F. TLR2 and TLR4 Surface and Gene Expression in White Blood Cells after Fasting and Oral Glucose, Lipid and Protein Challenges: Influence of Obesity and Sex Hormones. Biomolecules 2020, 10, 111. [Google Scholar] [CrossRef]
- Jamka, M.; Kaczmarek, N.; Mądry, E.; Krzyżanowska-Jankowska, P.; Bajerska, J.; Kręgielska-Narożna, M.; Bogdański, P.; Walkowiak, J. Metabolic Health in Obese Subjects—Is There a Link to Lactoferrin and Lactoferrin Receptor-Related Gene Polymorphisms? Nutrients 2020, 12, 2843. [Google Scholar] [CrossRef]
- Peplonska, B.; Bukowska, A.; Wieczorek, E.; Przybek, M.; Zienolddiny, S.; Reszka, E. Rotating night work, lifestyle factors, obesity and promoter methylation in BRCA1 and BRCA2 genes among nurses and midwives. PLoS ONE 2017, 12, e0178792. [Google Scholar] [CrossRef]
- Moreno-Santos, I.; Castellano-Castillo, D.; Lara, M.F.; Fernandez-Garcia, J.C.; Tinahones, F.J.; Macias-Gonzalez, M. IGFBP-3 Interacts with the Vitamin D Receptor in Insulin Signaling Associated with Obesity in Visceral Adipose Tissue. Int. J. Mol. Sci. 2017, 18, 2349. [Google Scholar] [CrossRef]
- Sun, L.; Liu, Y.-L.; Ye, F.; Xie, J.-W.; Zeng, J.-W.; Qin, L.; Xue, J.; Wang, Y.-T.; Guo, K.-M.; Ma, M.-M.; et al. Free fatty acid-induced H2O2 activates TRPM2 to aggravate endothelial insulin resistance via Ca2+-dependent PERK/ATF4/TRB3 cascade in obese mice. Free. Radic. Biol. Med. 2019, 143, 288–299. [Google Scholar] [CrossRef]
- Richter, M.; Murtaza, N.; Scharrenberg, R.; White, S.H.; Johanns, O.; Walker, S.; Yuen, R.K.C.; Schwanke, B.; Bedürftig, B.; Henis, M.; et al. Altered TAOK2 activity causes autism-related neurodevelopmental and cognitive abnormalities through RhoA signaling. Mol. Psychiatry 2019, 24, 1329–1350. [Google Scholar] [CrossRef]
- Suchkova, I.O.; Borisova, E.V.; Patkin, E.L. Length Polymorphism and Methylation Status of UPS29 Minisatellite of the ACAP3 Gene as Molecular Biomarker of Epilepsy. Sex Differences in Seizure Types and Symptoms. Int. J. Mol. Sci. 2020, 21, E9206. [Google Scholar] [CrossRef]
- Qureshi, M.; Hatem, M.; Alroughani, R.; Jacob, S.P.; Al-Temaimi, R.A. PLXNA3 Variant rs5945430 is Associated with Severe Clinical Course in Male Multiple Sclerosis Patients. NeuroMolecular Med. 2017, 19, 286–292. [Google Scholar] [CrossRef]
- Wang, H.; Sun, F.-R.; Tan, L.; Zhang, W.; Wang, Z.-X.; Jiang, T.; Yu, J.-T.; Tan, L. Association study of the PLXNA4 gene with the risk of Alzheimer’s disease. Ann. Transl. Med. 2016, 4, 108. [Google Scholar] [CrossRef] [PubMed]
- Wang, N.; Ma, Q.; Peng, P.; Yu, Y.; Xu, S.; Wang, G.; Ying, Z.; Wang, H. Autophagy and Ubiquitin-Proteasome System Coordinate to Regulate the Protein Quality Control of Neurodegenerative Disease-Associated DCTN1. Neurotox. Res. 2020, 37, 48–57. [Google Scholar] [CrossRef] [PubMed]
- Aoki-Suzuki, M.; Yamada, K.; Meerabux, J.; Iwayama-Shigeno, Y.; Ohba, H.; Iwamoto, K.; Takao, H.; Toyota, T.; Suto, Y.; Nakatani, N.; et al. A family-based association study and gene expression analyses of netrin-G1 and -G2 genes in schizophrenia. Biol. Psychiatry 2005, 57, 382–393. [Google Scholar] [CrossRef] [PubMed]
- Ohno, K.; Ohkawara, B.; Ito, M. Agrin-LRP4-MuSK signaling as a therapeutic target for myasthenia gravis and other neuromuscular disorders. Expert Opin. Ther. Targets 2017, 21, 949–958. [Google Scholar] [CrossRef]
- Rahman, S.; Copeland, W.C. POLG-related disorders and their neurological manifestations. Nat. Rev. Neurol. 2019, 15, 40–52. [Google Scholar] [CrossRef]
- Congiu, C.; Minelli, A.; Bonvicini, C.; Bortolomasi, M.; Sartori, R.; Maj, C.; Scassellati, C.; Maina, G.; Trabucchi, L.; Segala, M.; et al. The role of the potassium channel gene KCNK2 in major depressive disorder. Psychiatry Res. 2015, 225, 489–492. [Google Scholar] [CrossRef]
- Ji, H.; Wang, Y.; Liu, G.; Xu, X.; Dai, D.; Chen, Z.; Zhou, D.; Zhou, X.; Han, L.; Li, Y.; et al. OPRK1 promoter hypermethylation increases the risk of Alzheimer’s disease. Neurosci. Lett. 2015, 606, 24–29. [Google Scholar] [CrossRef]
- Wollmer, M.A.; Kapaki, E.; Hersberger, M.; Muntwyler, J.; Brunner, F.; Tsolaki, M.; Akatsu, H.; Kosaka, K.; Michikawa, M.; Molyva, D.; et al. Ethnicity-dependent genetic association of ABCA2 with sporadic Alzheimer’s disease. Am. J. Med. Genet. Part B: Neuropsychiatr. Genet. 2006, 141, 534–536. [Google Scholar] [CrossRef]
- Yamazaki, K.; Yoshino, Y.; Mori, T.; Yoshida, T.; Ozaki, Y.; Sao, T.; Mori, Y.; Ochi, S.; Iga, J.-I.; Ueno, S.-I. Gene Expression and Methylation Analysis of ABCA7 in Patients with Alzheimer’s Disease. J. Alzheimer Dis. 2017, 57, 171–181. [Google Scholar] [CrossRef]
- Bardien, S.; Lesage, S.; Brice, A.; Carr, J. Genetic characteristics of leucine-rich repeat kinase 2 (LRRK2) associated Parkinson’s disease. Park. Relat. Disord. 2011, 17, 501–508. [Google Scholar] [CrossRef]
- Bolla, A.C.; Valente, T.; Miguez, A.; Brito, V.; Gines, S.; Solà, C.; Straccia, M.; Canals, J.M. CD200 is up-regulated in R6/1 transgenic mouse model of Huntington’s disease. PLoS ONE 2019, 14, e0224901. [Google Scholar] [CrossRef]
- Horvath, G.A.; Tarailo-Graovac, M.; Bartel, T.; Race, S.; Van Allen, M.I.; Blydt-Hansen, I.; Ross, C.J.; Wasserman, W.W.; Connolly, M.B.; van Karnebeek, C.D.M. Improvement of Self-Injury with Dopamine and Serotonin Replacement Therapy in a Patient with a Hemizygous PAK3 Mutation: A New Therapeutic Strategy for Neuropsychiatric Features of an Intellectual Disability Syndrome. J. Child Neurol. 2018, 33, 106–113. [Google Scholar] [CrossRef] [Green Version]
- Watanabe, Y.; Nunokawa, A.; Kaneko, N.; Arinami, T.; Ujike, H.; Inada, T.; Iwata, N.; Kunugi, H.; Itokawa, M.; Otowa, T.; et al. A two-stage case–control association study of PADI2 with schizophrenia. J. Hum. Genet. 2009, 54, 430–432. [Google Scholar] [CrossRef]
- Kushima, I.; Nakamura, Y.; Aleksic, B.; Ikeda, M.; Ito, Y.; Shiino, T.; Okochi, T.; Fukuo, Y.; Ujike, H.; Suzuki, M.; et al. Resequencing and Association Analysis of the KALRN and EPHB1 Genes and Their Contribution to Schizophrenia Susceptibility. Schizophr. Bull. 2012, 38, 552–560. [Google Scholar] [CrossRef]
- Grünblatt, E.; Reif, A.; Jungwirth, S.; Galimberti, D.; Weber, H.; Scarpini, E.; Sauer, C.; Wichart, I.; Rainer, M.K.; Huber, K.; et al. Genetic variation in the choline O-acetyltransferase gene in depression and Alzheimer’s disease: The VITA and Milano studies. J. Psychiatr. Res. 2011, 45, 1250–1256. [Google Scholar] [CrossRef]
- Sato, D.X.; Kawata, M. Positive and balancing selection on SLC18A1 gene associated with psychiatric disorders and human-unique personality traits. Evol. Lett. 2018, 2, 499–510. [Google Scholar] [CrossRef]
- Kundu, A.; Ramakrishnan, P.; Rajendran, A.; Dharwar, N.V.; Anbarasu, A. Analysis of non-synonymous single-nucleotide polymorphisms and population variability of PLD2 gene associated with hypertension. Int. J. Bioinform. Res. Appl. 2013, 9, 227–241. [Google Scholar] [CrossRef]
- Jain, M.; Mann, T.D.; Stulić, M.; Rao, S.P.; Kirsch, A.; Pullirsch, D.; Strobl, X.; Rath, C.; Reissig, L.; Moreth, K.; et al. RNA editing of Filamin A pre- mRNA regulates vascular contraction and diastolic blood pressure. EMBO J. 2018, 37, e94813. [Google Scholar] [CrossRef]
- Baptista, R.; Marques, C.; Catarino, S.; Enguita, F.J.; Costa, M.C.; Matafome, P.; Zuzarte, M.; Castro, G.; Reis, A.; Monteiro, P.; et al. MicroRNA-424(322) as a new marker of disease progression in pulmonary arterial hypertension and its role in right ventricular hypertrophy by targeting SMURF1. Cardiovasc. Res. 2018, 114, 53–64. [Google Scholar] [CrossRef]
- Fu, Q.-L.; Hu, B.; Li, X.; Shao, Z.; Shi, J.-B.; Wu, W.; So, K.-F.; Mi, S. LINGO-1 negatively regulates TrkB phosphorylation after ocular hypertension. Eur. J. Neurosci. 2010, 31, 1091–1097. [Google Scholar] [CrossRef]
- Scholl, U.I.; Stölting, G.; Nelson-Williams, C.; Vichot, A.A.; Choi, M.; Loring, E.; Prasad, M.L.; Goh, G.; Carling, T.; Juhlin, C.C.; et al. Recurrent gain of function mutation in calcium channel CACNA1H causes early-onset hypertension with primary aldosteronism. Elife 2015, 4, e06315. [Google Scholar] [CrossRef] [PubMed]
- Glorioso, N.; Herrera, V.L.; Didishvili, T.; Ortu, M.F.; Zaninello, R.; Fresu, G.; Argiolas, G.; Troffa, C.; Ruiz-Opazo, N. Sex-Specific Effects of NLRP6/AVR and ADM Loci on Susceptibility to Essential Hypertension in a Sardinian Population. PLoS ONE 2013, 8, e77562. [Google Scholar] [CrossRef] [PubMed] [Green Version]
- Zha, L.; Zhou, J.; Li, T.; Luo, H.; Zhang, M.; Li, S.; Yu, Z. NLRC3 inhibits MCT-induced pulmonary hypertension in rats via attenuating PI3K activation. J. Cell. Physiol. 2019, 234, 15963–15976. [Google Scholar] [CrossRef] [PubMed]
- Zhang, Y.; Teng, F.; Han, X.; Li, P.; Yan, X.; Guo, S.; Li, H. Selective blocking of CXCR2 prevents and reverses atrial fibrillation in spontaneously hypertensive rats. J. Cell. Mol. Med. 2020, 24, 11272–11282. [Google Scholar] [CrossRef] [PubMed]
- Weiss, S.; Rosendahl, A.; Czesla, D.; Meyer-Schwesinger, C.; Stahl, R.A.K.; Ehmke, H.; Kurts, C.; Zipfel, P.F.; Köhl, J.; Wenzel, U.O. The complement receptor C5aR1 contributes to renal damage but protects the heart in angiotensin II-induced hypertension. Am. J. Physiol. Physiol. 2016, 310, F1356–F1365. [Google Scholar] [CrossRef]
- Sauzeau, V.; Jerkic, M.; López-Novoa, J.M.; Bustelo, X.R. Loss of Vav2 Proto-Oncogene Causes Tachycardia and Cardiovascular Disease in Mice. Mol. Biol. Cell 2007, 18, 943–952. [Google Scholar] [CrossRef]
- Xu, X.; Tan, X.; Tampe, B.; Nyamsuren, G.; Liu, X.; Maier, L.S.; Sossalla, S.; Kalluri, R.; Zeisberg, M.; Hasenfuss, G.; et al. Epigenetic balance of aberrant Rasal1 promoter methylation and hydroxymethylation regulates cardiac fibrosis. Cardiovasc. Res. 2015, 105, 279–291. [Google Scholar] [CrossRef]
- Hirota, H.; Izumi, M.; Hamaguchi, T.; Sugiyama, S.; Murakami, E.; Kunisada, K.; Fujio, Y.; Oshima, Y.; Nakaoka, Y.; Yamauchi-Takihara, K. Circulating interleukin-6 family cytokines and their receptors in patients with congestive heart failure. Heart Vessel. 2004, 19, 237–241. [Google Scholar] [CrossRef]
- Alharatani, R.; Ververi, A.; Beleza-Meireles, A.; Ji, W.; Mis, E.; Patterson, Q.T.; Griffin, J.N.; Bhujel, N.; Chang, C.A.; Dixit, A.; et al. Novel truncating mutations in CTNND1 cause a dominant craniofacial and cardiac syndrome. Hum. Mol. Genet. 2020, 29, 1900–1921. [Google Scholar] [CrossRef]
- Beitelshees, A.L.; Navare, H.; Wang, D.; Gong, Y.; Wessel, J.; Moss, J.I.; Langaee, T.Y.; Cooper-DeHoff, R.M.; Sadee, W.; Pepine, C.J.; et al. CACNA1C Gene Polymorphisms, Cardiovascular Disease Outcomes, and Treatment Response. Circ. Cardiovasc. Genet. 2009, 2, 362–370. [Google Scholar] [CrossRef]
- Zhu, J.; Chen, T.; Yang, L.; Li, Z.; Wong, M.M.; Zheng, X.; Pan, X.; Zhang, L.; Yan, H. Regulation of MicroRNA-155 in Atherosclerotic Inflammatory Responses by Targeting MAP3K10. PLoS ONE 2012, 7, e46551. [Google Scholar] [CrossRef]
- Gil-Cayuela, C.; López, A.; Martinez-Dolz, L.; Juanatey, J.R.G.; Lago, F.; Roselló-Lletí, E.; Rivera, M.; Portolés, M. The altered expression of autophagy-related genes participates in heart failure: NRBP2 and CALCOCO2 are associated with left ventricular dysfunction parameters in human dilated cardiomyopathy. PLoS ONE 2019, 14, e0215818. [Google Scholar] [CrossRef]
- Liu, H.; El Zein, L.; Kruse, M.; Guinamard, R.; Beckmann, A.; Bozio, A.; Kurtbay, G.; Mégarbané, A.; Ohmert, I.; Blaysat, G.; et al. Gain-of-Function Mutations in TRPM4 Cause Autosomal Dominant Isolated Cardiac Conduction Disease. Circ. Cardiovasc. Genet. 2010, 3, 374–385. [Google Scholar] [CrossRef]
- Xie, M.; Hu, C.; Li, D.; Li, S. MicroRNA-377 Alleviates Myocardial Injury Induced by Hypoxia/Reoxygenation via Downregulating LILRB2 Expression. Dose-Response 2020, 18, 1559325820936124. [Google Scholar] [CrossRef]
- Kroupis, C.; Theodorou, M.; Chaidaroglou, A.; Dalamaga, M.; Oliveira, S.C.; Cokkinos, D.V.; Degiannis, D.; Manginas, A. The Association Between a CommonFCGR2APolymorphism and C-Reactive Protein and Coronary Artery Disease Revisited. Genet. Test. Mol. Biomark. 2010, 14, 839–846. [Google Scholar] [CrossRef]
- López-Mejías, R.; Genre, F.; García-Bermúdez, M.; Ubilla, B.; Castañeda, S.; Llorca, J.; González-Juanatey, C.; Corrales, A.; Miranda-Filloy, J.A.; Pina, T.; et al. Lack of Association between ABO, PPAP2B, ADAMST7, PIK3CG, and EDNRA and Carotid Intima-Media Thickness, Carotid Plaques, and Cardiovascular Disease in Patients with Rheumatoid Arthritis. Mediat. Inflamm. 2014, 2014, 756279. [Google Scholar] [CrossRef]
- Koppensteiner, R.; Kaider, A.; Eichelberger, B.; Mannhalter, C.; Panzer, S.; Gremmel, T. Impact of variables of the P-selectin–P-selectin glycoprotein ligand-1 axis on leukocyte-platelet interactions in cardiovascular disease. Thromb. Haemost. 2015, 113, 806–812. [Google Scholar] [CrossRef]
- Yamada, S.; Guo, X. Peroxiredoxin 4 (PRDX4): Its critical in vivo roles in animal models of metabolic syndrome ranging from atherosclerosis to nonalcoholic fatty liver disease. Pathol. Int. 2018, 68, 91–101. [Google Scholar] [CrossRef]
- Petri, M.H.; Laguna-Fernández, A.; Gonzalez-Diez, M.; Paulsson-Berne, G.; Hansson, G.K.; Bäck, M. The role of the FPR2/ALX receptor in atherosclerosis development and plaque stability. Cardiovasc. Res. 2015, 105, 65–74. [Google Scholar] [CrossRef]
- DeFilippis, A.P.; Chernyavskiy, I.; Amraotkar, A.R.; Trainor, P.J.; Kothari, S.; Ismail, I.; Hargis, C.W.; Korley, F.K.; Leibundgut, G.; Tsimikas, S.; et al. Circulating levels of plasminogen and oxidized phospholipids bound to plasminogen distinguish between atherothrombotic and non-atherothrombotic myocardial infarction. J. Thromb. Thrombolysis 2016, 42, 61–76. [Google Scholar] [CrossRef]
- Rocca, C.; Pasqua, T.; Boukhzar, L.; Anouar, Y.; Angelone, T. Progress in the emerging role of selenoproteins in cardiovascular disease: Focus on endoplasmic reticulum-resident selenoproteins. Cell. Mol. Life Sci. 2019, 76, 3969–3985. [Google Scholar] [CrossRef] [PubMed]
- Tur, M.K.; Etschmann, B.; Benz, A.; Leich, E.; Waller, C.; Schuh, K.; Rosenwald, A.; Ertl, G.; Kienitz, A.; Haaf, A.T.; et al. The 140-kD Isoform of CD56 (NCAM1) Directs the Molecular Pathogenesis of Ischemic Cardiomyopathy. Am. J. Pathol. 2013, 182, 1205–1218. [Google Scholar] [CrossRef] [PubMed]
- Yu, P.-F.; Pang, L.-L.; Mao, Q.-S.; Zou, S.-C.; Shi, Y.; Lin, D.-J. Dose dependency PM2.5 aggravated airway inflammation in asthmatic mice via down-regulating expression of ITGB4. Eur. Rev. Med. Pharmacol. Sci. 2019, 23, 1688–1697. [Google Scholar] [PubMed]
- McGeachie, M.J.; Wu, A.C.; Tse, S.M.; Clemmer, G.L.; Sordillo, J.; Himes, B.E.; Lasky-Su, J.; Chase, R.P.; Martinez, F.D.; Weeke, P.; et al. CTNNA3 and SEMA3D: Promising loci for asthma exacerbation identified through multiple genome-wide association studies. J. Allergy Clin. Immunol. 2015, 136, 1503–1510. [Google Scholar] [CrossRef]
- Jasek, M.; Obojski, A.; Mańczak, M.; Wiśniewski, A.; Winiarska, B.; Małolepszy, J.; Jutel, M.; Łuszczek, W.; Kuśnierczyk, P. Are Single Nucleotide Polymorphisms of the Immunoglobulin A Fc Receptor Gene Associated with Allergic Asthma? Int. Arch. Allergy Immunol. 2004, 135, 325–331. [Google Scholar] [CrossRef]
- Cahill, K.N.; Katz, H.R.; Cui, J.; Lai, J.; Kazani, S.; Crosby-Thompson, A.; Garofalo, D.; Castro, M.; Jarjour, N.; DiMango, E.; et al. KIT Inhibition by Imatinib in Patients with Severe Refractory Asthma. N. Engl. J. Med. 2017, 376, 1911–1920. [Google Scholar] [CrossRef]
- Banskar, S.; Detzner, A.A.; Juarez-Rodriguez, M.D.; Hozo, I.; Gupta, D.; Dziarski, R. The Pglyrp1-Regulated Microbiome Enhances Experimental Allergic Asthma. J. Immunol. 2019, 203, 3113–3125. [Google Scholar] [CrossRef]
- Hunninghake, G.M.; Chu, J.-H.; Sharma, S.S.; Cho, M.H.; Himes, B.E.; Rogers, A.J.; Murphy, A.; Carey, V.J.; Raby, B.A. The CD4+ T-cell transcriptome and serum IgE in asthma: IL17RB and the role of sex. BMC Pulm. Med. 2011, 11, 17. [Google Scholar] [CrossRef]
- Ungvári, I.; Hadadi, E.; Virág, V.; Bikov, A.; Nagy, A.; Semsei, A.F.; Gálffy, G.; Tamási, L.; Horvath, I.; Szalai, C. Implication of BIRC5 in asthma pathogenesis. Int. Immunol. 2012, 24, 293–301. [Google Scholar] [CrossRef]
- Yucesoy, B.; Kashon, M.L.; Johnson, V.J.; Lummus, Z.L.; Fluharty, K.; Gautrin, D.; Cartier, A.; Boulet, L.-P.; Sastre, J.; Quirce, S.; et al. Genetic variants in TNFα, TGFB1, PTGS1 and PTGS2 genes are associated with diisocyanate-induced asthma. J. Immunotoxicol. 2016, 13, 119–126. [Google Scholar] [CrossRef]
- Vila-Bedmar, R.; Cruces-Sande, M.; Lucas, E.; Willemen, H.L.D.M.; Heijnen, C.J.; Kavelaars, A.; Mayor, F.; Murga, C. Reversal of diet-induced obesity and insulin resistance by inducible genetic ablation of GRK2. Sci. Signal. 2015, 8, ra73. [Google Scholar] [CrossRef]
- Grarup, N.; Moltke, I.; Andersen, M.K.; Dalby, M.; Vitting-Seerup, K.; Kern, T.; Mahendran, Y.; Jørsboe, E.; Larsen, C.V.L.; Dahl-Petersen, I.; et al. Loss-of-function variants in ADCY3 increase risk of obesity and type 2 diabetes. Nat. Genet. 2018, 50, 172–174. [Google Scholar] [CrossRef]
- Berndt, J.; Kovacs, P.; Ruschke, K.; Klöting, N.; Fasshauer, M.; Schön, M.R.; Körner, A.; Stumvoll, M.; Blüher, M. Fatty acid synthase gene expression in human adipose tissue: Association with obesity and type 2 diabetes. Diabetologia 2007, 50, 1472–1480. [Google Scholar] [CrossRef]
- Mannerås-Holm, L.; Kirchner, H.; Björnholm, M.; Chibalin, A.V.; Zierath, J.R. mRNA expression of diacylglycerol kinase isoforms in insulin-sensitive tissues: Effects of obesity and insulin resistance. Physiol. Rep. 2015, 3, e12372. [Google Scholar] [CrossRef]
- Ghoshal, S.; Zhu, Q.; Asteian, A.; Lin, H.; Xu, H.; Ernst, G.; Barrow, J.C.; Xu, B.; Cameron, M.D.; Kamenecka, T.M.; et al. TNP [N2-(m-Trifluorobenzyl), N6-(p-nitrobenzyl)purine] ameliorates diet induced obesity and insulin resistance via inhibition of the IP6K1 pathway. Mol. Metab. 2016, 5, 903–917. [Google Scholar] [CrossRef]
- Pietrani, N.T.; Ferreira, C.N.; Rodrigues, K.F.; Perucci, L.O.; Carneiro, F.S.; Bosco, A.A.; Oliveira, M.C.; Pereira, S.S.; Teixeira, A.L.; Alvarez-Leite, J.I.; et al. Proresolving protein Annexin A1: The role in type 2 diabetes mellitus and obesity. Biomed. Pharmacother. 2018, 103, 482–489. [Google Scholar] [CrossRef]
- Van Diepen, J.A.; Robben, J.H.; Hooiveld, G.J.; Carmone, C.; Alsady, M.; Boutens, L.; Bekkenkamp-Grovenstein, M.; Hijmans, A.; Engelke, U.F.H.; Wevers, R.A.; et al. SUCNR1-mediated chemotaxis of macrophages aggravates obesity-induced inflammation and diabetes. Diabetologia 2017, 60, 1304–1313. [Google Scholar] [CrossRef]
- De Brito, G.; Lupinacci, F.C.; Beraldo, F.H.; Santos, T.G.; Roffé, M.; Lopes, M.H.; de Lima, V.C.; Martins, V.R.; Hajj, G.N. Loss of prion protein is associated with the development of insulin resistance and obesity. Biochem. J. 2017, 474, 2981–2991. [Google Scholar] [CrossRef]
- Dang, Z.; Avolio, E.; Thomas, A.C.; Faulkner, A.; Beltrami, A.P.; Cervellin, C.; Carrizzo, A.; Maciag, A.; Gu, Y.; Ciaglia, E.; et al. Transfer of a human gene variant associated with exceptional longevity improves cardiac function in obese type 2 diabetic mice through induction of the SDF-1/CXCR4 signalling pathway. Eur. J. Heart Fail. 2020, 22, 1568–1581. [Google Scholar] [CrossRef]
- Catalan, V.; Gomez-Ambrosi, J.; Rodríguez, A.; Silva, C.; Rotellar, F.; Gil, M.J.; Cienfuegos, J.; Salvador, J.; Frühbeck, G. Expression of caveolin-1 in human adipose tissue is upregulated in obesity and obesity-associated type 2 diabetes mellitus and related to inflammation. Clin. Endocrinol. 2008, 68, 213–219. [Google Scholar] [CrossRef]
- Elkhidir, A.E.; Eltaher, H.B.; Mohamed, A.O. Association of lipocalin-2 level, glycemic status and obesity in type 2 diabetes mellitus. BMC Res. Notes 2017, 10, 285. [Google Scholar] [CrossRef] [PubMed]
- Catalán, V.; Gómez-Ambrosi, J.; Pastor, C.; Rotellar, F.; Silva, C.; Rodríguez, A.; Gil, M.J.; Cienfuegos, J.A.; Salvador, J.; Vendrell, J.; et al. Influence of Morbid Obesity and Insulin Resistance on Gene Expression Levels of AQP7 in Visceral Adipose Tissue and AQP9 in Liver. Obes. Surg. 2008, 18, 695–701. [Google Scholar] [CrossRef] [PubMed]
- Ingallinella, P.; Peier, A.M.; Pocai, A.; Di Marco, A.; Desai, K.; Zytko, K.; Qian, Y.; Du, X.; Cellucci, A.; Monteagudo, E.; et al. PEGylation of Neuromedin U yields a promising candidate for the treatment of obesity and diabetes. Bioorganic Med. Chem. 2012, 20, 4751–4759. [Google Scholar] [CrossRef] [PubMed]
- Wittrisch, S.; Klöting, N.; Mörl, K.; Chakaroun, R.; Blüher, M.; Beck-Sickinger, A.G. NPY1R-targeted peptide-mediated delivery of a dual PPARα/γ agonist to adipocytes enhances adipogenesis and prevents diabetes progression. Mol. Metab. 2020, 31, 163–180. [Google Scholar] [CrossRef]
- Bódis, K.; Kahl, S.; Simon, M.-C.; Zhou, Z.; Sell, H.; Knebel, B.; Tura, A.; Strassburger, K.; Burkart, V.; Müssig, K.; et al. Reduced expression of stearoyl-CoA desaturase-1, but not free fatty acid receptor 2 or 4 in subcutaneous adipose tissue of patients with newly diagnosed type 2 diabetes mellitus. Nutr. Diabetes 2018, 8, 49. [Google Scholar] [CrossRef]
- Sánchez-Infantes, D.; White, U.A.; Elks, C.M.; Morrison, R.F.; Gimble, J.M.; Considine, R.V.; Ferrante, A.W.; Ravussin, E.; Stephens, J.M. Oncostatin M Is Produced in Adipose Tissue and Is Regulated in Conditions of Obesity and Type 2 Diabetes. J. Clin. Endocrinol. Metab. 2014, 99, E217–E225. [Google Scholar] [CrossRef]
- Subramanian, S.; Pallati, P.K.; Sharma, P.; Agrawal, D.K.; Nandipati, K.C. Significant association of TREM-1 with HMGB1, TLRs and RAGE in the pathogenesis of insulin resistance in obese diabetic populations. Am. J. Transl. Res. 2017, 9, 3224–3244. [Google Scholar]
- Trégouet, D.-A.; Groop, P.-H.; McGinn, S.; Forsblom, C.; Hadjadj, S.; Marre, M.; Parving, H.-H.; Tarnow, L.; Telgmann, R.; Godefroy, T.; et al. G/T Substitution in Intron 1 of the UNC13B Gene Is Associated with Increased Risk of Nephropathy in Patients With Type 1 Diabetes. Diabetes 2008, 57, 2843–2850. [Google Scholar] [CrossRef]
- Nomoto, H.; Pei, L.; Montemurro, C.; Rosenberger, M.; Furterer, A.; Coppola, G.; Nadel, B.; Pellegrini, M.; Gurlo, T.; Butler, P.C.; et al. Activation of the HIF1α/PFKFB3 stress response pathway in beta cells in type 1 diabetes. Diabetologia 2020, 63, 149–161. [Google Scholar] [CrossRef]
- Anjosa, Z.P.; Santos, M.M.S.; Rodrigues, N.J.; DE Lacerda, G.A.N.; Araujo, J.; Silva, J.D.A.; Tavares, N.D.A.C.; Guimarães, R.L.; Crovella, S.; Brandão, L.A.C. Polymorphism in ficolin-1 (FCN1) gene is associated with an earlier onset of type 1 diabetes mellitus in children and adolescents from northeast Brazil. J. Genet. 2016, 95, 1031–1034. [Google Scholar] [CrossRef]
- Paccagnini, D.; Sieswerda, L.; Rosu, V.; Masala, S.; Pacifico, A.; Gazouli, M.; Ikonomopoulos, J.; Ahmed, N.; Zanetti, S.; Sechi, L.A. Linking Chronic Infection and Autoimmune Diseases: Mycobacterium avium Subspecies paratuberculosis, SLC11A1 Polymorphisms and Type-1 Diabetes Mellitus. PLoS ONE 2009, 4, e7109. [Google Scholar] [CrossRef]
- Cinaglia, P.; Cannataro, M. Network alignment and motif discovery in dynamic networks. Netw. Model. Anal. Health Inform. Bioinform. 2022, 11, 38. [Google Scholar] [CrossRef]
- Cinaglia, P.; Guzzi, P.H.; Veltri, P. INTEGRO: An algorithm for data-integration and disease-gene association. In Proceedings of the 2018 IEEE International Conference on Bioinformatics and Biomedicine (BIBM), Madrid, Spain, 3–6 December 2018; pp. 2076–2081. [Google Scholar] [CrossRef]
- Freedman, B.I.; Hicks, P.J.; Bostrom, M.A.; Comeau, M.E.; Divers, J.; Bleyer, A.J.; Kopp, J.B.; Winkler, C.A.; Nelson, G.W.; Langefeld, C.D.; et al. Non-muscle myosin heavy chain 9 gene MYH9 associations in African Americans with clinically diagnosed type 2 diabetes mellitus-associated ESRD. Nephrol. Dial. Transplant. 2009, 24, 3366–3371. [Google Scholar] [CrossRef]
- Zhao, H.; Ma, L.; Yan, M.; Wang, Y.; Zhao, T.; Zhang, H.; Liu, P.; Liu, Y.; Li, P. Association between MYH9 and APOL1 Gene Polymorphisms and the Risk of Diabetic Kidney Disease in Patients with Type 2 Diabetes in a Chinese Han Population. J. Diabetes Res. 2018, 2018, 5068578. [Google Scholar] [CrossRef]
- Ling, C.; Cai, C.; Chang, B.; Shi, W.; Wei, F.; Yu, P.; Chen, L.; Li, W. MYH9 gene polymorphisms may be associated with cerebrovascular blood flow in patients with type 2 diabetes. Genet. Mol. Res. 2015, 14, 1008–1016. [Google Scholar] [CrossRef]
- Huang, Y.; Han, X.; Chang, T.; Li, F.-F.; Chen, X.; She, Y.-Q. Serum ErbB2 concentration positively correlated to the glycemic variations in newly diagnosed Type 2 diabetic patients. Sci. Rep. 2022, 12, 4940. [Google Scholar] [CrossRef]
- De Kay, J.T.; Carver, J.; Shevenell, B.; Kosta, A.M.; Tsibulnikov, S.; Certo, E.; Sawyer, D.B.; Ryzhov, S.; Robich, M.P. Decreased expression of ErbB2 on left ventricular epicardial cells in patients with diabetes mellitus. Cell. Signal. 2022, 96, 110360. [Google Scholar] [CrossRef]
- Akhtar, S.; Yousif, M.H.M.; Chandrasekhar, B.; Benter, I.F. Activation of EGFR/ERBB2 via Pathways Involving ERK1/2, P38 MAPK, AKT and FOXO Enhances Recovery of Diabetic Hearts from Ischemia-Reperfusion Injury. PLoS ONE 2012, 7, e39066. [Google Scholar] [CrossRef]
- Akhtar, S.; Yousif, M.; Dhaunsi, G.S.; Sarkhouh, F.; Chandrasekhar, B.; Attur, S.; Benter, I.F. Activation of ErbB2 and Downstream Signalling via Rho Kinases and ERK1/2 Contributes to Diabetes-Induced Vascular Dysfunction. PLoS ONE 2013, 8, e67813. [Google Scholar] [CrossRef]
- Wei, H.; Qu, H.; Wang, H.; Ji, B.; Ding, Y.; Liu, D.; Duan, Y.; Liang, H.; Peng, C.; Xiao, X.; et al. 1,25-Dihydroxyvitamin-D3 prevents the development of diabetic cardiomyopathy in type 1 diabetic rats by enhancing autophagy via inhibiting the β-catenin/TCF4/GSK-3β/mTOR pathway. J. Steroid Biochem. Mol. Biol. 2017, 168, 71–90. [Google Scholar] [CrossRef]
- Kim, S.; Kim, I.; Cho, W.; Oh, G.T.; Park, Y.M. Vimentin Deficiency Prevents High-Fat Diet-Induced Obesity and Insulin Resistance in Mice. Diabetes Metab. J. 2020, 45, 97–108. [Google Scholar] [CrossRef] [PubMed]
- Roefs, M.M.; Carlotti, F.; Jones, K.; Wills, H.; Hamilton, A.; Verschoor, M.; Durkin, J.M.W.; Perez, L.G.; Brereton, M.F.; McCulloch, L.; et al. Increased vimentin in human α- and β-cells in type 2 diabetes. J. Endocrinol. 2017, 233, 217–227. [Google Scholar] [CrossRef] [PubMed]
- Yang, S.; Xia, C.; Li, S.; Du, L.; Zhang, L.; Hu, Y. Mitochondrial dysfunction driven by the LRRK2-mediated pathway is associated with loss of Purkinje cells and motor coordination deficits in diabetic rat model. Cell Death Dis. 2014, 5, e1217. [Google Scholar] [CrossRef] [PubMed]
- Huang, M.-H.; Liu, Y.-F.; Nfor, O.N.; Hsu, S.-Y.; Lin, W.-Y.; Chang, Y.-S.; Liaw, Y.-P. Interactive Association Between Intronic Polymorphism (rs10506151) of the LRRK2 Gene and Type 2 Diabetes on Neurodegenerative Diseases. Pharm. Pers. Med. 2021, 14, 839–847. [Google Scholar] [CrossRef] [PubMed]
- Reinbothe, T.; Alkayyali, S.; Ahlqvist, E.; Tuomi, T.; Isomaa, B.; Lyssenko, V.; Renström, E. The human L-type calcium channel Cav1.3 regulates insulin release and polymorphisms in CACNA1D associate with type 2 diabetes. Diabetologia 2013, 56, 340–349. [Google Scholar] [CrossRef]
- Bonds, J.A.; Shetti, A.; Bheri, A.; Chen, Z.; Disouky, A.; Tai, L.; Mao, M.; Head, B.P.; Bonini, M.G.; Haus, J.M.; et al. Depletion of Caveolin-1 in Type 2 Diabetes Model Induces Alzheimer’s Disease Pathology Precursors. J. Neurosci. 2019, 39, 8576–8583. [Google Scholar] [CrossRef]
- Luo, M.; Xu, C.; Luo, Y.; Wang, G.; Wu, J.; Wan, Q. Circulating miR-103 family as potential biomarkers for type 2 diabetes through targeting CAV-1 and SFRP4. Acta Diabetol. 2020, 57, 309–322. [Google Scholar] [CrossRef]
- Oh, Y.S.; Lee, T.S.; Cheon, G.J.; Jang, I.-S.; Jun, H.-S.; Park, S.C. Modulation of Insulin Sensitivity and Caveolin-1 Expression by Orchidectomy in a Nonobese Type 2 Diabetes Animal Model. Mol. Med. 2011, 17, 4–11. [Google Scholar] [CrossRef]
- Oh, Y.S.; Khil, L.-Y.; Cho, K.A.; Ryu, S.J.; Ha, M.K.; Cheon, G.J.; Lee, T.S.; Yoon, J.-W.; Jun, H.-S.; Park, S.C. A potential role for skeletal muscle caveolin-1 as an insulin sensitivity modulator in ageing-dependent non-obese type 2 diabetes: Studies in a new mouse model. Diabetologia 2008, 51, 1025–1034. [Google Scholar] [CrossRef]
- Elçioğlu, K.H.; Kabasakal, L.; Çetinel, S.; Conturk, G.; Sezen, S.F.; Ayanoğlu-Dülger, G. Changes in caveolin-1 expression and vasoreactivity in the aorta and corpus cavernosum of fructose and streptozotocin-induced diabetic rats. Eur. J. Pharmacol. 2010, 642, 113–120. [Google Scholar] [CrossRef]
- Carrillo-Sepulveda, M.A.; Matsumoto, T. Phenotypic Modulation of Mesenteric Vascular Smooth Muscle Cells from Type 2 Diabetic Rats is Associated with Decreased Caveolin-1 Expression. Cell. Physiol. Biochem. 2014, 34, 1497–1506. [Google Scholar] [CrossRef]
- Stadion, M.; Schwerbel, K.; Graja, A.; Baumeier, C.; Rödiger, M.; Jonas, W.; Wolfrum, C.; Staiger, H.; Fritsche, A.; Häring, H.-U.; et al. Increased Ifi202b/IFI16 expression stimulates adipogenesis in mice and humans. Diabetologia 2018, 61, 1167–1179. [Google Scholar] [CrossRef] [Green Version]
- Mousa, U.; Onur, H.; Utkan, G. Is obesity always a risk factor for all breast cancer patients? c-erbB2 expression is significantly lower in obese patients with early stage breast cancer. Clin. Transl. Oncol. 2012, 14, 923–930. [Google Scholar] [CrossRef]
- Roh, E.; Yoo, H.J. The Role of Adipose Tissue Lipolysis in Diet-Induced Obesity: Focus on Vimentin. Diabetes Metab. J. 2021, 45, 43–45. [Google Scholar] [CrossRef]
- Abaj, F.; Saeedy, S.A.G.; Mirzaei, K. Mediation role of body fat distribution (FD) on the relationship between CAV1 rs3807992 polymorphism and metabolic syndrome in overweight and obese women. BMC Med. Genom. 2021, 14, 202. [Google Scholar] [CrossRef]
- Razani, B.; Combs, T.P.; Wang, X.B.; Frank, P.G.; Park, D.S.; Russell, R.G.; Li, M.; Tang, B.; Jelicks, L.A.; Scherer, P.E.; et al. Caveolin-1-deficient Mice Are Lean, Resistant to Diet-induced Obesity, and Show Hypertriglyceridemia with Adipocyte Abnormalities. J. Biol. Chem. 2002, 277, 8635–8647. [Google Scholar] [CrossRef]
- Pandey, V.; Vijayakumar, M.V.; Ajay, A.K.; Malvi, P.; Bhat, M.K. Diet-induced obesity increases melanoma progression: Involvement of Cav-1 and FASN. Int. J. Cancer 2012, 130, 497–508. [Google Scholar] [CrossRef]
- Czikora, I.; Feher, A.; Lucas, R.; Fulton, D.J.R.; Bagi, Z. Caveolin-1 prevents sustained angiotensin II-induced resistance artery constriction and obesity-induced high blood pressure. Am. J. Physiol. Circ. Physiol. 2015, 308, H376–H385. [Google Scholar] [CrossRef]
- Pecci, A.; Ma, X.; Savoia, A.; Adelstein, R.S. MYH9: Structure, functions and role of non-muscle myosin IIA in human disease. Gene 2018, 664, 152–167. [Google Scholar] [CrossRef]
- Holbro, T.; Beerli, R.R.; Maurer, F.; Koziczak, M.; Barbas, C.F.; Hynes, N.E. The ErbB2/ErbB3 heterodimer functions as an oncogenic unit: ErbB2 requires ErbB3 to drive breast tumor cell proliferation. Proc. Natl. Acad. Sci. USA 2003, 100, 8933–8938. [Google Scholar] [CrossRef]
- Forrest, M.P.; Hill, M.J.; Quantock, A.J.; Martin-Rendon, E.; Blake, D.J. The emerging roles of TCF4 in disease and development. Trends Mol. Med. 2014, 20, 322–331. [Google Scholar] [CrossRef] [PubMed]
- Battaglia, R.; Delic, S.; Herrmann, H.; Snider, N.T. Vimentin on the move: New developments in cell migration. F1000Research 2018, 7, 1796. [Google Scholar] [CrossRef] [PubMed] [Green Version]
- Berwick, D.C.; Heaton, G.R.; Azeggagh, S.; Harvey, K. LRRK2 Biology from structure to dysfunction: Research progresses, but the themes remain the same. Mol. Neurodegener. 2019, 14, 49. [Google Scholar] [CrossRef] [PubMed]
- Cao, H.; Alston, L.; Ruschman, J.; Hegele, R.A. Heterozygous CAV1 frameshift mutations (MIM 601047) in patients with atypical partial lipodystrophy and hypertriglyceridemia. Lipids Health Dis. 2008, 7, 3. [Google Scholar] [CrossRef] [PubMed]
- Jønsson, K.L.; Laustsen, A.; Krapp, C.; Skipper, K.A.; Thavachelvam, K.; Hotter, D.; Egedal, J.H.; Kjolby, M.; Mohammadi, P.; Prabakaran, T.; et al. IFI16 is required for DNA sensing in human macrophages by promoting production and function of cGAMP. Nat. Commun. 2017, 8, 14391. [Google Scholar] [CrossRef]
- Yan, Y.; Shi, R.; Yu, X.; Sun, C.; Zang, W.; Tian, H. Identification of atrial fibrillation-associated microRNAs in left and right atria of rheumatic mitral valve disease patients. Genes Genet. Syst. 2019, 94, 23–34. [Google Scholar] [CrossRef]
- Wang, S.; Min, J.; Yu, Y.; Yin, L.; Wang, Q.; Shen, H.; Yang, J.; Zhang, P.; Xiao, J.; Wang, Z. Differentially expressed miRNAs in circulating exosomes between atrial fibrillation and sinus rhythm. J. Thorac. Dis. 2019, 11, 4337–4348. [Google Scholar] [CrossRef]
- Yan, Y.; Song, D.; Zhang, X.; Hui, G.; Wang, J. GEO Data Sets Analysis Identifies COX-2 and Its Related Micro RNAs as Biomarkers for Non-Ischemic Heart Failure. Front. Pharmacol. 2020, 11, 1155. [Google Scholar] [CrossRef]
- Guo, X.; Wang, X.; Wang, Y.; Zhang, C.; Quan, X.; Zhang, Y.; Jia, S.; Ma, W.; Fan, Y.; Wang, C. Variants in the SMARCA4 gene was associated with coronary heart disease susceptibility in Chinese han population. Oncotarget 2017, 8, 7350–7356. [Google Scholar] [CrossRef]
- Matsha, T.E.; Kengne, A.P.; Hector, S.; Mbu, D.L.; Yako, Y.Y.; Erasmus, R.T. MicroRNA profiling and their pathways in South African individuals with prediabetes and newly diagnosed type 2 diabetes mellitus. Oncotarget 2018, 9, 30485–30498. [Google Scholar] [CrossRef]
- Tavano, F.; Fontana, A.; Mazza, T.; Gioffreda, D.; Biagini, T.; Palumbo, O.; Carella, M.; Andriulli, A. Early-Onset Diabetes as Risk Factor for Pancreatic Cancer: miRNA Expression Profiling in Plasma Uncovers a Role for miR-20b-5p, miR-29a, and miR-18a-5p in Diabetes of Recent Diagnosis. Front. Oncol. 2020, 10, 1567. [Google Scholar] [CrossRef]
- Ding, L.; Ai, D.; Wu, R.; Zhang, T.; Jing, L.; Lu, J.; Zhong, L. Identification of the differential expression of serum microRNA in type 2 diabetes. Biosci. Biotechnol. Biochem. 2016, 80, 461–465. [Google Scholar] [CrossRef] [Green Version]
- Erlich, H.A.; Valdes, A.M.; Julier, C.; Mirel, D.; Noble, J.A.; the Type I Diabetes Genetics Consortium. Evidence for association of the TCF7 locus with type I diabetes. Genes Immun. 2009, 10 (Suppl. 1), S54–S59. [Google Scholar] [CrossRef]
- Binia, A.; Van Stiphout, N.; Liang, L.; Michel, S.; Bhavsar, P.K.; Chung, K.F.; Brightling, C.E.; Barnes, P.J.; Kabesch, M.; Bush, A.; et al. A Polymorphism Affecting MYB Binding within the Promoter of the PDCD4 Gene is Associated with Severe Asthma in Children. Hum. Mutat. 2013, 34, 1131–1139. [Google Scholar] [CrossRef]
- Goldfine, A.B.; Crunkhorn, S.; Costello, M.; Gami, H.; Landaker, E.J.; Niinobe, M.; Yoshikawa, K.; Lo, D.; Warren, A.; Jimenez-Chillaron, J.; et al. Necdin and E2F4 Are Modulated by Rosiglitazone Therapy in Diabetic Human Adipose and Muscle Tissue. Diabetes 2006, 55, 640–650. [Google Scholar] [CrossRef]
- Rakshit, K.; Matveyenko, A.V. Induction of Core Circadian Clock Transcription Factor Bmal1 Enhances β-Cell Function and Protects Against Obesity-Induced Glucose Intolerance. Diabetes 2020, 70, 143–154. [Google Scholar] [CrossRef]
- Stratigopoulos, G.; LeDuc, C.A.; Cremona, M.L.; Chung, W.K.; Leibel, R.L. Cut-like Homeobox 1 (CUX1) Regulates Expression of the Fat Mass and Obesity-associated and Retinitis Pigmentosa GTPase Regulator-interacting Protein-1-like (RPGRIP1L) Genes and Coordinates Leptin Receptor Signaling. J. Biol. Chem. 2011, 286, 2155–2170. [Google Scholar] [CrossRef]
- Sedaghat, F.; Cheraghpour, M.; Hosseini, S.A.; Pourvali, K.; Teimoori-Toolabi, L.; Mehrtash, A.; Talaei, R.; Zand, H. Hypomethylation of NANOG promoter in colonic mucosal cells of obese patients: A possible role of NF-κB. Br. J. Nutr. 2019, 122, 499–508. [Google Scholar] [CrossRef]
- Patankar, J.V.; Chandak, P.G.; Obrowsky, S.; Pfeifer, T.; Diwoky, C.; Uellen, A.; Sattler, W.; Stollberger, R.; Hoefler, G.; Heinemann, A.; et al. Loss of intestinal GATA4 prevents diet-induced obesity and promotes insulin sensitivity in mice. Am. J. Physiol. Endocrinol. Metab. 2011, 300, E478–E488. [Google Scholar] [CrossRef]
- Drareni, K.; Ballaire, R.; Barilla, S.; Mathew, M.J.; Toubal, A.; Fan, R.; Liang, N.; Chollet, C.; Huang, Z.; Kondili, M.; et al. GPS2 Deficiency Triggers Maladaptive White Adipose Tissue Expansion in Obesity via HIF1A Activation. Cell Rep. 2018, 24, 2957–2971.e6. [Google Scholar] [CrossRef] [Green Version]


Disclaimer/Publisher’s Note: The statements, opinions and data contained in all publications are solely those of the individual author(s) and contributor(s) and not of MDPI and/or the editor(s). MDPI and/or the editor(s) disclaim responsibility for any injury to people or property resulting from any ideas, methods, instructions or products referred to in the content. |
© 2023 by the authors. Licensee MDPI, Basel, Switzerland. This article is an open access article distributed under the terms and conditions of the Creative Commons Attribution (CC BY) license (https://creativecommons.org/licenses/by/4.0/).
Share and Cite
Ganekal, P.; Vastrad, B.; Kavatagimath, S.; Vastrad, C.; Kotrashetti, S. Bioinformatics and Next-Generation Data Analysis for Identification of Genes and Molecular Pathways Involved in Subjects with Diabetes and Obesity. Medicina 2023, 59, 309. https://doi.org/10.3390/medicina59020309
Ganekal P, Vastrad B, Kavatagimath S, Vastrad C, Kotrashetti S. Bioinformatics and Next-Generation Data Analysis for Identification of Genes and Molecular Pathways Involved in Subjects with Diabetes and Obesity. Medicina. 2023; 59(2):309. https://doi.org/10.3390/medicina59020309
Chicago/Turabian StyleGanekal, Prashanth, Basavaraj Vastrad, Satish Kavatagimath, Chanabasayya Vastrad, and Shivakumar Kotrashetti. 2023. "Bioinformatics and Next-Generation Data Analysis for Identification of Genes and Molecular Pathways Involved in Subjects with Diabetes and Obesity" Medicina 59, no. 2: 309. https://doi.org/10.3390/medicina59020309