
Is There a Risk of Misinterpretation of Potassium Concentration from Undetectable Hemolysis Using a POCT Blood Gas Analyzer in the Emergency Department?
 , ,
, ,
Abstract
:1. Introduction
2. Materials and Methods
2.1. Population
2.2. Study Design
2.3. Data Collection
2.4. Statistical Analysis
3. Results
4. Discussion
5. Conclusions
Author Contributions
Funding
Institutional Review Board Statement
Informed Consent Statement
Data Availability Statement
Acknowledgments
Conflicts of Interest
References
- Lippi, G.; Blanckaert, N.; Bonini, P.; Green, S.; Kitchen, S.; Palicka, V.; Vassault, A.J.; Plebani, M. Haemolysis: An overview of the leading cause of unsuitable specimens in clinical laboratories. Clin. Chem. Lab. Med. 2008, 46, 764–772. [Google Scholar] [CrossRef] [PubMed]
- Bonini, P.; Plebani, M.; Ceriotti, F.; Rubboli, F. Errors in laboratory medicine. Clin. Chem. 2002, 48, 691–698. [Google Scholar] [CrossRef] [PubMed] [Green Version]
- Lippi, G.; von Meyer, A.; Cadamuro, J.; Simundic, A.-M. Blood sample quality. Diagnnostics. 2019, 6, 25–31. [Google Scholar] [CrossRef]
- Sciacovelli, L.; Plebani, M. The IFCC Working Group on laboratory errors and patient safety. Clin. Chim. Acta. 2009, 404, 79–85. [Google Scholar] [CrossRef]
- Global Preanalytical Scientific Committee—SpecimenCare. Available online: https://specimencare.com/global-preanalytical-scientific-committee/ (accessed on 13 December 2022).
- Lippi, G.; Plebani, M.; Di Somma, S.; Cervellin, G. Hemolyzed specimens: A major challenge for emergency departments and clinical laboratories. Crit. Rev. Clin. Lab. Sci. 2011, 48, 143–153. [Google Scholar] [CrossRef]
- Möckel, M.; Luppa, P.B. Why hemolysis detection should be an integral part of any near-patient blood gas analysis. J. Lab. Med. 2021, 45, 193–195. [Google Scholar] [CrossRef]
- Çuhadar, S.; Özkanay-Yörük, H.; Köseoğlu, M.; Katırcıoğlu, K. Detection of preanalytical errors in arterial blood gas analysis. Biochem. Med. 2022, 32, 020708. [Google Scholar] [CrossRef] [PubMed]
- Duhalde, H.; Skogö, J.; Karlsson, M. Point-of-care hemolysis detection in blood gas specimens directly at the emergency department. Scand. J. Clin. Lab. Investig. 2019, 79, 283–287. [Google Scholar] [CrossRef] [PubMed]
- Ferreira, C.E.S.; Guerra, J.C.C.; Slhessarenko, N.; Scartezini, M.; Franca, C.N.; Colombini, M.P.; Berlitz, F.; Machado, A.M.O.; Campana, G.A.; Faulhaber, A.C.L.; et al. Point-of-Care Testing: General Aspects. Clin. Lab. 2018, 64, 1–9. [Google Scholar] [CrossRef]
- Lippi, G.; Ippolito, L.; Fontana, R. Prevalence of hemolytic specimens referred for arterial blood gas analysis. Clin. Chem. Lab. Med. 2011, 49, 931–932. [Google Scholar] [CrossRef]
- Valli, G.; Fratini, P.; Volpe, N.; De Marco, F.; Pandolfi, C.; Ancona, C.; Ruggieri, M. Analysis of the costs of emergency room management of critically ill patients. Ital. J. Emerg. Med. 2020, 9, 20. [Google Scholar] [CrossRef]
- Giavarina, D. Understanding Bland Altman analysis. Biochem. Med. 2015, 25, 141–151. [Google Scholar] [CrossRef] [PubMed] [Green Version]
- Wilson, A.; Sweeney, M.; Mark Lynch, P.L.; O’Kane, M.J. Hemolysis Rates in Whole Blood Samples for Blood Gas/Electrolyte Analysis by Point-of-Care Testing. J. Appl. Lab. Med. 2018, 3, 144–145. [Google Scholar] [CrossRef] [PubMed] [Green Version]
- Revuelta-López, E.; Barallat, J.; Cserkóová, A.; Gálvez-Montón, C.; Jaffe, A.S.; Januzzi, J.L.; Bayes-Genis, A. Pre-analytical considerations in biomarker research: Focus on cardiovascular disease. Clin. Chem. Lab. Med. 2021, 59, 1747–1760. [Google Scholar] [CrossRef]
- Phelan, M.P.; Reineks, E.Z.; Schold, J.D.; Hustey, F.M.; Chamberlin, J.; Procop, G.W. Preanalytic Factors Associated With Hemolysis in Emergency Department Blood Samples. Arch. Pathol. Lab. Med. 2018, 142, 229–235. [Google Scholar] [CrossRef] [Green Version]
- Shidhani, M.A. Effect of Hemolysis on Plasma Cardiac Troponin Levels at Clinically Relevant Concentrations: An Experimental Study. Biol. Med. 2014, 6, 1000217. [Google Scholar] [CrossRef]
- Salvagno, G.L.; Lippi, G.; Gelati, M.; Guidi, G.C. Hemolysis, lipaemia and icterus in specimens for arterial blood gas analysis. Clin. Biochem. 2012, 45, 372–373. [Google Scholar] [CrossRef]
- C46A2: Blood Gas & pH Analysis & Related Measurements. Available online: https://clsi.org/standards/products/clinical-chemistry-and-toxicology/documents/c46/ (accessed on 22 October 2022).
- Phelan, M.P.; Hustey, F.M.; Good, D.M.; Reineks, E.Z. Seeing Red: Blood Sample Hemolysis Is Associated with Prolonged Emergency Department Throughput. J. Appl. Lab. Med. 2020, 5, 732–737. [Google Scholar] [CrossRef]
- O’Hara, M.; Wheatley, E.G.; Kazmierczak, S.C. The Impact of Undetected In Vitro Hemolysis or Sample Contamination on Patient Care and Outcomes in Point-of-Care Testing: A Retrospective Study. J. Appl. Lab. Med. 2020, 5, 332–341. [Google Scholar] [CrossRef]
- Viera, A.J.; Wouk, N. Potassium Disorders: Hypokalemia and Hyperkalemia. Am. Fam. Physician. 2015, 92, 487–495. [Google Scholar]
- Mizzi, J.M.; Rizzo, C.; Fava, S. Pseudohyperkalaemia in essential thrombocytosis: An important clinical reminder. Endocrinol. Diabetes Metab. Case Rep. 2021, 2021, EDM210013. [Google Scholar] [CrossRef]
- Asirvatham, J.R.; Moses, V.; Bjornson, L. Errors in Potassium Measurement: A Laboratory Perspective for the Clinician. N. Am. J. Med. Sci. 2013, 5, 255–259. [Google Scholar] [CrossRef] [PubMed]
- Collins, A.J.; Pitt, B.; Reaven, N.; Funk, S.; McGaughey, K.; Wilson, D.; Bushinsky, D.A. Association of Serum Potassium with All-Cause Mortality in Patients with and without Heart Failure, Chronic Kidney Disease, and/or Diabetes. Am. J. Nephrol. 2017, 46, 213–221. [Google Scholar] [CrossRef] [PubMed]
- Adeva-Andany, M.M.; Fernández-Fernández, C.; Mouriño-Bayolo, D.; Castro-Quintela, E.; Domínguez-Montero, A. Sodium bicarbonate therapy in patients with metabolic acidosis. Sci. World J. 2014, 2014, 627673. [Google Scholar] [CrossRef] [PubMed] [Green Version]
- Adamczak, M.; Chudek, J.; Zejda, J.; Bartmańska, M.; Grodzicki, T.; Zdrojewski, T.; Wiecek, A. Prevalence of hypokalemia in older persons: Results from the PolSenior national survey. Eur. Geriatr. Med. 2021, 12, 981–987. [Google Scholar] [CrossRef] [PubMed]


| Online Questionnaire Items |
|---|
| Resident Doctor and responsible physician |
| ED’s Hospital site |
| Date and time of blood sample |
| Sex and date of birth |
| Clinical symptom on the Triage |
| Ml of blood collected and exclusions of criteria base on the quality and quantity of the sample |
| Method (arterial puncture or cannulation and device of syringe) |
| Evidence of hemolysis from the H10 analysis (yes/no) |
| Data from rapid arterial blood gas analysis and normal venous analysis: potassium, calcium, pH, pCO2, pO2, lactates from BGA potassium from venous sample |
| n | % Hemolysis | ||
|---|---|---|---|
| Complete | 525 | 18% mean | ±19% SD |
| Operator 5 | 11 | 55% | |
| Operator 8 | 20 | 65% | |
| Operator 13 | 22 | 55% | |
| Final Group without operator out of +2 SD | 472 | 12% mean | ±13% SD |
| Non-Hemolysis | Hemolysis | ||
|---|---|---|---|
| n | 396 | 76 | |
| Female, % | 43% | 38% | n.s. |
| Symptoms: | |||
| Dyspnea | 54.7% | 64.5% | n.s. |
| Coma | 9.2% | 6.6% | n.s. |
| Chest Pain | 8.4% | 10.5% | n.s. |
| Abdominal Pain | 7.1% | 5.3% | n.s. |
| Fever | 6.6% | 9.2% | n.s. |
| Syncope | 4.3% | 1.3% | n.s. |
| Trauma | 2.5% | 2.6% | n.s. |
| Others | 6.0% | - | 0.01 |
| K+BGA,mEq/L | 3.99 ± 0.03 | 4.6 ± 0.11 | <0.001 |
| Ca++BGA, mEq/L | 1.149 ± 0.003 | 1.149 ± 0.01 | n.s. |
| pH | 7.43 ± 0.01 | 7.42 ± 0.01 | n.s. |
| pO2, mmHg | 86.1 ± 1.7 | 78.7 ± 2.2 | n.s. |
| pCO2, mmHg | 38.1 ± 0.5 | 39.7 ± 1.4 | n.s. |
| La-, mmol/L | 1.9 ± 0.2 | 2.4 ± 0.4 | n.s. |
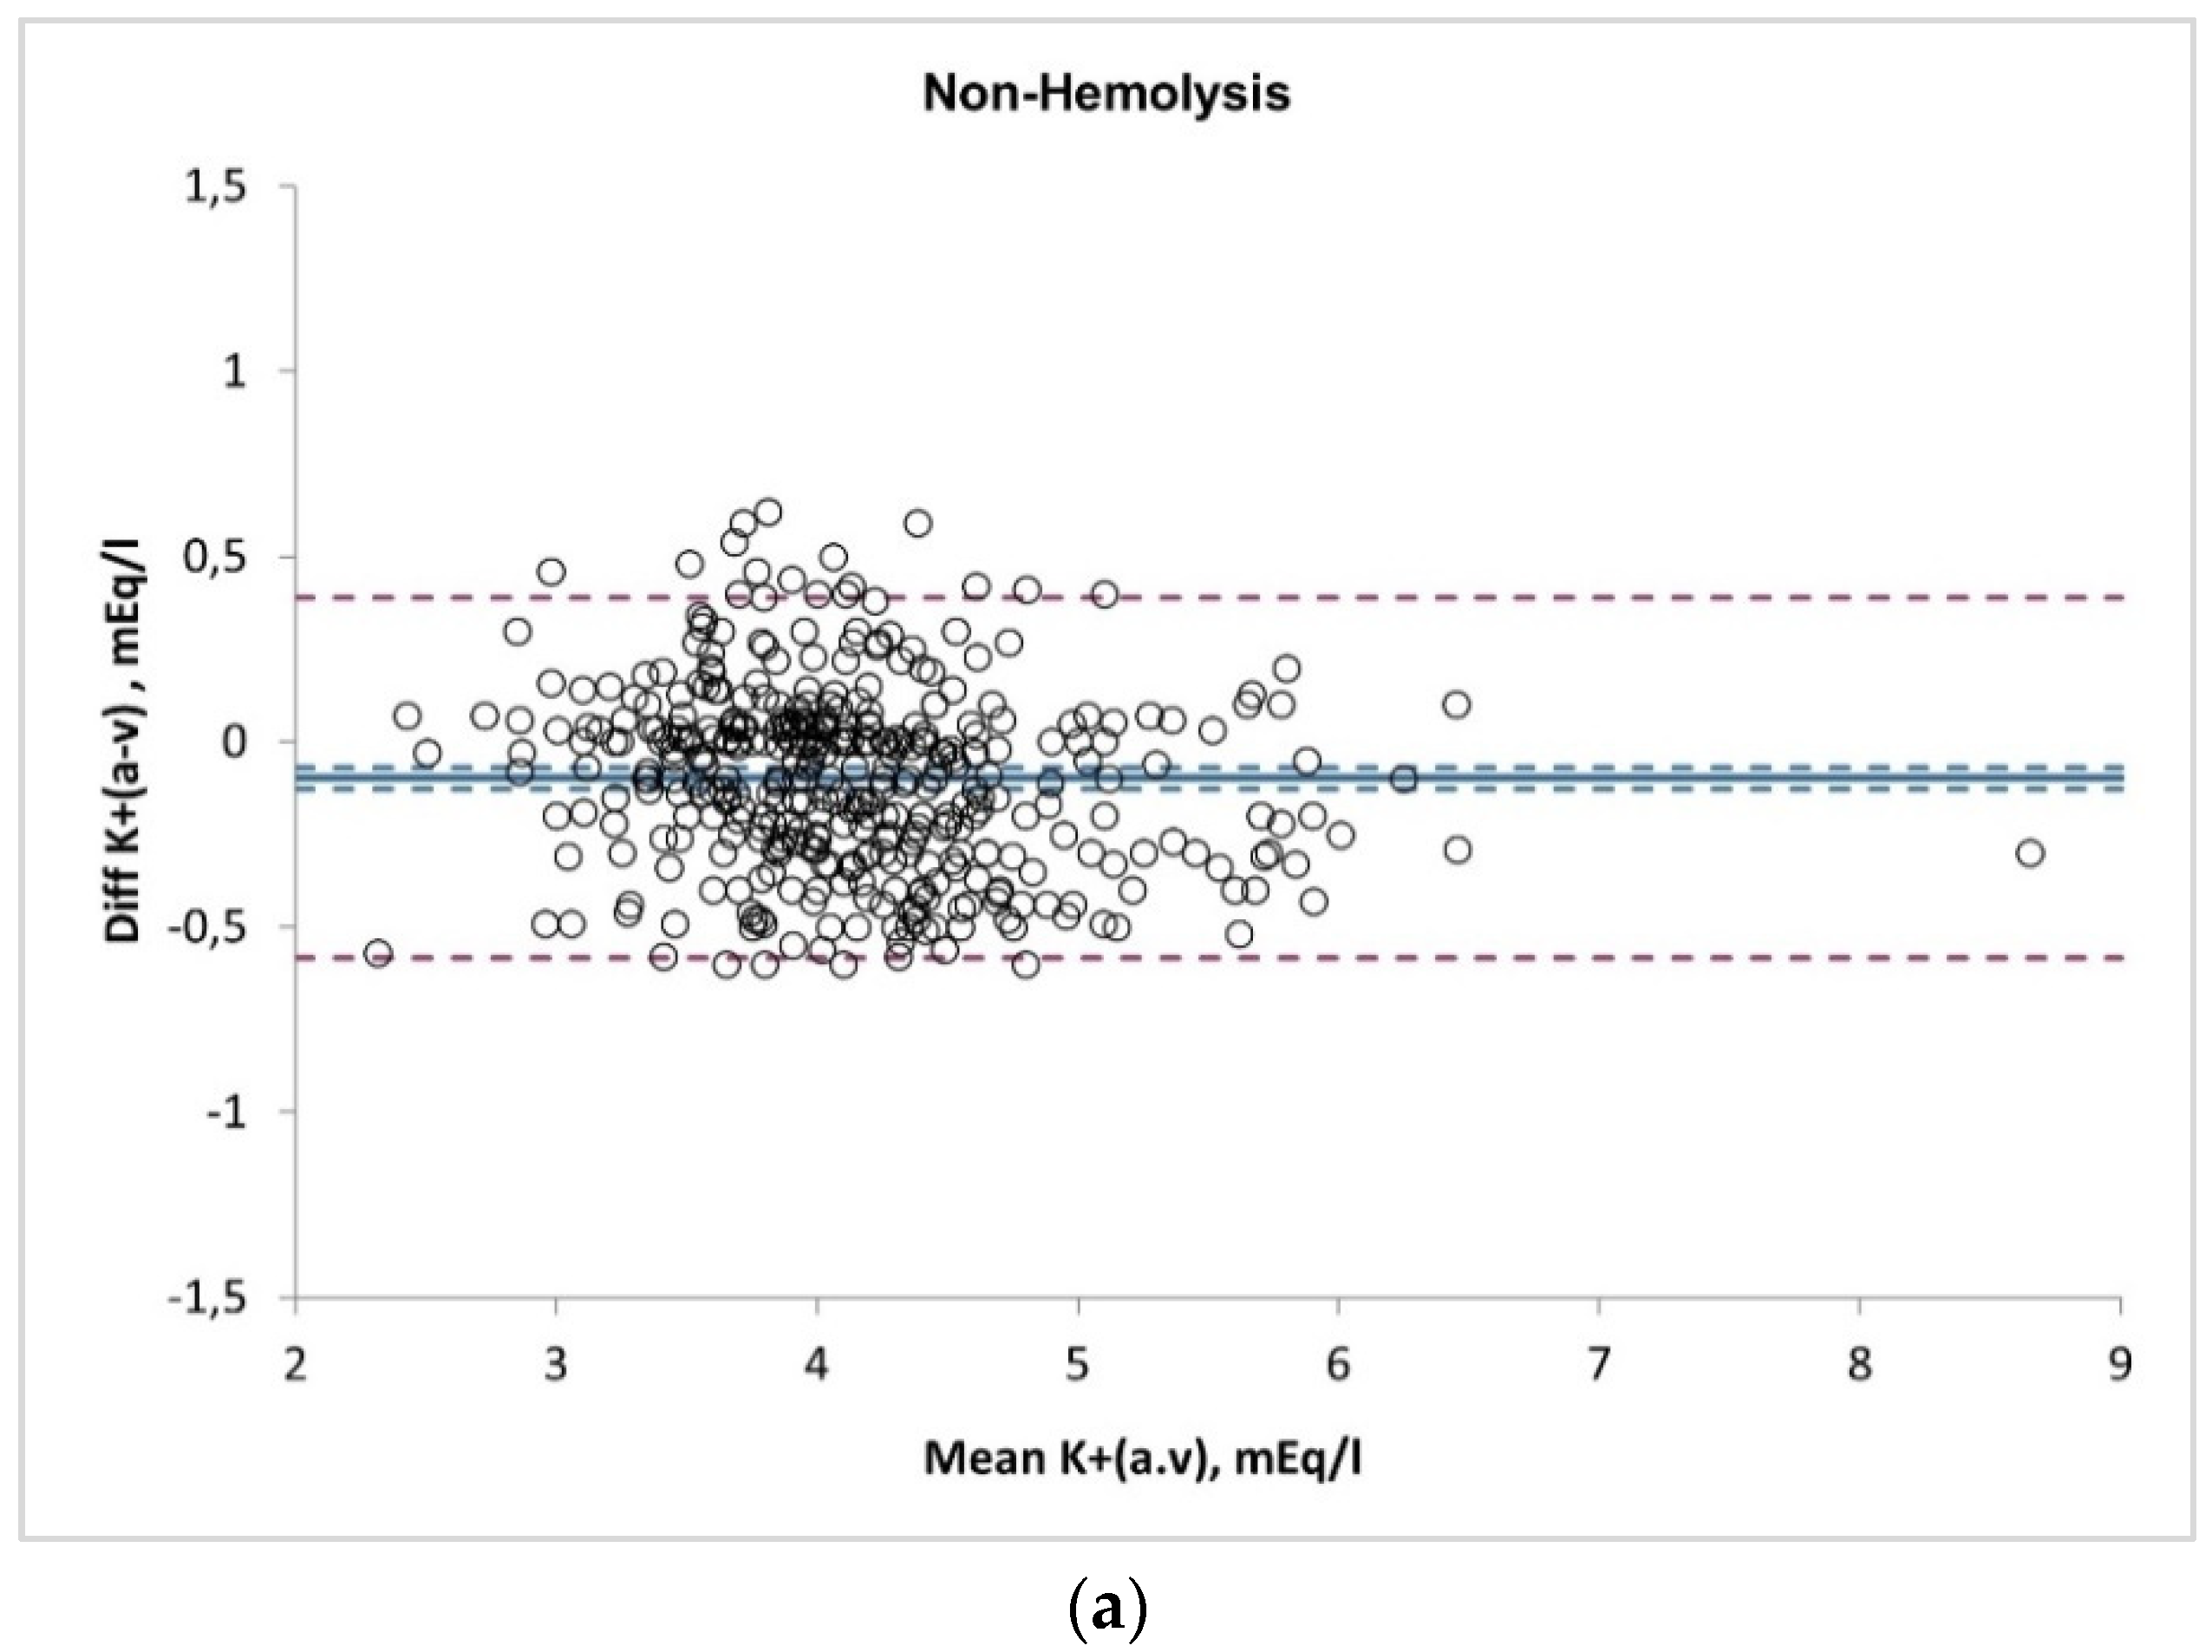
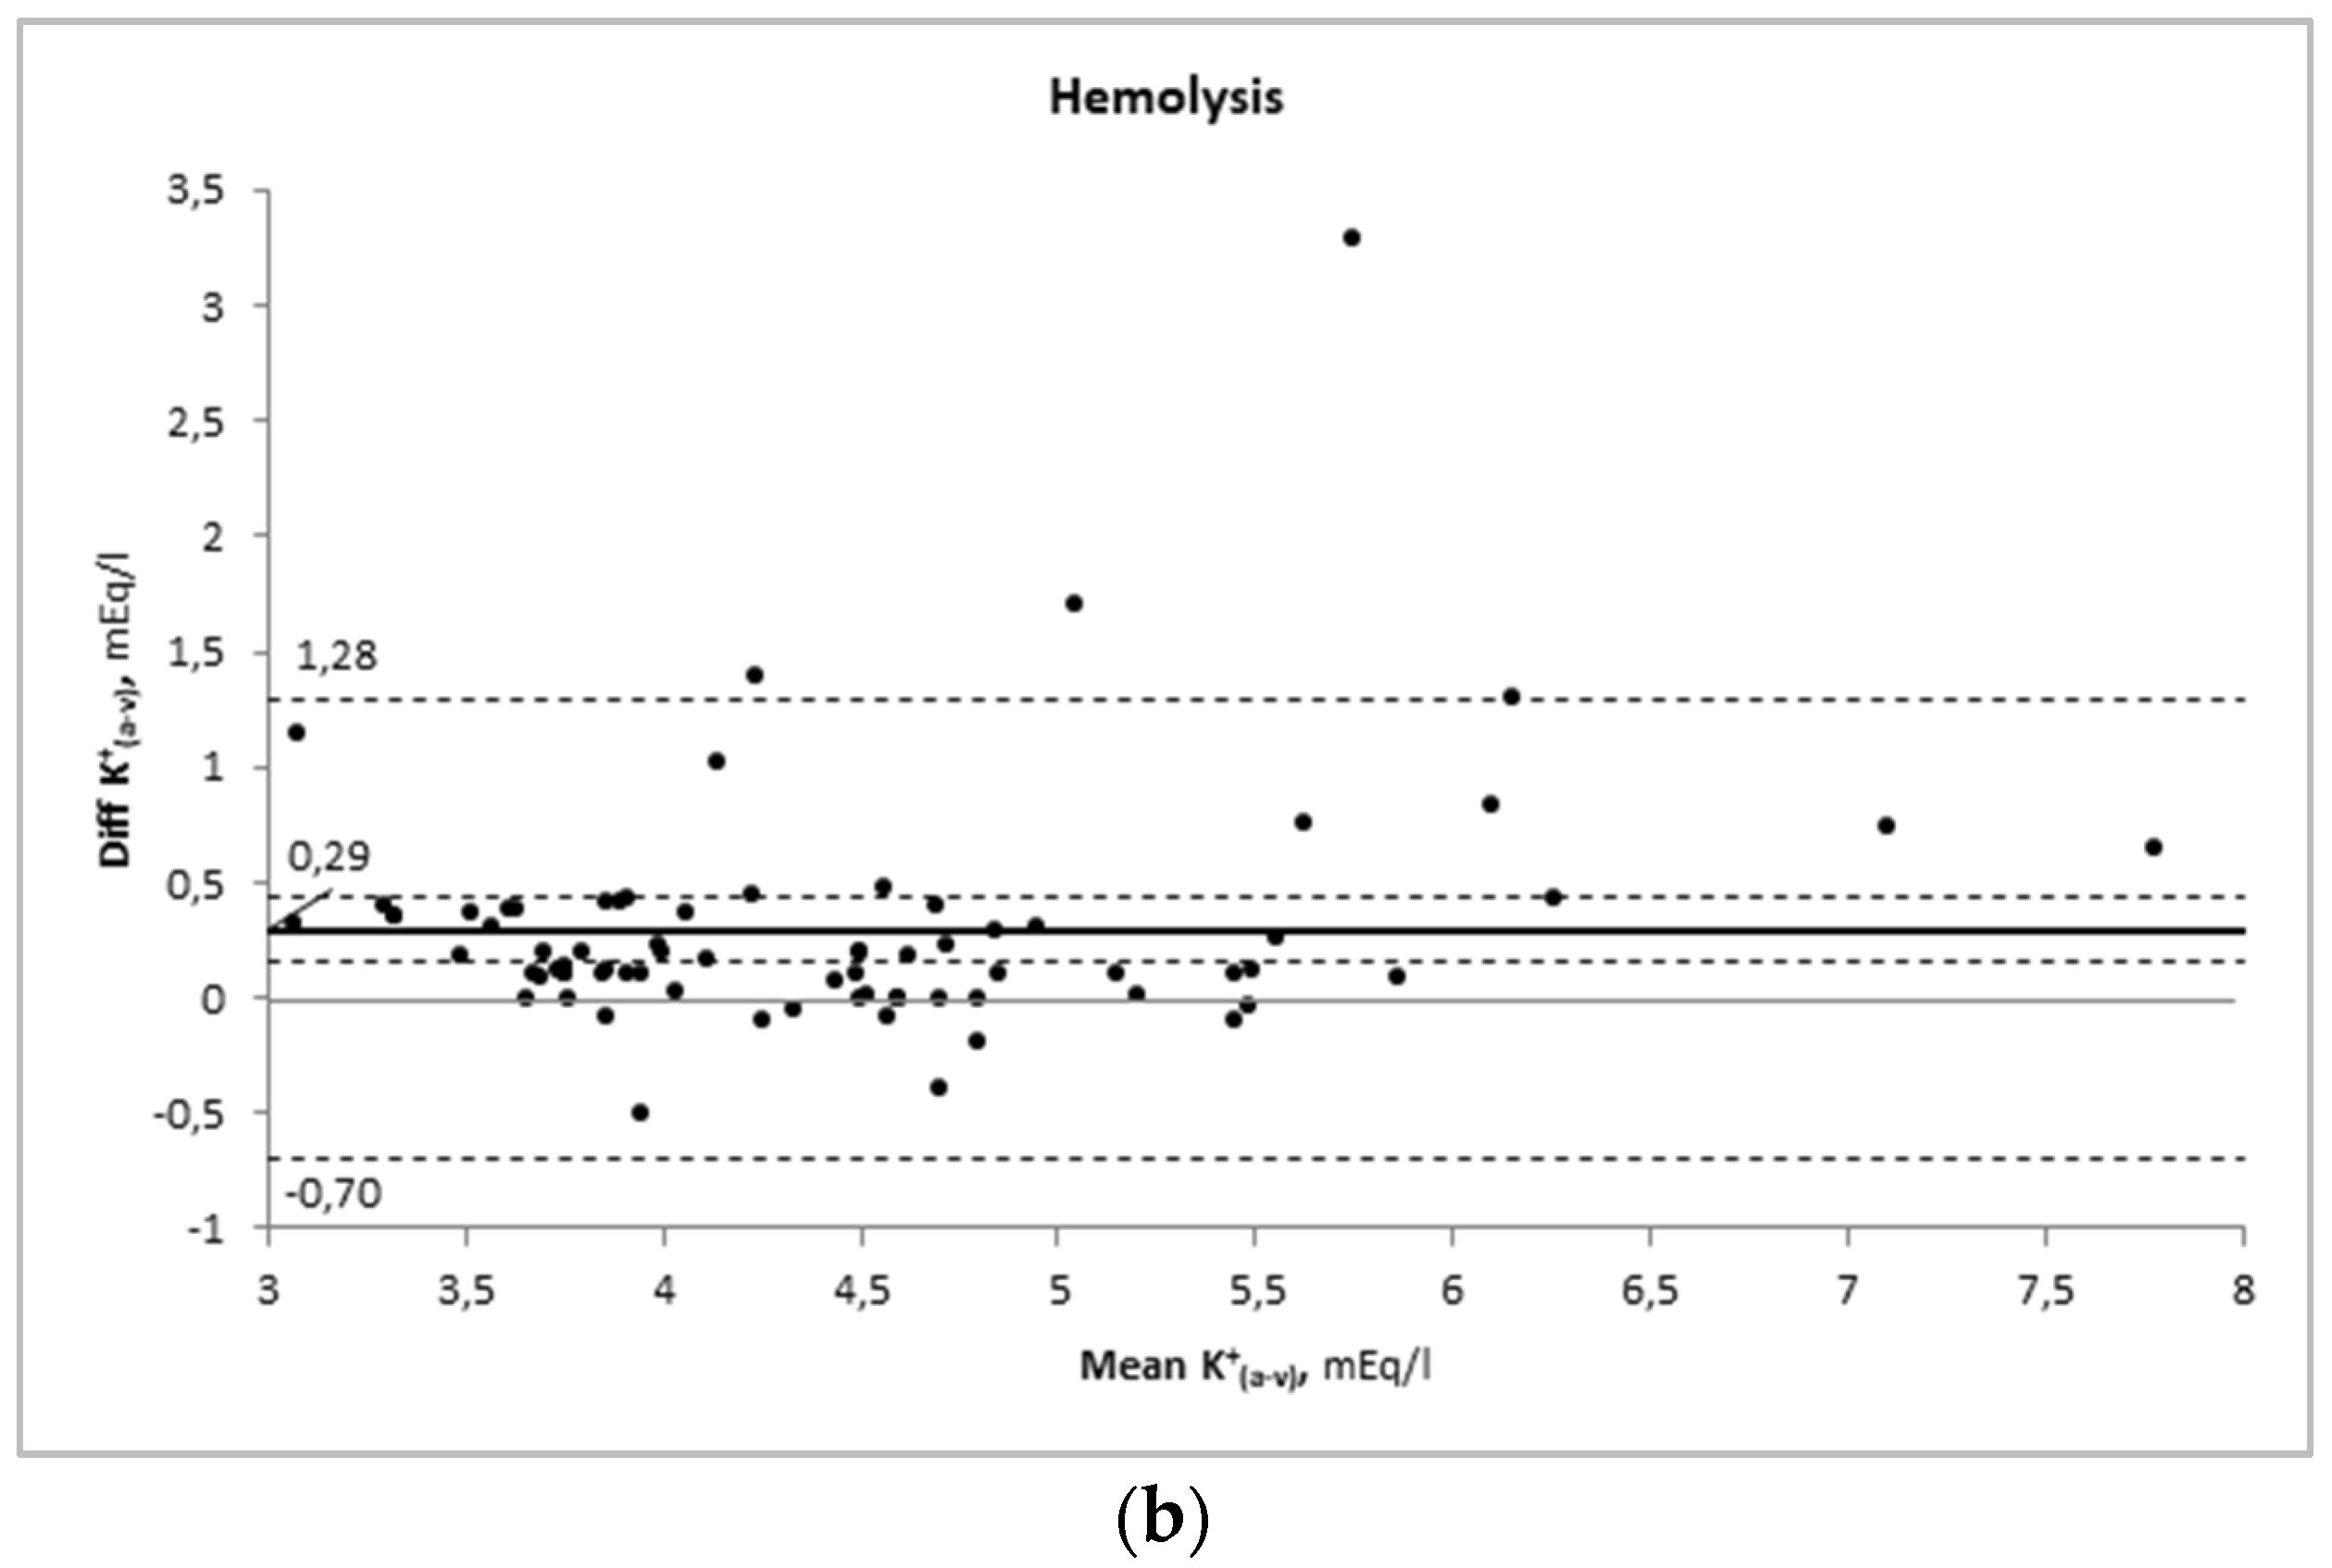
| D(a-v)K+, mEq/L | −0.19 ± 0.02 | 0.29 ± 0.06 | <0.01 |
Disclaimer/Publisher’s Note: The statements, opinions and data contained in all publications are solely those of the individual author(s) and contributor(s) and not of MDPI and/or the editor(s). MDPI and/or the editor(s) disclaim responsibility for any injury to people or property resulting from any ideas, methods, instructions or products referred to in the content. |
© 2022 by the authors. Licensee MDPI, Basel, Switzerland. This article is an open access article distributed under the terms and conditions of the Creative Commons Attribution (CC BY) license (https://creativecommons.org/licenses/by/4.0/).
Share and Cite
Nigro, M.; Valli, G.; Marchionne, M.L.; Sattarinia, D.; Silvestrini, F.; De Pietro, D.; Fazzini, S.; Roselli, G.; Spallino, A.; Praticò, V.; et al. Is There a Risk of Misinterpretation of Potassium Concentration from Undetectable Hemolysis Using a POCT Blood Gas Analyzer in the Emergency Department? Medicina 2023, 59, 66. https://doi.org/10.3390/medicina59010066
Nigro M, Valli G, Marchionne ML, Sattarinia D, Silvestrini F, De Pietro D, Fazzini S, Roselli G, Spallino A, Praticò V, et al. Is There a Risk of Misinterpretation of Potassium Concentration from Undetectable Hemolysis Using a POCT Blood Gas Analyzer in the Emergency Department? Medicina. 2023; 59(1):66. https://doi.org/10.3390/medicina59010066
Chicago/Turabian StyleNigro, Marianna, Gabriele Valli, Maria Luisa Marchionne, Dario Sattarinia, Fabiana Silvestrini, Daniele De Pietro, Simone Fazzini, Giorgia Roselli, Andrea Spallino, Valentina Praticò, and et al. 2023. "Is There a Risk of Misinterpretation of Potassium Concentration from Undetectable Hemolysis Using a POCT Blood Gas Analyzer in the Emergency Department?" Medicina 59, no. 1: 66. https://doi.org/10.3390/medicina59010066