
Morphologic Evaluation of Dentoalveolar Structures after Corticotomy-Assisted Orthodontic Treatment in Romanian Adult Patients


Abstract
:1. Introduction
2. Materials and Methods
2.1. Study Design
2.2. Inclusion Criteria
- Moderate to severe dental crowding;
- Class 1 skeletal pattern;
- Normal growth pattern;
- Angle’s Class I or Class II molar relationship;
- No extractions or congenitally missing teeth;
- No periodontal problems (gingival recession or root/bone resorption);
- Approximately the same duration of treatment time.
2.3. Exclusion Criteria
- Severe craniofacial abnormalities;
- Patients under anti-inflammatory medication;
- Systemic diseases (genetic, metabolic and endocrine diseases, inflammatory diseases).
2.4. Orthodontic Treatment
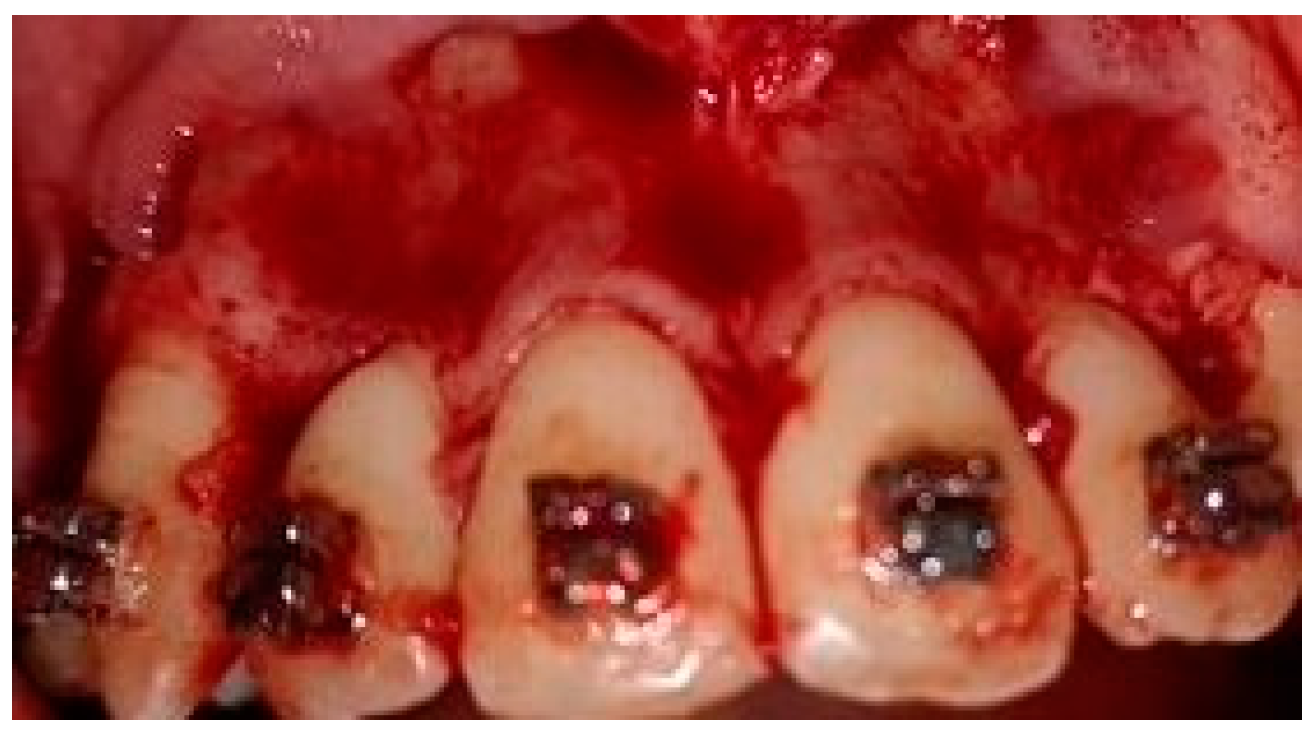
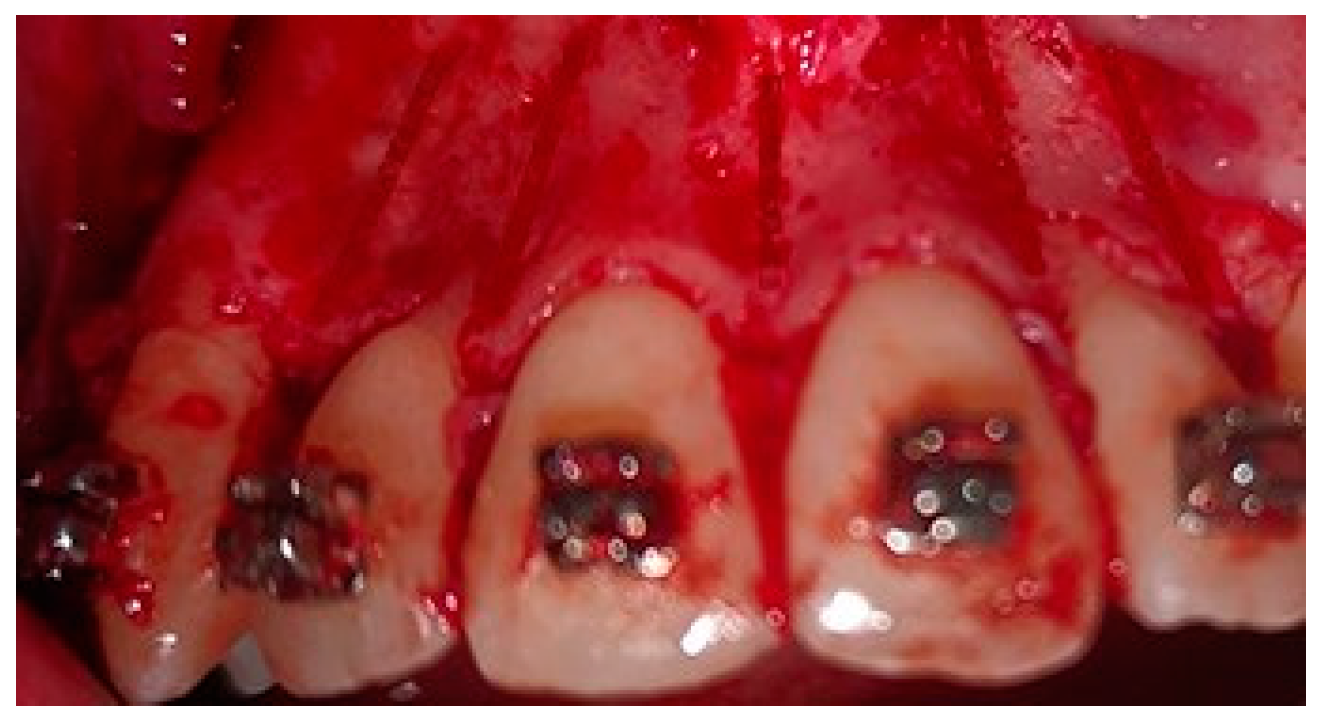
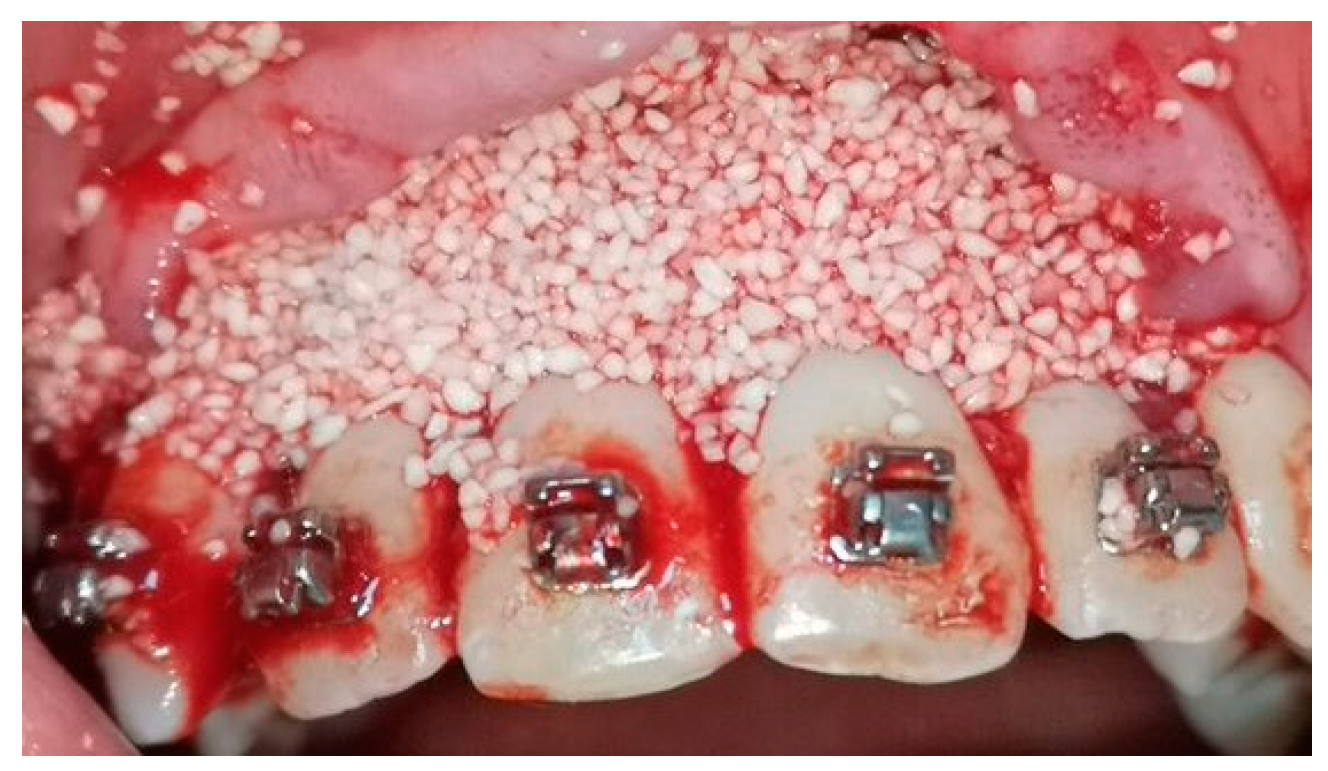
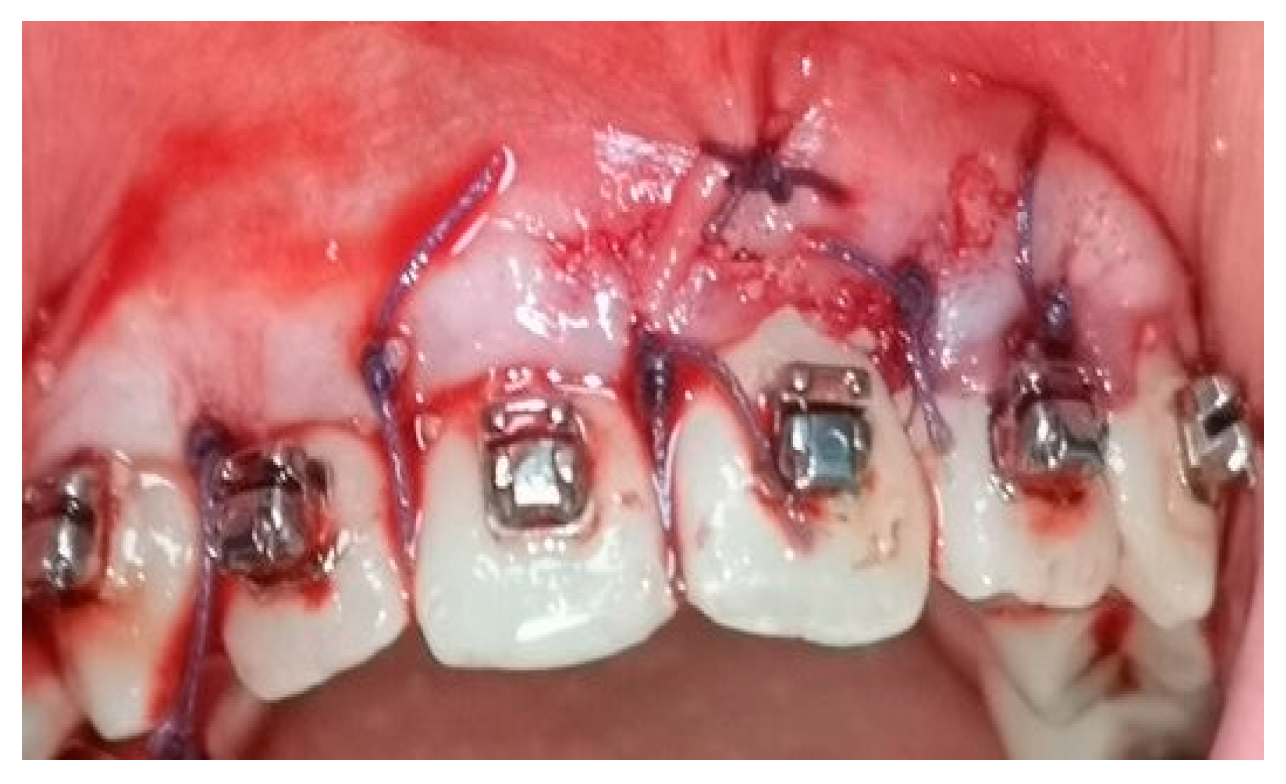
2.5. Surgical Phase
2.6. Collection of the Radiological Data
2.7. Statistical Analysis
3. Results
4. Discussion
5. Conclusions
- It has been observed that when combined with conventional orthodontic treatment, corticotomy can lead to an increase in the bone thickness supporting the tooth; changes observed in the buccal cortical plate support this observation.
- Although changes were observed in all three levels at which the measurements were made, the area where the corticotomy has the most significant effect is the cervical.
- In the maxillary arch, the most significant changes were registered at the level of the canines and first premolars, and in the lower arch at the incisors level.
- The bone support reacted differently to the stimuli that appeared after corticotomy, depending on gender, in correlation with age and local metabolism. Therefore, changes in the cortex were greater in male subjects when the average age of female subjects was high, knowing that bone metabolism in women decreases with age and under the influence of hormones.
- Root resorption, a side effect associated with conventional orthodontic therapy, was found to be much diminished, with statistically insignificant differential values.
Author Contributions
Funding
Institutional Review Board Statement
Informed Consent Statement
Data Availability Statement
Conflicts of Interest
References
- Patterson, B.M.; Dalci, O.; Darendeliler, M.A.; Papadopoulou, A.K. Corticotomies and orthodontic tooth movement: A systematic review. J. Oral Maxillofac. Surg. 2016, 74, 453–473. [Google Scholar] [CrossRef] [PubMed]
- Bos, A.; Hoogstraten, J.; Prahl-Andersen, B. Expectations of treatment and satisfaction with dentofacial appearance in orthodontic patients. Am. J. Orthod. Dentofac. Orthop. 2003, 123, 127–132. [Google Scholar] [CrossRef] [PubMed]
- Cantekin, K.; Celikoglu, M.; Karadas, M.; Yildirim, H.; Erdem, A. Effects of orthodontic treatment with fixed appliances on oral health status: A comprehensive study. J. Dent. Sci. 2011, 6, 235–238. [Google Scholar] [CrossRef] [Green Version]
- Kale, S.; Kocadereli, I.; Atila, P.; Asan, E. Comparison of the effects of 1,25—Dehydroxycholecalciferol and prostaglandin E2 on orthodontic tooth movement. Am. J. Orthod. 2014, 125, 607–614. [Google Scholar] [CrossRef]
- Tyrovola, J.B.; Spyropoulos, M.N. Effects of drugs and systemic factors on orthodontic treatment. Quintessence Int. 2001, 32, 365–371. [Google Scholar]
- Dab, S.; Chen, K.; Flores-Mir, C. Short- and long-term potential effects of accelerated osteogenic orthodontic treatment: A systematic review and meta-analysis. Orthod. Craniofac. Res. 2019, 22, 61–68. [Google Scholar] [CrossRef]
- Chandran, M.; Muddaiah, S.; Nair, S. Clinical and molecular-level comparison between conventional and corticotomy-assisted canine retraction techniques. J. World Fed. Orthod. 2018, 7, 128–133. [Google Scholar] [CrossRef]
- Agrawal, A.A.; Kolte, A.P.; Kolte, R.A.; Vaswani, V.; Shenoy, U.; Rathi, P. Comparative CBCT analysis of the changes in buccal bone morphology after corticotomy and micro-osteoperforations assisted orthodontic treatment—Case series with a split mouth design. Saudi Dent. J. 2019, 31, 58–65. [Google Scholar] [CrossRef]
- Wilcko, W.; Wilcko, M.T. Accelerating tooth movement: The case for corticotomy-induced orthodontics. Am. J. Orthod. Dentofac. Orthop. 2013, 144, 4–12. [Google Scholar] [CrossRef]
- Gil, A.P.S.; Haas Jr, O.L.; Méndez-Manjón, I.; Masiá-Gridilla, J.; Valls-Ontañón, A.; Hernández-Alfaro, F.; Guijarro-Martínez, R. Alveolar corticotomies for accelerated orthodontics: A systematic review. J. Craniomaxillofac. Surg. 2018, 46, 438–445. [Google Scholar] [CrossRef]
- Ferreira, C.L.; Rocha, V.C.; Ursi, W.J.; Marco, A.C.; Santamaria, M., Jr.; Santamaria, M.P.; Jardini, M.A.N. Periodontal response to orthodontic tooth movement in diabetes- induced rats with or without periodontal disease. J. Periodontol. 2018, 89, 341–350. [Google Scholar] [CrossRef] [PubMed]
- DE Stefani, A.; Bruno, G.; Irlandese, G.; Gracco, A. Is the corticotomy assisted orthodontic treatment efficient in the expansion of narrow arches in adult patients? Minerva Dent. Oral Sci. 2021, 70, 44–48. [Google Scholar] [CrossRef] [PubMed]
- Hassan, A.H.; Al-Saeed, S.H.; Al-Maghlouth, B.A.; Bahammam, M.A.; Linjawi, A.I.; El-Bialy, T.H. Corticotomy-assisted orthodontic treatment. A systematic review of the biological basis and clinical effectiveness. Saudi Med. J. 2015, 36, 794–801. [Google Scholar] [CrossRef] [PubMed]
- Le, M.H.T.; Lau, S.F.; Ibrahim, N.; Noor Hayaty, A.K.; Radzi, Z.B. Adjunctive buccal and palatal corticotomy for adult maxillary expansion in an animal model. Korean J. Orthod. 2018, 48, 98–106. [Google Scholar] [CrossRef] [Green Version]
- Zuppardo, M.L.; Ferreira, C.L.; de Moura, N.B.; Longo, M.; Santamaria, M., Jr.; Lopes, S.L.P.C.; Santamaria, M.P.; Jardini, M.A.N. Macroscopic and radiographic aspects of orthodontic movement associated with corticotomy: Animal study. Oral Maxillofac. Surg. 2019, 23, 77–82. [Google Scholar] [CrossRef]
- Chackartchi, T.; Barkana, I.; Klinger, A. Alveolar bone morphology following periodontally accelerated osteogenic orthodontics: A clinical and radiographic analysis. Int. J. Periodont. Rest. Dent. 2017, 37, 203–208. [Google Scholar] [CrossRef] [Green Version]
- Al-Naoum, F.; Hajeer, M.Y.; Al-Jundi, A. Does alveolar corticotomy accelerate orthodontic tooth movement when retracting upper canines? A split-mouth design randomized controlled trial. J. Oral Maxillofac. Surg. 2018, 72, 1880–1889. [Google Scholar] [CrossRef]
- Bell, W.H.; Levy, B.M. Revascularization and bone healing after maxillary corticotomies. J. Oral Surg. 1972, 30, 640–648. [Google Scholar]
- Abbas, N.H.; Sabet, N.E.; Hassan, I.T. Evaluation of corticotomy-facilitated orthodontics and piezocision in rapid canine retraction. Am. J. Orthod. Dentofac. Orthop. 2016, 149, 473–480. [Google Scholar] [CrossRef]
- Ohiomoba, H.; Sonis, A.; Yansane, A.; Friedland, B. Quantitative evaluation of maxillary alveolar cortical bone thickness and density using computed tomography imaging. Am. J. Orthod. Dentofac. Orthop. 2017, 151, 82–91. [Google Scholar] [CrossRef]
- Baumgaertel, S. Quantitative investigation of palatal bone depth and cortical bone thickness for mini-implant placement in adults. Am. J. Orthod. Dentofac. Orthop. 2009, 136, 104–108. [Google Scholar] [CrossRef] [PubMed]
- Avdagić, S.; Barić, I.; Keser, I.; Cecić, I.; Šatalić, Z.; Bobić, J.; Gomzi, M. Differences in peak bone density between male and female students. Arch. Ind. Hyg. Toxicol. 2009, 60, 79–86. [Google Scholar] [CrossRef] [PubMed] [Green Version]
- Kanjevac, T.; Bijelic, B.; Brajkovic, D.; Vasovic, M.; Stolic, R. Impact of chronic kidney disease mineral and bone disorder on jaw and alveolar bone metabolism: A narrative review. Oral Health Prev. Dent. 2018, 16, 79–85. [Google Scholar] [PubMed]
- Weber, P. Vitamin K and bone health. Nutrition 2001, 17, 880–887. [Google Scholar] [CrossRef]
- Jin, S.H.; Park, J.B.; Kim, N.; Park, S.; Kim, K.J.; Kim, Y. The thickness of alveolar bone at the maxillary canine and premolar teeth in normal occlusion. J. Periodontal Implant. Sci. 2012, 42, 173–178. [Google Scholar] [CrossRef] [PubMed]
- Bhattacharjee, P.; Kundu, B.; Naskar, D.; Kim, H.W.; Maiti, T.K.; Bhattacharya, D.; Kundu, S.C. Silk scaffolds in bone tissue engineering: An overview. Acta Biomater. 2017, 63, 1–17. [Google Scholar] [CrossRef]
- Harris, D.A.; Jones, A.S.; Darendeliler, M.A. Physical properties of root cementum: Part 8. Volumetric analysis of root resorption craters after application of controlled intrusive light and heavy orthodontic forces: A microcomputed tomography scan study. Am. J. Orthod. Dentofac. Orthop. 2006, 130, 639–647. [Google Scholar]
- Bartley, N.; Türk, T.; Colak, C.; Elekdaq-Türk, S.; Jones, A.; Petocz, P. Physical properties of root cementum: Part 17. Root resorption after the application of 2.50 and 150 of buccal root torque for 4 weeks: A micro computed tomography study. Am. J. Orthod. Dentofac. Orthop. 2011, 139, 353–360. [Google Scholar] [CrossRef]
- Makedonas, D.; Lund, H.; Hansen, K. Root resorption diagnosed with cone beam computed tomography after 6 months and at the end of orthodontic treatment with fixed appliances. Angle Orthod. 2013, 83, 389–393. [Google Scholar] [CrossRef]
- Roscoe, M.G.; Meira, J.B.; Cattaneo, P.M. Association of orthodontic force system and root resorption: A systematic review. Am. J. Orthod. Dentofac. Orthop. 2015, 147, 610–626. [Google Scholar] [CrossRef]
- Kook, Y.A.; Lee, W.; Kim, S.H.; Chung, K.R. Corticotomy-assisted space closure in adult patients with missing lower molars. J. Clin. Orthod. 2013, 47, 85–95. [Google Scholar] [PubMed]
- Maués, C.P.; do Nascimento, R.R.; Vilella Ode, V. Severe root resorption resulting from orthodontic treatment: Prevalence and risk factors. Dent. Press J. Orthod. 2015, 20, 52–58. [Google Scholar] [CrossRef] [PubMed]
- Picanço, G.V.; de Freitas, K.M.; Cançado, R.H.; Valarelli, F.P.; Picanço, P.R.; Feijão, C.P. Predisposing factors to severe external root resorption associated with orthodontic treatment. Dent. Press J. Orthod. 2013, 18, 110–120. [Google Scholar] [CrossRef] [PubMed] [Green Version]
- Castro, I.O.; Alencar, A.H.; Valladaresneto, J.; Estrela, C. Apical root resorption due to orthodontic treatment detected by cone beam computed tomography. Angle Orthod. 2013, 83, 196–203. [Google Scholar] [CrossRef] [Green Version]
- Alikhani, M.; Lopez, J.A.; Alabdullah, H.; Vongthongleu, T.; Sangsuwon, C. High-frequency acceleration: Therapeutic tool to preserve bone following tooth extractions. J. Dent. Res. 2016, 95, 311–318. [Google Scholar] [CrossRef]
- Durack, C.; Patel, S.; Davies, J.; Wilson, R.; Mannocci, F. Diagnostic accuracy of small volume cone beam computed tomography and intraoral periapical radiography for the detection of simulated external inflammatory root resorption. Int. Endod. J. 2011, 44, 136–147. [Google Scholar] [CrossRef]
- Rahmel, S.; Schulze, R.K.W. Accuracy in detecting artificial root resorption in panoramic radiography versus tomosynthetic panoramic radiographs. J. Endod. 2019, 45, 634–639. [Google Scholar] [CrossRef]
- Wang, Y.; He, S.; Guo, Y.; Wang, S.; Chen, S. Accuracy of volumetric measurement of simulated root resorption lacunas based on cone beam computed tomography. Orthod. Craniofac. Res. 2013, 16, 169–176. [Google Scholar] [CrossRef]
- Yamasaki, K. The role of cyclic AMP, calcium, and prostaglandins in the induction of osteoclastic bone resorption associated with experimental tooth movement. J. Dent. Res. 1983, 62, 877–881. [Google Scholar] [CrossRef]
- Darendeliler, M.A.; Zea, A.; Shen, G.; Zoellner, H. Effects of pulsed electromagnetic field vibration on tooth movement induced by magnetic and mechanical forces: A preliminary study. Aust. Dent. J. 2007, 52, 282–287. [Google Scholar] [CrossRef]
- Showkatbakhsh, R.; Jamilian, A.; Showkatbakhsh, M. The effect of pulsed electromagnetic fields on the acceleration of tooth movement. World J. Orthod. 2010, 11, 52–56. [Google Scholar]
- Morshed, R.A.; Reihl, S.J.; Molinaro, A.M.; Kakaizada, S.; Young, J.S.; Schulte, J.D.; Butowski, N.; Taylor, J.; Bush, N.A.; Aghi, M.K.; et al. The influence of race and socioeconomic status on therapeutic clinical trial screening and enrollment. J. Neurooncol. 2020, 148, 131–139. [Google Scholar] [CrossRef] [PubMed]


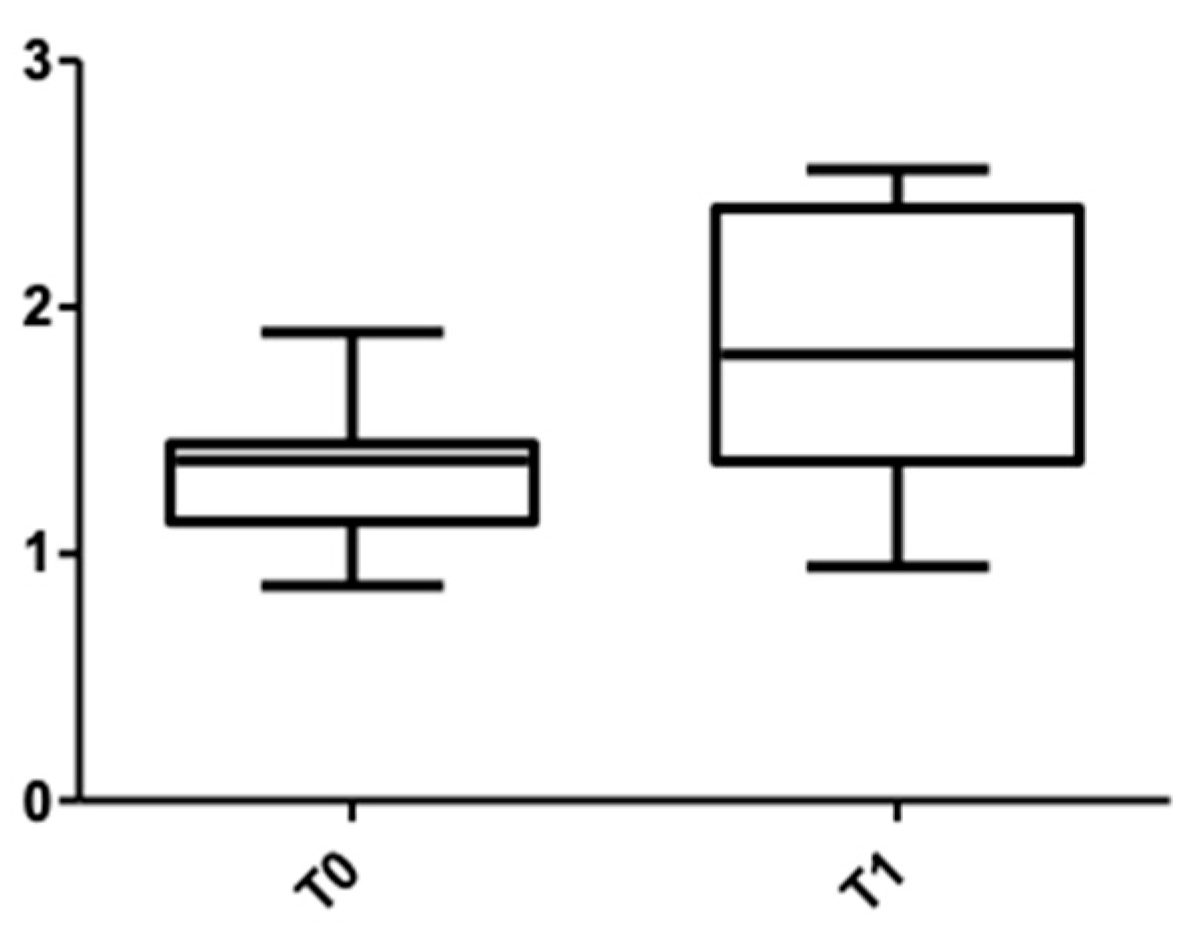
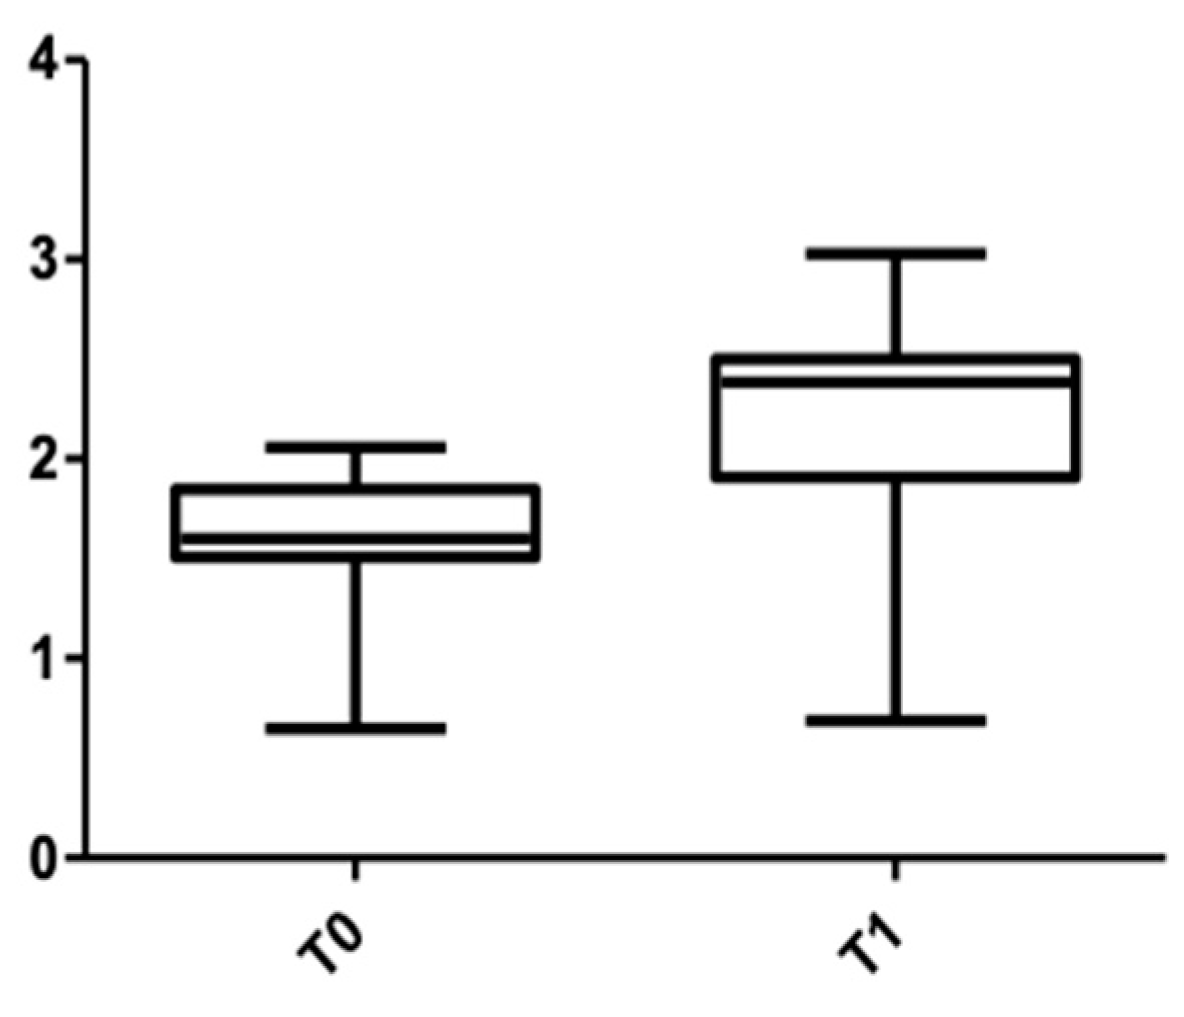
| Sex | CBCT Values Upper Arch | T0 Median ± SD (mm) | T1 Median ± SD (mm) | T1−T0 (mm) | p-Value |
|---|---|---|---|---|---|
| Females | Cervical | 1.363 ± 0.276 | 1.829 ± 0.539 | 0.466 | <0.0001 |
| Medial | 1.090 ± 0.120 | 1.468 ± 0.427 | 0.377 | <0.0001 | |
| Apical | 0.920 ± 0.171 | 1.281 ± 0.434 | 0.361 | <0.0001 | |
| Males | Cervical | 1.561 ± 0.365 | 2.201 ± 0.568 | 0.640 | <0.0001 |
| Medial | 1.095 ± 0.261 | 1.626 ± 0.405 | 0.531 | <0.0001 | |
| Apical | 1.000 ± 0.207 | 1.304 ± 0.342 | 0.304 | <0.0001 |
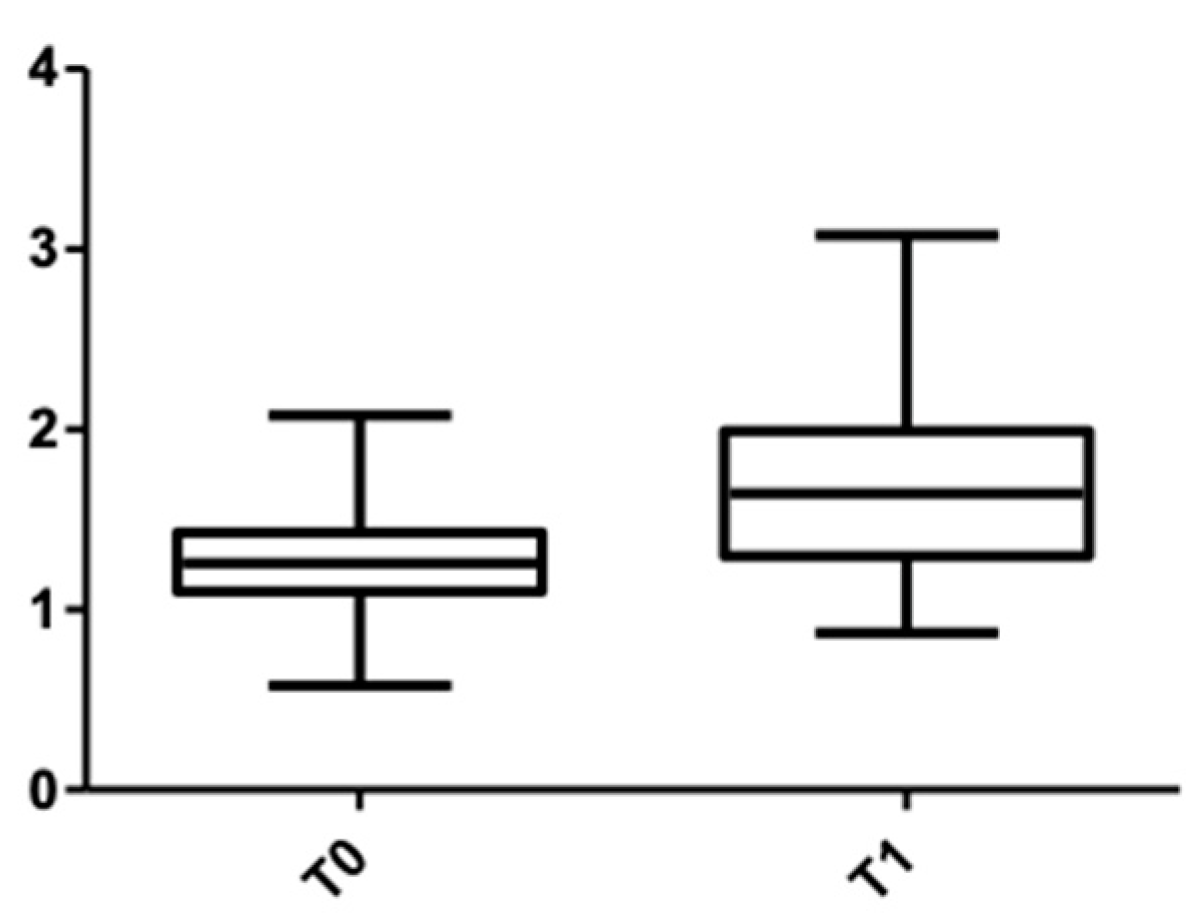
| Sex | CBCT Values Lower Arch | T0 Median ± SD (mm) | T1 Median ± SD (mm) | T1−T0 (mm) | p-Value |
|---|---|---|---|---|---|
| Females | Cervical | 1.097 ± 0.276 | 1.684 ± 0.420 | 0.586 | <0.0001 |
| Medial | 0.747 ± 0.197 | 1.073 ± 0.500 | 0.325 | <0.0001 | |
| Apical | 1.125 ± 0.307 | 1.561 ± 0.437 | 0.436 | <0.0001 | |
| Males | Cervical | 1.260 ± 0.273 | 1.640 ± 0.422 | 0.379 | <0.0001 |
| Medial | 0.818 ± 0.158 | 1.120 ± 0.315 | 0.301 | <0.0001 | |
| Apical | 1.321 ± 0.297 | 1.692 ± 0.392 | 0.370 | <0.0001 |
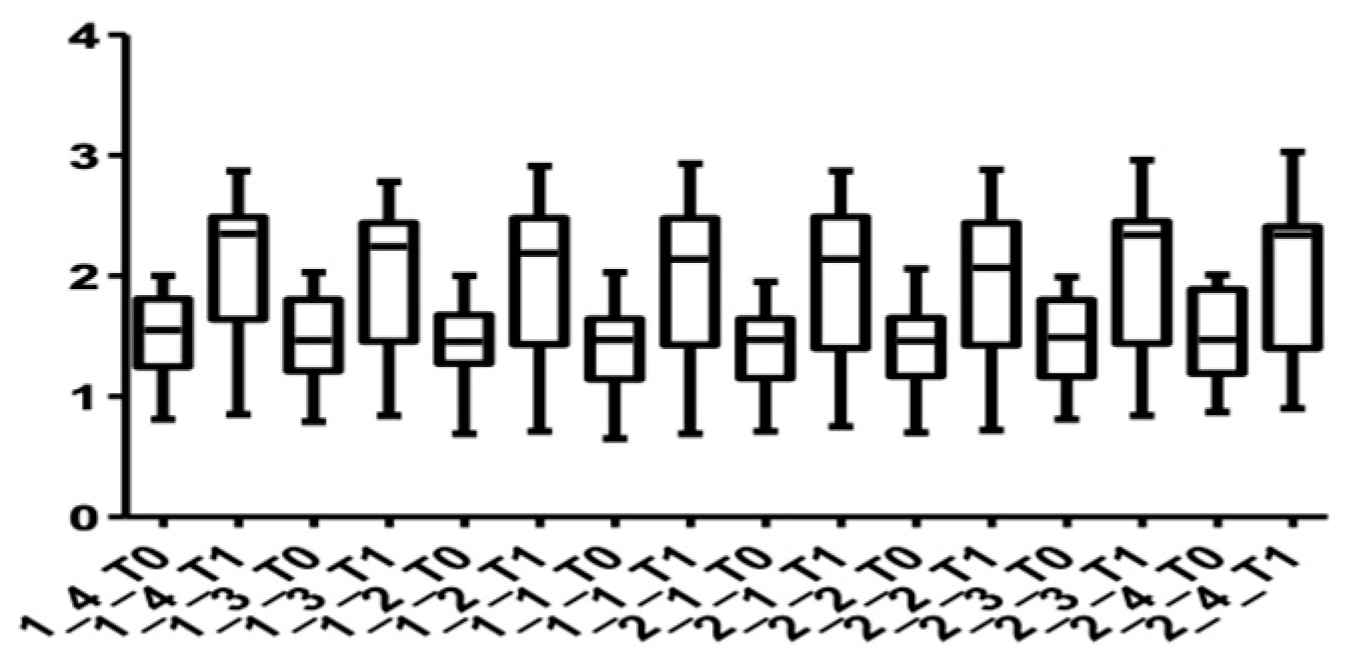
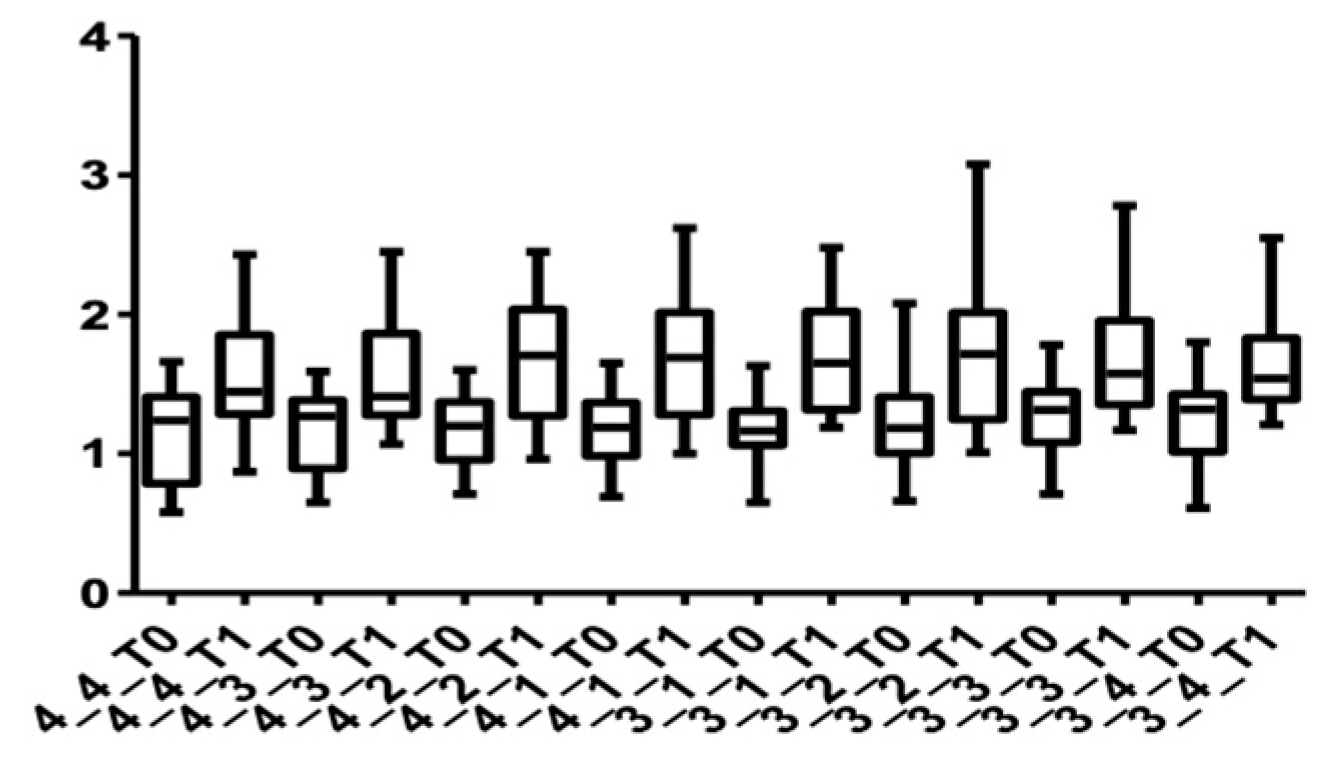
| Tooth | CBCT Values Upper Arch | T0 Median ± SD (mm) | T1 Median ± SD (mm) | T1−T0 (mm) | p-Value |
|---|---|---|---|---|---|
| 14 | Cervical | 1.524 ± 0.337 | 2.101 ± 0.568 | 0.577 | <0.0001 |
| Medial | 1.151 ± 0.186 | 1.627 ± 0.448 | 0.475 | <0.0001 | |
| Apical | 1.011 ± 0.170 | 1.349 ± 0.396 | 0.338 | 0.0004 | |
| 13 | Cervical | 1.491 ± 0.342 | 2.072 ± 0.567 | 0.581 | 0.0001 |
| Medial | 1.116 ± 0.179 | 1.586 ± 0.423 | 0.469 | 0.0001 | |
| Apical | 1.007 ± 0.166 | 1.377 ± 0.403 | 0.370 | 0.0002 | |
| 12 | Cervical | 1.448 ± 0.336 | 1.993 ± 0.589 | 0.545 | <0.0001 |
| Medial | 1.096 ± 0.195 | 1.517 ± 0.393 | 0.420 | <0.0001 | |
| Apical | 0.969 ± 0.172 | 1.290 ± 0.363 | 0.320 | 0.0003 | |
| 11 | Cervical | 1.426 ± 0.345 | 1.971 ± 0.607 | 0.545 | <0.0001 |
| Medial | 1.074 ± 0.211 | 1.510 ± 0.397 | 0.436 | 0.0001 | |
| Apical | 0.933 ± 0.204 | 1.256 ± 0.402 | 0.322 | 0.0006 | |
| 21 | Cervical | 1.413 ± 0.316 | 1.977 ± 0.603 | 0.563 | <0.0001 |
| Medial | 1.077 ± 0.218 | 1.477 ± 0.394 | 0.400 | 0.0001 | |
| Apical | 0.929 ± 0.213 | 1.254 ± 0.385 | 0.325 | 0.0004 | |
| 22 | Cervical | 1.415 ± 0.341 | 1.951 ± 0.598 | 0.536 | <0.0001 |
| Medial | 1.060 ± 0.222 | 1.445 ± 0.382 | 0.384 | 0.0002 | |
| Apical | 0.931 ± 0.203 | 1.245 ± 0.366 | 0.313 | 0.0005 | |
| 23 | Cervical | 1.479 ± 0.364 | 2.064 ± 0.615 | 0.584 | 0.0002 |
| Medial | 1.074 ± 0.214 | 1.596 ± 0.456 | 0.521 | <0.0001 | |
| Apical | 0.947 ± 0.183 | 1.337 ± 0.423 | 0.389 | 0.0004 | |
| 24 | Cervical | 1.501 ± 0.360 | 2.075 ± 0.603 | 0.574 | <0.0001 |
| Medial | 1.093 ± 0.213 | 1.618 ± 0.507 | 0.525 | 0.0001 | |
| Apical | 0.954 ± 0.240 | 1.313 ± 0.424 | 0.359 | 0.0003 |
| Tooth | CBCT Values Lower Arch | T0 Median ± SD (mm) | T1 Median ± SD (mm) | T1−T0 (mm) | p-Value |
|---|---|---|---|---|---|
| 44 | Cervical | 1.154 ± 0.318 | 1.568 ± 0.405 | 0.414 | 0.0002 |
| Medial | 0.715 ± 0.187 | 1.085 ± 0.397 | 0.313 | 0.0016 | |
| Apical | 1.288 ± 0.309 | 1.644 ± 0.426 | 0.356 | 0.0002 | |
| 43 | Cervical | 1.190 ± 0.267 | 1.588 ± 0.405 | 0.398 | 0.0003 |
| Medial | 0.803 ± 0.198 | 1.118 ± 0.397 | 0.314 | 0.0007 | |
| Apical | 1.248 ± 0.308 | 1.617 ± 0.451 | 0.369 | 0.0003 | |
| 42 | Cervical | 1.171 ± 0.256 | 1.686 ± 0.438 | 0.515 | <0.0001 |
| Medial | 0.765 ± 0.165 | 1.077 ± 0.363 | 0.311 | 0.0007 | |
| Apical | 1.205 ± 0.307 | 1.622 ± 0.397 | 0.417 | 0.0001 | |
| 41 | Cervical | 1.176 ± 0.275 | 1.683 ± 0.452 | 0.507 | <0.0001 |
| Medial | 0.816 ± 0.169 | 1.118 ± 0.463 | 0.301 | 0.0005 | |
| Apical | 1.212 ± 0.294 | 1.640 ± 0.381 | 0.428 | <0.0001 | |
| 31 | Cervical | 1.165 ± 0.244 | 1.676 ± 0.394 | 0.515 | 0.0002 |
| Medial | 0.765 ± 0.188 | 1.094 ± 0.409 | 0.329 | 0.0005 | |
| Apical | 1.187 ± 0.321 | 1.619 ± 0.388 | 0.432 | 0.0001 | |
| 32 | Cervical | 1.210 ± 0.337 | 1.718 ± 0.528 | 0.507 | <0.0001 |
| Medial | 0.796 ± 0.206 | 1.117 ± 0.426 | 0.320 | 0.0007 | |
| Apical | 1.237 ± 0.332 | 1.654 ± 0.468 | 0.417 | <0.0001 | |
| 33 | Cervical | 1.280 ± 0.276 | 1.696 ± 0.427 | 0.416 | 0.0003 |
| Medial | 0.778 ± 0.157 | 1.088 ± 0.406 | 0.310 | 0.0005 | |
| Apical | 1.283 ± 0.309 | 1.648 ± 0.373 | 0.365 | 0.0002 | |
| 34 | Cervical | 1.215 ± 0.322 | 1.645 ± 0.340 | 0.430 | 0.0003 |
| Medial | 0.823 ± 0.164 | 1.113 ± 0.388 | 0.290 | 0.0013 | |
| Apical | 1.286 ± 0.376 | 1.674 ± 0.483 | 0.387 | 0.0003 |
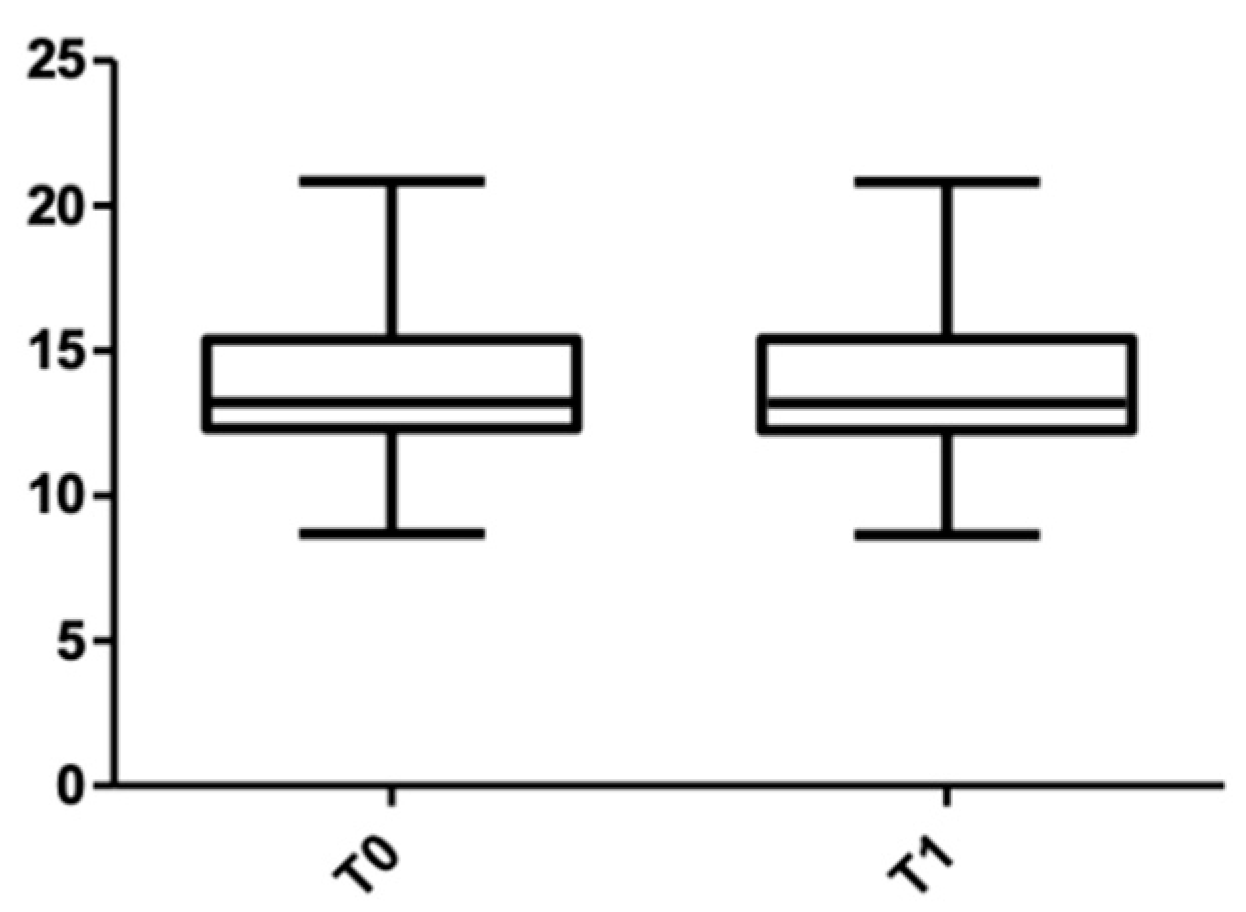
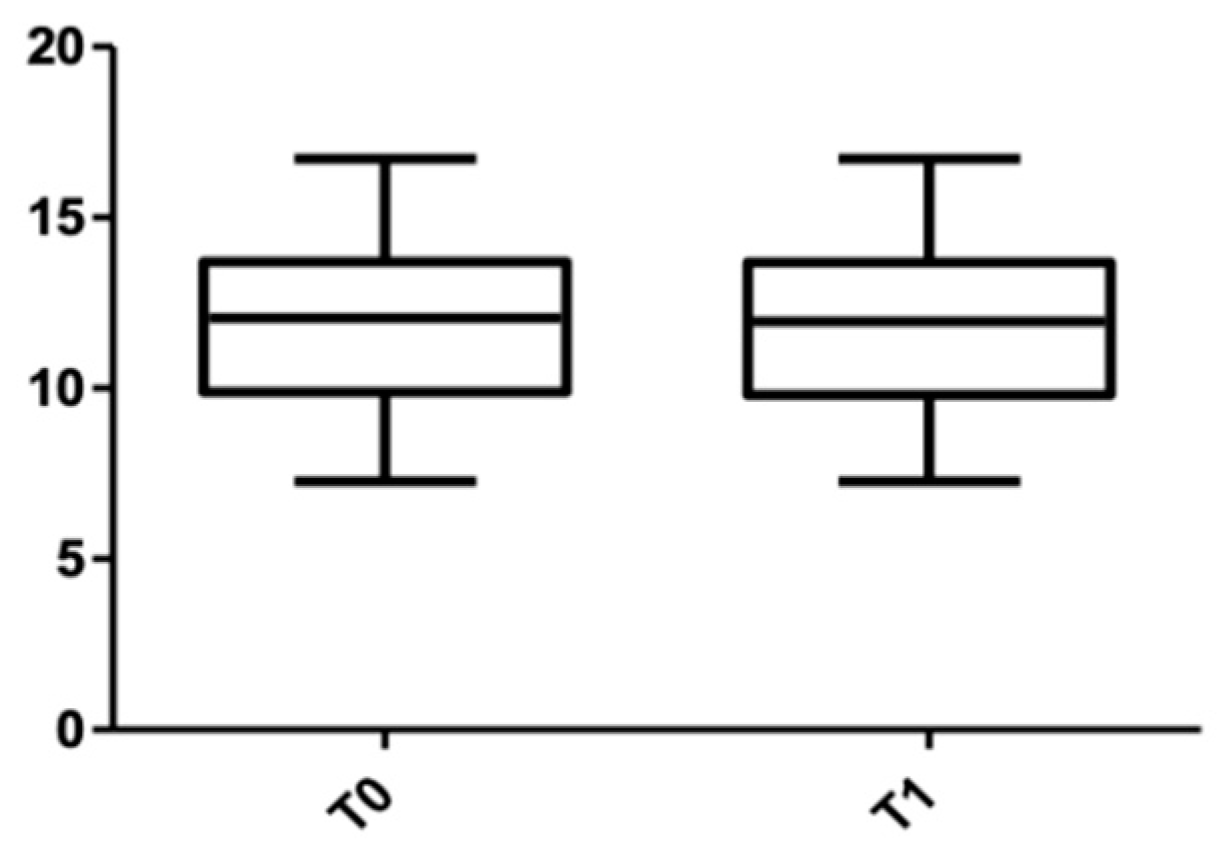
| Root Length | T0 Median ± SD (mm) | T1 Median ± SD (mm) | p-Value |
|---|---|---|---|
| Lower arch | 11.981 ± 2.242 | 11.972 ± 2.244 | 0.210 |
| Upper arch | 13.830 ± 2.283 | 13.811 ± 2.285 | 0.187 |
| Root Length | Sex | T0 Median ± SD (mm) | T1 Median ± SD (mm) | p-Value |
|---|---|---|---|---|
| Lower arch | Females | 12.401 ± 2.078 | 12.380 ± 2.098 | 0.216 |
| Males | 11.572 ± 2.296 | 11.562 ± 2.292 | 0.183 | |
| Upper arch | Females | 13.381 ± 2.434 | 13.365 ± 2.415 | 0.260 |
| Males | 14.283 ± 2.037 | 14.264 ± 2.064 | 0.118 |
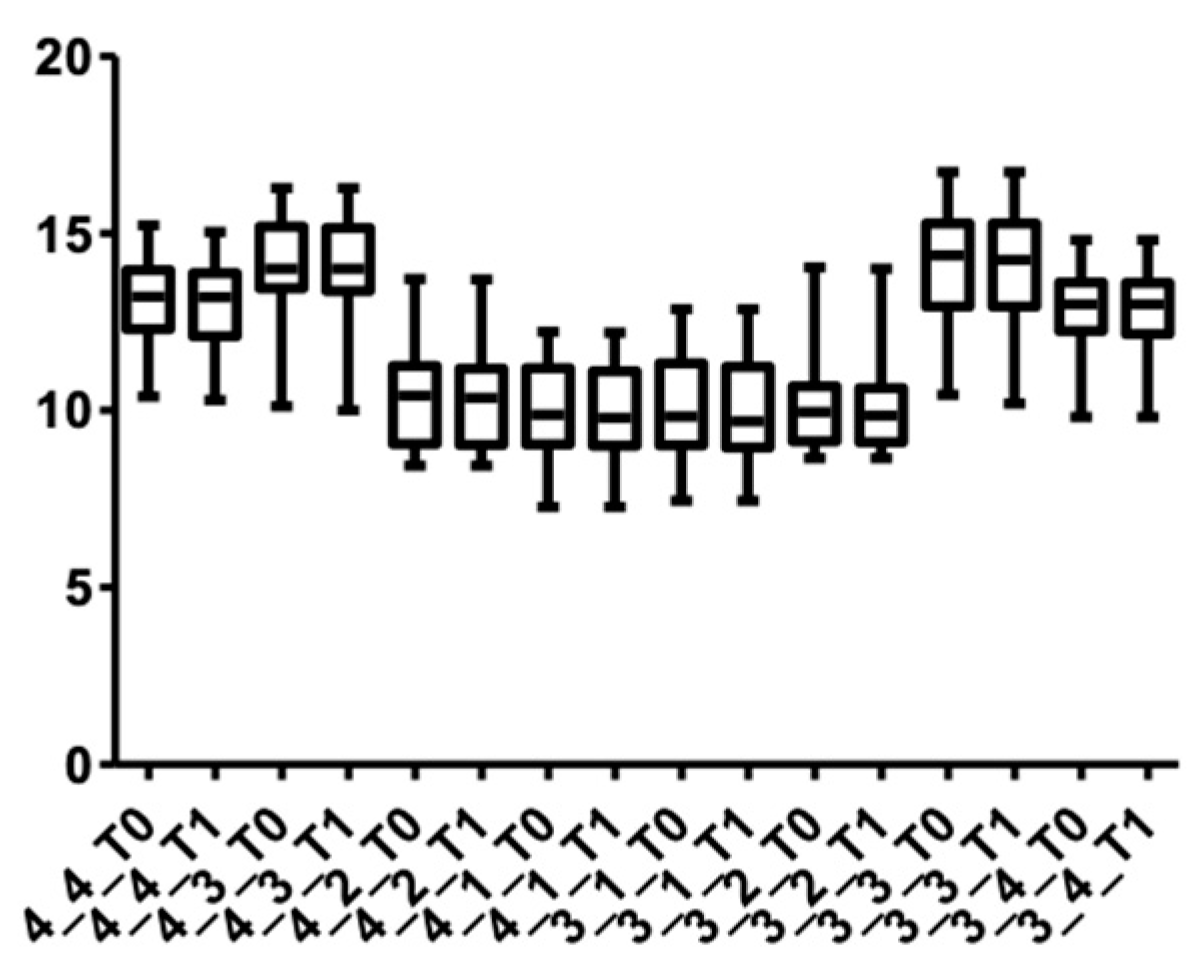
| Root Length | T0 Median ± SD (mm) | T1 Median ± SD (mm) | p-Value |
|---|---|---|---|
| 14 | 13.456 ± 0.816 | 13.432 ± 0.833 | 0.674 |
| 13 | 17.042 ± 1.422 | 17.020 ± 1.470 | 0.363 |
| 12 | 11.890 ± 1.324 | 11.864 ± 1.330 | 0.329 |
| 11 | 12.903 ± 1.531 | 12.906 ± 1.577 | 0.945 |
| 21 | 13.072 ± 1.524 | 13.043 ± 1.600 | 0.509 |
| 22 | 12.174 ± 1.189 | 12.174 ± 1.121 | 0.832 |
| 23 | 16.771 ± 1.762 | 16.722 ± 1.785 | 0.002 |
| 24 | 13.341 ± 1.096 | 13.271 ± 1.086 | 0.002 |
| Root Length | T0 Median ± SD (mm) | T1 Median ± SD (mm) | p-Value |
|---|---|---|---|
| 44 | 13.05 ± 1.298 | 13.00 ± 1.286 | 0.003 |
| 43 | 14.16 ± 1.481 | 14.10 ± 1.495 | 0.024 |
| 42 | 10.49 ± 1.595 | 10.48 ± 1.593 | 0.210 |
| 41 | 10.05 ± 1.320 | 10.04 ± 1.313 | 0.309 |
| 31 | 10.10 ± 1.489 | 10.10 ± 1.488 | 0.180 |
| 32 | 10.32 ± 1.550 | 10.32 ± 1.560 | 0.435 |
| 33 | 14.20 ± 1.664 | 14.15 ± 1.699 | 0.008 |
| 34 | 12.84 ± 1.216 | 12.79 ± 1.234 | 0.043 |
Publisher’s Note: MDPI stays neutral with regard to jurisdictional claims in published maps and institutional affiliations. |
© 2022 by the authors. Licensee MDPI, Basel, Switzerland. This article is an open access article distributed under the terms and conditions of the Creative Commons Attribution (CC BY) license (https://creativecommons.org/licenses/by/4.0/).
Share and Cite
Panainte, I.; Nenovici, D.-H.; Mariș, M.; Șerbănoiu, D.-C.; Vartolomei, C.; Păcurar, M. Morphologic Evaluation of Dentoalveolar Structures after Corticotomy-Assisted Orthodontic Treatment in Romanian Adult Patients. Medicina 2022, 58, 468. https://doi.org/10.3390/medicina58040468
Panainte I, Nenovici D-H, Mariș M, Șerbănoiu D-C, Vartolomei C, Păcurar M. Morphologic Evaluation of Dentoalveolar Structures after Corticotomy-Assisted Orthodontic Treatment in Romanian Adult Patients. Medicina. 2022; 58(4):468. https://doi.org/10.3390/medicina58040468
Chicago/Turabian StylePanainte, Irinel, Dorin-Horațiu Nenovici, Marius Mariș, Dan-Cosmin Șerbănoiu, Claudiu Vartolomei, and Mariana Păcurar. 2022. "Morphologic Evaluation of Dentoalveolar Structures after Corticotomy-Assisted Orthodontic Treatment in Romanian Adult Patients" Medicina 58, no. 4: 468. https://doi.org/10.3390/medicina58040468