
Model-Informed Target Morning 17α-Hydroxyprogesterone Concentrations in Dried Blood Spots for Pediatric Congenital Adrenal Hyperplasia Patients

 , , , ,
  and
and
Abstract
:1. Introduction
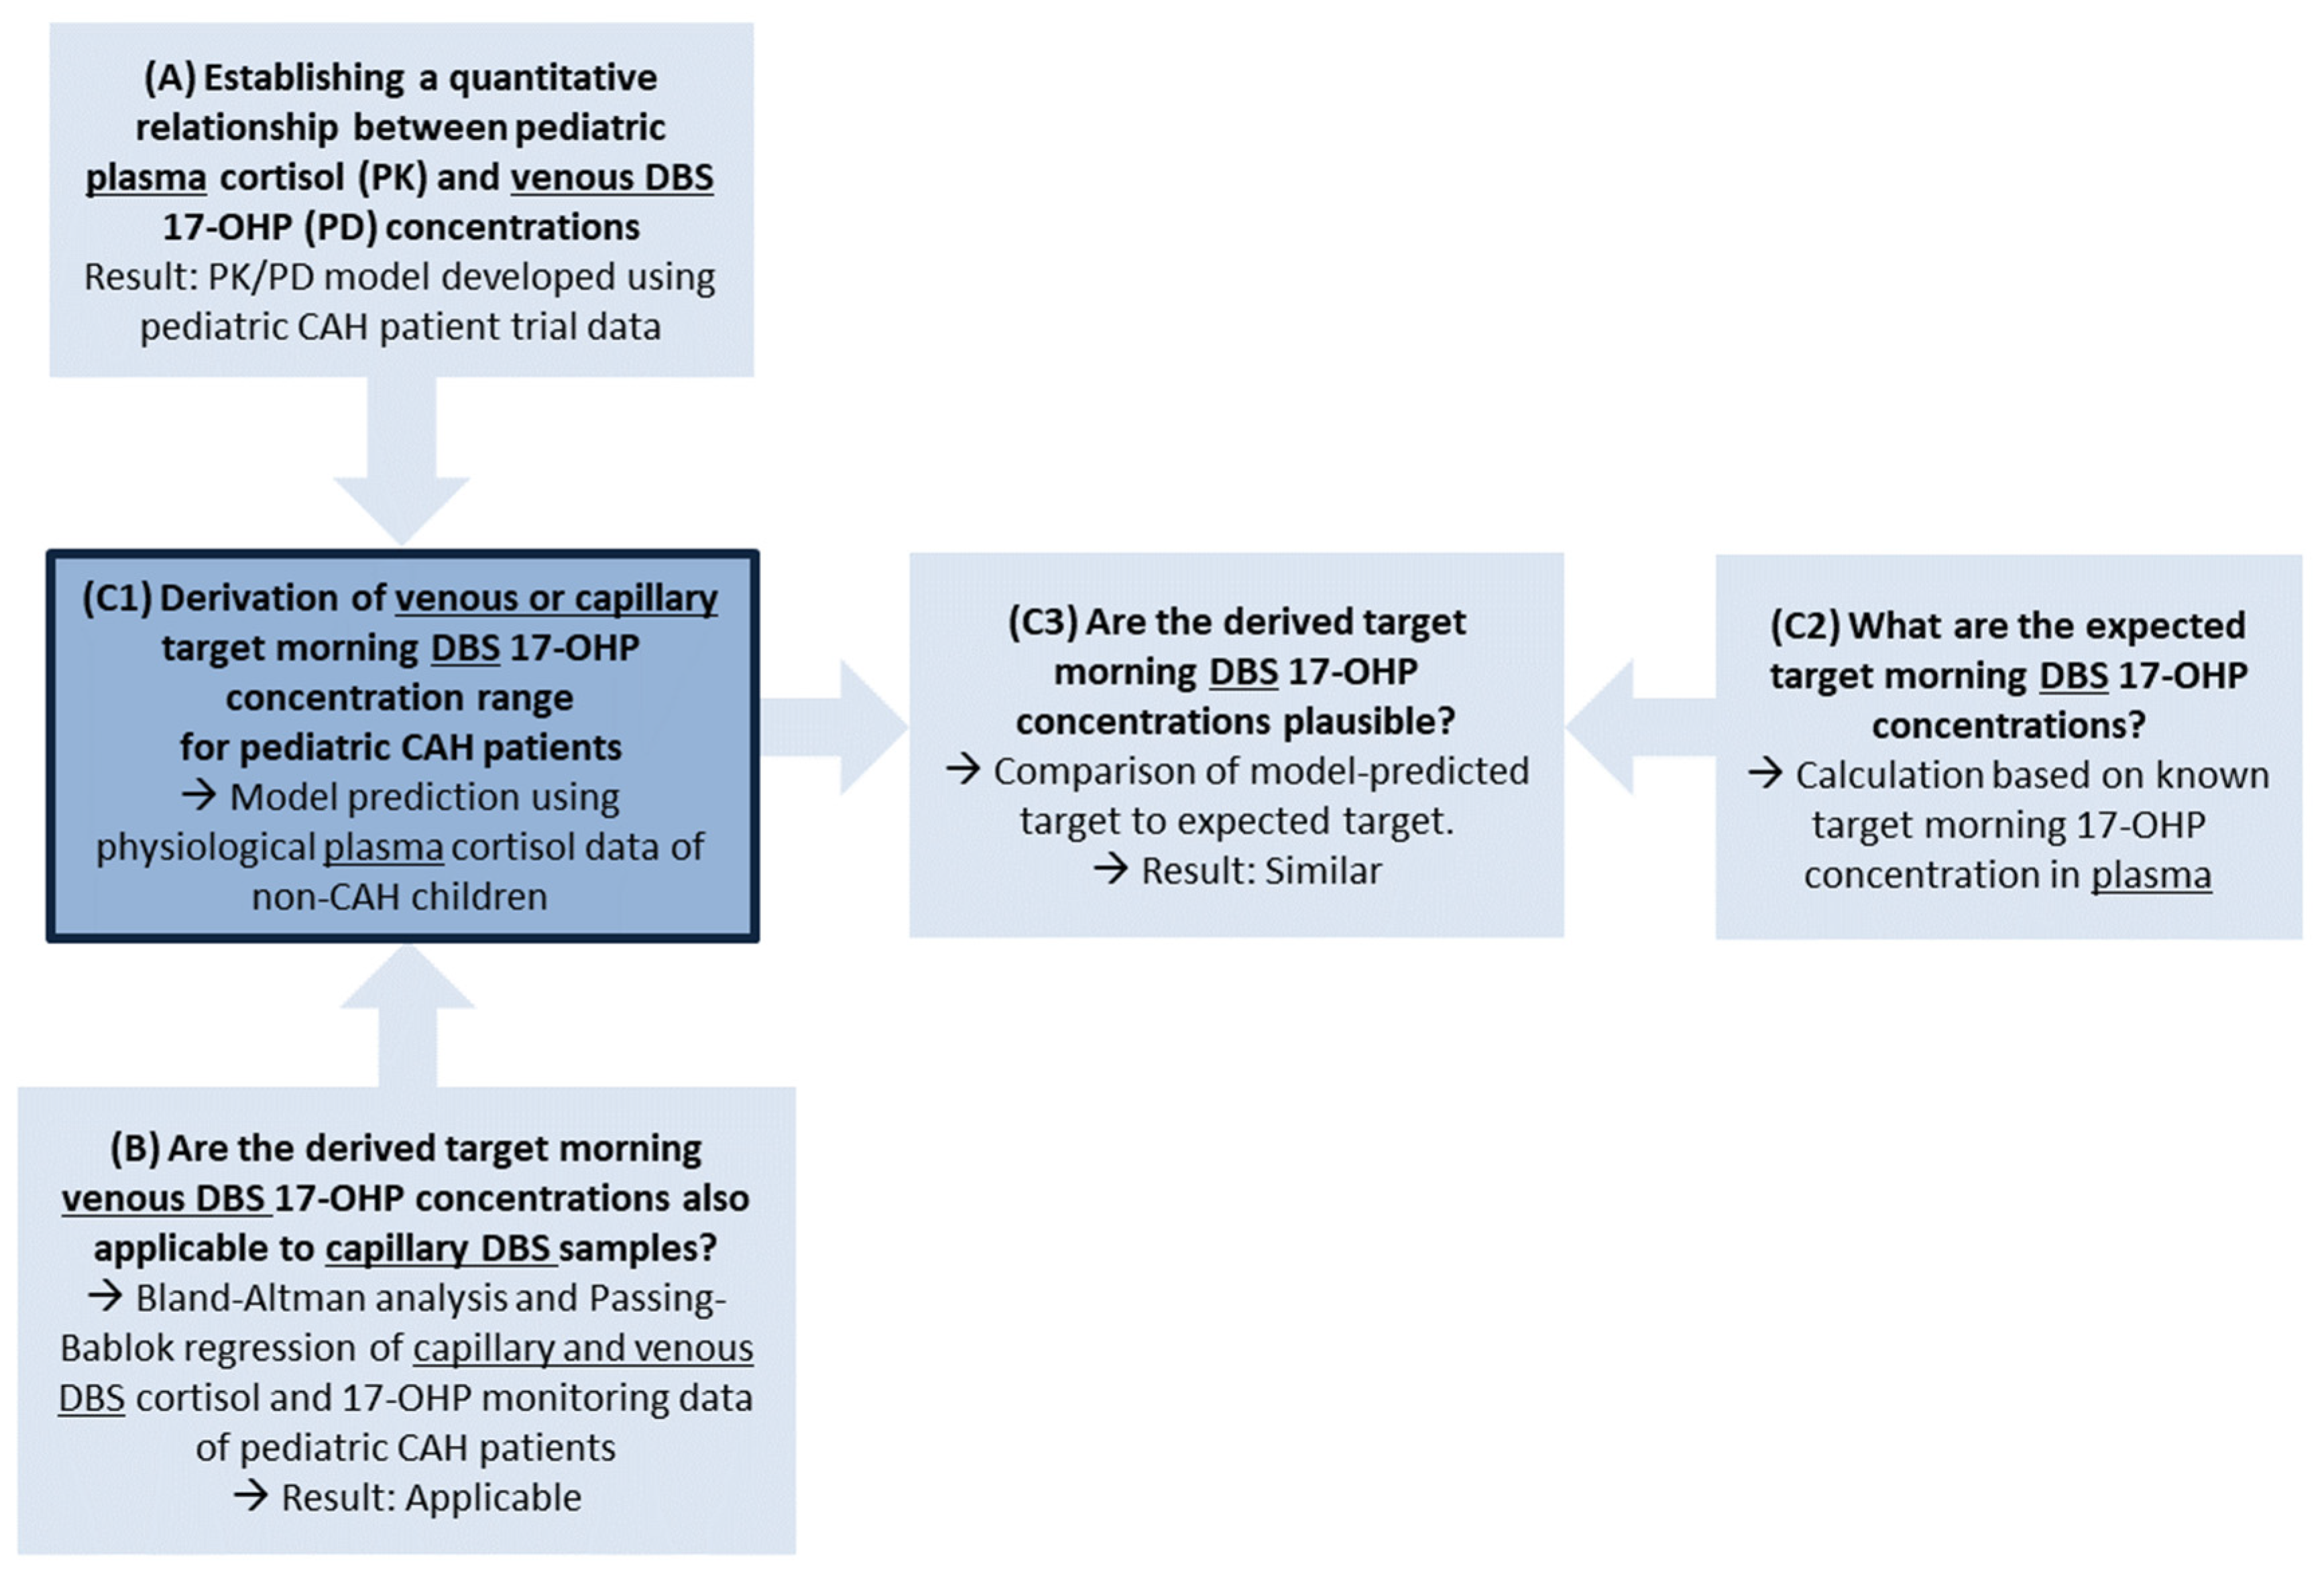
2. Methods
2.1. Step A: Establishing a Quantitative Relationship between Plasma Cortisol (PK) and Venous DBS 17-OHP (PD) Concentrations in Pediatric CAH Patients: PK/PD Clinical Trial Data and Model Development
2.1.1. Data and Graphical Evaluation
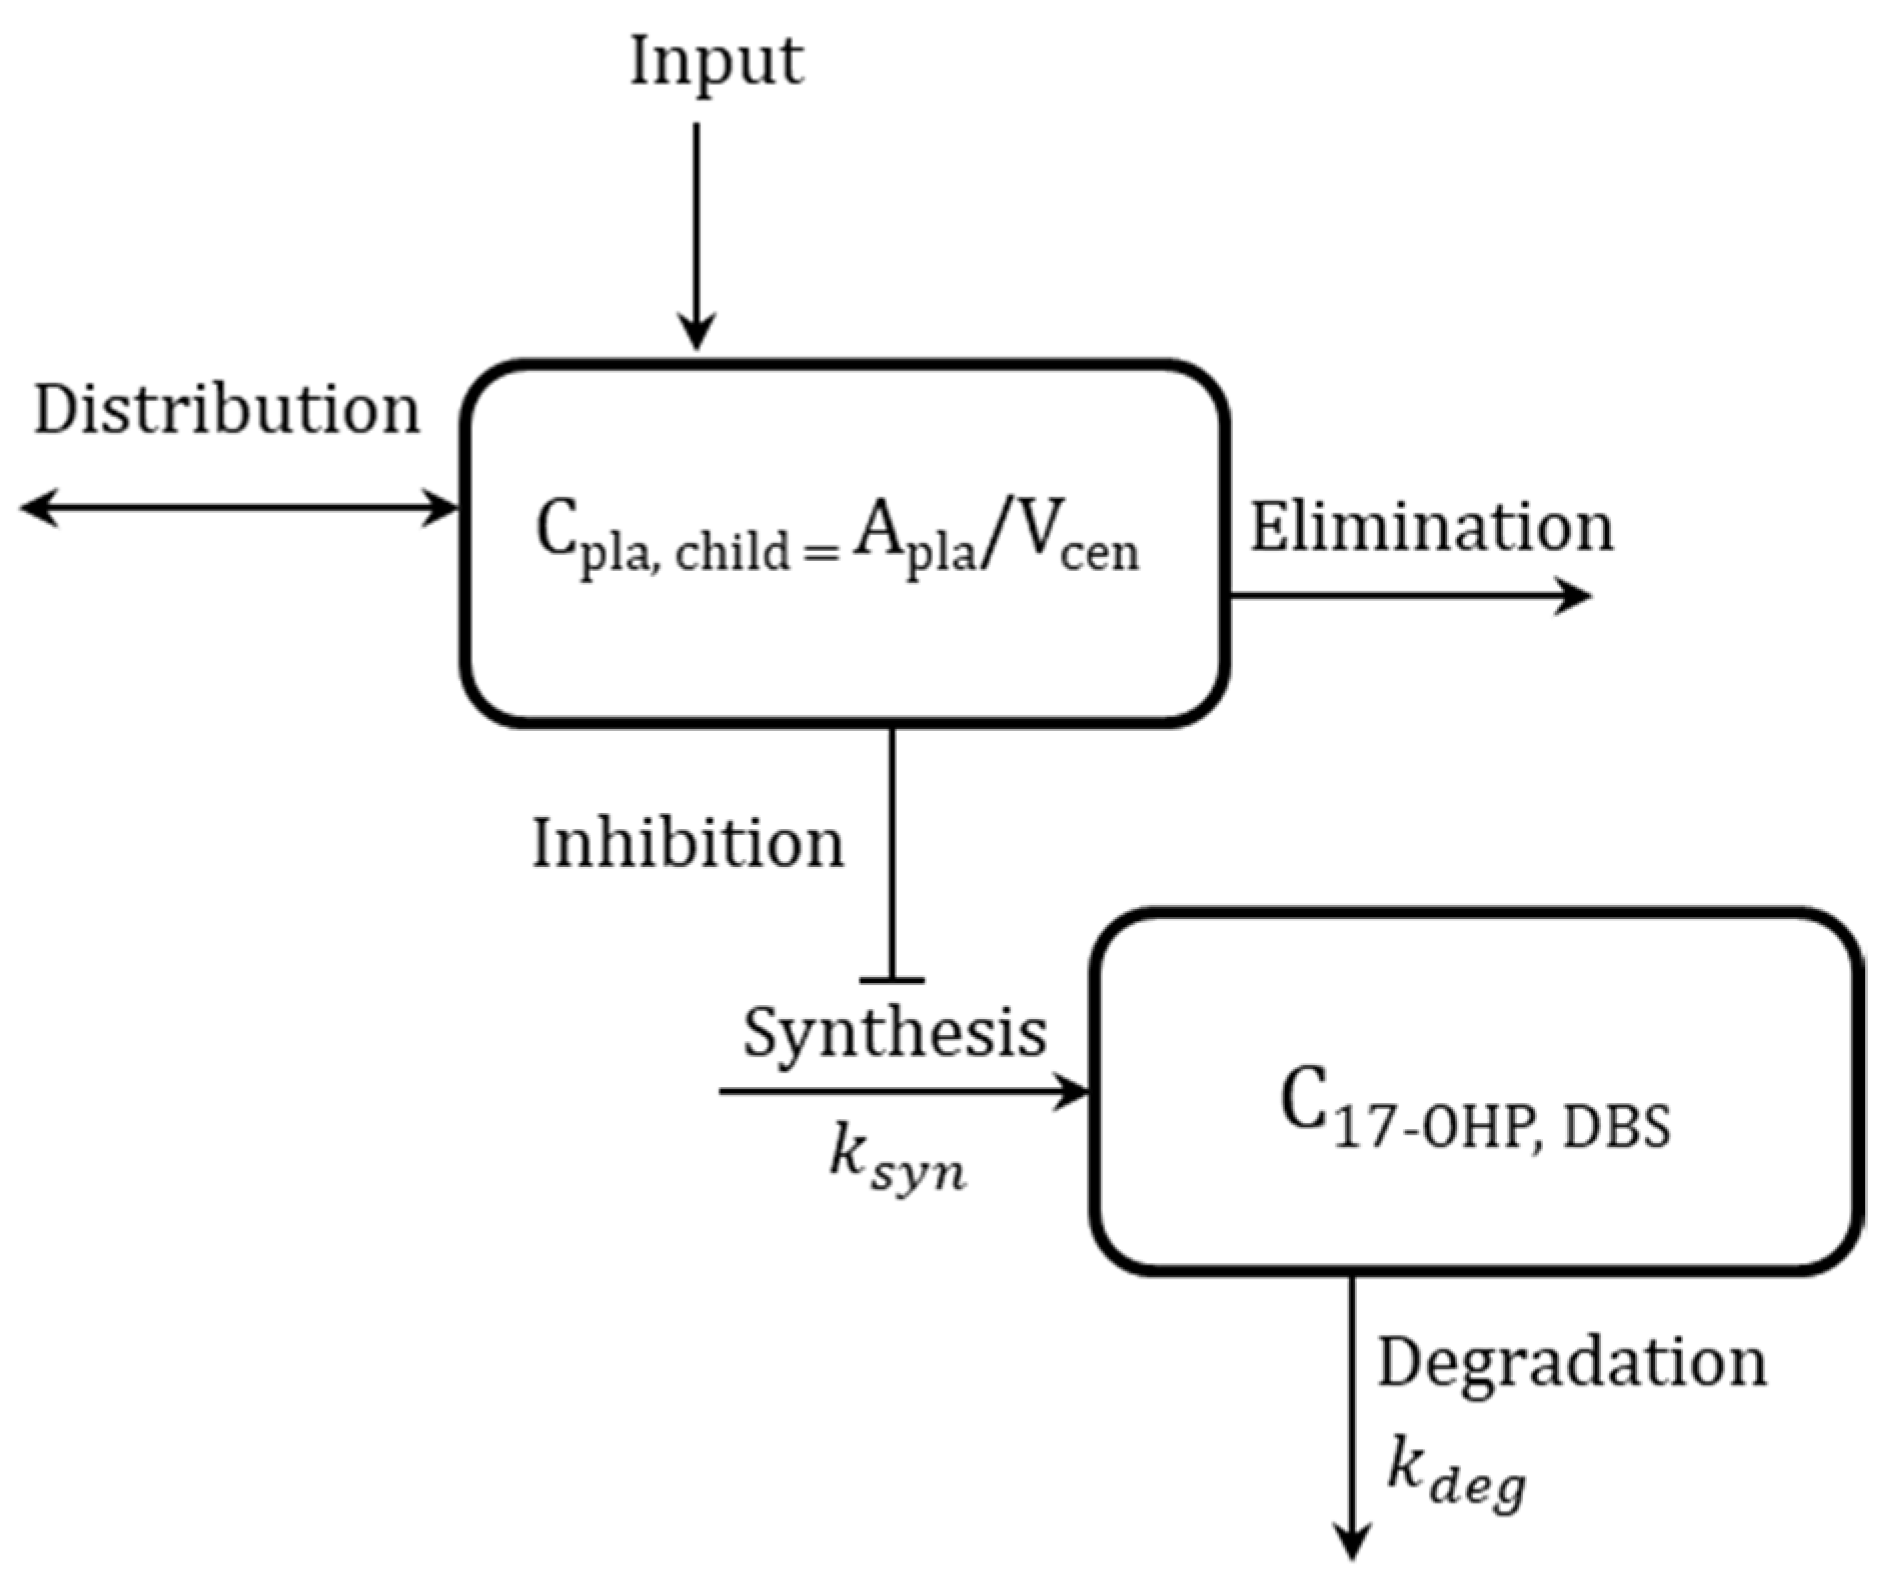
2.1.2. PK/PD Modeling
2.2. Step B: Comparison of Capillary and Venous DBS Cortisol and 17-OHP Concentrations from Routine Monitoring in Pediatric CAH Patients: Bland-Altman and Passing-Bablok Regression Analysis
2.3. Step C: Derivation and Evaluation of Venous and Capillary DBS 17-OHP Target Morning Concentration Range for Pediatric CAH Patients: PK/PD Model Predictions
3. Results
3.1. Step A: Establishing a Quantitative Relationship between Plasma Cortisol (PK) and Venous DBS 17-OHP (PD) Concentrations in Pediatric CAH Patients: PK/PD Clinical Trial Data and Model Development
3.1.1. Data and Graphical Evaluation
3.1.2. PK/PD Modeling
3.2. Step B: Comparison of Capillary and Venous DBS Cortisol and 17-OHP Concentrations from Routine Monitoring in Pediatric CAH Patients: Bland-Altman and Passing-Bablok Regression Analysis
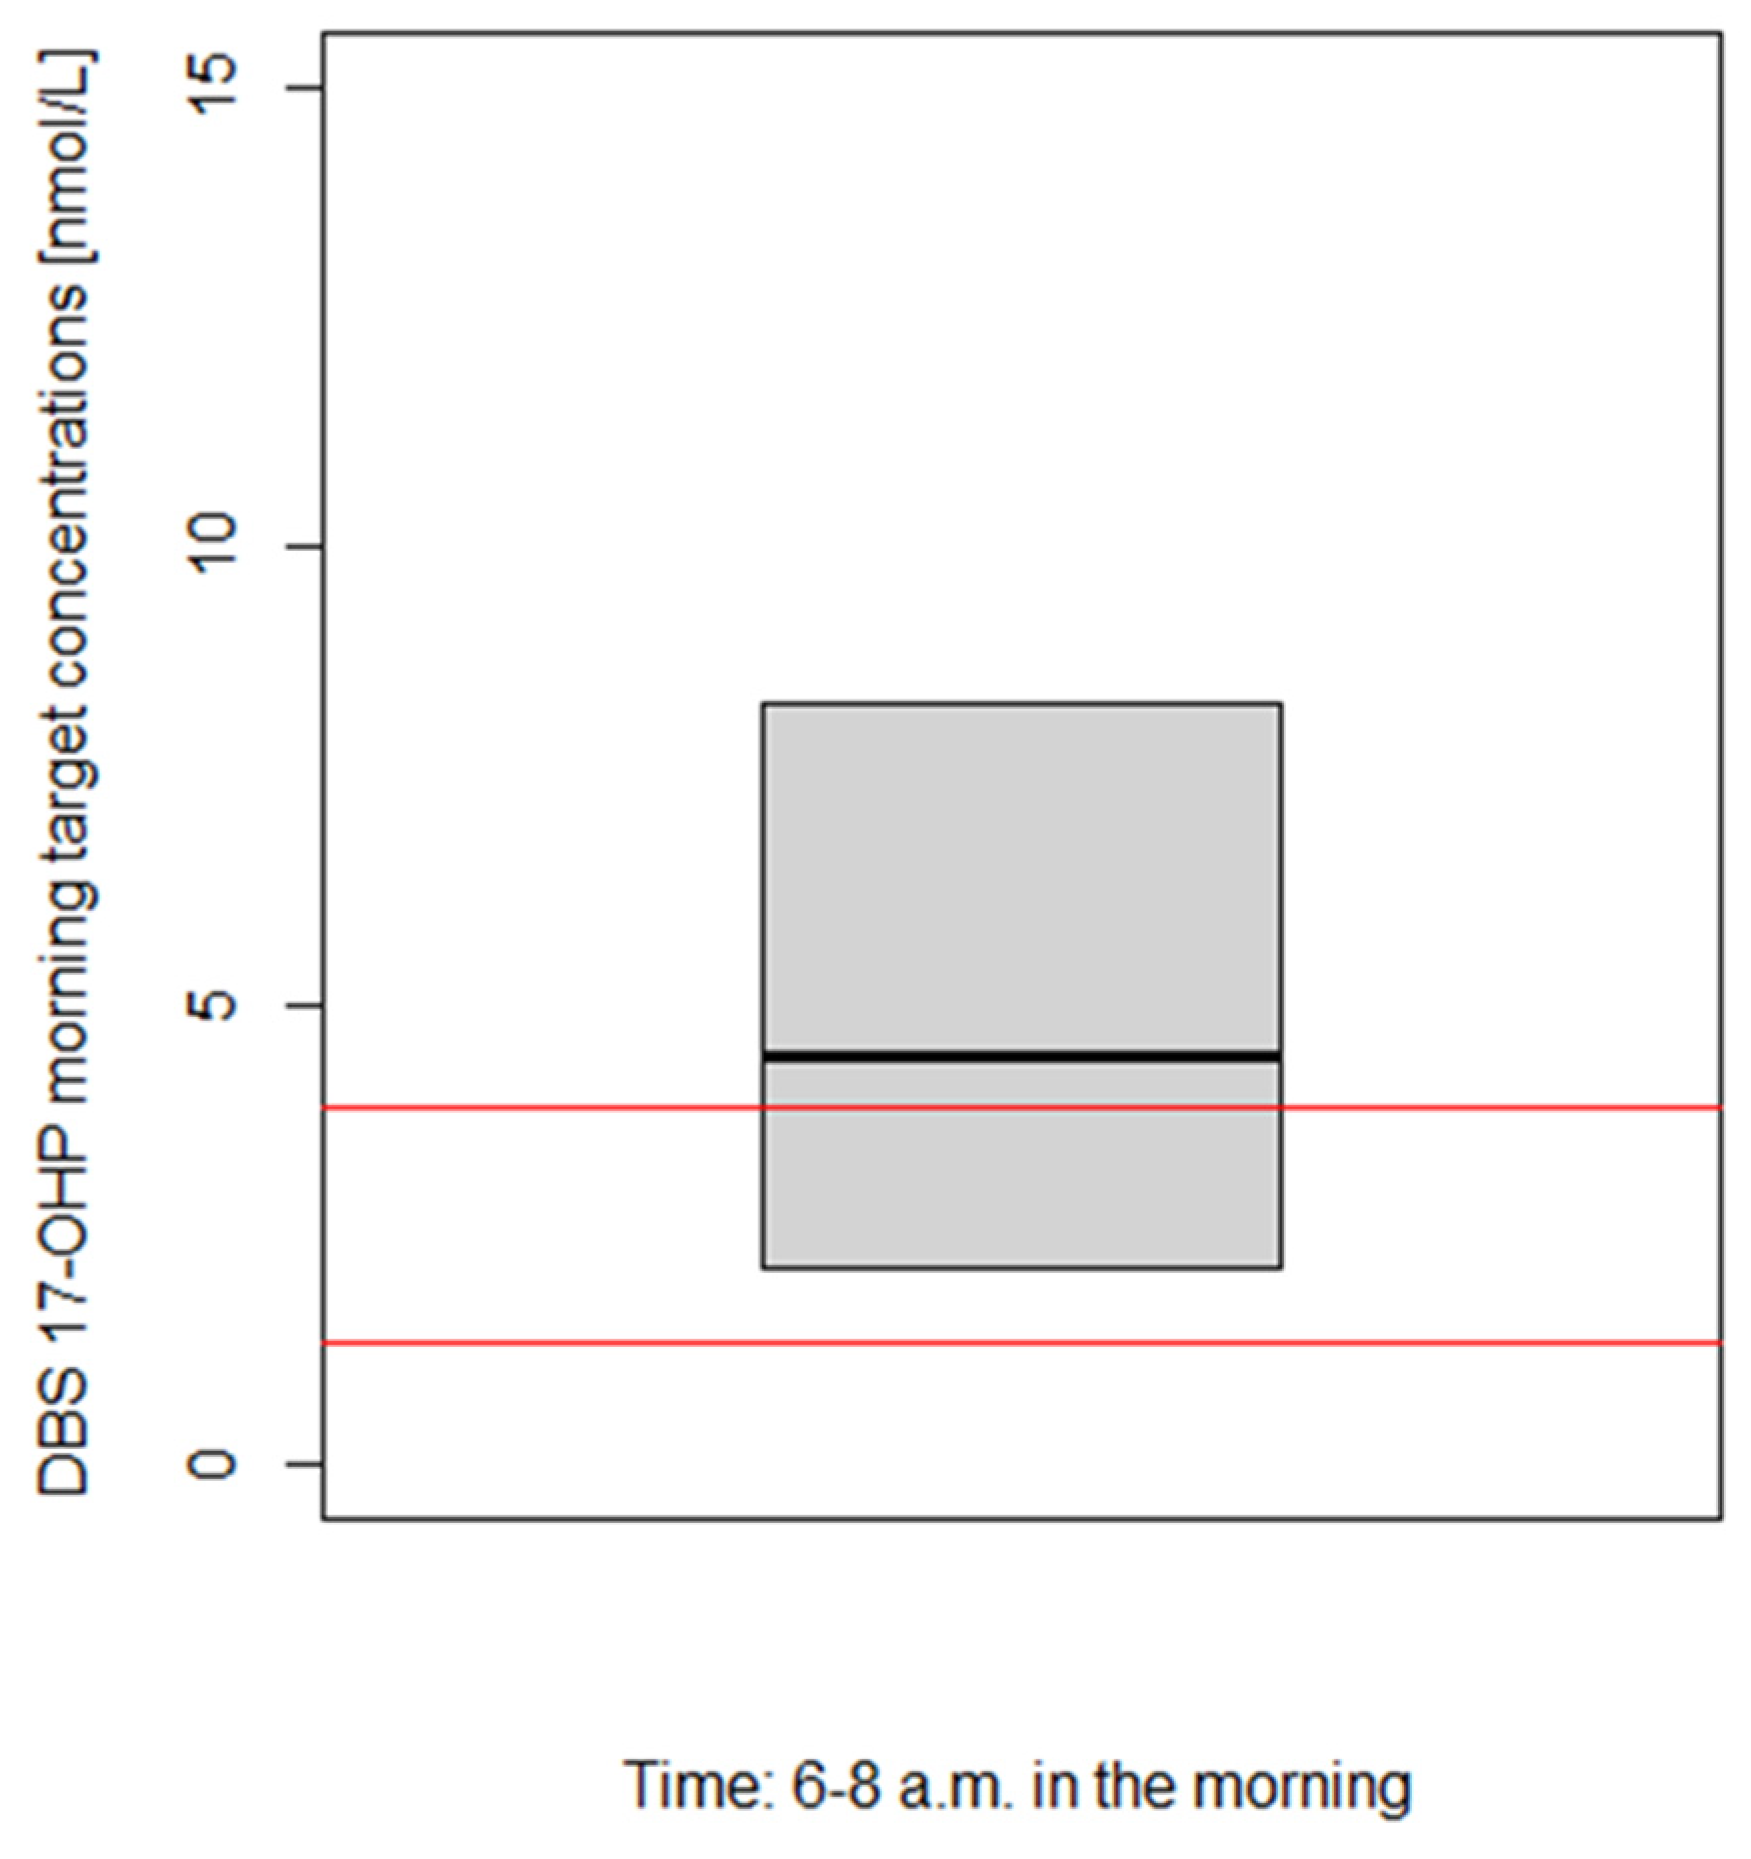
3.3. Step C: Derivation and Evaluation of Venous and Capillary DBS 17-OHP Target Morning Concentration Range for Pediatric CAH Patients: PK/PD Model Predictions
4. Discussion
5. Conclusions
Supplementary Materials
Author Contributions
Funding
Institutional Review Board Statement
Informed Consent Statement
Data Availability Statement
Acknowledgments
Conflicts of Interest
References
- Van der Grinten, H.L.C.; Speiser, P.W.; Faisal Ahmed, S.; Arlt, W.; Auchus, R.J.; Falhammar, H.; Flück, C.E.; Guasti, L.; Huebner, A.; Kortmann, B.B.M.; et al. Congenital Adrenal Hyperplasia—Current Insights in Pathophysiology, Diagnostics, and Management. Endocr. Rev. 2022, 43, 91–159. [Google Scholar] [CrossRef] [PubMed]
- Merke, D.P.; Bornstein, S.R. Congenital Adrenal Hyperplasia. Lancet 2005, 365, 2125–2136. [Google Scholar] [CrossRef] [PubMed]
- Balsamo, A.; Baronio, F.; Ortolano, R.; Menabo, S.; Baldazzi, L.; Di Natale, V.; Vissani, S.; Cassio, A. Congenital Adrenal Hyperplasias Presenting in the Newborn and Young Infant. Front. Pediatr. 2020, 8, 593315. [Google Scholar] [CrossRef] [PubMed]
- Speiser, P.W.; Arlt, W.; Auchus, R.J.; Baskin, L.S.; Conway, G.S.; Merke, D.P.; Meyer-Bahlburg, H.F.L.; Miller, W.L.; Hassan Murad, M.; Oberfield, S.E.; et al. Congenital Adrenal Hyperplasia Due to Steroid 21-Hydroxylase Deficiency: An Endocrine Society* Clinical Practice Guideline. J. Clin. Endocrinol. Metab. 2018, 103, 4043–4088. [Google Scholar] [CrossRef] [PubMed] [Green Version]
- Qasrawi, D.O.; Boyd, J.M.; Sadrzadeh, S.M.H. Measuring Steroids from Dried Blood Spots Using Tandem Mass Spectrometry to Diagnose Congenital Adrenal Hyperplasia. Clin. Chim. Acta 2021, 520, 202–207. [Google Scholar] [CrossRef] [PubMed]
- Edelbroek, P.M.; Van Der Heijden, J.; Stolk, L.M.L. Dried Blood Spot Methods in Therapeutic Drug Monitoring: Methods, Assays, and Pitfalls. Ther. Drug Monit. 2009, 31, 327–336. [Google Scholar] [CrossRef] [PubMed]
- Wilhelm, A.J.; den Burger, J.C.G.; Swart, E.L. Therapeutic Drug Monitoring by Dried Blood Spot: Progress to Date and Future Directions. Clin. Pharmacokinet. 2014, 53, 961–973. [Google Scholar] [CrossRef] [Green Version]
- Grecsó, N.; Zádori, A.; Szécsi, I.; Baráth, Á.; Galla, Z.; Bereczki, C.; Monostori, P. Storage Stability of Five Steroids and in Dried Blood Spots for Newborn Screening and Retrospective Diagnosis of Congenital Adrenal Hyperplasia. PLoS ONE 2020, 15, e0233724. [Google Scholar] [CrossRef]
- Lando, V.S.; Batista, M.C.; Nakamura, I.T.; Mazi, C.R.; Mendonca, B.B.; Brito, V.N. Effects of Long-Term Storage of Filter Paper Blood Samples on Neonatal Thyroid Stimulating Hormone, Thyroxin and 17-Alpha-Hydroxyprogesterone Measurements. J. Med. Screen. 2008, 15, 109–111. [Google Scholar] [CrossRef]
- Boelen, A.; Ruiter, A.F.C.; Claahsen-Van Der Grinten, H.L.; Endert, E.; Ackermans, M.T. Determination of a Steroid Profile in Heel Prick Blood Using LC-MS/MS. Bioanalysis 2016, 8, 375–384. [Google Scholar] [CrossRef]
- Stachanow, V.; Neumann, U.; Blankenstein, O.; Bindellini, D.; Melin, J.; Ross, R.; Whitaker, M.J.; Huisinga, W.; Michelet, R.; Kloft, C. Exploring Dried Blood Spot Cortisol Concentrations as an Alternative for Monitoring Pediatric Adrenal Insufficiency Patients: A Model-Based Analysis. Front. Pharmacol. 2022, 13, 819590. [Google Scholar] [CrossRef] [PubMed]
- Nella, A.A.; Mallappa, A.; Perritt, A.F.; Gounden, V.; Kumar, P.; Sinaii, N.; Daley, L.-A.; Ling, A.; Liu, C.-Y.; Soldin, S.J.; et al. A Phase 2 Study of Continuous Subcutaneous Hydrocortisone Infusion in Adults With Congenital Adrenal Hyperplasia. J. Clin. Endocrinol. Metab. 2016, 101, 4690–4698. [Google Scholar] [CrossRef] [PubMed] [Green Version]
- Mould, D.R.; Upton, R.N. Basic Concepts in Population Modeling, Simulation, and Model-Based Drug Development. CPT Pharmacomet. Syst. Pharmacol. 2012, 1, e6. [Google Scholar] [CrossRef]
- Neumann, U.; Whitaker, M.J.; Wiegand, S.; Krude, H.; Porter, J.; Davies, M.; Digweed, D.; Voet, B.; Ross, R.J.; Blankenstein, O. Absorption and Tolerability of Taste-Masked Hydrocortisone Granules in Neonates, Infants and Children under 6 Years of Age with Adrenal Insufficiency. Clin. Endocrinol. 2018, 88, 21–29. [Google Scholar] [CrossRef] [Green Version]
- Neumann, U.; Burau, D.; Spielmann, S.; Whitaker, M.J.; Ross, R.J.; Kloft, C.; Blankenstein, O. Quality of Compounded Hydrocortisone Capsules Used in the Treatment of Children. Eur. J. Endocrinol. 2017, 177, 239–242. [Google Scholar] [CrossRef] [PubMed] [Green Version]
- Michelet, R.; Melin, J.; Parra-Guillen, Z.P.; Neumann, U.; Whitaker, M.J.; Stachanow, V.; Huisinga, W.; Porter, J.; Blankenstein, O.; Ross, R.J.; et al. Paediatric Population Pharmacokinetic Modelling to Assess Hydrocortisone Replacement Dosing Regimens in Young Children. Eur. J. Endocrinol. 2020, 183, 357–368. [Google Scholar] [CrossRef]
- R Core Team. R: A Language and Environment for Statistical Computing; R Foundation for Statistical Computing: Vienna, Austria, 2019; Available online: https://www.R-Project.org/ (accessed on 1 March 2023).
- RStudio Team. RStudio: Integrated Development Environment for R; RStudio, PBC: Boston, MA, USA, 2020; Available online: http://www.Rstudio.com/ (accessed on 1 March 2023).
- Zhang, L.; Beal, S.L.; Sheiner, L.B. Simultaneous vs. Sequential Analysis for Population PK/PD Data I: Best-Case Performance. J. Pharmacokinet. Pharmacodyn. 2003, 30, 387–404. [Google Scholar] [CrossRef] [PubMed]
- Beal, S.L. Ways to Fit a PK Model with Some Data below the Quantification Limit. J. Pharmacokinet. Pharmacodyn. 2001, 28, 481–504. [Google Scholar] [CrossRef] [PubMed]
- Beal, S.; Sheiner, L.B.; Boeckmann, A.; Bauer, R.J. NONMEM User’s Guides 1989–2009; Icon Development Solutions: Ellicott City, MD, USA, 2009. [Google Scholar]
- Keizer, R.J.; Karlsson, M.O.; Hooker, A. Modeling and Simulation Workbench for NONMEM: Tutorial on Pirana, PsN, and Xpose. CPT Pharmacometrics Syst. Pharmacol. 2013, 2, e50. [Google Scholar] [CrossRef]
- Bland, J.M.; Altman, D.G. Statistical Methods for Assessing Agreement between Two Methods of Clinical Measurement. Lancet 1986, 1, 307–310. [Google Scholar] [CrossRef]
- Bablok, W.; Passing, H. Application of Statistical Procedures Analytical Instrument Testing. J. Automat. Chem. 1985, 7, 74–79. [Google Scholar] [CrossRef] [PubMed]
- Giavarina, D. Understanding Bland Altman Analysis. Biochem. Med. 2015, 25, 141–151. [Google Scholar] [CrossRef] [PubMed] [Green Version]
- Bilic-Zulle, L. Lessons in Biostatistics Comparison of Methods: Passing and Bablok Regression. Biochem. Med. 2011, 21, 49–52. [Google Scholar] [CrossRef] [PubMed]
- Barton, J.S.; Gardiner, H.M.; Cullen, S.; Hindmarsh, P.C.; Brook, C.G.D.; Preece, M.A. The Growth and Cardiovascular Effects of High Dose Growth Hormone Therapy in Idiopathic Short Stature. Clin. Endocrinol. 1995, 42, 619–626. [Google Scholar] [CrossRef]
- Peters, C.J.; Hill, N.; Dattani, M.T.; Charmandari, E.; Matthews, D.R.; Hindmarsh, P.C. Deconvolution Analysis of 24-h Serum Cortisol Profiles Informs the Amount and Distribution of Hydrocortisone Replacement Therapy. Clin. Endocrinol. 2013, 78, 347–351. [Google Scholar] [CrossRef]
- Al-Kofahi, M.; Ahmed, M.A.; Jaber, M.M.; Tran, T.N.; Willis, B.A.; Zimmerman, C.L.; Gonzalez-Bolanos, M.T.; Brundage, R.C.; Sarafoglou, K. An Integrated PK-PD Model for Cortisol and the 17-Hydroxyprogesterone and Androstenedione Biomarkers in Children with Congenital Adrenal Hyperplasia. Br. J. Clin. Pharmacol. 2021, 87, 1098–1110. [Google Scholar] [CrossRef]
- Melin, J.; Parra-Guillen, Z.P.; Michelet, R.; Truong, T.; Huisinga, W.; Hartung, N.; Hindmarsh, P.; Kloft, C. Pharmacokinetic/Pharmacodynamic Evaluation of Hydrocortisone Therapy in Pediatric Patients with Congenital Adrenal Hyperplasia. J. Clin. Endocrinol. Metab. 2020, 105, E1729–E1740. [Google Scholar] [CrossRef]
- Wagner, M.; Tonoli, D.; Varesio, E.; Hopfgartner, G. The Use of Mass Spectrometry to Analyze Dried Blood Spots. Mass Spectrom. Rev. 2016, 35, 361–438. [Google Scholar] [CrossRef]
- Enderle, Y.; Foerster, K.; Burhenne, J. Clinical Feasibility of Dried Blood Spots: Analytics, Validation, and Applications. J. Pharm. Biomed. Anal. 2016, 130, 231–243. [Google Scholar] [CrossRef]
- De Kesel, P.M.M.; Sadones, N.; Capiau, S.; Lambert, W.E.; Stove, C.P. Hemato-Critical Issues in Quantitative Analysis of Dried Blood Spots: Challenges and Solutions. Bioanalysis 2013, 5, 2023–2041. [Google Scholar] [CrossRef]
- Melin, J.; Hartung, N.; Parra-Guillen, Z.P.; Whitaker, M.J.; Ross, R.J.; Kloft, C. The Circadian Rhythm of Corticosteroid-Binding Globulin Has Little Impact on Cortisol Exposure after Hydrocortisone Dosing. Clin. Endocrinol. 2019, 91, 33–40. [Google Scholar] [CrossRef] [PubMed] [Green Version]


| Parameter | Estimate (RSE, %) |
|---|---|
| Structural model | |
| kdeg [1/h] | 1.22 (7.0) |
| IC50 [nmol/L] Imax [-] Hill [-] | 21.0 (27) 1 * 1 * |
| Interindividual variability (IIV) | |
| IIV on kdeg, %CV | 5.0* |
| IIV on IC50, %CV | 104 (53) |
| IIV on 17-OHPBASE, %CV | 131 * |
| Residual unexplained variability (RUV) | |
| RUV [%CV] | 38.1 (15) |
Disclaimer/Publisher’s Note: The statements, opinions and data contained in all publications are solely those of the individual author(s) and contributor(s) and not of MDPI and/or the editor(s). MDPI and/or the editor(s) disclaim responsibility for any injury to people or property resulting from any ideas, methods, instructions or products referred to in the content. |
© 2023 by the authors. Licensee MDPI, Basel, Switzerland. This article is an open access article distributed under the terms and conditions of the Creative Commons Attribution (CC BY) license (https://creativecommons.org/licenses/by/4.0/).
Share and Cite
Stachanow, V.; Neumann, U.; Blankenstein, O.; Alder-Baerens, N.; Bindellini, D.; Hindmarsh, P.; Ross, R.J.; Whitaker, M.J.; Melin, J.; Huisinga, W.; et al. Model-Informed Target Morning 17α-Hydroxyprogesterone Concentrations in Dried Blood Spots for Pediatric Congenital Adrenal Hyperplasia Patients. Pharmaceuticals 2023, 16, 464. https://doi.org/10.3390/ph16030464
Stachanow V, Neumann U, Blankenstein O, Alder-Baerens N, Bindellini D, Hindmarsh P, Ross RJ, Whitaker MJ, Melin J, Huisinga W, et al. Model-Informed Target Morning 17α-Hydroxyprogesterone Concentrations in Dried Blood Spots for Pediatric Congenital Adrenal Hyperplasia Patients. Pharmaceuticals. 2023; 16(3):464. https://doi.org/10.3390/ph16030464
Chicago/Turabian StyleStachanow, Viktoria, Uta Neumann, Oliver Blankenstein, Nele Alder-Baerens, Davide Bindellini, Peter Hindmarsh, Richard J. Ross, Martin J. Whitaker, Johanna Melin, Wilhelm Huisinga, and et al. 2023. "Model-Informed Target Morning 17α-Hydroxyprogesterone Concentrations in Dried Blood Spots for Pediatric Congenital Adrenal Hyperplasia Patients" Pharmaceuticals 16, no. 3: 464. https://doi.org/10.3390/ph16030464