
Integrative Ligand-Based Pharmacophore Modeling, Virtual Screening, and Molecular Docking Simulation Approaches Identified Potential Lead Compounds against Pancreatic Cancer by Targeting FAK1

 ,
,  ,
,  , , ,
, , ,  and
and 
Abstract
:1. Introduction
2. Results
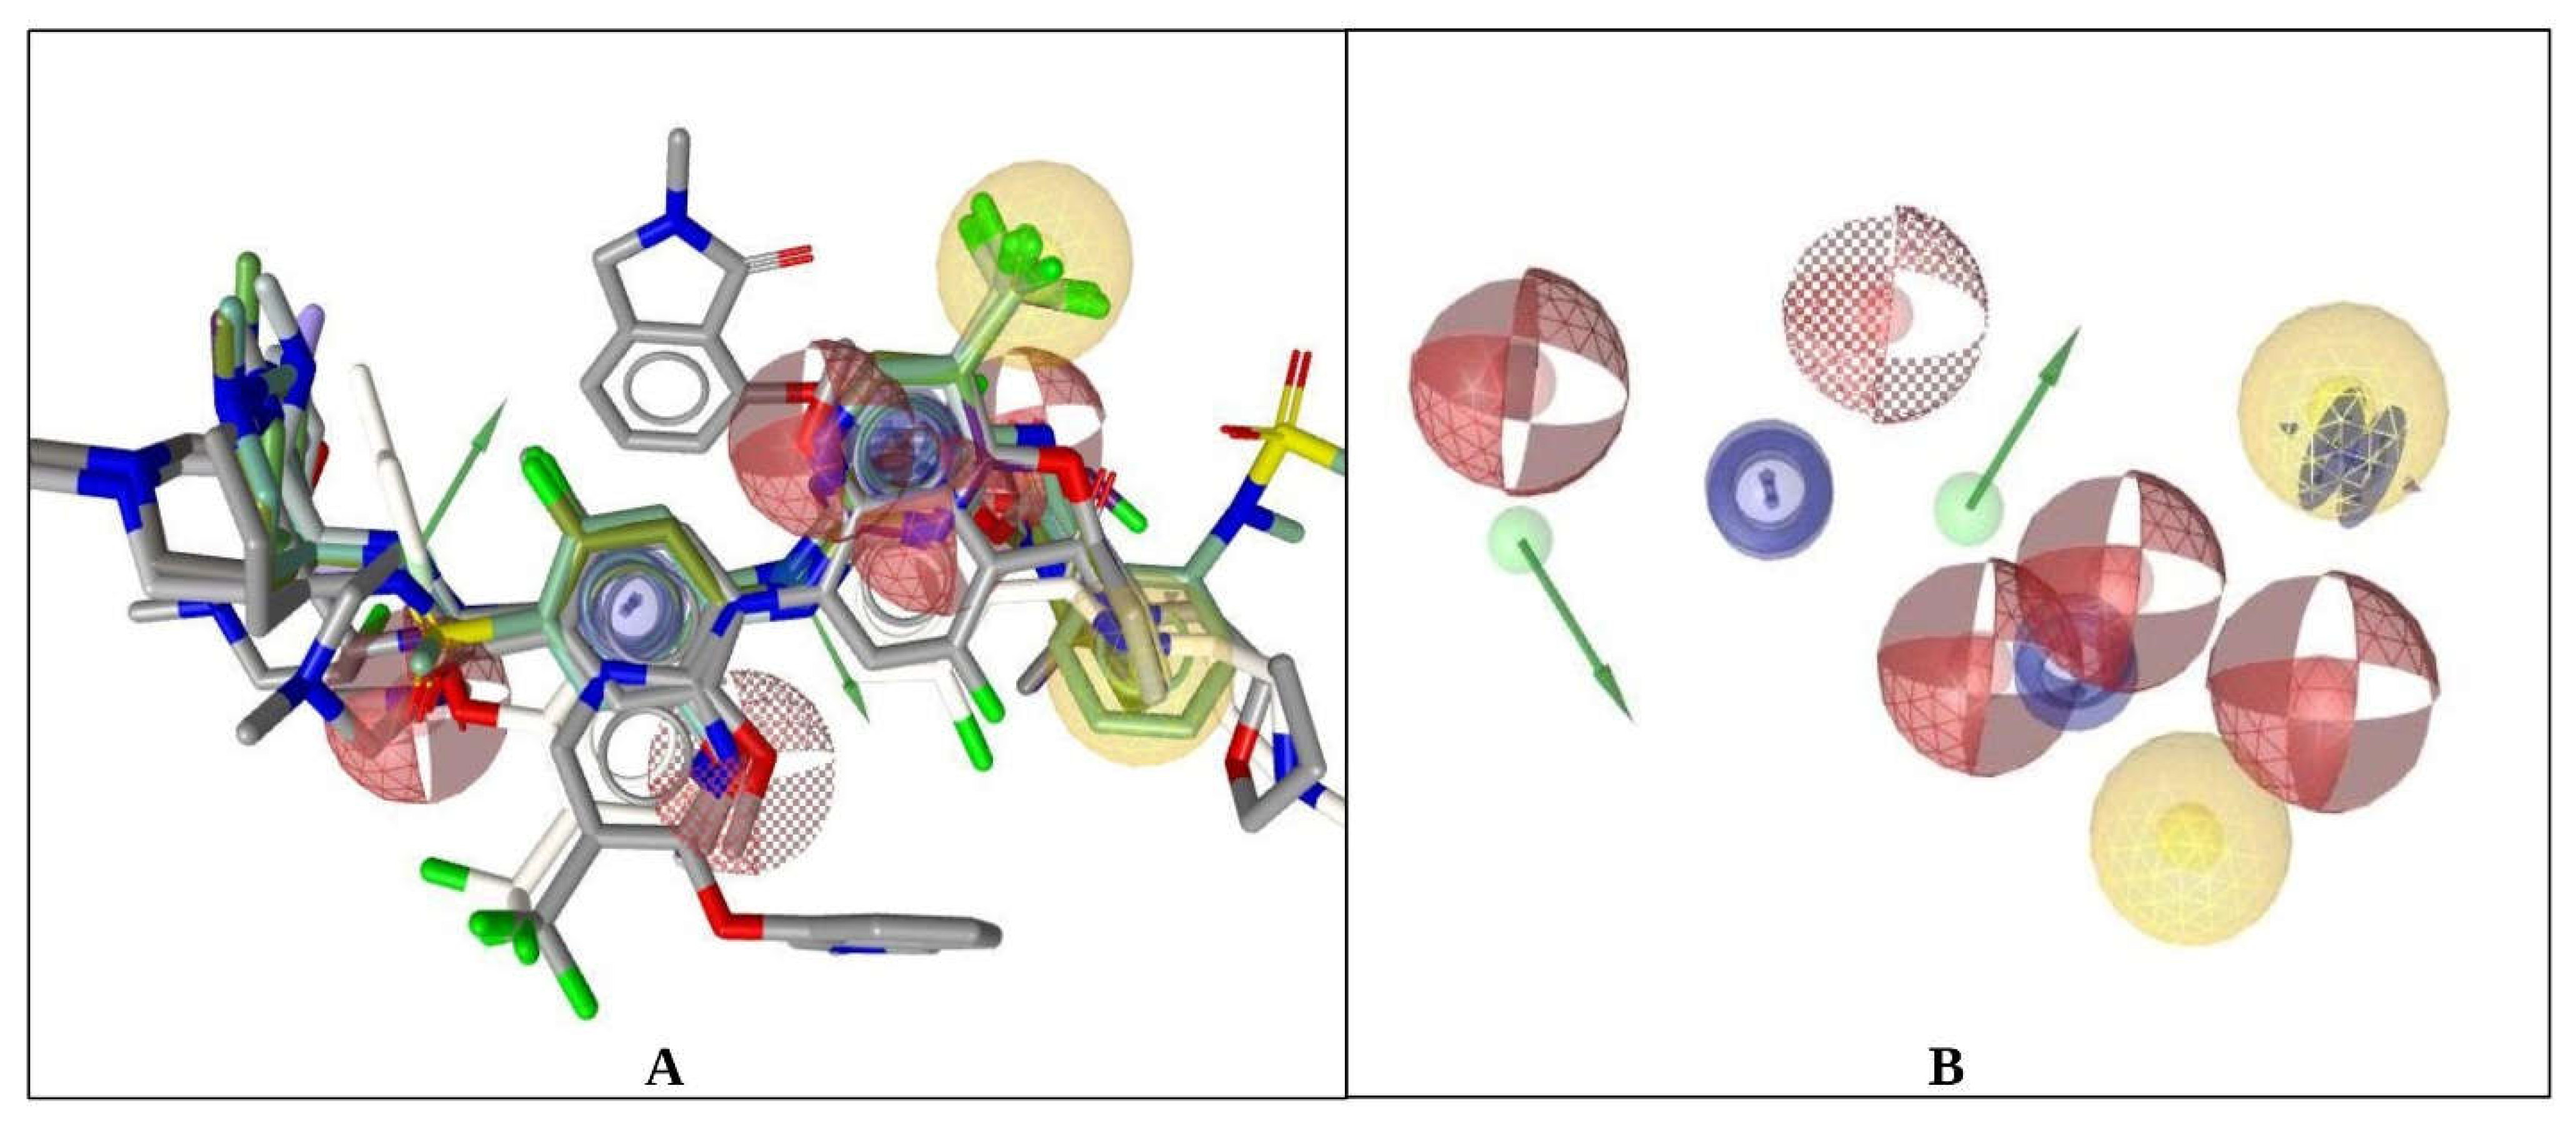
2.1. Ligand-Based Pharmacophore Modeling and Virtual Screening
Pharmacophore Model Generation
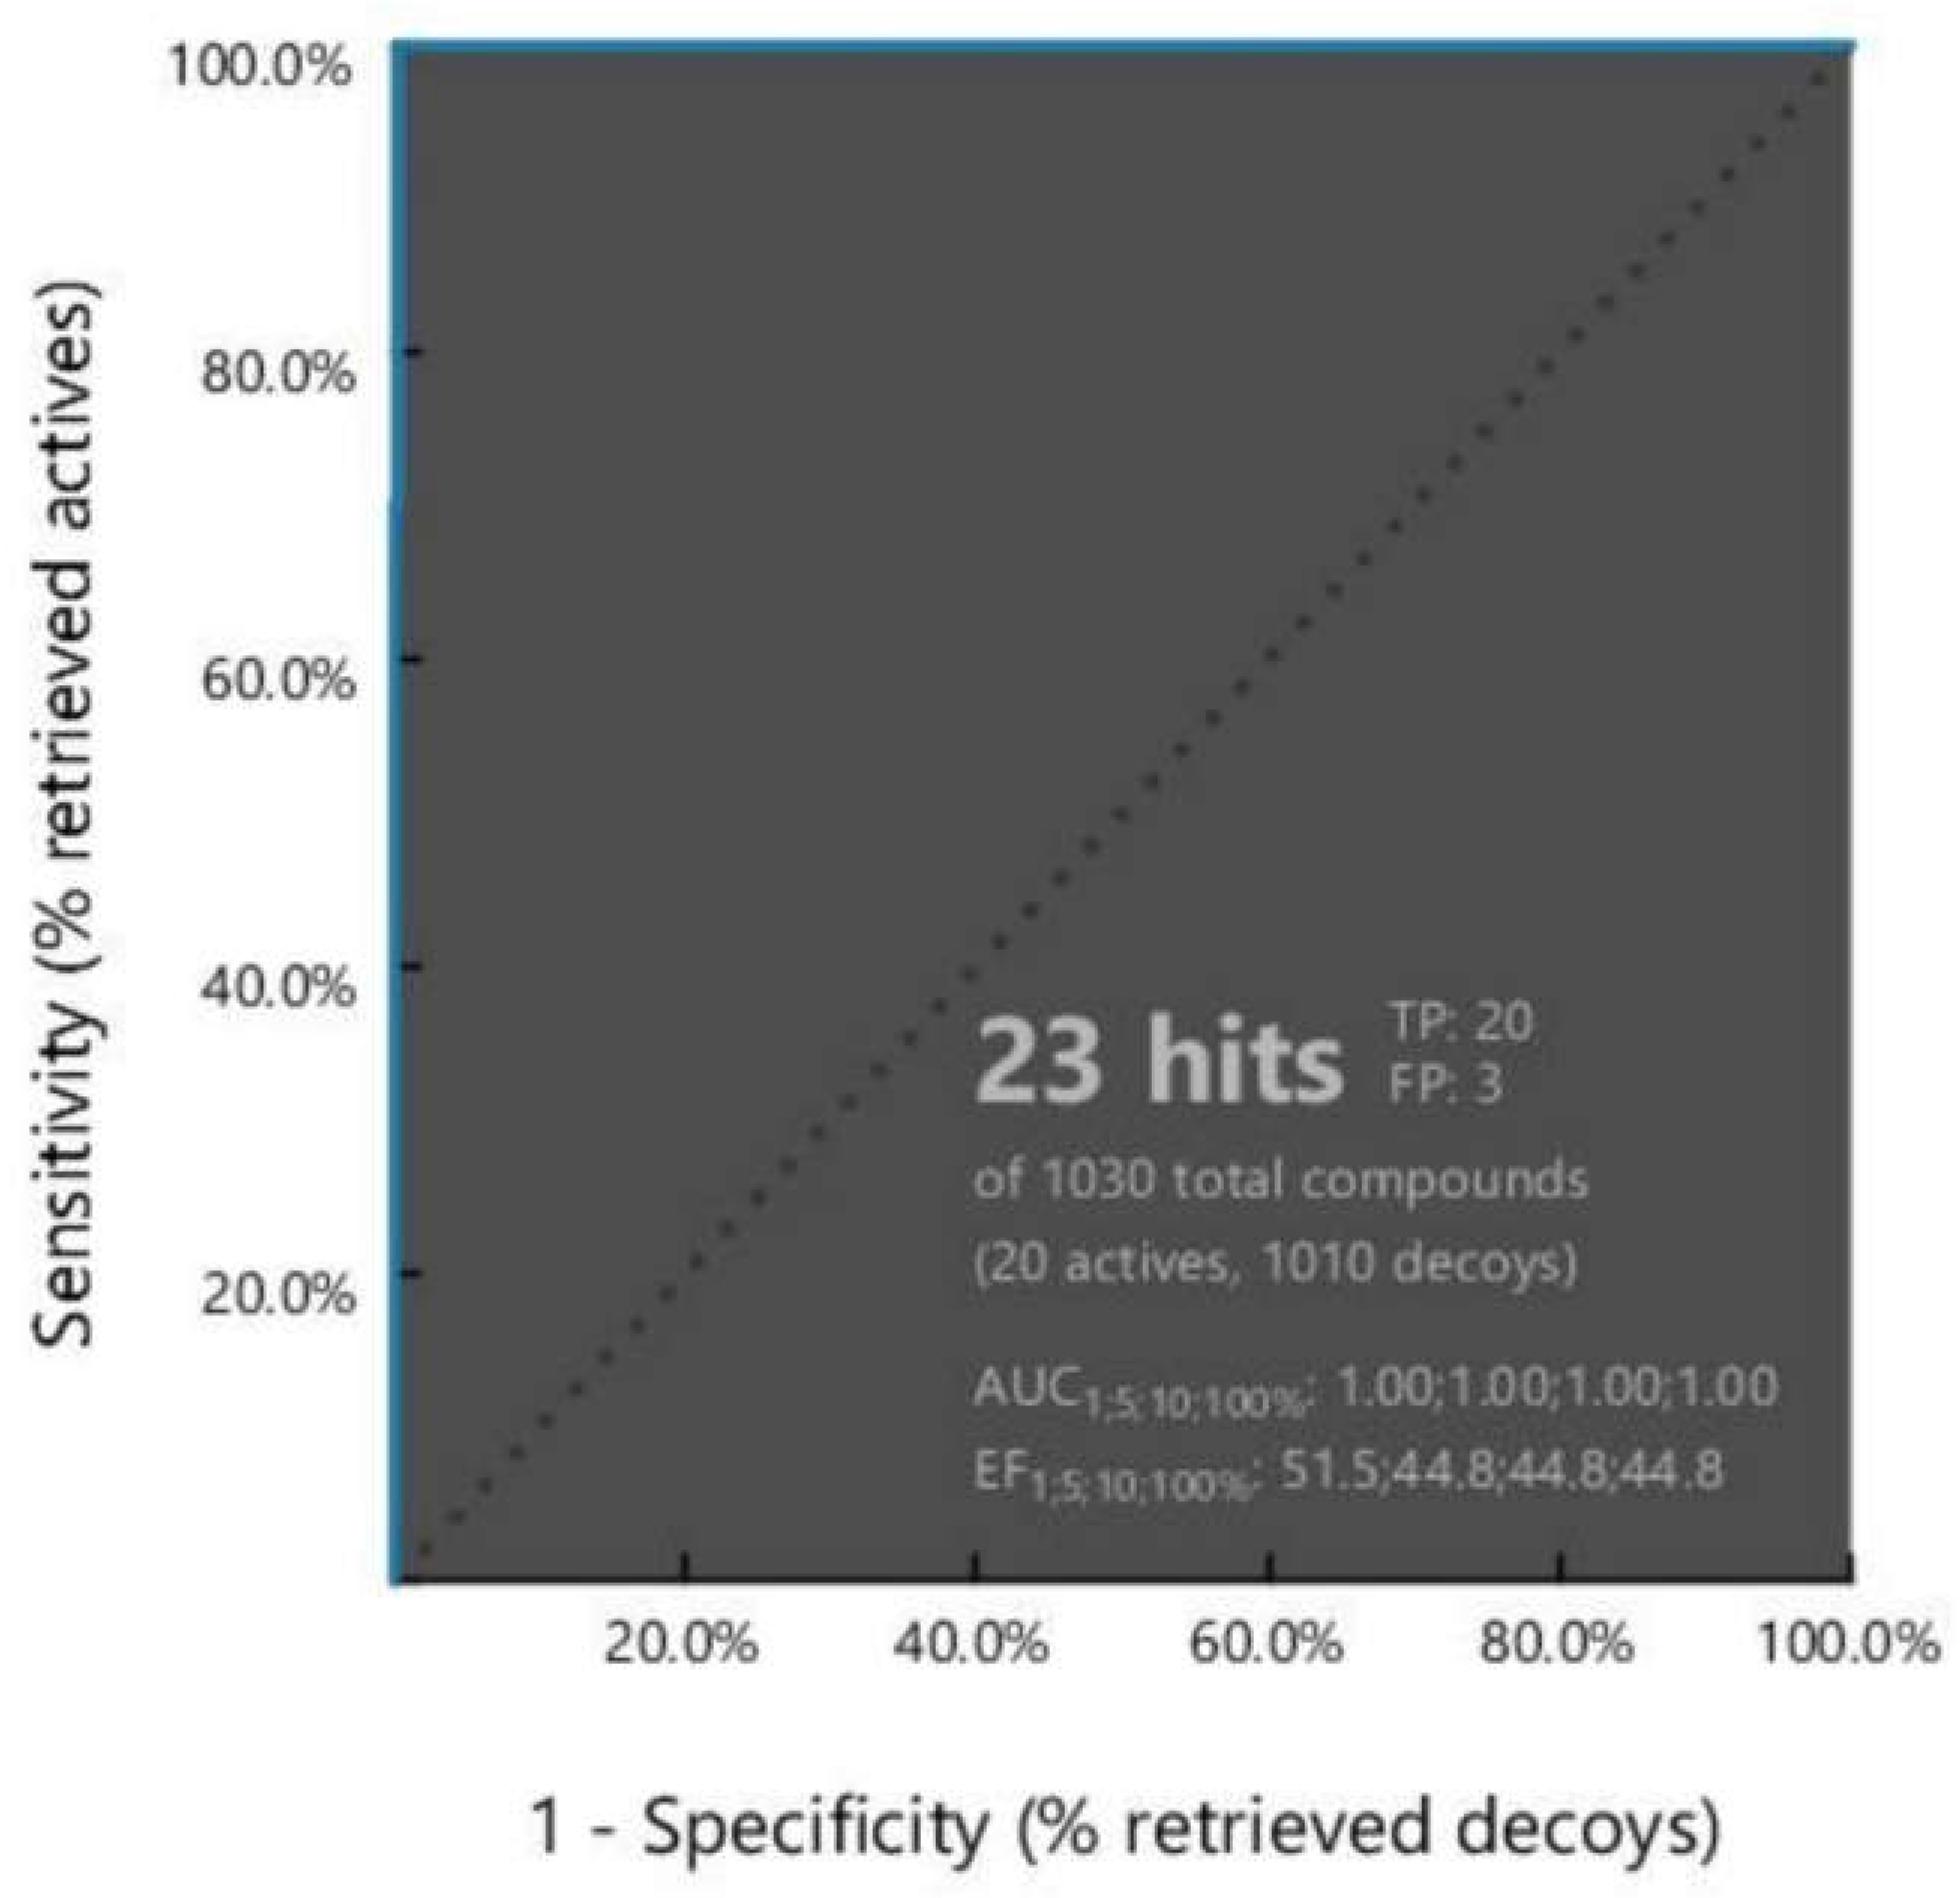
2.2. Pharmacophore Model Validation
2.3. Dataset Generation for Pharmacophore-Base Screening
2.4. Pharmacophore-Based Virtual Screening
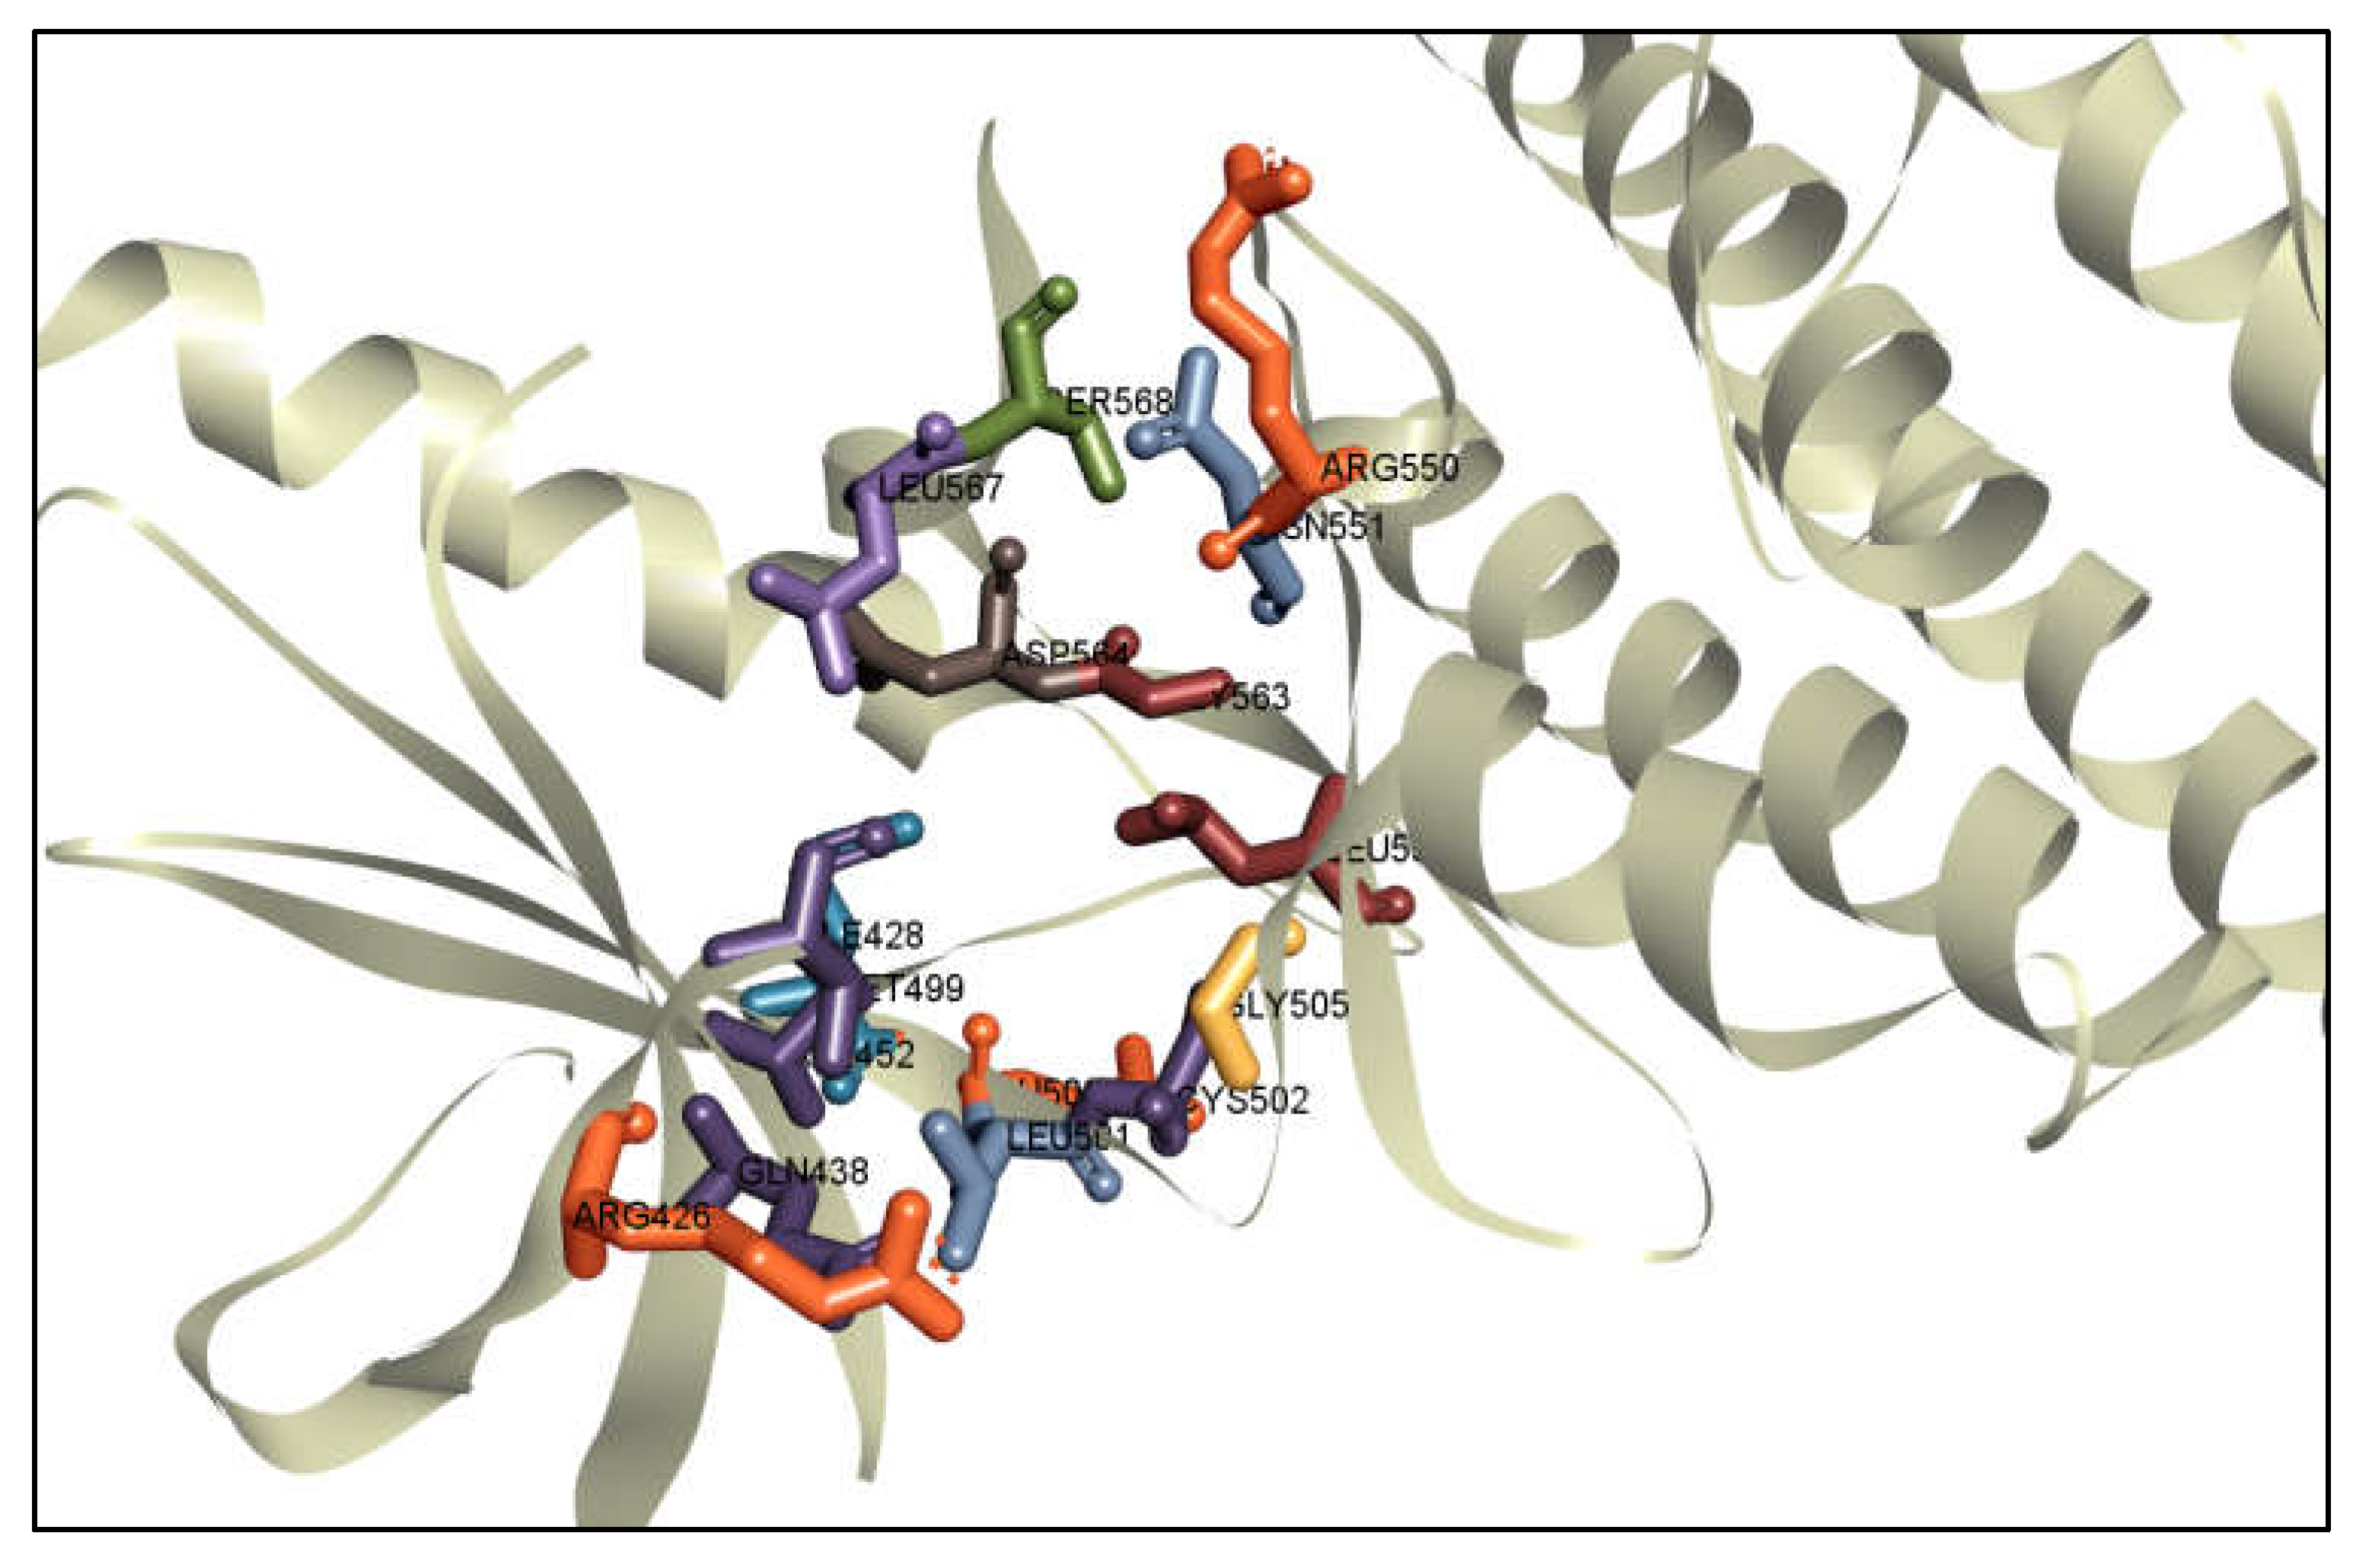
2.5. Binding Site Identification and Receptor Grid Generation
2.6. Molecular Docking
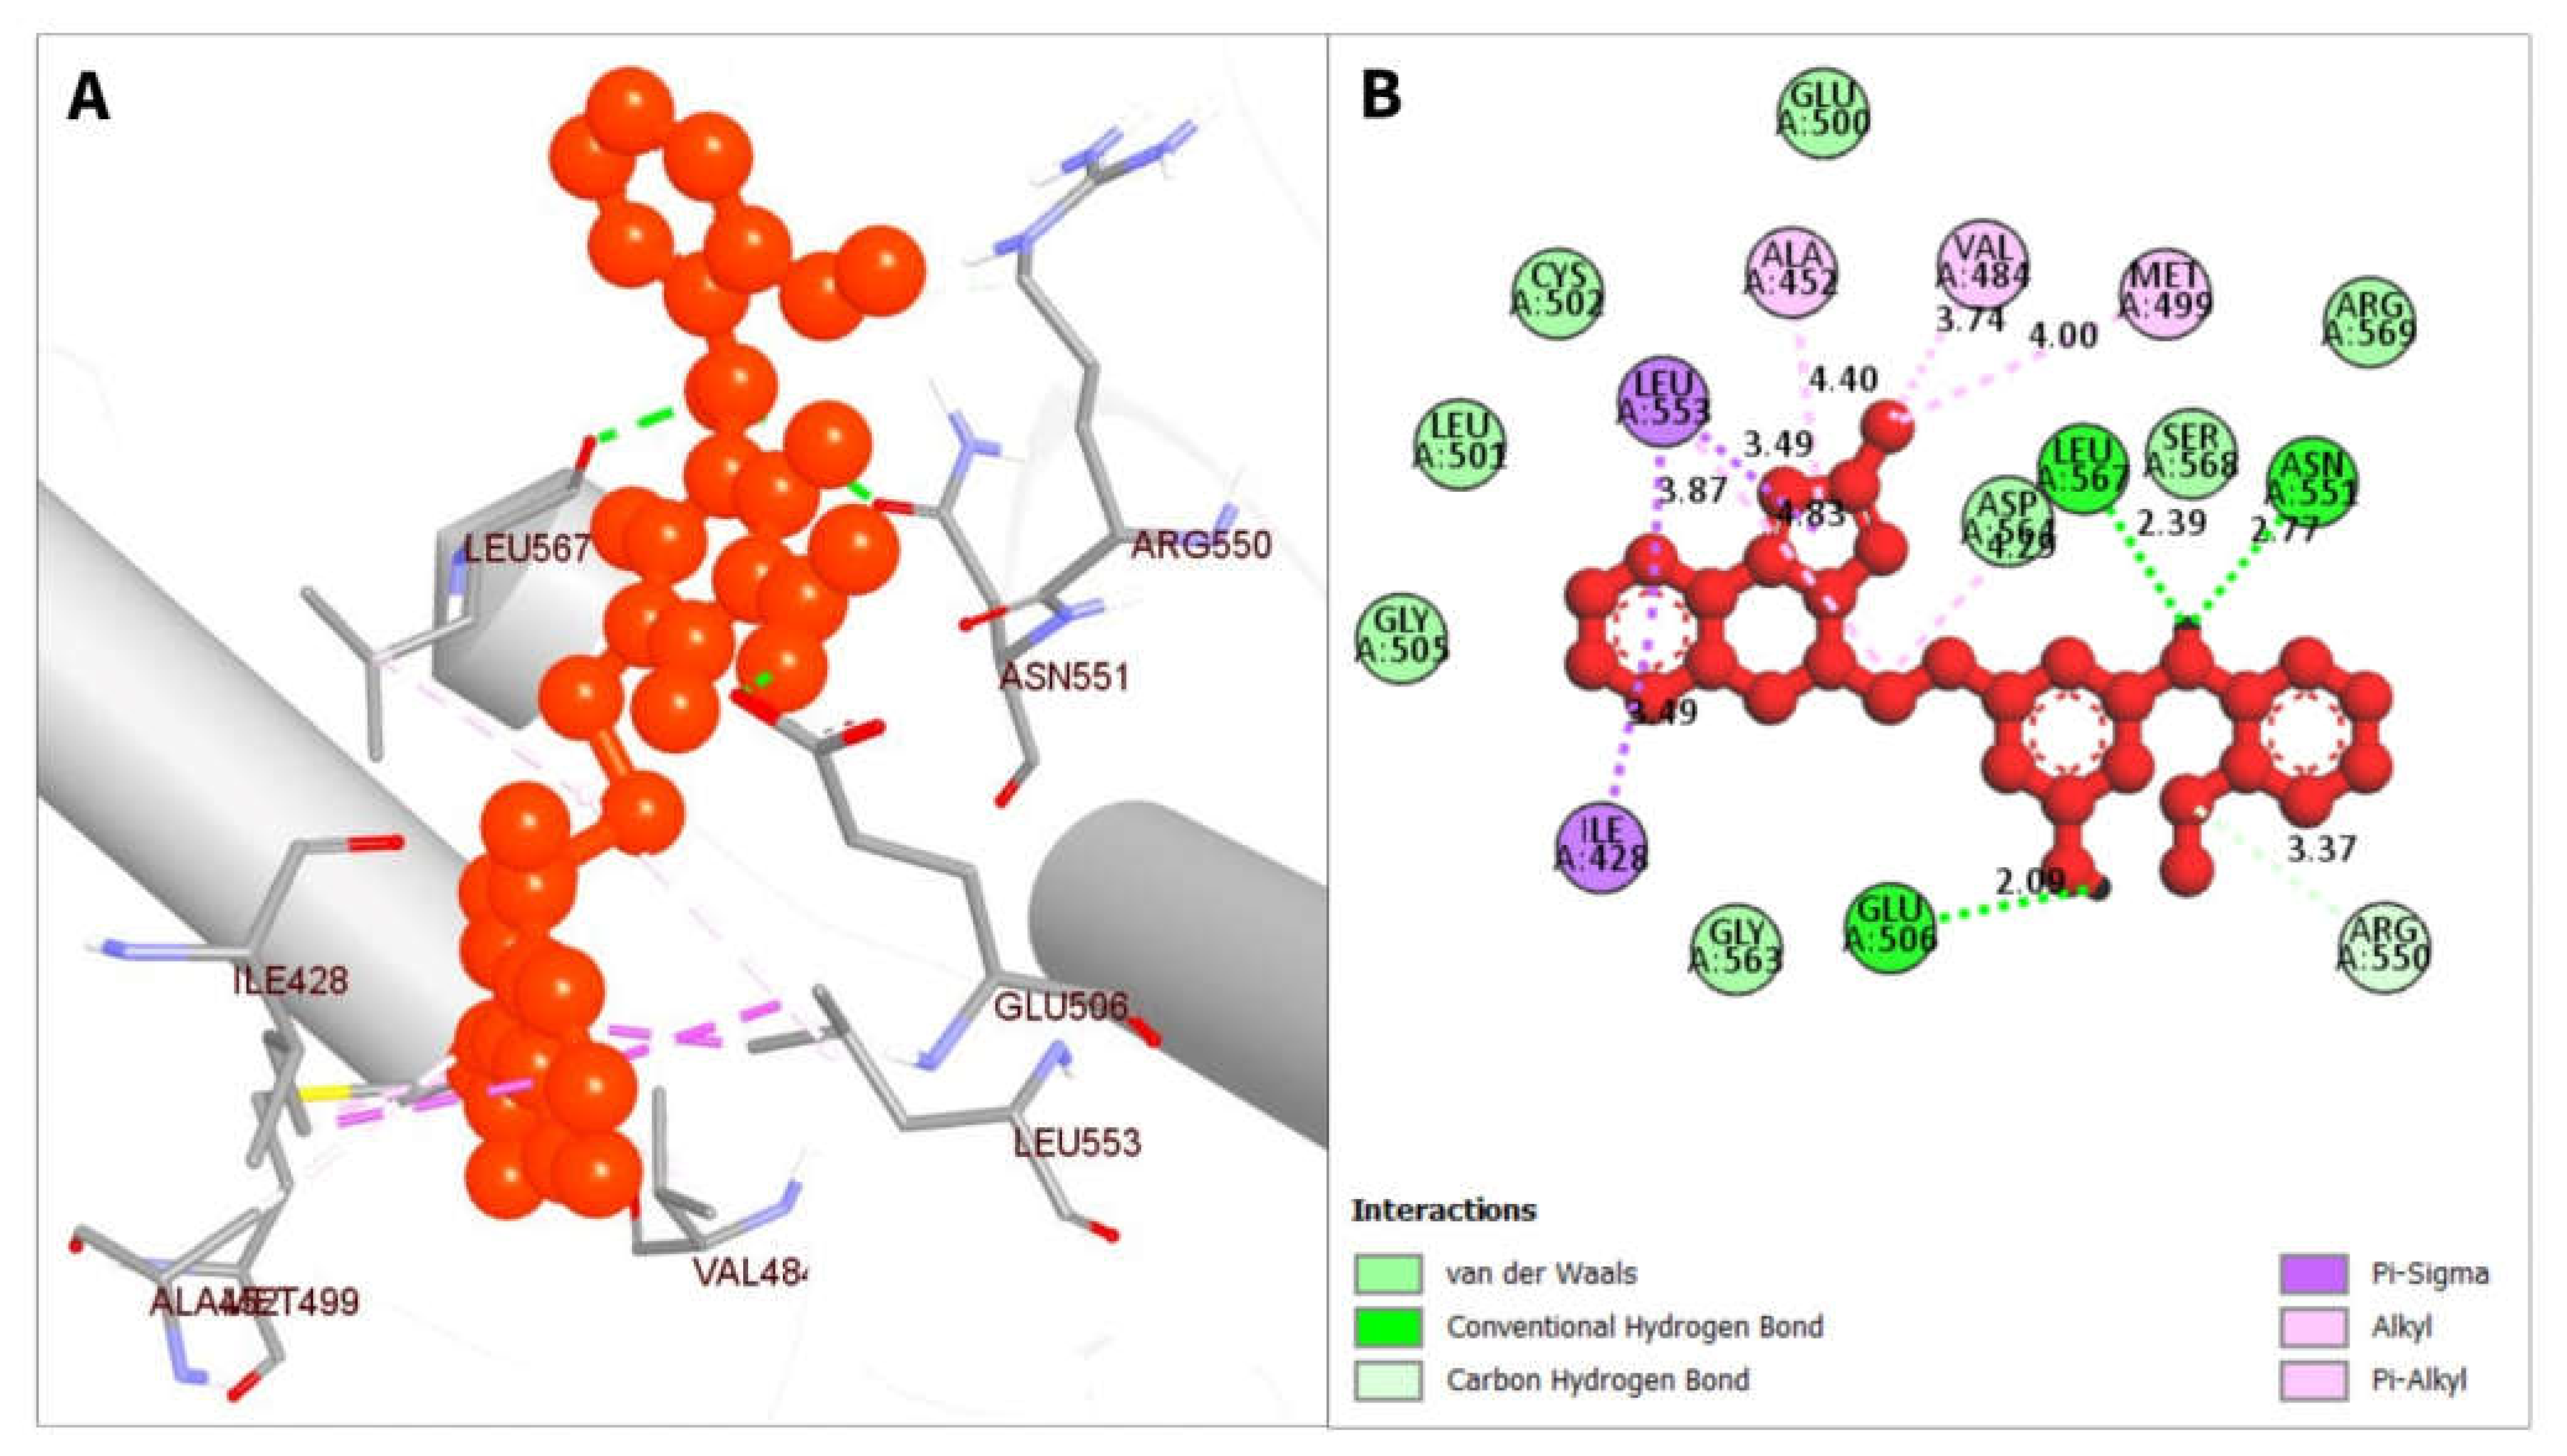
2.7. Interpretation of Protein-Ligands Interactions
2.8. Absorption, Distribution, Metabolism and Excretion (ADME) and Toxicity Test Analysis
2.8.1. ADME Properties Analysis
2.8.2. Toxicity Analysis
2.9. MD Simulation
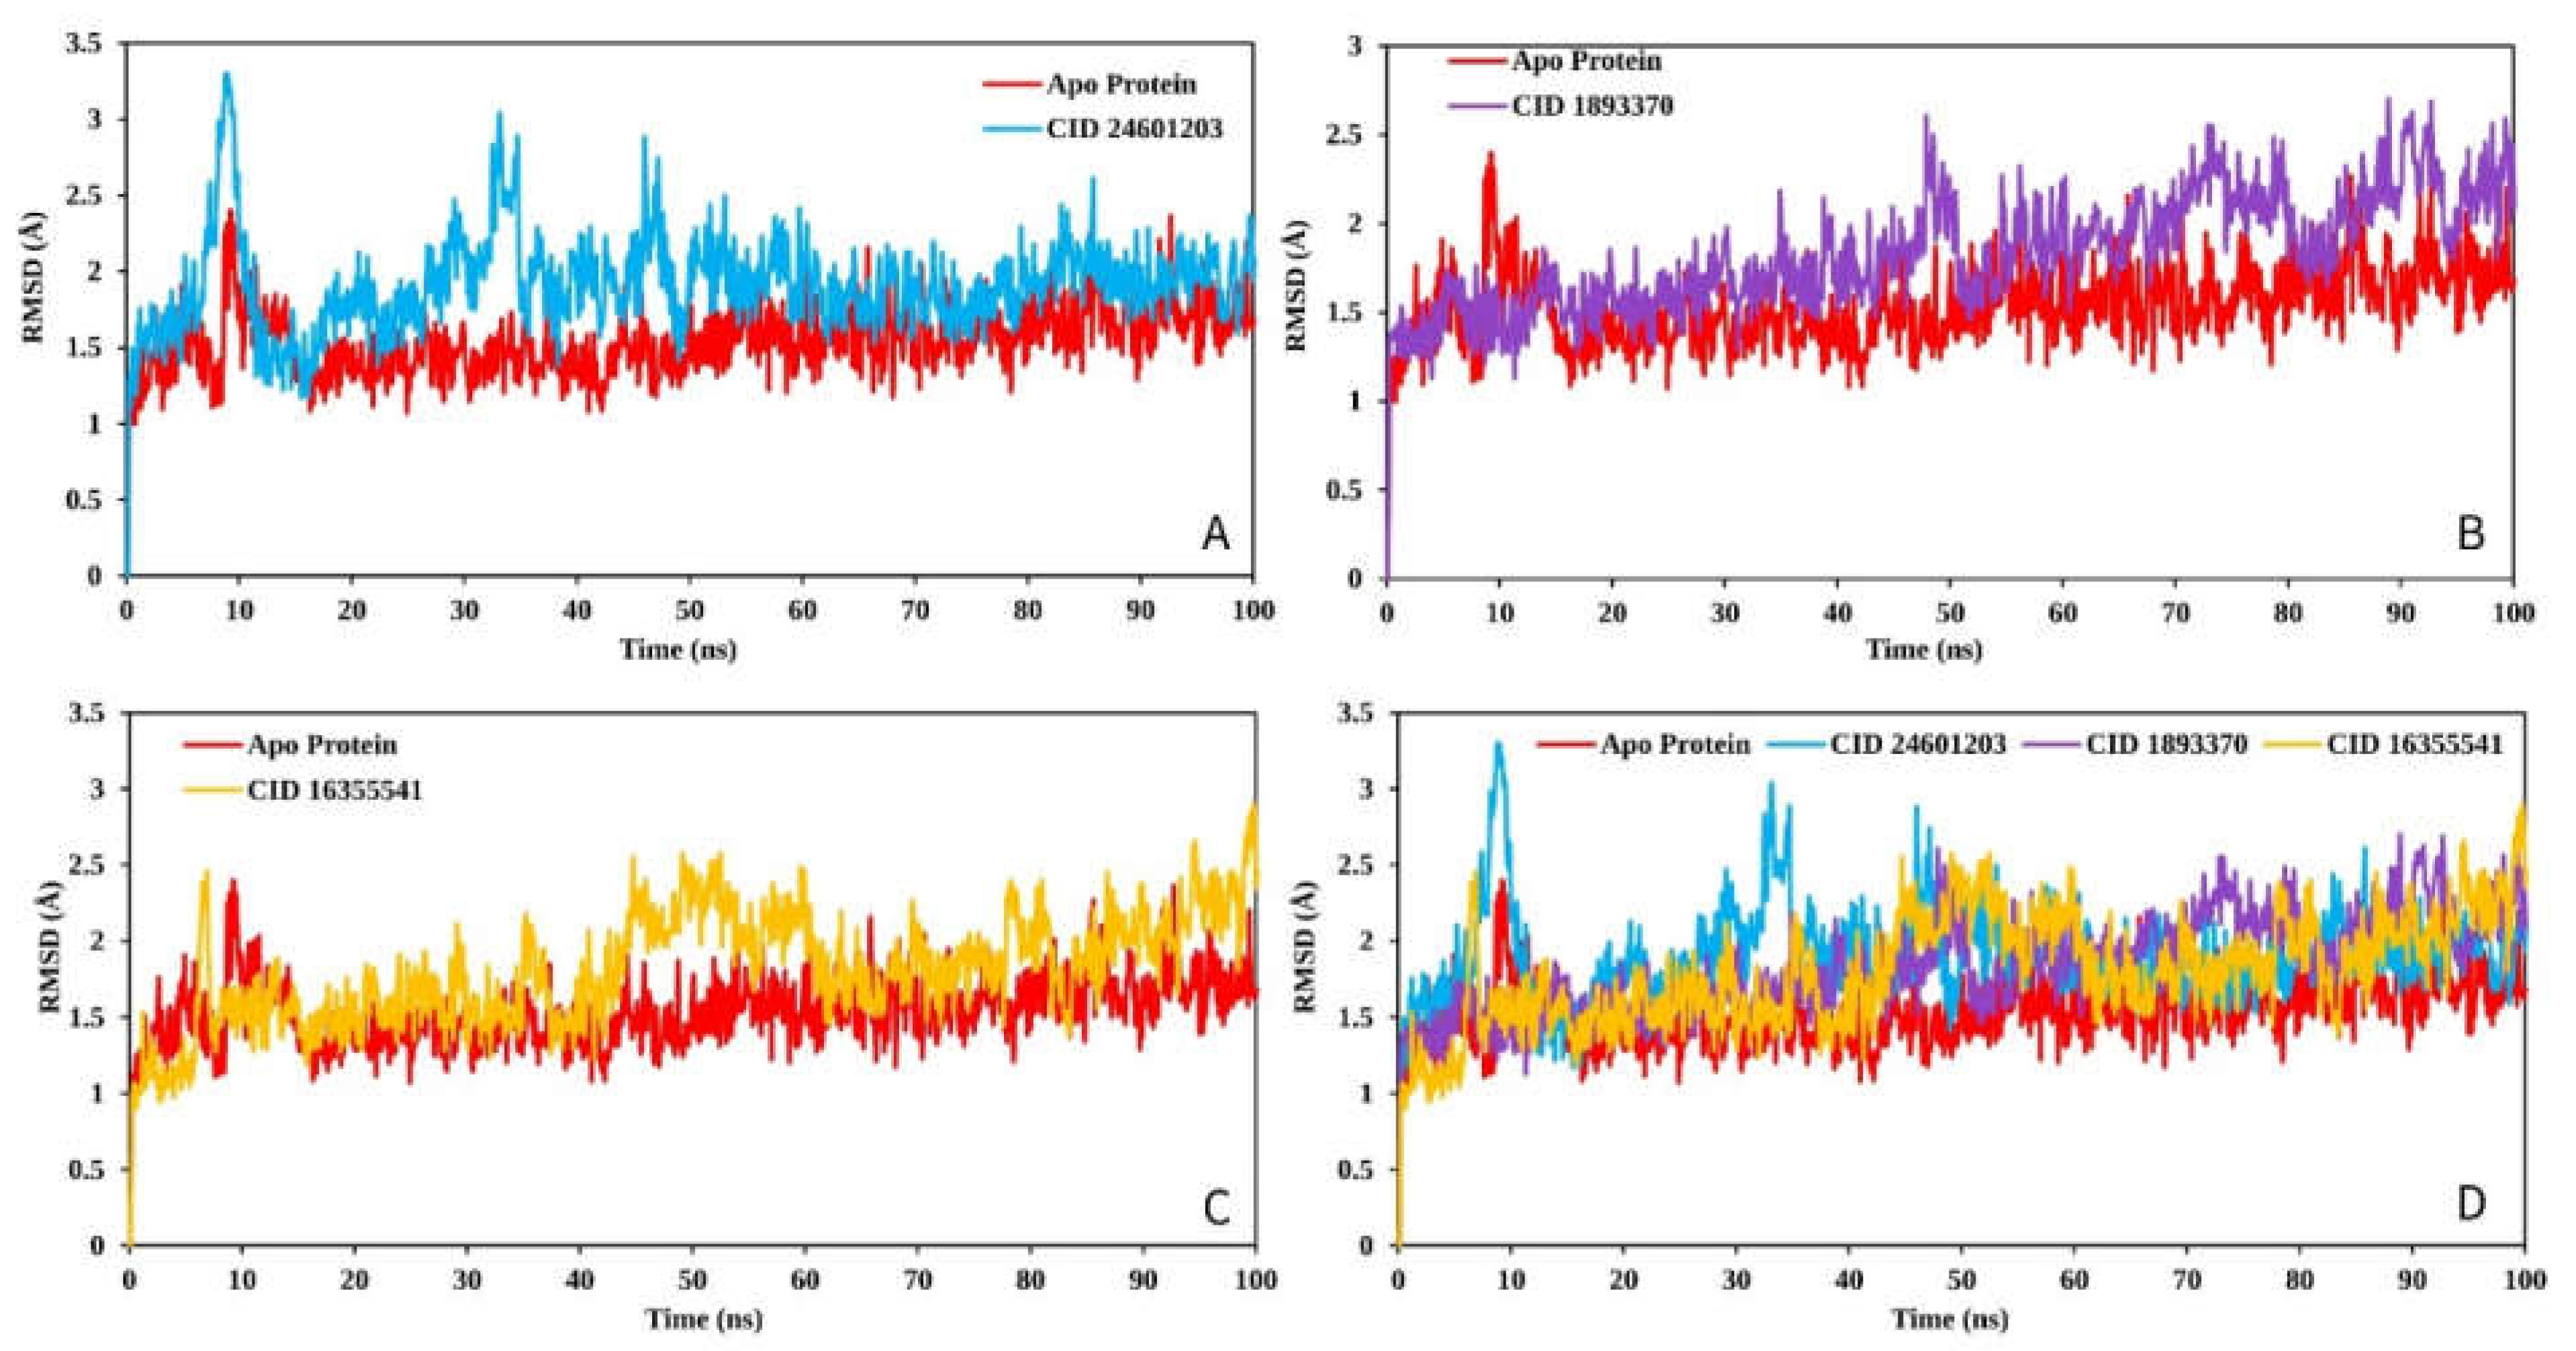
2.9.1. RMSD Analysis
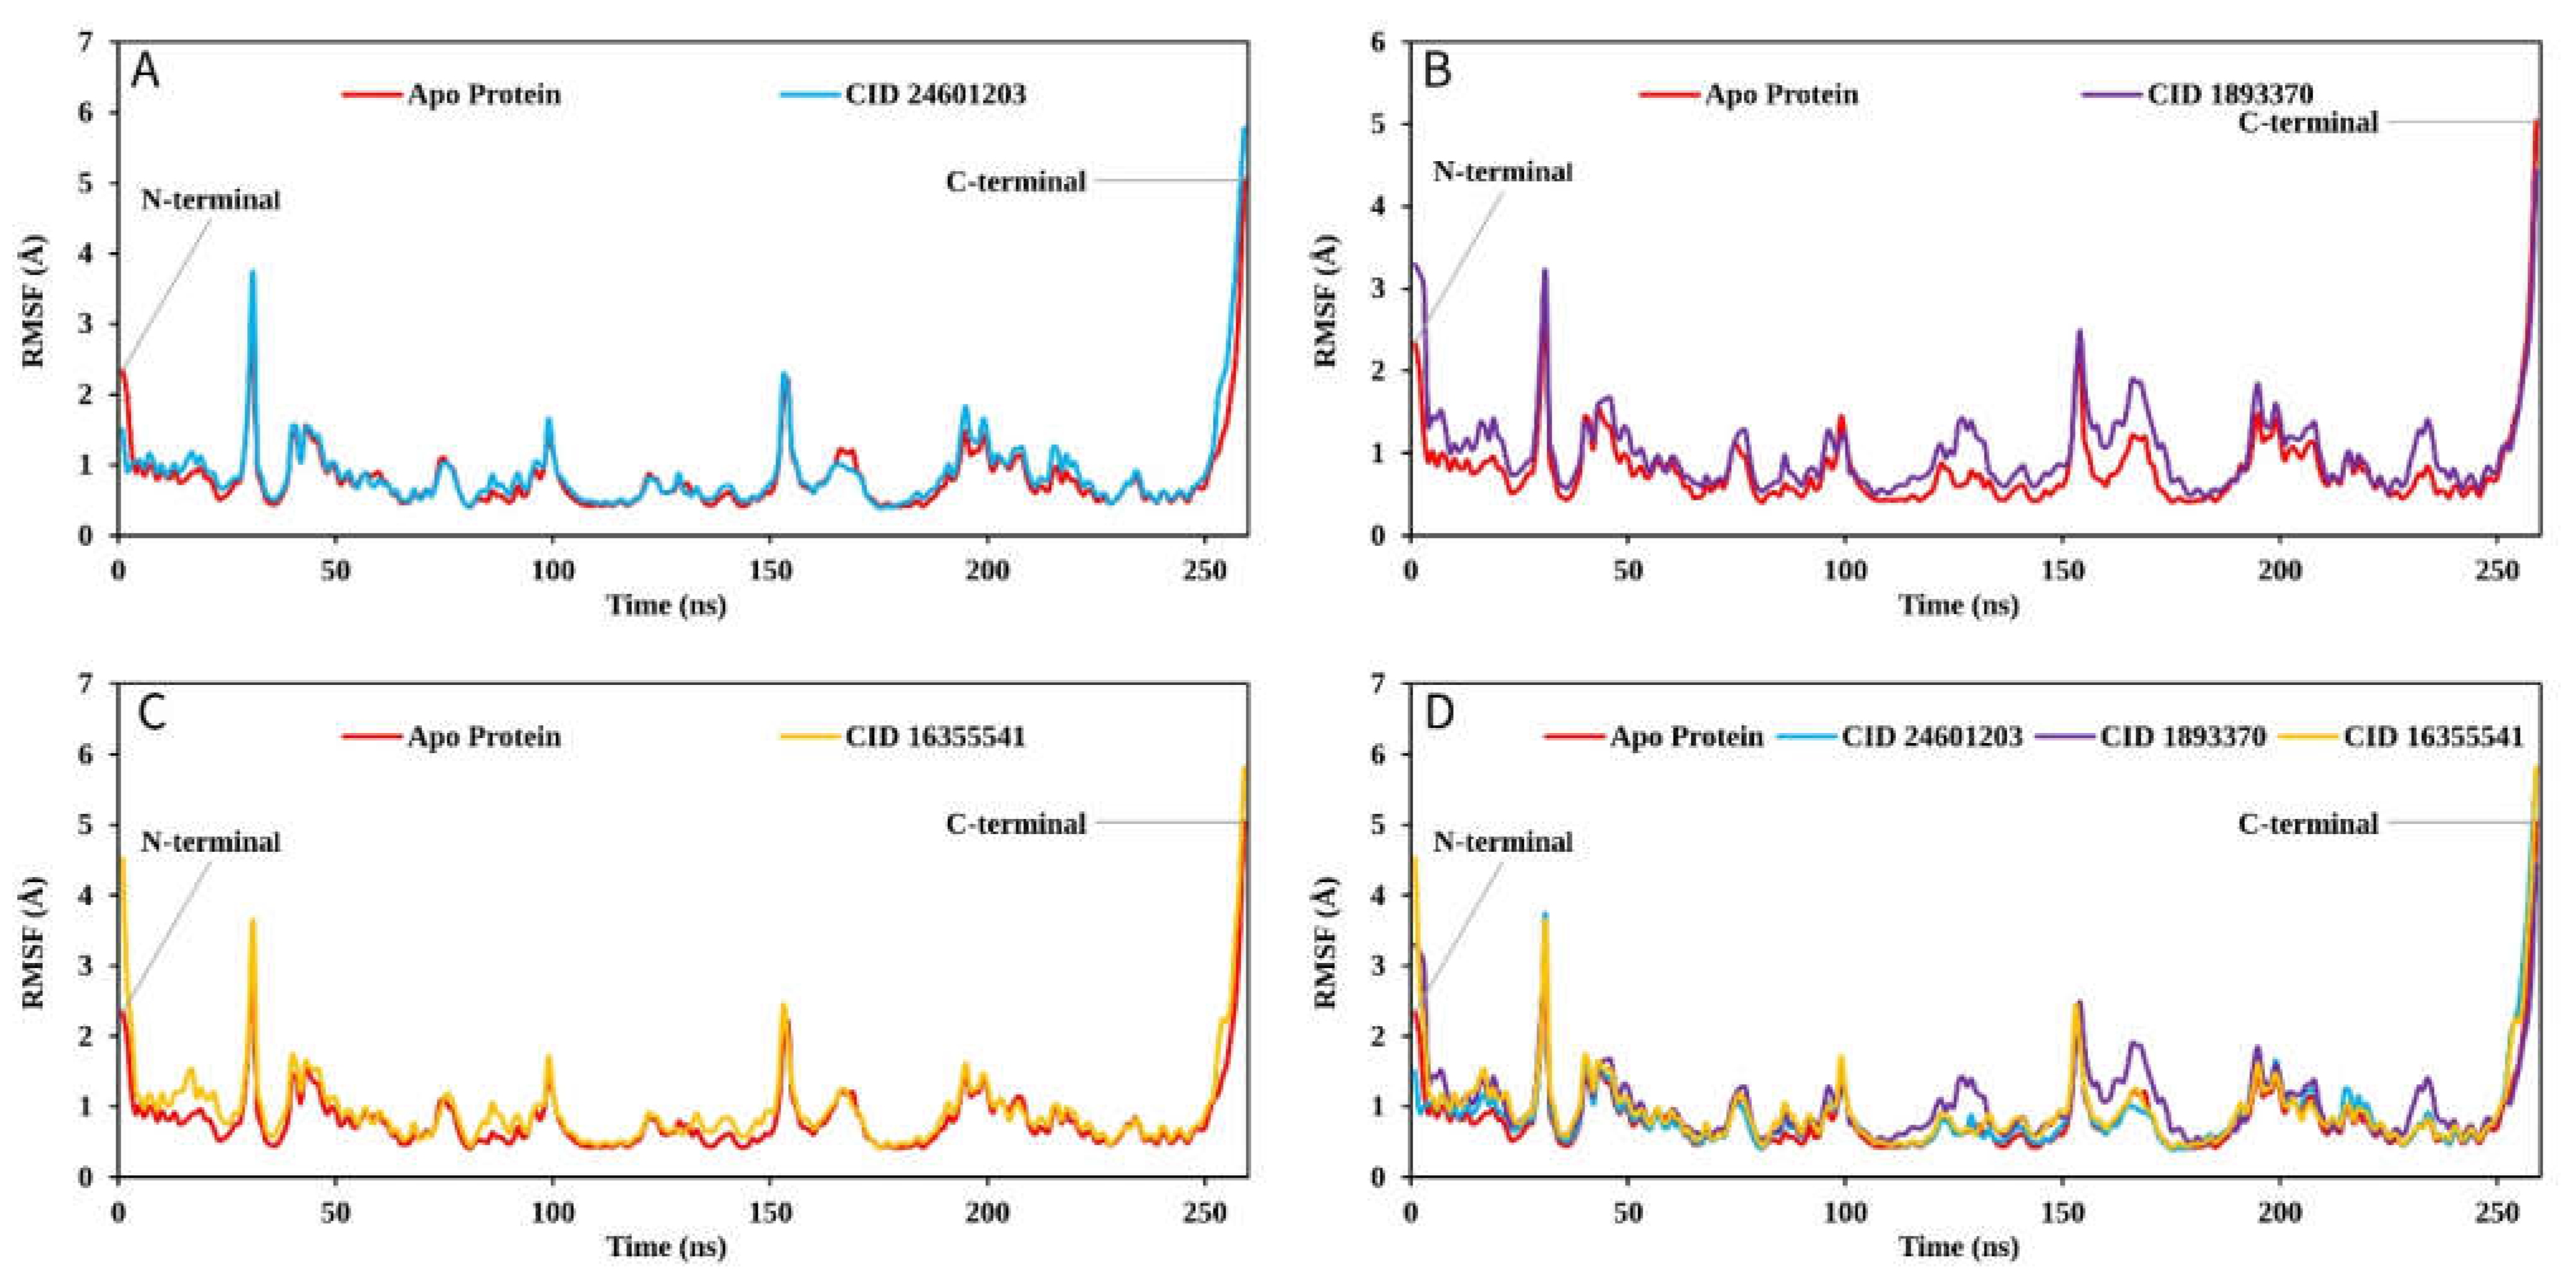
2.9.2. RMSF Analysis
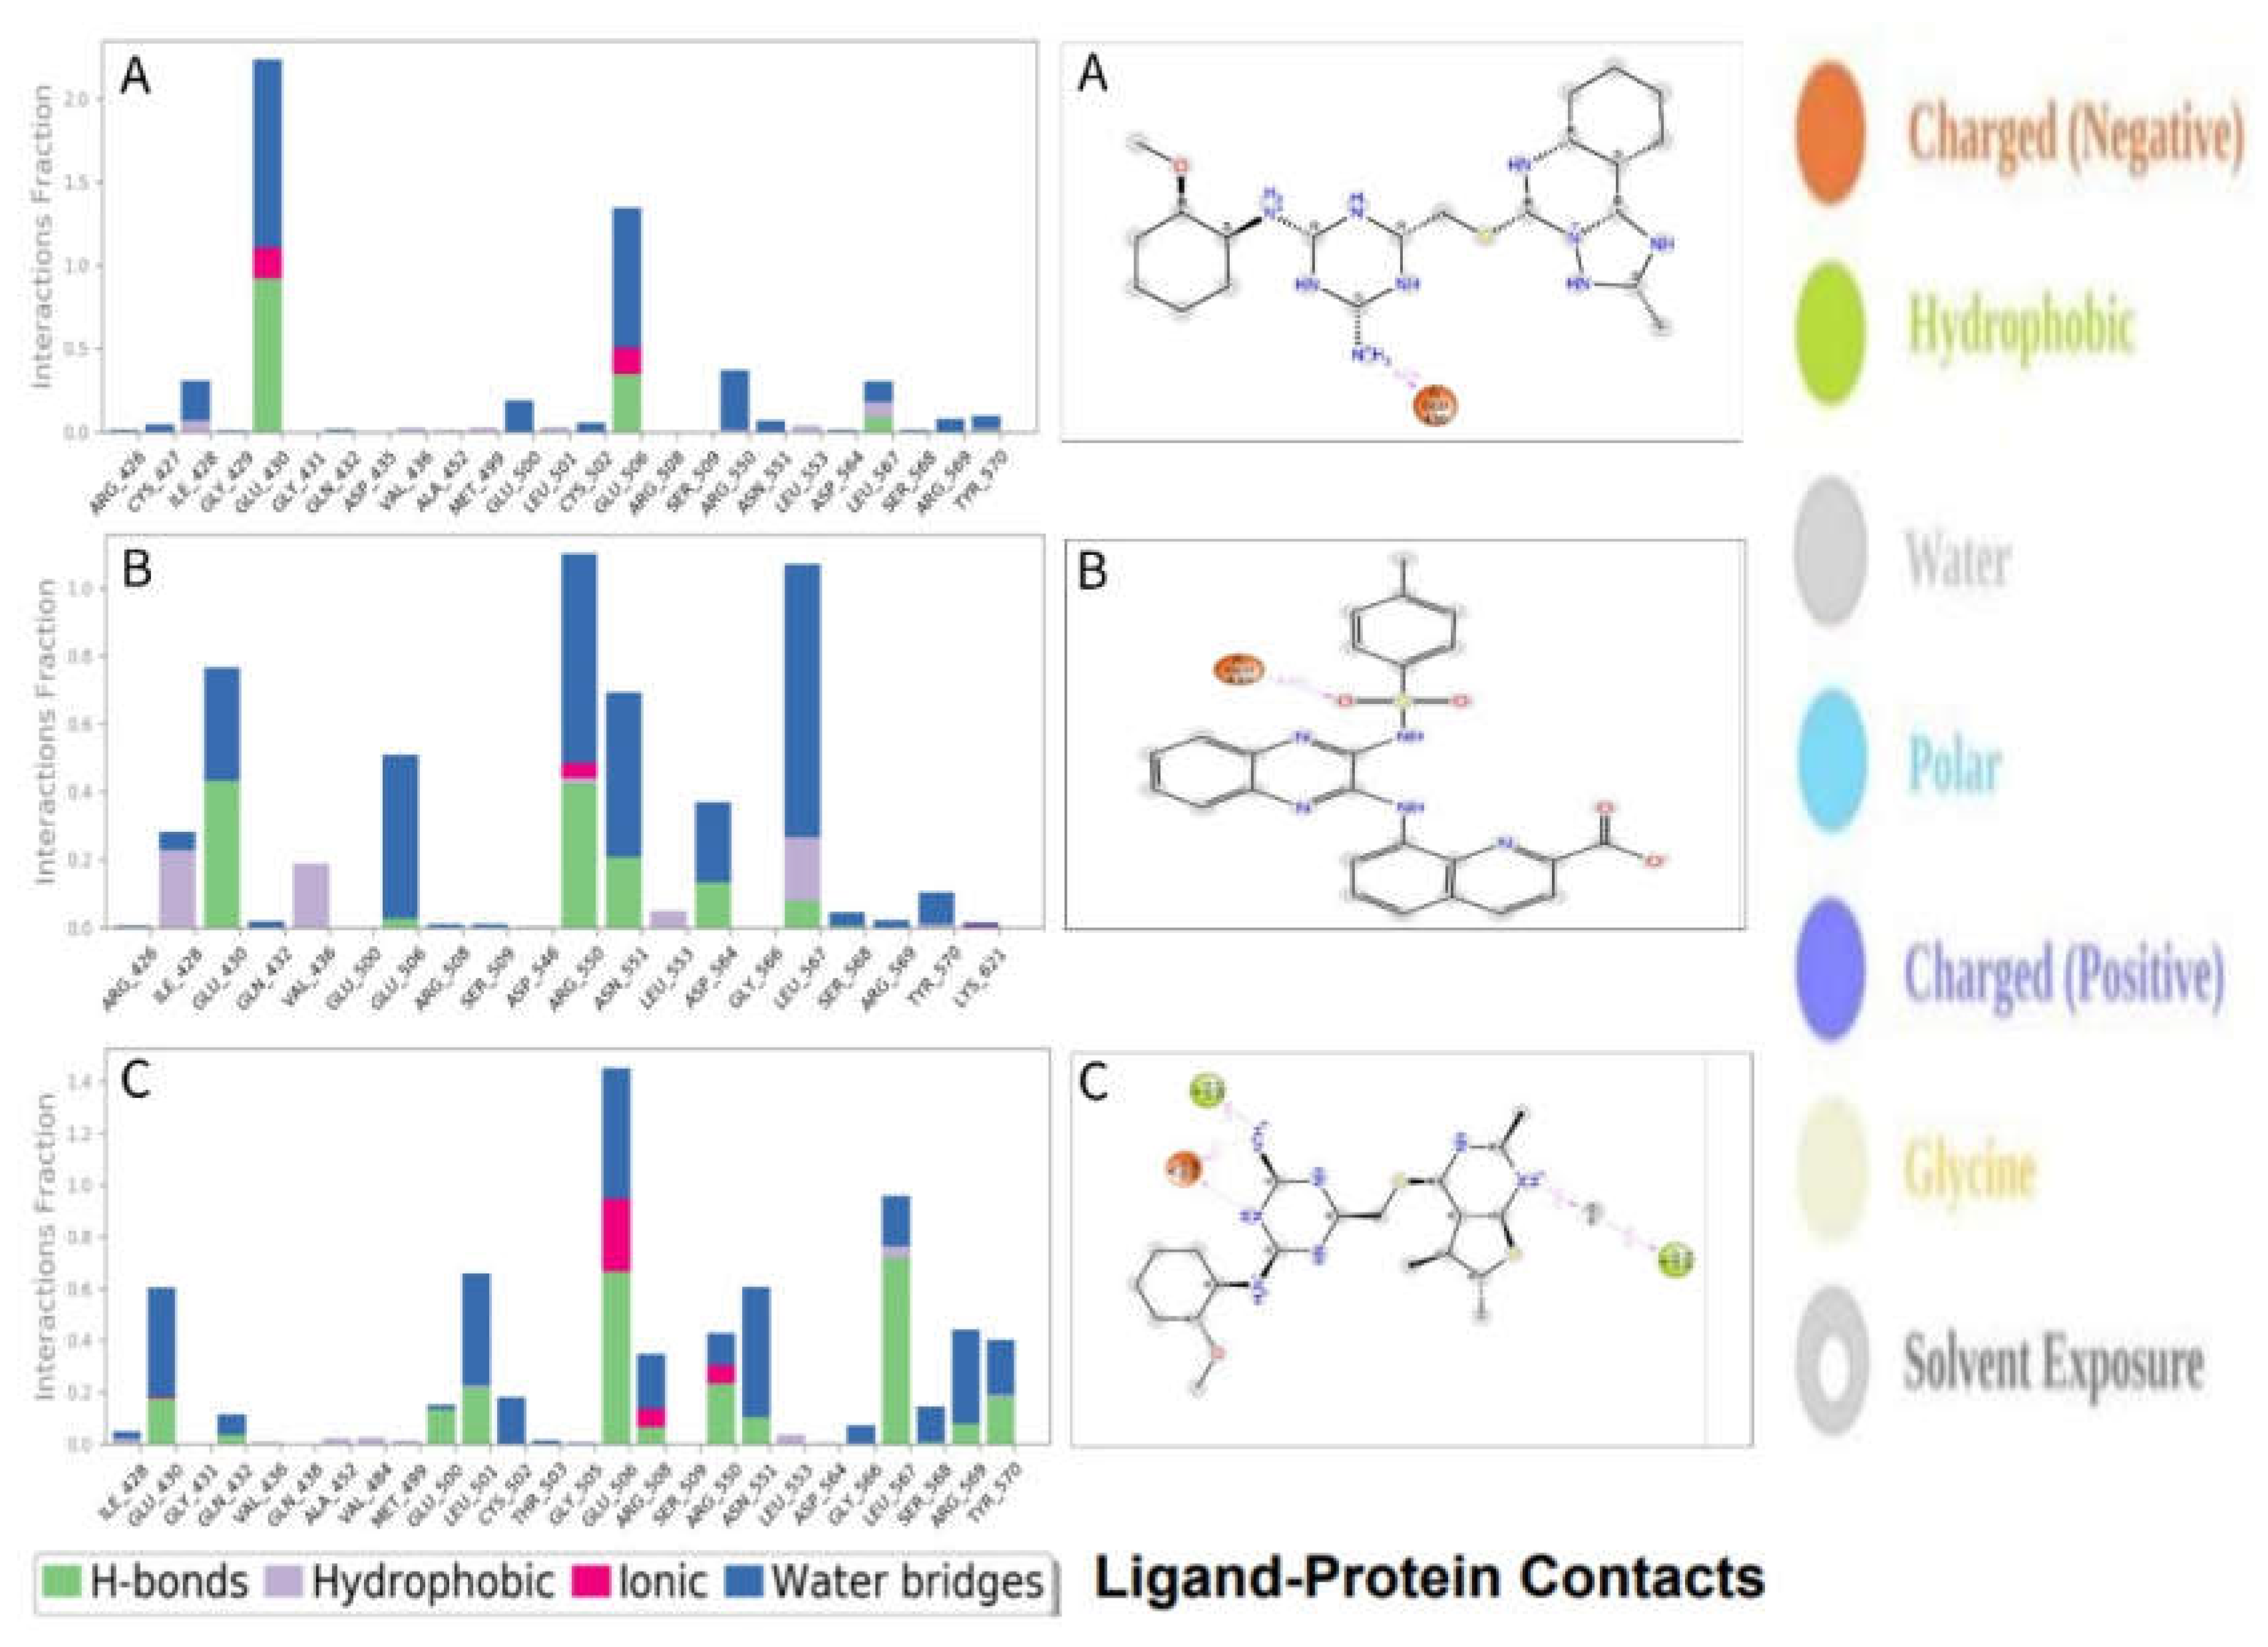
2.9.3. Protein–Ligand Contacts
2.9.4. MM-GBSA Analysis
3. Discussion
4. Materials and Methods
4.1. Ligand-Based Pharmacophore Modeling and Virtual Screening
4.1.1. Ligand-Based Pharmacophore Modeling
4.1.2. Pharmacophore Model Validation
4.1.3. Dataset Generation for Pharmacophore-Base Screening
4.1.4. Pharmacophore-Based Virtual Screening
4.2. Molecular Docking Based Virtual Screening
4.2.1. Active Site Identification and Grid Generation
4.2.2. Molecular Docking
4.3. Absorption, Distribution, Metabolism and Excretion (ADME) and Toxicity Test
4.3.1. Absorption, Distribution, Metabolism and Excretion (ADME)
4.3.2. Toxicity Test
4.4. Molecular Dynamics (MD) Simulation
Simulation Trajectory Analysis
4.5. RMSD Analysis
4.6. RMSF Analysis
4.7. MM-GBSA Analysis
5. Conclusions
Supplementary Materials
Author Contributions
Funding
Data Availability Statement
Acknowledgments
Conflicts of Interest
References
- Rawla, P.; Sunkara, T.; Gaduputi, V. Epidemiology of Pancreatic Cancer: Global Trends, Etiology and Risk Factors. World J. Oncol. 2019, 10, 10–27. [Google Scholar] [CrossRef] [PubMed]
- Vareedayah, A.A.; Alkaade, S.; Taylor, J.R. Pancreatic Adenocarcinoma. Mo. Med. 2018, 115, 230–235. [Google Scholar] [PubMed]
- Whitcomb, D.C. Genetic Risk Factors for Pancreatic Disorders. Gastroenterology 2013, 144, 1292–1302. [Google Scholar] [CrossRef]
- Bansa, V.S.; Raja, C.P.; Venkataraman, K.; Vijayalakshmi, M.A. Genes Involved in Pancreatic Islet Cell Rejuvenation. Indian J. Med. Res. 2013, 137, 695–703. [Google Scholar]
- Dasari, S.; Bernard Tchounwou, P. Cisplatin in Cancer Therapy: Molecular Mechanisms of Action. Eur. J. Pharmacol. 2014, 740, 364–378. [Google Scholar] [CrossRef]
- Makhoba, X.H.; Viegas, C.; Mosa, R.A.; Viegas, F.P.D.; Pooe, O.J. Potential Impact of the Multi-Target Drug Approach in the Treatment of Some Complex Diseases. Drug Des. Devel. Ther. 2020, 14, 3235–3249. [Google Scholar] [CrossRef]
- Murphy, J.M.; Rodriguez, Y.A.R.; Jeong, K.; Ahn, E.Y.E.; Lim, S.T.S. Targeting Focal Adhesion Kinase in Cancer Cells and the Tumor Microenvironment. Exp. Mol. Med. 2020, 52, 877–886. [Google Scholar] [CrossRef]
- Wu, Y.; Li, N.; Ye, C.; Jiang, X.; Luo, H.; Zhang, B.; Zhang, Y.; Zhang, Q. Focal Adhesion Kinase Inhibitors, a Heavy Punch to Cancer. Discov. Oncol. 2021, 12, 1–15. [Google Scholar] [CrossRef]
- Marlowe, T.; Dementiev, A.; Figel, S.; Rivera, A.; Flavin, M.; Cance, W. High Resolution Crystal Structure of the FAK FERM Domain Reveals New Insights on the Druggability of Tyrosine 397 and the Src SH3 Binding Site. BMC Mol. Cell Biol. 2019, 20, 10. [Google Scholar] [CrossRef]
- Kanchanawong, P.; Shtengel, G.; Pasapera, A.M.; Ramko, E.B.; Davidson, M.W.; Hess, H.F.; Waterman, C.M. Nanoscale Architecture of Integrin-Based Cell Adhesions. Nature 2010, 468, 580–584. [Google Scholar] [CrossRef]
- Yoon, H.; Dehart, J.P.; Murphy, J.M.; Lim, S.T.S. Understanding the Roles of FAK in Cancer: Inhibitors, Genetic Models, and New Insights. J. Histochem. Cytochem. 2015, 63, 114–128. [Google Scholar] [CrossRef] [PubMed]
- Murphy, K.J.; Zhu, J.; Trpceski, M.; Pereira, B.A.; Timpson, P.; Herrmann, D. Focal Adhesion Kinase Priming in Pancreatic Cancer, Altering Biomechanics to Improve Chemotherapy. Biochem. Soc. Trans. 2022, 50, 1129–1141. [Google Scholar] [CrossRef] [PubMed]
- Sulzmaier, F.J.; Jean, C.; Schlaepfer, D.D. FAK in Cancer: Mechanistic Findings and Clinical Applications. Nat. Rev. Cancer 2014, 14, 598–610. [Google Scholar] [CrossRef] [PubMed]
- Lim, S.T.; Chen, X.L.; Lim, Y.; Hanson, D.A.; Vo, T.T.; Howerton, K.; Larocque, N.; Fisher, S.J.; Schlaepfer, D.D.; Ilic, D. Nuclear FAK Promotes Cell Proliferation and Survival through FERM-Enhanced P53 Degradation. Mol. Cell 2008, 29, 9–22. [Google Scholar] [CrossRef] [PubMed]
- Provenzano, P.P.; Keely, P.J. The Role of Focal Adhesion Kinase in Tumor Initiation and Progression. Cell Adh. Migr. 2009, 3, 347–350. [Google Scholar] [CrossRef]
- Aljahdali, M.O.; Molla, M.H.R.; Ahammad, F. Compounds Identified from Marine Mangrove Plant (Avicennia Alba) as Potential Antiviral Drug Candidates against WDSV, an In-Silico Approach. Mar. Drugs 2021, 19, 253. [Google Scholar] [CrossRef]
- Molla, M.H.R.; Aljahdali, M.O. Identification of Phytochemical Compounds to Inhibit the Matrix-like Linker Protein VP26 to Block the Assembles of White Spot Syndrome Virus (WSSV) Envelope and Nucleocapsid Protein of Marine Shrimp: In Silico Approach. J. King Saud Univ. Sci. 2022, 102346. [Google Scholar] [CrossRef]
- Noureddine, O.; Gatfaoui, S.; Brandán, S.A.; Marouani, H.; Issaoui, N. Structural, Docking and Spectroscopic Studies of a New Piperazine Derivative, 1-Phenylpiperazine-1,4-Diium Bis(Hydrogen Sulfate). J. Mol. Struct. 2020, 1202, 127351. [Google Scholar] [CrossRef]
- Ramalingam, A.; Mustafa, N.; Chng, W.J.; Medimagh, M.; Sambandam, S.; Issaoui, N. 3-Chloro-3-Methyl-2,6-Diarylpiperidin-4-Ones as Anti-Cancer Agents: Synthesis, Biological Evaluation, Molecular Docking, and In Silico ADMET Prediction. Biomolecules 2022, 12, 1093. [Google Scholar] [CrossRef]
- Lambert, A.; Schwarz, L.; Ducreux, M.; Conroy, T. Neoadjuvant Treatment Strategies in Resectable Pancreatic Cancer. Cancers 2021, 13, 4724. [Google Scholar] [CrossRef]
- Benet, L.Z.; Hosey, C.M.; Ursu, O.; Oprea, T.I. BDDCS, the Rule of 5 and Drugability. Adv. Drug Deliv. Rev. 2016, 101, 89. [Google Scholar] [CrossRef] [PubMed]
- Hasan, M.R.; Alsaiari, A.A.; Fakhurji, B.Z.; Molla, M.H.R.; Asseri, A.H.; Sumon, M.A.A.; Park, M.N.; Ahammad, F.; Kim, B. Application of Mathematical Modeling and Computational Tools in the Modern Drug Design and Development Process. Molecules 2022, 27, 4169. [Google Scholar] [CrossRef]
- Aljahdali, M.O.; Habibur, M.; Molla, R.; Ahammad, F. Immunoinformatics and Computer-Aided Drug Design as New Approaches against Emerging and Re-Emerging Infectious Diseases. Antivir. Drugs 2022. [Google Scholar] [CrossRef]
- Opo, F.A.D.M.; Alkarim, S.; Alrefaei, G.I.; Molla, M.H.R.; Alsubhi, N.H.; Alzahrani, F.; Ahammad, F. Pharmacophore-Model-Based Virtual-Screening Approaches Identified Novel Natural Molecular Candidates for Treating Human Neuroblastoma. Curr. Issues Mol. Biol. 2022, 44, 4838–4858. [Google Scholar] [CrossRef]
- Islam, M.R.; Awal, M.A.; Khames, A.; Abourehab, M.A.S.; Samad, A.; Hassan, W.M.I.; Alam, R.; Osman, O.I.; Nur, S.M.; Molla, M.H.R.; et al. Computational Identification of Druggable Bioactive Compounds from Catharanthus Roseus and Avicennia Marina against Colorectal Cancer by Targeting Thymidylate Synthase. Molecules 2022, 27, 2089. [Google Scholar] [CrossRef]
- Samad, A.; Haque, F.; Nain, Z.; Alam, R.; Al Noman, M.A.; Rahman Molla, M.H.; Hossen, M.S.; Islam, M.R.; Khan, M.I.; Ahammad, F. Computational Assessment of MCM2 Transcriptional Expression and Identification of the Prognostic Biomarker for Human Breast Cancer. Heliyon 2020, 6, e05087. [Google Scholar] [CrossRef]
- Aljahdali, M.O.; Habibur, M.; Molla, R.; Filfilan, W.M.; Nguyen, H.; Zenger, K. Whole Genome Sequence of the Newly Prescribed Subspecies Oreochromis Spilurus Saudii: A Valuable Genetic Resource for Aquaculture in Saudi Arabia. J. Mar. Sci. Eng. 2021, 9, 506. [Google Scholar] [CrossRef]
- Opo, F.A.D.M.; Rahman, M.M.; Ahammad, F.; Ahmed, I.; Bhuiyan, M.A.; Asiri, A.M. Structure Based Pharmacophore Modeling, Virtual Screening, Molecular Docking and ADMET Approaches for Identification of Natural Anti-Cancer Agents Targeting XIAP Protein. Sci. Rep. 2021, 11, 1–17. [Google Scholar] [CrossRef]
- Forli, S.; Huey, R.; Pique, M.E.; Sanner, M.; Goodsell, D.S.; Olson, A.J. Computational Protein-Ligand Docking and Virtual Drug Screening with the AutoDock Suite. Nat. Protoc. 2016, 11, 905. [Google Scholar] [CrossRef]
- Bouback, T.A.; Pokhrel, S.; Albeshri, A.; Aljohani, A.M.; Samad, A.; Alam, R.; Hossen, M.S.; Al-Ghamdi, K.; Talukder, M.E.K.; Ahammad, F.; et al. Pharmacophore-Based Virtual Screening, Quantum Mechanics Calculations, and Molecular Dynamics Simulation Approaches Identified Potential Natural Antiviral Drug Candidates against MERS-CoV S1-NTD. Molecules 2021, 26, 4961. [Google Scholar] [CrossRef]
- Molla, M.H.R.; Hasan, M.T.; Jang, W.J.; Soria Diaz, C.D.; Appenteng, P.; Marufchoni, H.; Jahan, B.; Brown, C.L. Thyroid Hormone-Induced Swim Bladder and Eye Maturation Are Transduced by IGF-1 in Zebrafish Embryos. Aquac. Res. 2019, 50, 3462–3470. [Google Scholar] [CrossRef]
- Kovačević, S.Z.; Jevrić, L.R.; Podunavac Kuzmanović, S.O.; Lončar, E.S. Prediction of In-Silico ADME Properties of 1,2-O-Isopropylidene Aldohexose Derivatives. Iran. J. Pharm. Res. 2014, 13, 899. [Google Scholar] [PubMed]
- Kurosaki, K.; Wu, R.; Uesawa, Y. A Toxicity Prediction Tool for Potential Agonist/Antagonist Activities in Molecular Initiating Events Based on Chemical Structures. Int. J. Mol. Sci. 2020, 21, 7853. [Google Scholar] [CrossRef]
- Ahammad, F.; Alam, R.; Mahmud, R.; Akhter, S.; Talukder, E.K.; Tonmoy, A.M.; Fahim, S.; Al-Ghamdi, K.; Samad, A.; Qadri, I. Pharmacoinformatics and Molecular Dynamics Simulation-Based Phytochemical Screening of Neem Plant (Azadiractha Indica) against Human Cancer by Targeting MCM7 Protein. Brief. Bioinform. 2021, 22, bbab098. [Google Scholar] [CrossRef]


| PubChem ID | IC50 (nM) | Chemical Name | Chemical Formula | Chemical Structure | Binding Affinity |
|---|---|---|---|---|---|
| 58522531 | 6 | BDBM134122 | C27H25F4N5O5 |  | −9.0 |
| 58522578 | 1 | BDBM134151 | C27H25F4N5O5 |  | −8.7 |
| 58522559 | 1 | BDBM134145 | C28H30ClFN6O4 |  | −8.4 |
| 58522525 | 1 | BDBM134129 | C27H27Cl2FN6O4 |  | −8.0 |
| 58522543 | 6 | BDBM134017 | C28H27ClF3N5O4 |  | −8.0 |
| 58522647 | 1 | BDBM134167 | C29H33ClN6O5 |  | −7.9 |
| 58522593 | 4 | BDBM134002 | C27H25F4N5O5 |  | −7.7 |
| 58522523 | 4 | BDBM134035 | C30H31F5N6O4 |  | −7.6 |
| 58522553 | 1 | BDBM134115 | C28H29F3N6O5 |  | −7.5 |
| 58522562 | 1 | BDBM134134 | C29H31F3N6O4 |  | −7.5 |
| Pubchem ID | Compound Name | Molecular Formula | Molecular Weight | Chemical Structure | Docking Score |
|---|---|---|---|---|---|
| 24601203 | ZINC13230575 | C21H19N9OS | 445.5 |  | −10.4 |
| 1893370 | SCHEMBL1790903 | C25H19N5O4S | 485.5 |  | −10.1 |
| 16355541 | AKOS033282660 | C20H21N7OS2 | 439.6 |  | −9.7 |
| 16467343 | AKOS005409633 | C25H24ClN5O3 | 477.9 |  | −9.5 |
| PubChem CID | Residue | Distance | Category | Type |
|---|---|---|---|---|
| CID 24601203 | ASN551 | 2.77 | Hydrogen Bond | Conventional Hydrogen Bond |
| LEU567 | 2.39 | Hydrogen Bond | Conventional Hydrogen Bond | |
| GLU506 | 2.09 | Hydrogen Bond | Conventional Hydrogen Bond | |
| ARG550 | 3.37 | Hydrophobic | Carbon Hydrogen Bond | |
| ILE428 | 3.49 | Hydrophobic | Pi-Sigma | |
| LEU553 | 3.89 | Hydrophobic | Pi-Sigma | |
| LEU553 | 4.83 | Hydrophobic | Alkyl | |
| LEU567 | 4.29 | Hydrophobic | Alkyl | |
| VAL484 | 3.74 | Hydrophobic | Alkyl | |
| MET499 | 3.99 | Hydrophobic | Alkyl | |
| ALA452 | 4.39 | Hydrophobic | Pi-Alkyl | |
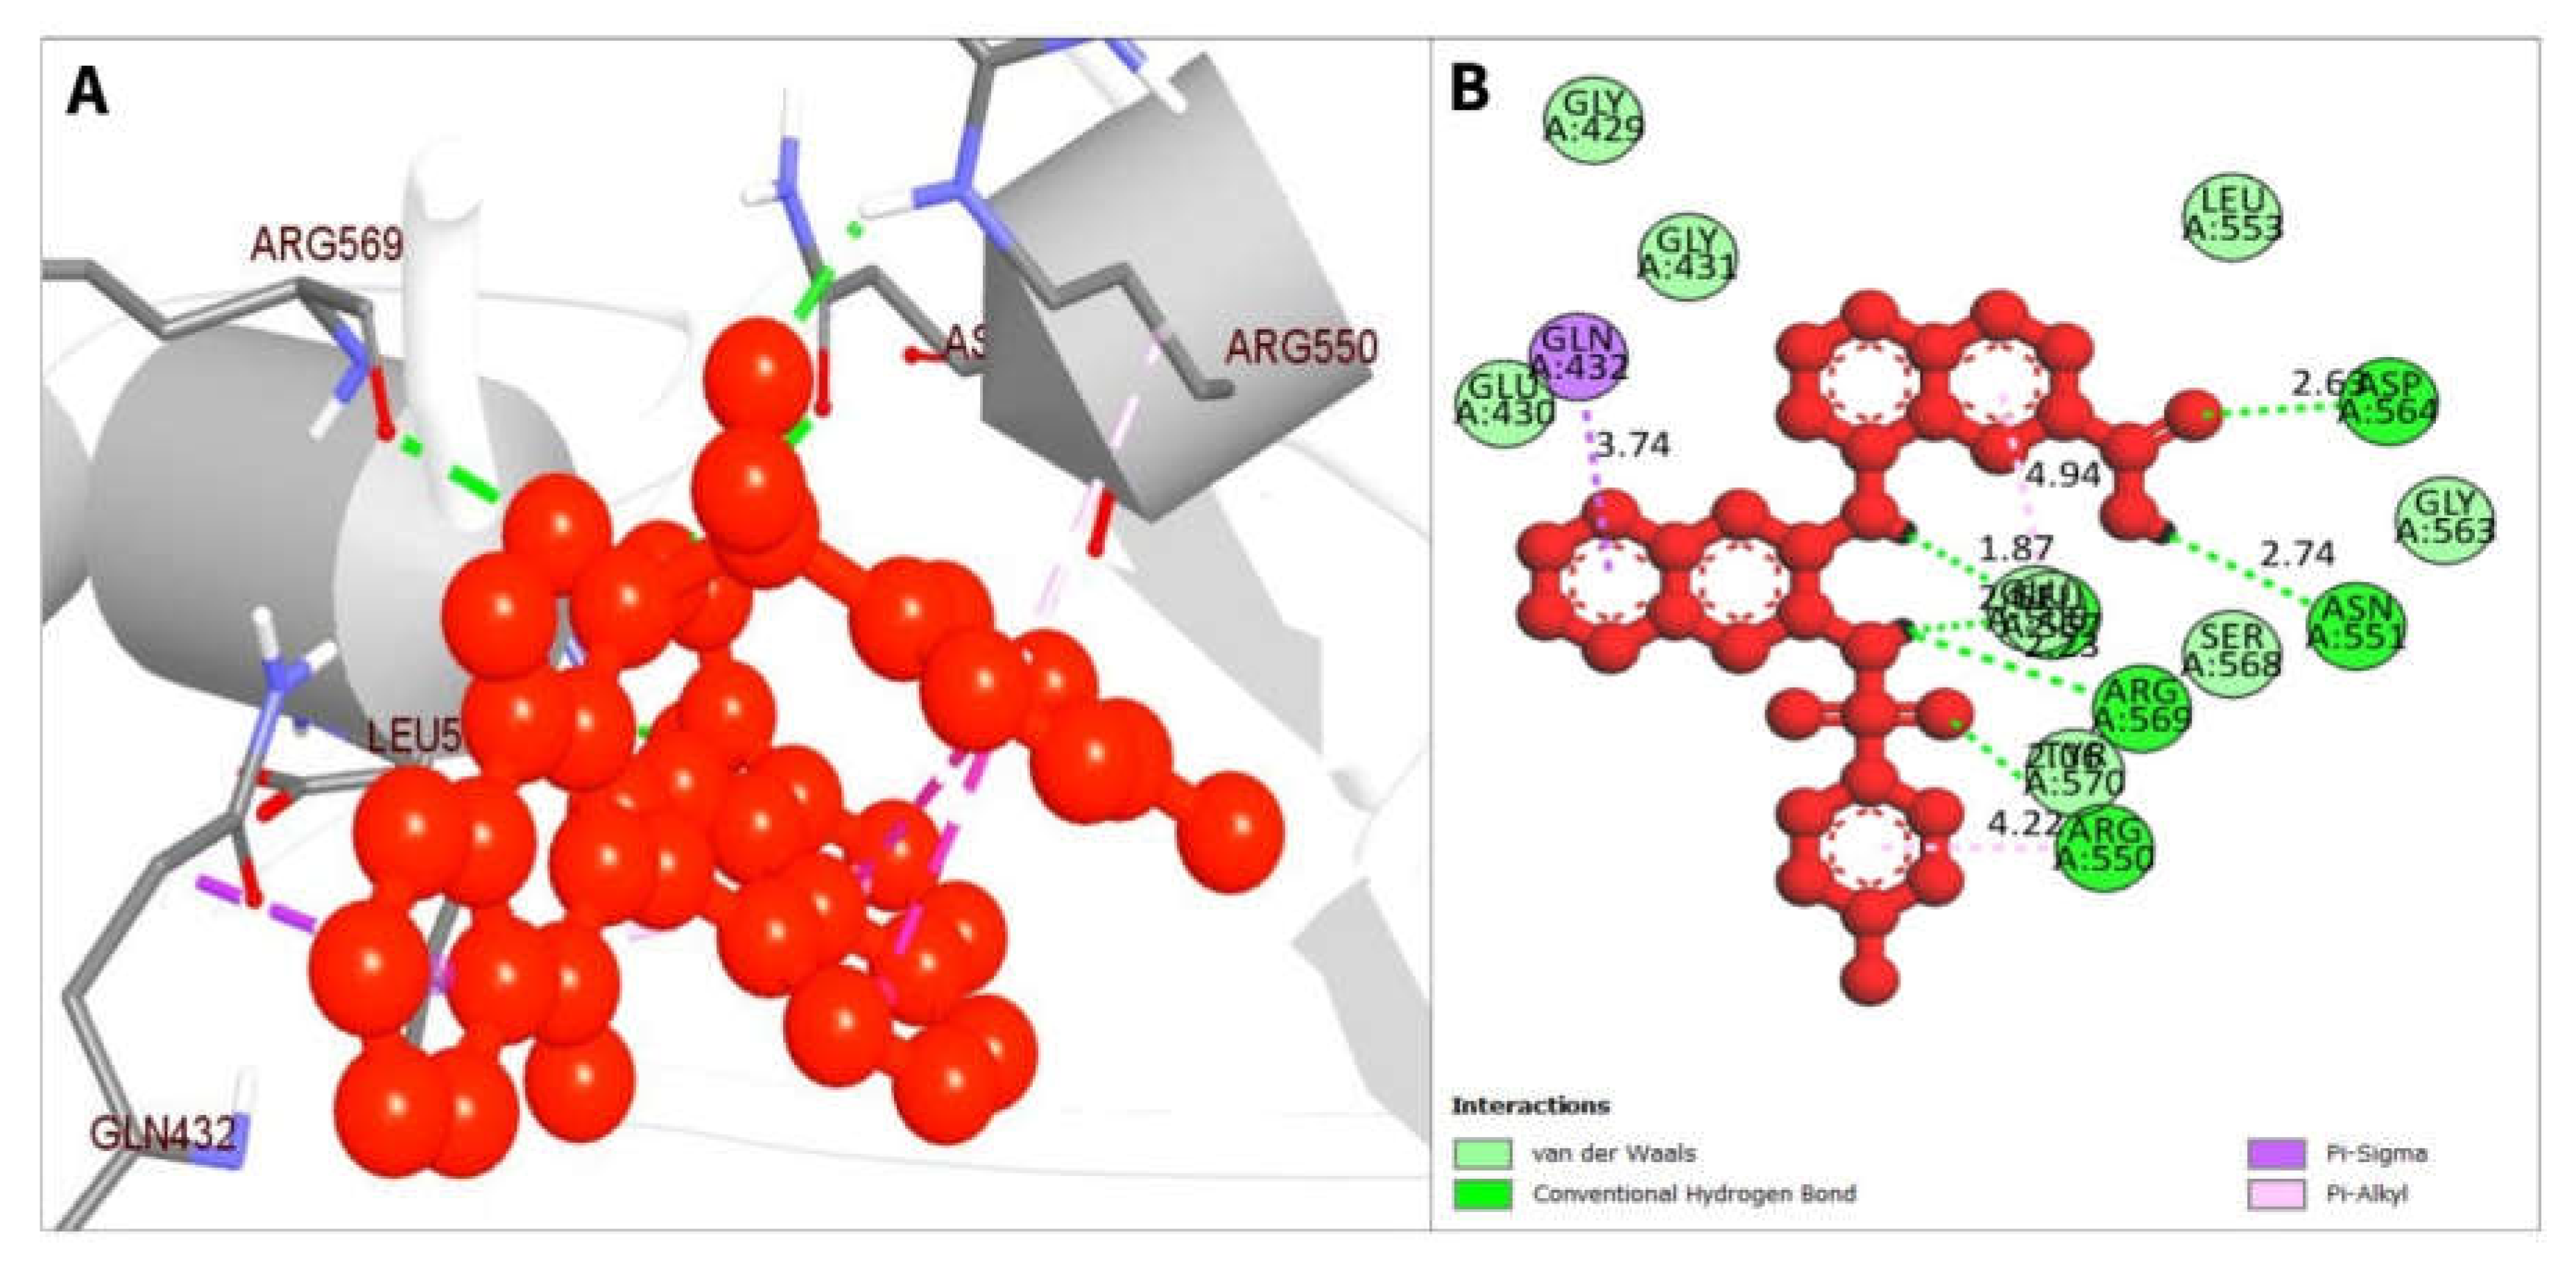
| CID 1893370 | ARG550 | 2.05798 | Hydrogen Bond | Conventional Hydrogen Bond |
| ASP564 | 2.63012 | Hydrogen Bond | Conventional Hydrogen Bond | |
| LEU567 | 1.869 | Hydrogen Bond | Conventional Hydrogen Bond | |
| ASN551 | 2.73854 | Hydrogen Bond | Conventional Hydrogen Bond | |
| LEU567 | 2.60894 | Hydrogen Bond | Conventional Hydrogen Bond | |
| ARG569 | 2.23097 | Hydrogen Bond | Conventional Hydrogen Bond | |
| GLN432 | 3.74021 | Hydrophobic | Pi-Sigma | |
| LEU567 | 4.93986 | Hydrophobic | Pi-Alkyl | |
| ARG550 | 4.22051 | Hydrophobic | Pi-Alkyl | |
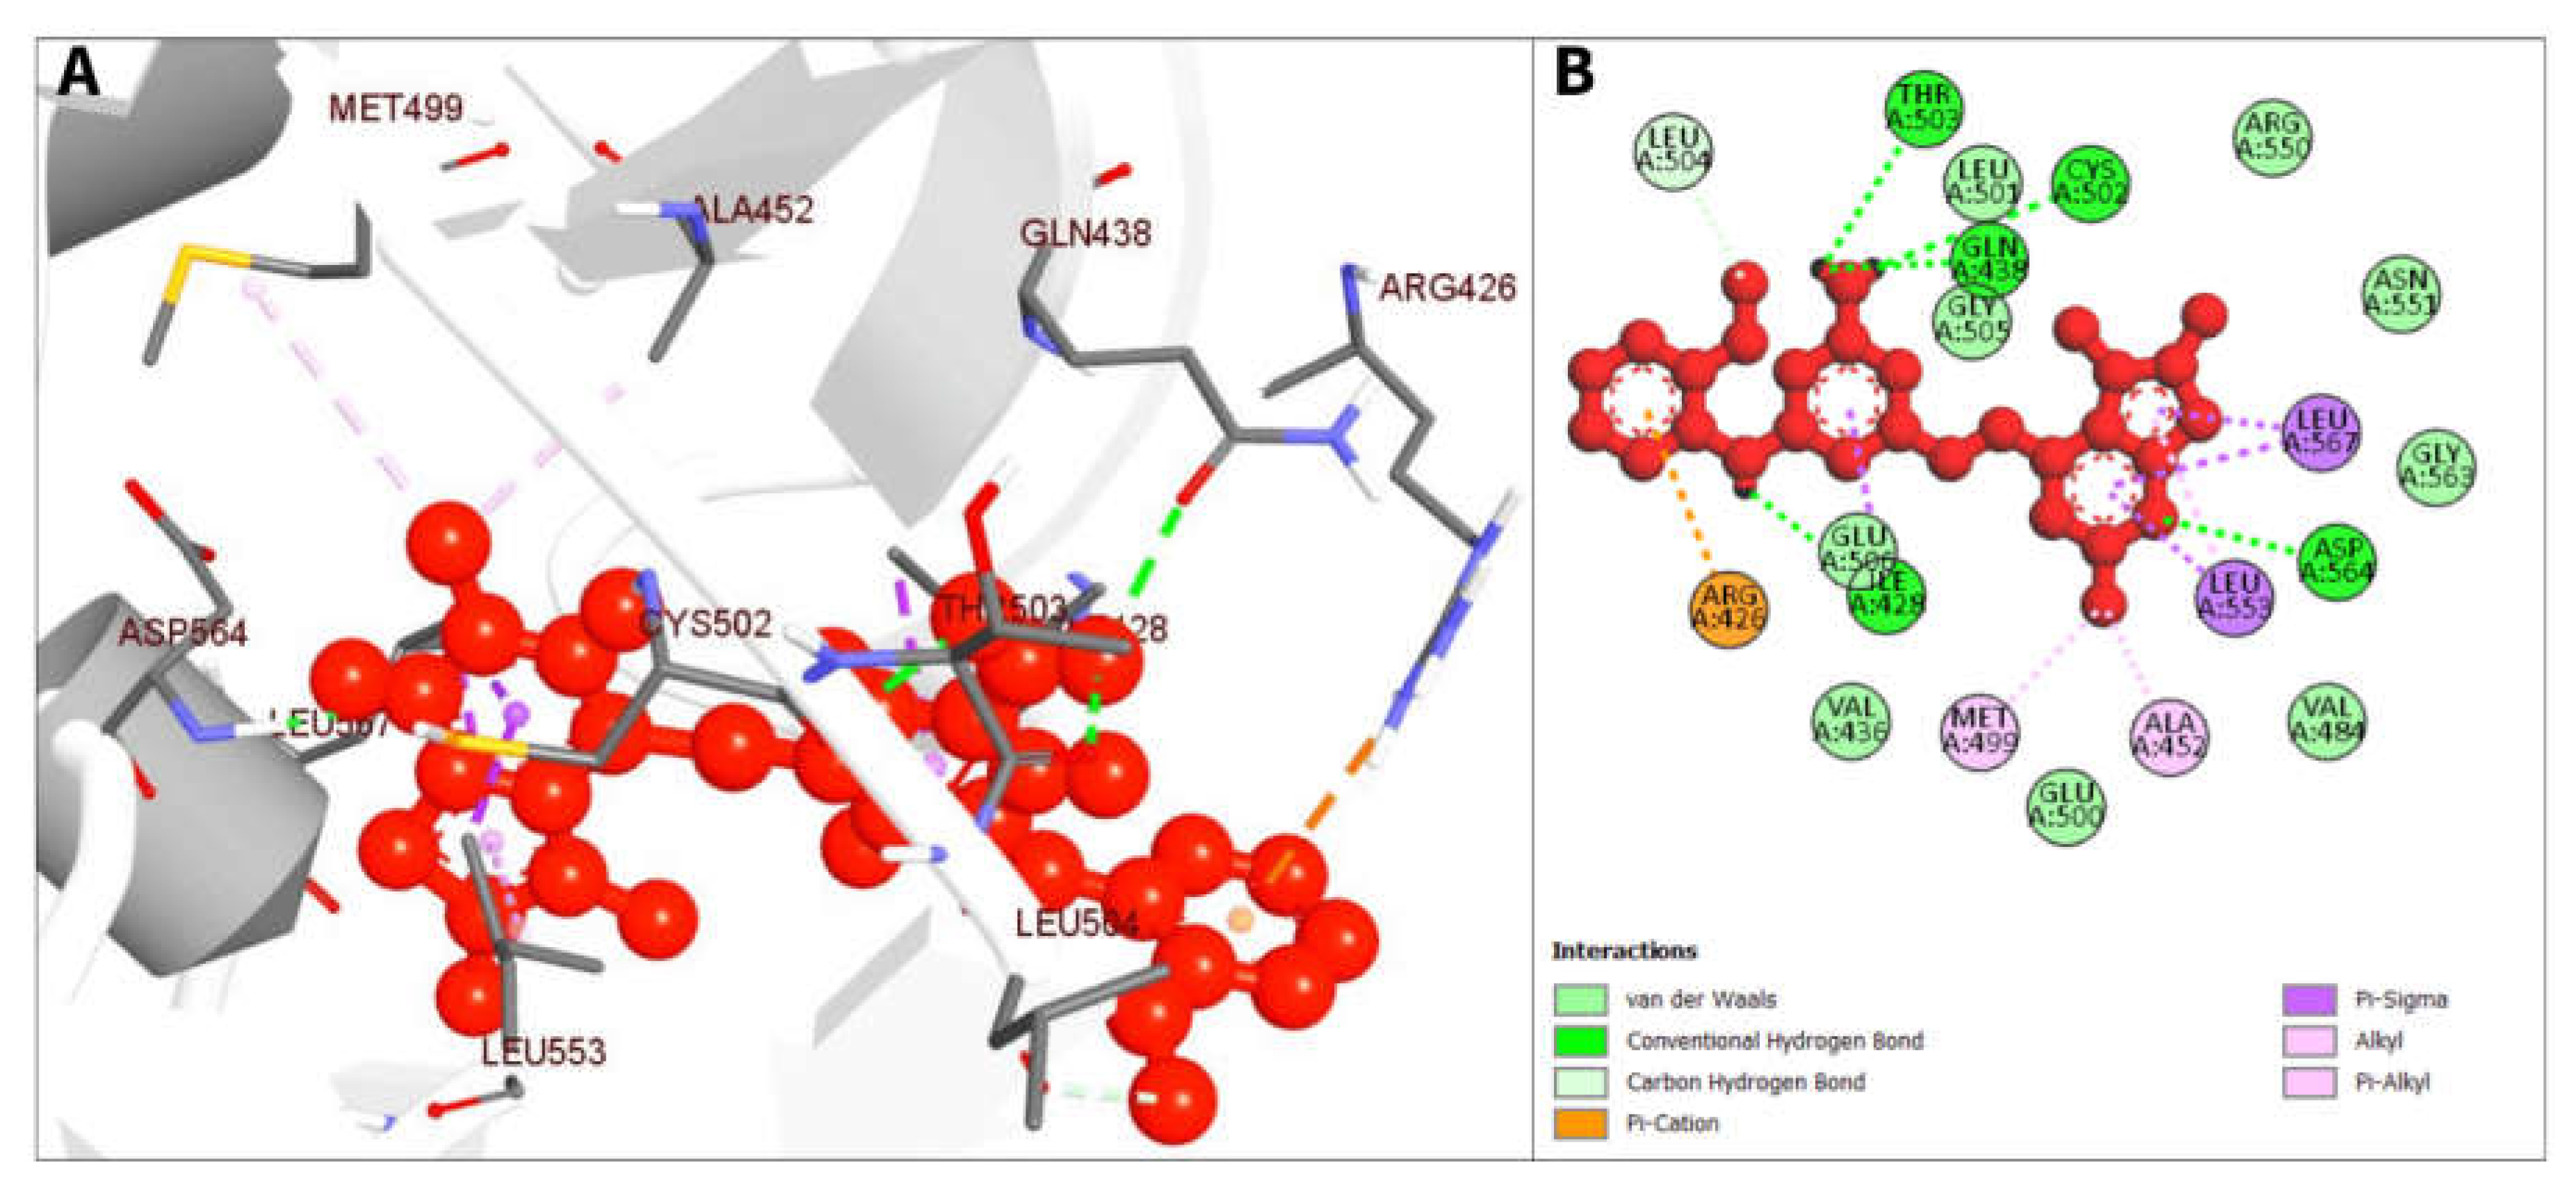
| CID 16355541 | ASP564 | 2.16221 | Hydrogen Bond | Conventional Hydrogen Bond |
| ILE428 | 2.76461 | Hydrogen Bond | Conventional Hydrogen Bond | |
| GLN438 | 2.68776 | Hydrogen Bond | Conventional Hydrogen Bond | |
| THR503 | 2.77995 | Hydrogen Bond | Conventional Hydrogen Bond | |
| CYS502 | 2.79357 | Hydrogen Bond | Conventional Hydrogen Bond | |
| LEU504 | 3.68955 | Hydrogen Bond | Carbon Hydrogen Bond | |
| ARG426 | 3.99237 | Electrostatic | Pi-Cation | |
| ILE428 | 3.62494 | Hydrophobic | Pi-Sigma | |
| LEU553 | 3.33756 | Hydrophobic | Pi-Sigma | |
| LEU567 | 3.706 | Hydrophobic | Pi-Sigma | |
| LEU567 | 3.90901 | Hydrophobic | Pi-Sigma | |
| ALA452 | 3.91212 | Hydrophobic | Alkyl | |
| MET499 | 4.54299 | Hydrophobic | Alkyl | |
| LEU553 | 4.57388 | Hydrophobic | Pi-Alkyl | |
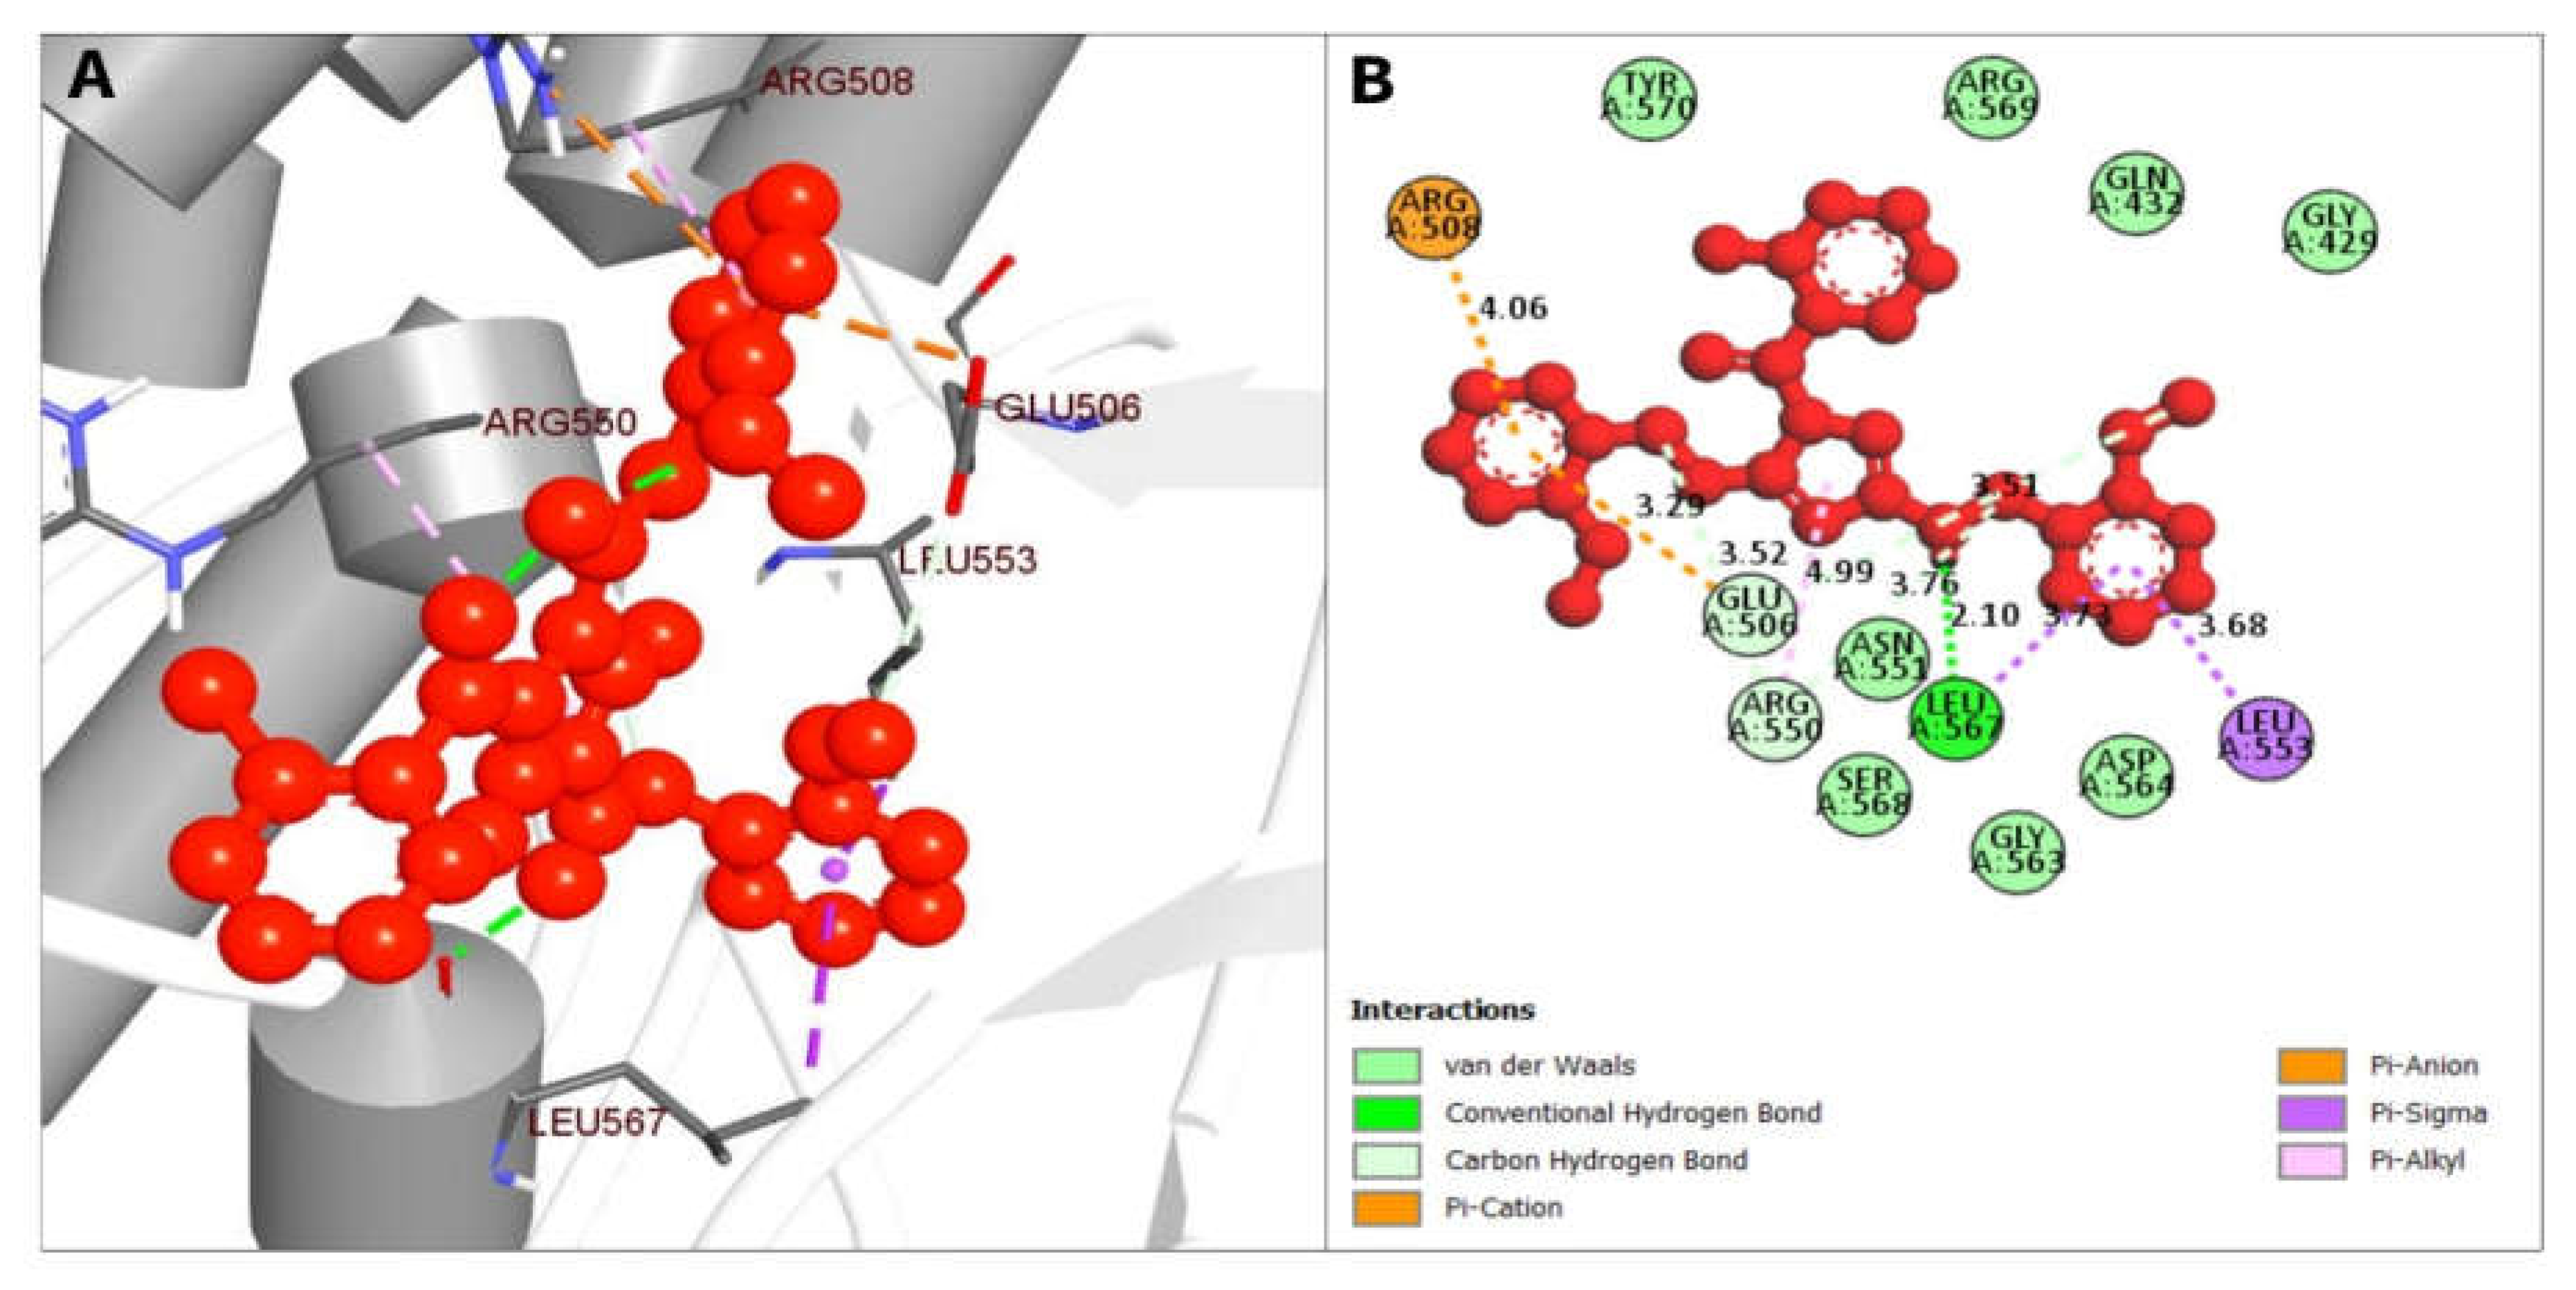
| CID 16467343 | LEU567 | 2.09727 | Hydrogen Bond | Conventional Hydrogen Bond |
| ARG550 | 3.52399 | Hydrogen Bond | Carbon Hydrogen Bond | |
| ARG550 | 3.75615 | Hydrogen Bond | Carbon Hydrogen Bond | |
| GLU506 | 3.51249 | Hydrogen Bond | Carbon Hydrogen Bond | |
| ARG508 | 4.05546 | Electrostatic | Pi-Cation | |
| GLU506 | 3.29313 | Electrostatic | Pi-Anion | |
| LEU553 | 3.67551 | Hydrophobic | Pi-Sigma | |
| LEU567 | 3.72557 | Hydrophobic | Pi-Sigma |
| Properties | Parameters | CID24601203 | CID1893370 | CID16355541 | CID16467343 |
|---|---|---|---|---|---|
| MW (g/mol) | 445.5 g/mol | 485.5 g/mol | 439.6 g/mol | 477.9 g/mol | |
| Heavy atoms | 32 | 35 | 30 | 34 | |
| Arom. heavy atoms | 25 | 26 | 21 | 23 | |
| Rotatable bonds | 4 | 6 | 6 | 10 | |
| H-bond acceptors | 6 | 7 | 6 | 5 | |
| H-bond donors | 7 | 3 | 2 | 2 | |
| Molar Refractivity | 123.29 | 133.42 | 122.35 | 131.77 | |
| Lipophilicity | Log Po/w | 3.71 | 5.62 | 4.16 | 4.46 |
| Water solubility | Log S (ESOL) | −5.15 | −5.79 | −5.68 | −6.61 |
| Pharmacokinetics | GI absorption | Low | Low | Low | High |
| Drug likeness | Lipinski, Violation | No | No | No | No |
| Medi. chemistry | Synth. accessibility | 3.49 | 3.68 | 3.68 | 3.47 |
| Endpoint | Target | CID 24601203 | CID 1893370 | CID 16355541 | CID 16467343 |
|---|---|---|---|---|---|
| Organ toxicity | Hepatotoxicity | Inactive | Inactive | Inactive | Inactive |
| Toxicity endpoints | Carcinogenicity | Inactive | Inactive | Inactive | Inactive |
| Immunotoxicity | Active | Light active | Light active | Inactive | |
| Mutagenicity | Inactive | Inactive | Inactive | Inactive | |
| Cytotoxicity | Inactive | Inactive | Inactive | Inactive | |
| Toxicity class | 4 | 4 | 4 | 4 | |
| Tox21-Nuclear receptor signaling pathways | Androgen receptor (AR) | Inactive | Inactive | Active | Inactive |
| Aryl hydrocarbon receptor (AhR) | Inactive | Inactive | Active | Inactive | |
| Tox21-Stress response pathway | Heat shock factor response element | Inactive | Inactive | Active | Inactive |
| Fathead minnow LC50 (96 h) | (mg/L) | 0.49 | 3.12 × 10⁻² | 0.41 | 1.37 × 10⁻² |
| 48-h Daphnia magna LC50 | −Log10(mol/L) | 4.54 | 4.6 | 4.33 | 2.68 |
| Developmental toxicity | value | 0.75 | 0.83 | 0.75 | 0.51 |
| Oral rat LD50 | mg/kg | 600.89 | 1181.5 | 543.77 | 1102.13 |
| Bioaccumulation factor | Log10 | N/A | 1.3 | 0.66 | 1.44 |
Disclaimer/Publisher’s Note: The statements, opinions and data contained in all publications are solely those of the individual author(s) and contributor(s) and not of MDPI and/or the editor(s). MDPI and/or the editor(s) disclaim responsibility for any injury to people or property resulting from any ideas, methods, instructions or products referred to in the content |
© 2023 by the authors. Licensee MDPI, Basel, Switzerland. This article is an open access article distributed under the terms and conditions of the Creative Commons Attribution (CC BY) license (https://creativecommons.org/licenses/by/4.0/).
Share and Cite
Molla, M.H.R.; Aljahdali, M.O.; Sumon, M.A.A.; Asseri, A.H.; Altayb, H.N.; Islam, M.S.; Alsaiari, A.A.; Opo, F.A.D.M.; Jahan, N.; Ahammad, F.; et al. Integrative Ligand-Based Pharmacophore Modeling, Virtual Screening, and Molecular Docking Simulation Approaches Identified Potential Lead Compounds against Pancreatic Cancer by Targeting FAK1. Pharmaceuticals 2023, 16, 120. https://doi.org/10.3390/ph16010120
Molla MHR, Aljahdali MO, Sumon MAA, Asseri AH, Altayb HN, Islam MS, Alsaiari AA, Opo FADM, Jahan N, Ahammad F, et al. Integrative Ligand-Based Pharmacophore Modeling, Virtual Screening, and Molecular Docking Simulation Approaches Identified Potential Lead Compounds against Pancreatic Cancer by Targeting FAK1. Pharmaceuticals. 2023; 16(1):120. https://doi.org/10.3390/ph16010120
Chicago/Turabian StyleMolla, Mohammad Habibur Rahman, Mohammed Othman Aljahdali, Md Afsar Ahmed Sumon, Amer H. Asseri, Hisham N. Altayb, Md. Shafiqul Islam, Ahad Amer Alsaiari, F. A. Dain Md Opo, Nushrat Jahan, Foysal Ahammad, and et al. 2023. "Integrative Ligand-Based Pharmacophore Modeling, Virtual Screening, and Molecular Docking Simulation Approaches Identified Potential Lead Compounds against Pancreatic Cancer by Targeting FAK1" Pharmaceuticals 16, no. 1: 120. https://doi.org/10.3390/ph16010120