
A Quantitative LC–MS/MS Method for the Detection of 16 Synthetic Cathinones and 10 Metabolites and Its Application to Suspicious Clinical and Forensic Urine Samples


Abstract
:1. Introduction
2. Results
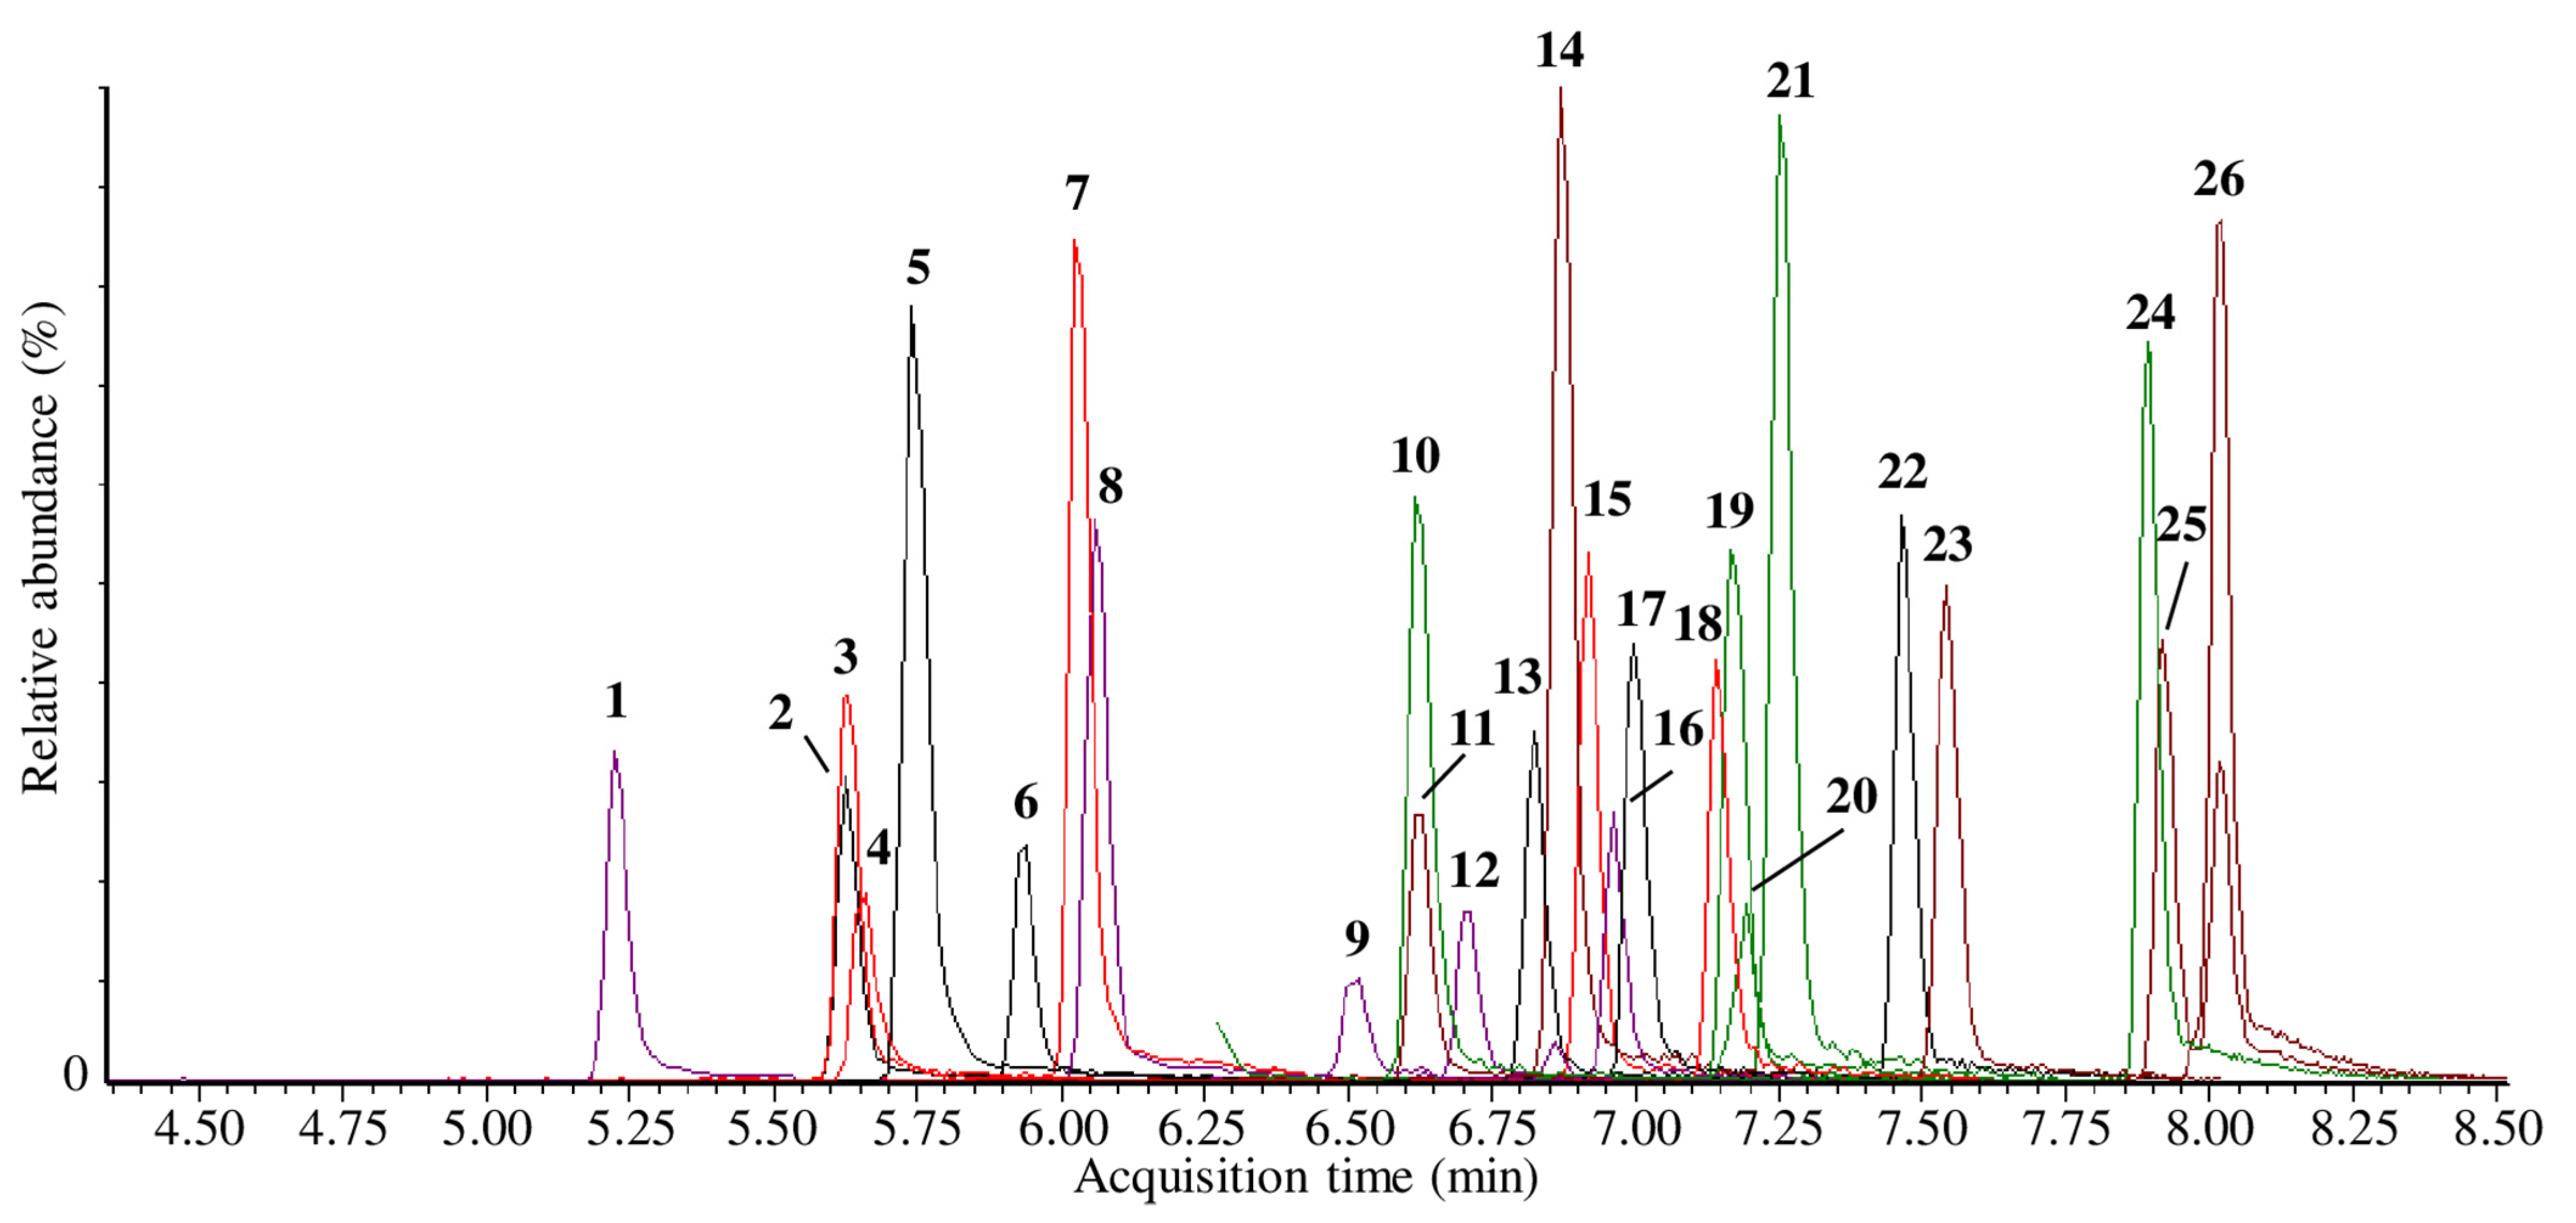
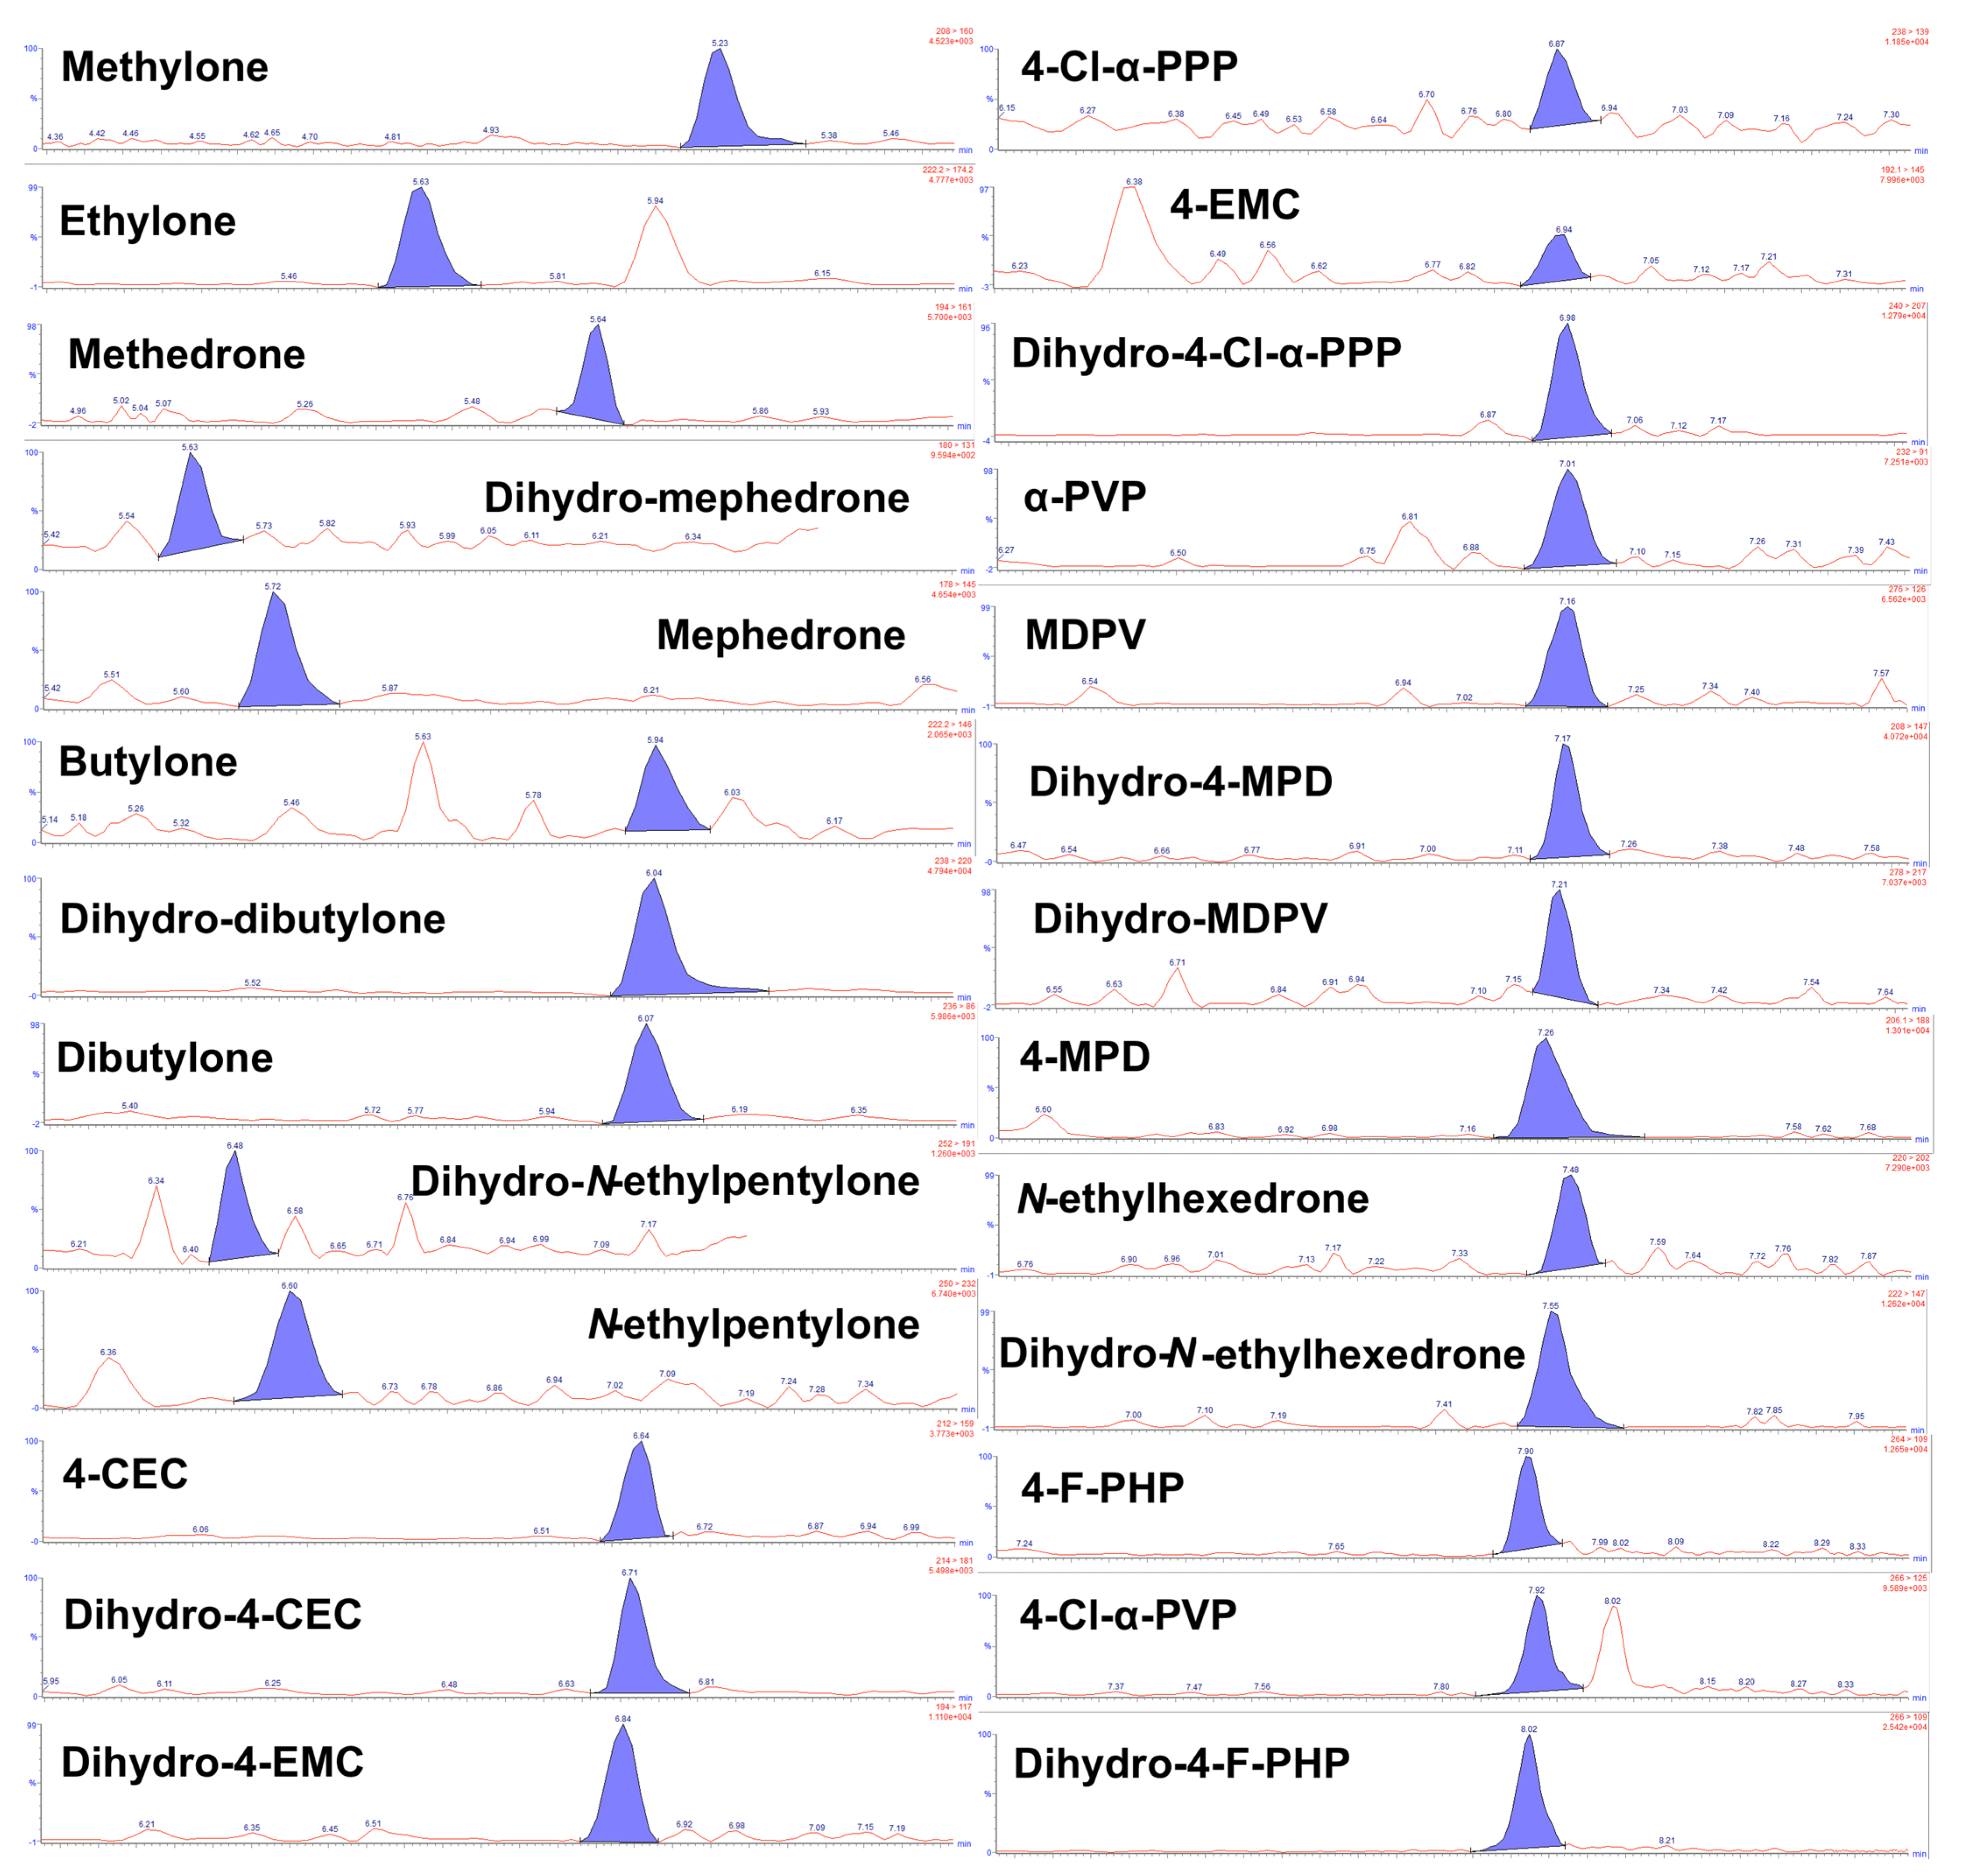
2.1. LC–MS/MS
2.2. Validation
2.2.1. Linearity
2.2.2. LOD and LOQ
2.2.3. Carryover
2.2.4. Bias and Precision
2.2.5. Interference
2.2.6. Matrix Effects
2.2.7. Processed Sample Stability
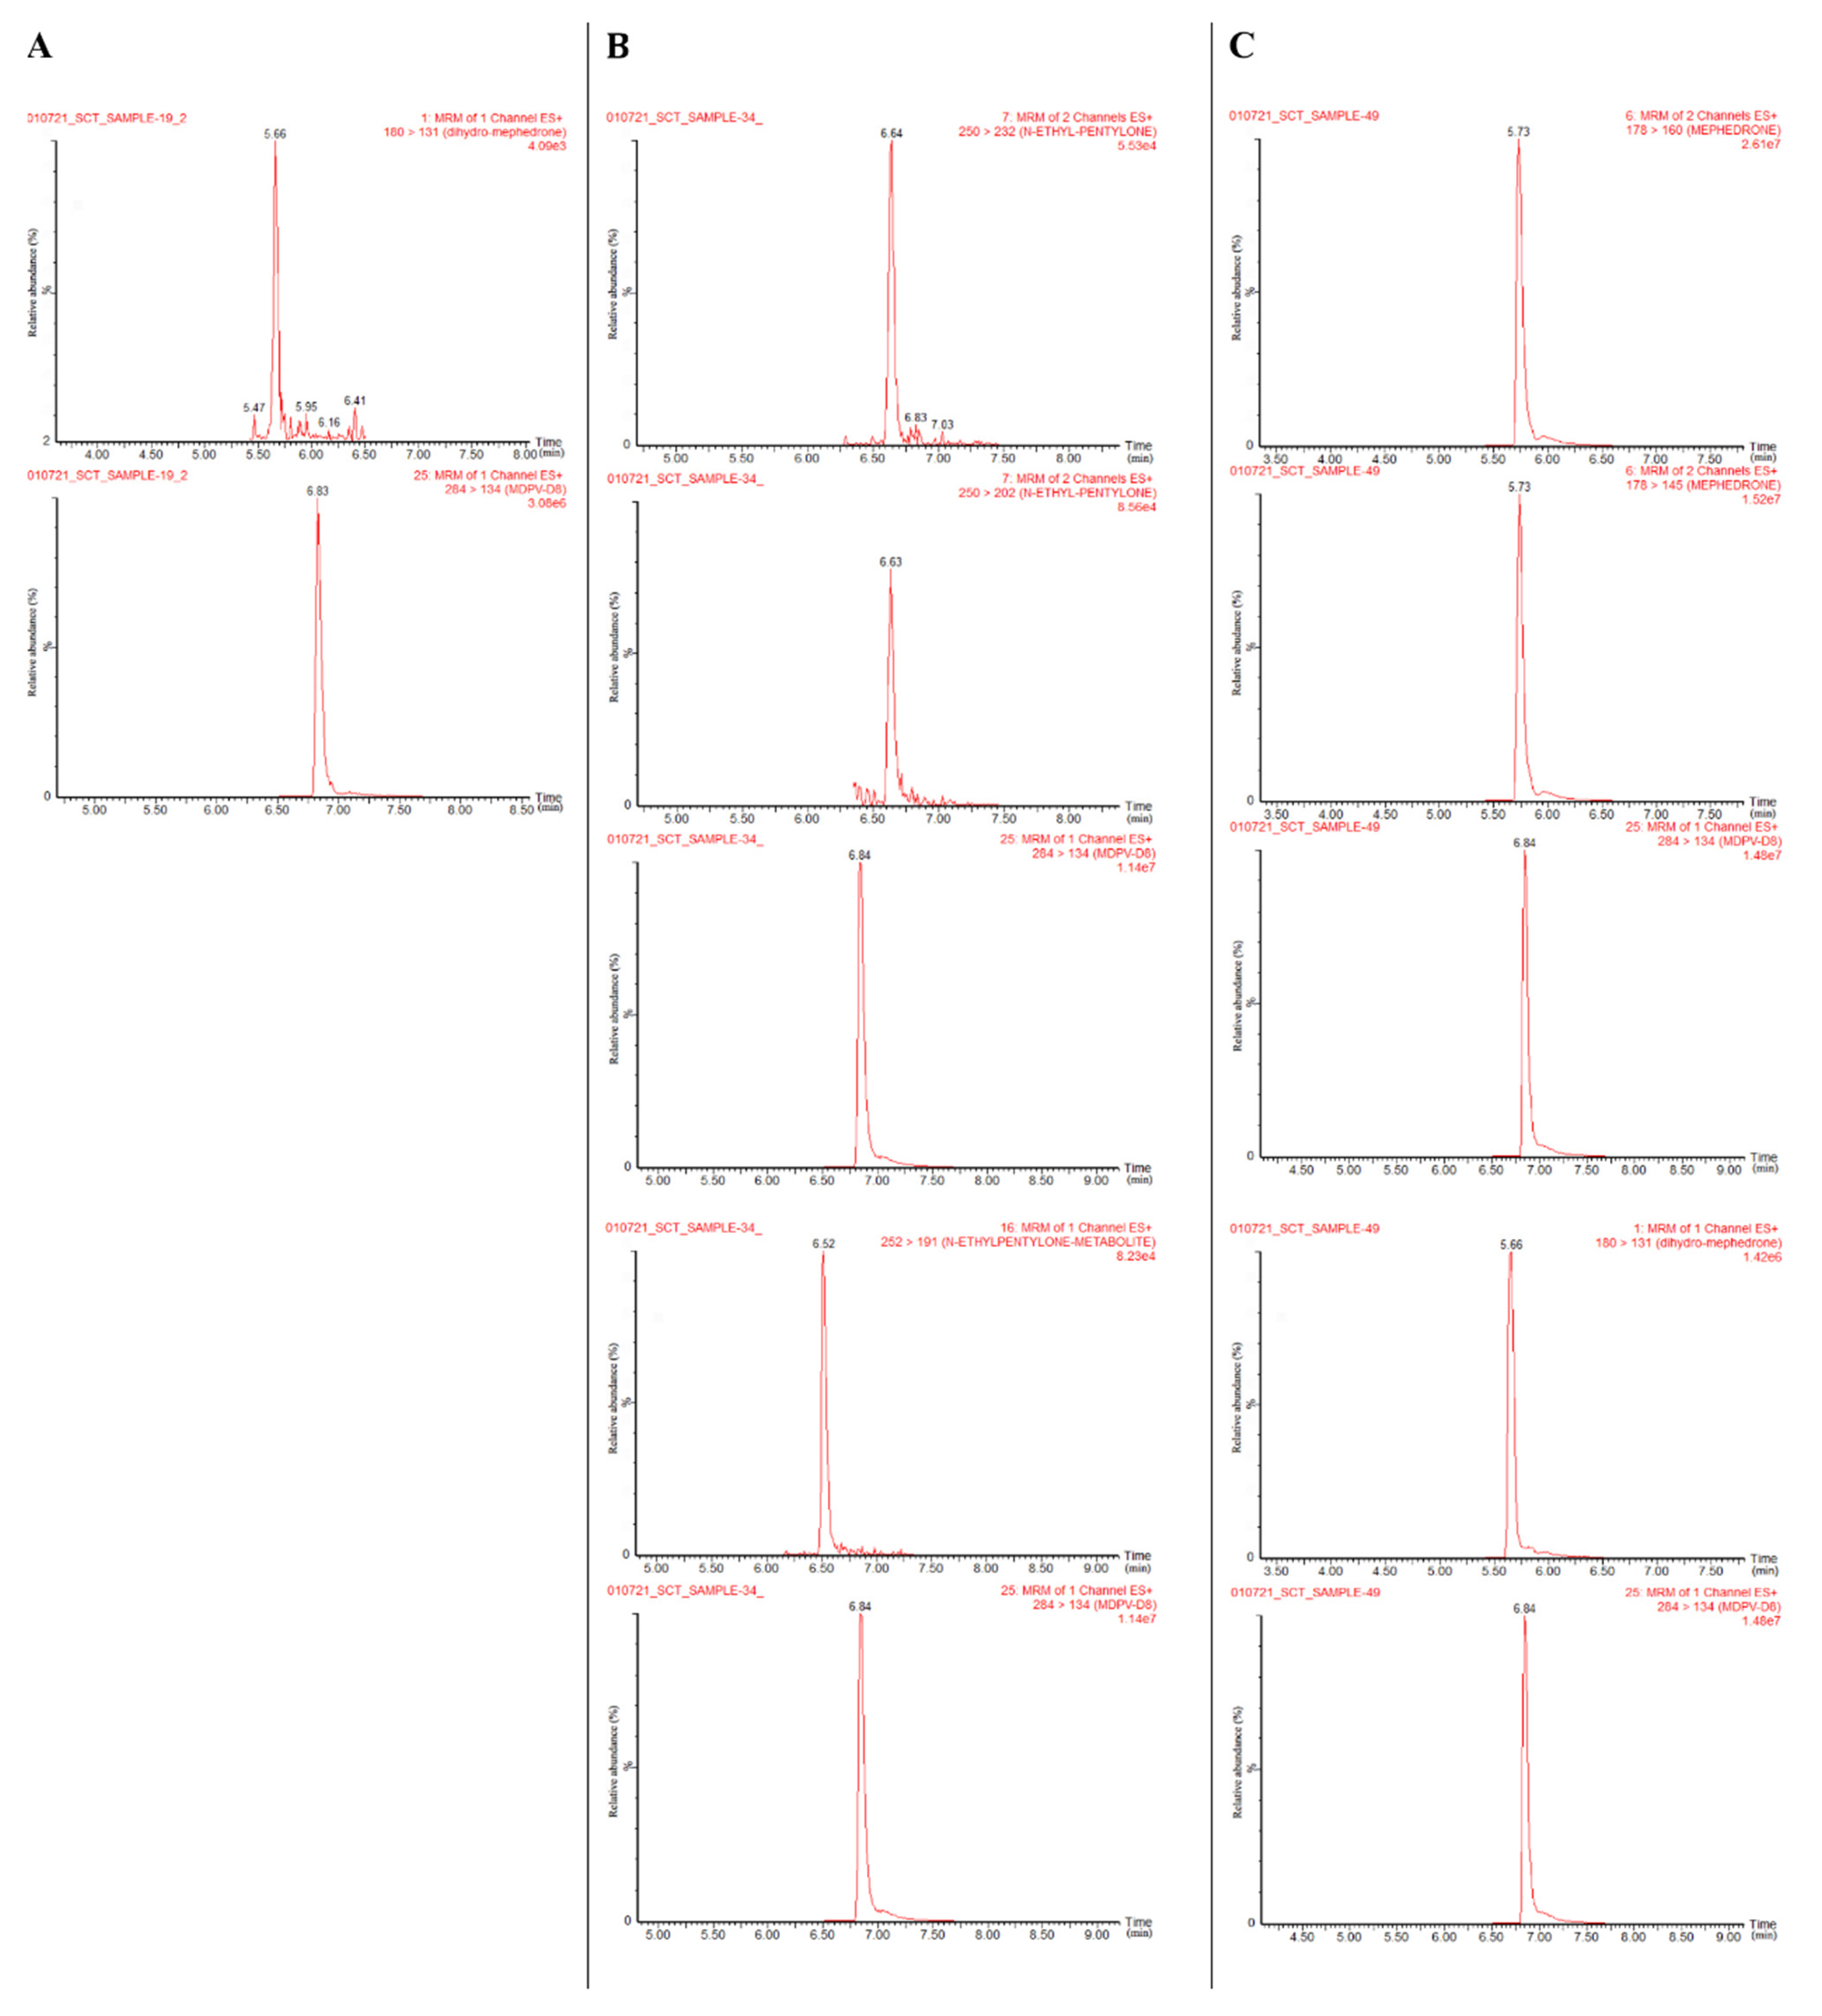
2.3. Analysis of Authentic Urine Samples
3. Discussion
4. Materials and Methods
4.1. Chemicals and Reagents
4.2. Preparation of Standards and Solutions
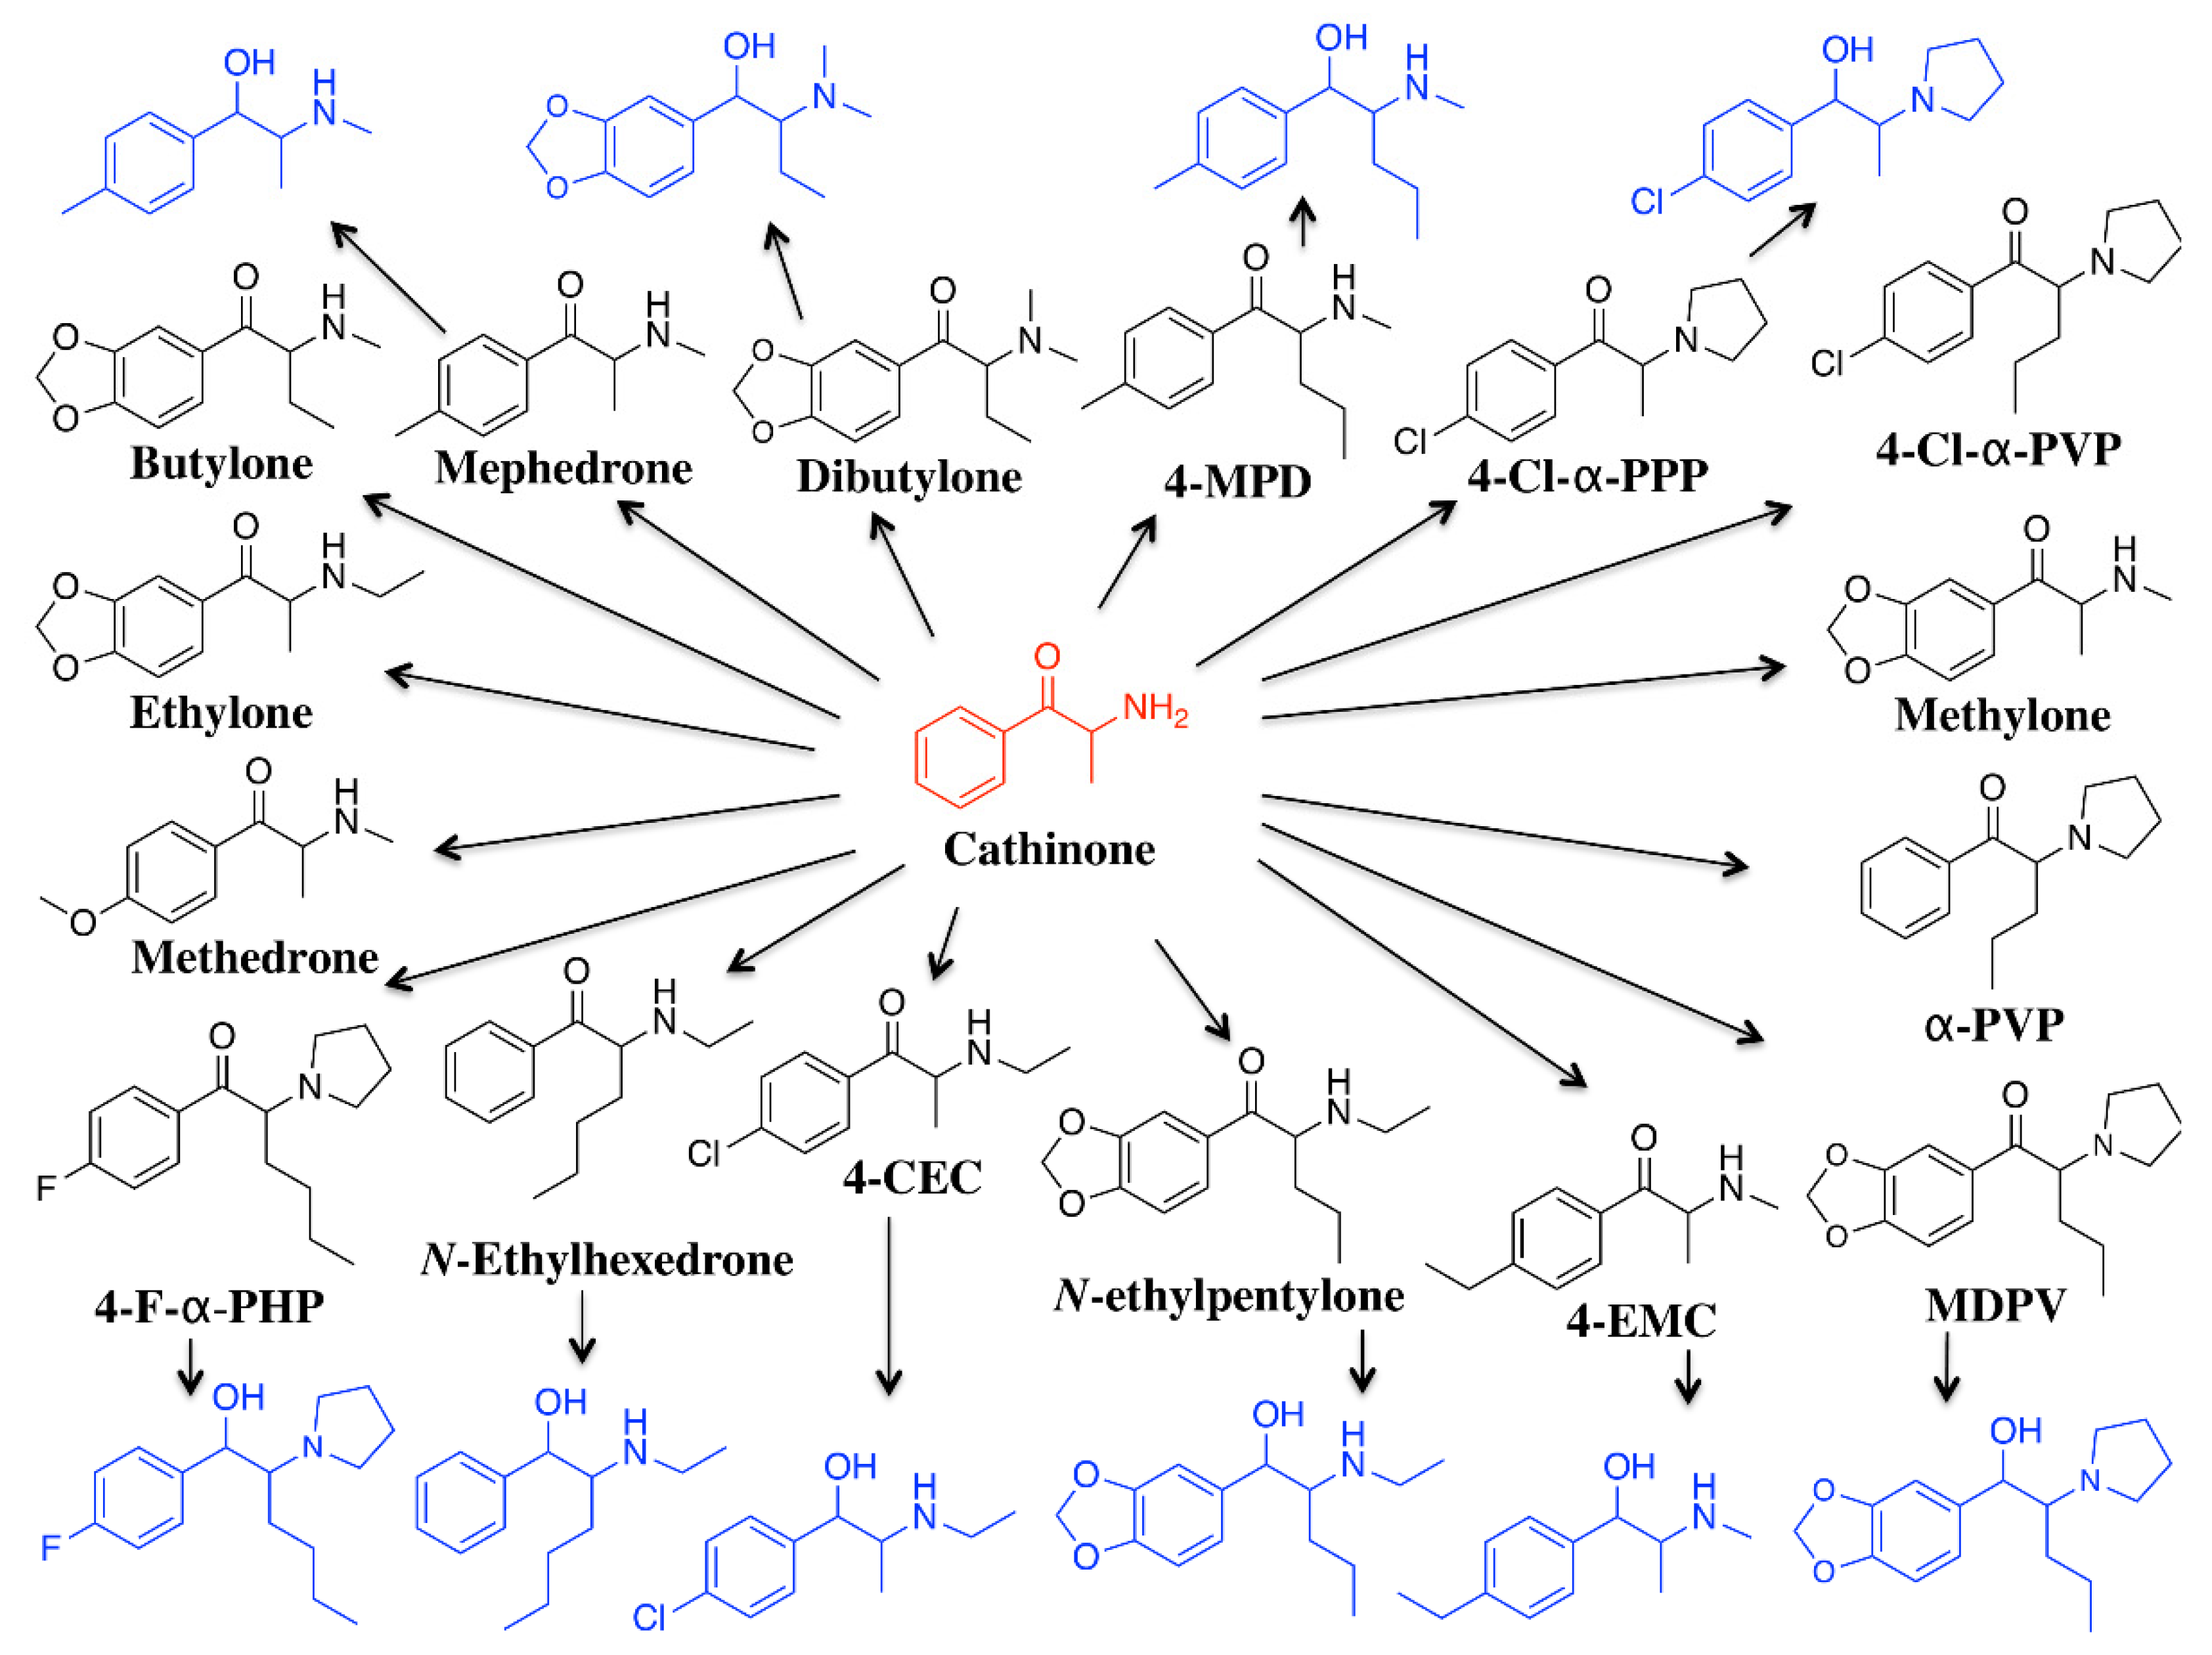
4.3. Synthesis of Reduced Metabolites
4.4. Liquid–Liquid Extraction (LLE)
4.5. LC Instrument
4.6. MS Conditions
4.7. Confirmation of Positive Findings
4.8. Validation Procedure
4.8.1. Linearity
4.8.2. Carryover
4.8.3. Bias and Precision
4.8.4. LOD and LOQ
4.8.5. Interference
4.8.6. Matrix Effects
4.8.7. Processed Sample Stability
4.9. Authentic Urine Samples
5. Conclusions
Supplementary Materials
Author Contributions
Funding
Institutional Review Board Statement
Informed Consent Statement
Data Availability Statement
Acknowledgments
Conflicts of Interest
References
- Majchrzak, M.; Celiński, R.; Kuś, P.; Kowalska, T.; Sajewicz, M. The Newest Cathinone Derivatives as Designer Drugs: An Analytical and Toxicological Review. Forensic Toxicol. 2018, 36, 33–50. [Google Scholar] [CrossRef] [Green Version]
- Brandt, S.D.; King, L.A.; Evans-Brown, M. The New Drug Phenomenon. Drug Test. Anal. 2014, 6, 587–597. [Google Scholar] [CrossRef] [PubMed]
- Miliano, C.; Serpelloni, G.; Rimondo, C.; Mereu, M.; Marti, M.; De Luca, M.A. Neuropharmacology of New Psychoactive Substances (NPS): Focus on the Rewarding and Reinforcing Properties of Cannabimimetics and Amphetamine-like Stimulants. Front. Neurosci. 2016, 10, 1–21. [Google Scholar] [CrossRef] [Green Version]
- EMCDDA. Trends and Developments; EMCDDA: Lisbon, Portugal, 2021; p. 43. ISBN 978-92-9497-634-5. [Google Scholar]
- EMCDDA. European Drug Report 2020: Trends and Developments; EMCDDA: Lisbon, Portugal, 2020; ISBN 9789294975454. [Google Scholar]
- UNODC. Cross-Cutting Issues: Evolving Trends and New Challenges; UNODC: Vienna, Austria, 2020; ISBN 9789211483451. [Google Scholar]
- Lee, D.; Chronister, C.W.; Hoyer, J.; Goldberger, B.A. Ethylone-Related Deaths: Toxicological Findings. J. Anal. Toxicol. 2015, 39, 567–571. [Google Scholar] [CrossRef] [PubMed] [Green Version]
- de Castro, A.; Lendoiro, E.; Fernández-Vega, H.; Steinmeyer, S.; López-Rivadulla, M.; Cruz, A. Liquid Chromatography Tandem Mass Spectrometry Determination of Selected Synthetic Cathinones and Two Piperazines in Oral Fluid. Cross Reactivity Study with an on-Site Immunoassay Device. J. Chromatogr. A 2014, 1374, 93–101. [Google Scholar] [CrossRef]
- Nieddu, M.; Burrai, L.; Trignano, C.; Boatto, G. Evaluation of Commercial Multi-Drug Oral Fluid Devices to Identify 39 New Amphetamine-Designer Drugs. Leg. Med. 2014, 16, 106–109. [Google Scholar] [CrossRef] [PubMed]
- Gerace, E.; Caneparo, D.; Borio, F.; Salomone, A.; Vincenti, M. Determination of Several Synthetic Cathinones and an Amphetamine-like Compound in Urine by Gas Chromatography with Mass Spectrometry. Method Validation and Application to Real Cases. J. Sep. Sci. 2019, 42, 1577–1584. [Google Scholar] [CrossRef]
- Zuba, D. Identification of Cathinones and Other Active Components of “legal Highs” by Mass Spectrometric Methods. TrAC Trends Anal. Chem. 2012, 32, 15–30. [Google Scholar] [CrossRef]
- Nisbet, L.A.; Wylie, F.M.; Logan, B.K.; Scott, K.S. Gas Chromatography-Mass Spectrometry Method for the Quantitative Identification of 23 New Psychoactive Substances in Blood and Urine. J. Anal. Toxicol. 2019, 43, 346–352. [Google Scholar] [CrossRef]
- Alsenedi, K.A.; Morrison, C. Determination and Long-Term Stability of Twenty-Nine Cathinones and Amphetamine-Type Stimulants (ATS) in Urine Using Gas Chromatography–Mass Spectrometry. J. Chromatogr. B Anal. Technol. Biomed. Life Sci. 2018, 1076, 91–102. [Google Scholar] [CrossRef]
- Namera, A.; Kawamura, M.; Nakamoto, A.; Saito, T.; Nagao, M. Comprehensive Review of the Detection Methods for Synthetic Cannabinoids and Cathinones. Forensic Toxicol. 2015, 33, 175–194. [Google Scholar] [CrossRef] [PubMed] [Green Version]
- Zuba, D.; Adamowicz, P. Analytical Methods Used for Identification and Determination of Synthetic Cathinones and Their Metabolites; Springer: Cham, Switzerland, 2018; ISBN 9783319787060. [Google Scholar]
- Czerwinska, J.; Parkin, M.C.; George, C.; Kicman, A.T.; Dargan, P.I.; Abbate, V. Excretion of Mephedrone and Its Phase I Metabolites in Urine after a Controlled Intranasal Administration to Healthy Human Volunteers. Drug Test. Anal. 2022, 14, 741–746. [Google Scholar] [CrossRef] [PubMed]
- Concheiro, M.; Anizan, S.; Ellefsen, K.; Huestis, M.A. Simultaneous Quantification of 28 Synthetic Cathinones and Metabolites in Urine by Liquid Chromatography-High Resolution Mass Spectrometry. Anal. Bioanal. Chem. 2013, 405, 9437–9448. [Google Scholar] [CrossRef] [PubMed]
- Al-Saffar, Y.; Stephanson, N.N.; Beck, O. Multicomponent LC-MS/MS Screening Method for Detection of New Psychoactive Drugs, Legal Highs, in Urine-Experience from the Swedish Population. J. Chromatogr. B Anal. Technol. Biomed. Life Sci. 2013, 930, 112–120. [Google Scholar] [CrossRef]
- Glicksberg, L.; Bryand, K.; Kerrigan, S. Identification and Quantification of Synthetic Cathinones in Blood and Urine Using Liquid Chromatography-Quadrupole/Time of Flight (LC-Q/TOF) Mass Spectrometry. J. Chromatogr. B Anal. Technol. Biomed. Life Sci. 2016, 1035, 91–103. [Google Scholar] [CrossRef]
- Hasegawa, K.; Wurita, A.; Minakata, K.; Gonmori, K.; Nozawa, H.; Yamagishi, I.; Suzuki, O.; Watanabe, K. Identification and Quantitation of a New Cathinone Designer Drug PV9 in an “Aroma Liquid” Product, Antemortem Whole Blood and Urine Specimens, and a Postmortem Whole Blood Specimen in a Fatal Poisoning Case. Forensic Toxicol. 2014, 32, 243–250. [Google Scholar] [CrossRef]
- Czerwinska, J.; Parkin, M.C.; Dargan, P.I.; George, C.; Kicman, A.T.; Abbate, V. Stability of Mephedrone and Five of Its Phase I Metabolites in Human Whole Blood. Drug Test. Anal. 2019, 11, 586–594. [Google Scholar] [CrossRef] [Green Version]
- Czerwinska, J.; Parkin, M.C.; Cilibrizzi, A.; George, C.; Kicman, A.T.; Dargan, P.I.; Abbate, V. Pharmacokinetics of Mephedrone Enantiomers in Whole Blood after a Controlled Intranasal Administration to Healthy Human Volunteers. Pharmaceuticals 2021, 14, 5. [Google Scholar] [CrossRef]
- Ammann, D.; McLaren, J.M.; Gerostamoulos, D.; Beyer, J. Detection and Quantification of New Designer Drugs in Human Blood: Part 2—Designer Cathinones. J. Anal. Toxicol. 2012, 36, 381–389. [Google Scholar] [CrossRef] [Green Version]
- Strano-Rossi, S.; Anzillotti, L.; Castrignanò, E.; Romolo, F.S.; Chiarotti, M. Ultra High Performance Liquid Chromatography-Electrospray Ionization-Tandem Mass Spectrometry Screening Method for Direct Analysis of Designer Drugs, “Spice” and Stimulants in Oral Fluid. J. Chromatogr. A 2012, 1258, 37–42. [Google Scholar] [CrossRef]
- Amaratunga, P.; Lemberg, B.L.; Lemberg, D. Quantitative Measurement of Synthetic Cathinones in Oral Fluid. J. Anal. Toxicol. 2013, 37, 622–628. [Google Scholar] [CrossRef] [PubMed] [Green Version]
- Czerwinska, J.; Jang, M.; Costa, C.; Parkin, M.C.; George, C.; Kicman, A.T.; Bailey, M.J.; Dargan, P.I.; Abbate, V. Detection of Mephedrone and Its Metabolites in Fingerprints from a Controlled Human Administration Study by Liquid Chromatography-Tandem Mass Spectrometry and Paper Spray-Mass Spectrometry. Analyst 2020, 145, 3038–3048. [Google Scholar] [CrossRef] [PubMed]
- Lendoiro, E.; Jiménez-Morigosa, C.; Cruz, A.; Páramo, M.; López-Rivadulla, M.; de Castro, A. An LC-MS/MS Methodological Approach to the Analysis of Hair for Amphetamine-Type-Stimulant (ATS) Drugs, Including Selected Synthetic Cathinones and Piperazines. Drug Test. Anal. 2017, 9, 96–105. [Google Scholar] [CrossRef] [PubMed]
- La Maida, N.; Di Trana, A.; Giorgetti, R.; Tagliabracci, A.; Busardò, F.P.; Huestis, M.A. A Review of Synthetic Cathinone-Related Fatalities From 2017 to 2020. Ther. Drug Monit. 2021, 43, 52–68. [Google Scholar] [CrossRef] [PubMed]
- Al-Matrouk, A.; Alqallaf, M.; AlShemmeri, A.; BoJbarah, H. Identification of Synthetic Cannabinoids That Were Seized, Consumed, or Associated with Deaths in Kuwait in 2018 Using GC–MS and LC–MS-MS Analysis. Forensic Sci. Int. 2019, 303, 109960. [Google Scholar] [CrossRef] [PubMed]
- Soh, Y.N.A.; Elliott, S. An Investigation of the Stability of Emerging New Psychoactive Substances. Drug Test. Anal. 2014, 6, 696–704. [Google Scholar] [CrossRef]
- O’Byrne, P.M.; Kavanagh, P.V.; Mcnamara, S.M.; Stokes, S.M. Screening of Stimulants Including Designer Drugs in Urine Using a Liquid Chromatography Tandem Mass Spectrometry System. J. Anal. Toxicol. 2013, 37, 64–73. [Google Scholar] [CrossRef]
- Bell, C.; George, C.; Kicman, A.T.; Traynor, A. Development of a Rapid LC-MS/MS Method for Direct Urinalysis of Designer Drugs. Drug Test. Anal. 2011, 3, 496–504. [Google Scholar] [CrossRef]
- Ploumen, C.; Marginean, I.; Lurie, I.S. The Utility of Silica Hydride-Based Stationary Phases for Dual-Mode Ultra High Performance Liquid Chromatography Separation of Synthetic Cathinone Positional Isomers. J. Sep. Sci. 2020, 43, 3449–3457. [Google Scholar] [CrossRef]
- Fan, S.Y.; Zang, C.Z.; Shih, P.H.; Ko, Y.C.; Hsu, Y.H.; Lin, M.C.; Tseng, S.H.; Wang, D.Y. A LC-MS/MS Method for Determination of 73 Synthetic Cathinones and Related Metabolites in Urine. Forensic Sci. Int. 2020, 315, 110429. [Google Scholar] [CrossRef]
- Shima, N.; Katagi, M.; Kamata, H.; Matsuta, S.; Nakanishi, K.; Zaitsu, K.; Kamata, T.; Nishioka, H.; Miki, A.; Tatsuno, M.; et al. Urinary Excretion and Metabolism of the Newly Encountered Designer Drug 3,4-Dimethylmethcathinone in Humans. Forensic Toxicol. 2013, 31, 101–112. [Google Scholar] [CrossRef]
- Olesti, E.; Farré, M.; Papaseit, E.; Krotonoulas, A.; Pujadas, M.; de la Torre, R.; Pozo, Ó.J. Pharmacokinetics of Mephedrone and Its Metabolites in Human by LC-MS/MS. AAPS J. 2017, 19, 1767–1778. [Google Scholar] [CrossRef] [PubMed]
- Pedersen, A.J.; Reitzel, L.A.; Johansen, S.S.; Linnet, K. In Vitro Metabolism Studies on Mephedrone and Analysis of Forensic Cases. Drug Test. Anal. 2013, 5, 430–438. [Google Scholar] [CrossRef] [PubMed]
- Aldubayyan, A.A.; Castrignanò, E.; Elliott, S.; Abbate, V. Stability of Synthetic Cathinones in Clinical and Forensic Toxicological Analysis—Where Are We Now? Drug Test. Anal. 2021, 13, 44–68. [Google Scholar] [CrossRef] [PubMed]
- Angoa-Pérez, M.; Kane, M.J.; Briggs, D.I.; Francescutti, D.M.; Sykes, C.E.; Shah, M.M.; Thomas, D.M.; Kuhn, D.M. Mephedrone Does Not Damage Dopamine Nerve Endings of the Striatum, but Enhances the Neurotoxicity of Methamphetamine, Amphetamine, and MDMA. J. Neurochem. 2013, 125, 102–110. [Google Scholar] [CrossRef] [PubMed]
- Yang, C.A.; Liu, H.C.; Lin, D.L.; Liu, R.H.; Hsieh, Y.Z.; Wu, S.P. Simultaneous Quantitation of Methamphetamine, Ketamine, Opiates and Their Metabolites in Urine by SPE and LC-MS-MS. J. Anal. Toxicol. 2017, 41, 679–687. [Google Scholar] [CrossRef] [Green Version]
- Guirguis, A.; Corkery, J.M.; Stair, J.L.; Kirton, S.B.; Zloh, M.; Schifano, F. Intended and Unintended Use of Cathinone Mixtures. Hum. Psychopharmacol. 2017, 32, e2598. [Google Scholar] [CrossRef]
- Rojek, S.; Klys, M.; Maciów-Glab, M.; Kula, K.; Strona, M. Cathinones Derivatives-Related Deaths as Exemplified by Two Fatal Cases Involving Methcathinone with 4-Methylmethcathinone and 4-Methylethcathinone. Drug Test. Anal. 2014, 6, 770–777. [Google Scholar] [CrossRef]
- Garey, J.D.; Lusskin, S.I.; Scialli, A.R. Teratogen Update: Amphetamines. Birth Defects Res. 2020, 112, 1171–1182. [Google Scholar] [CrossRef]
- Begeman, A.; Franssen, E.J.F. Lack of Detection of New Amphetamine-like Drugs Using Conventional Urinary Immunoassays. Ther. Drug Monit. 2018, 40, 135–139. [Google Scholar] [CrossRef]
- Saitman, A.; Park, H.D.; Fitzgerald, R.L. False-Positive Interferences of Common Urine Drug Screen Immunoassays: A Review. J. Anal. Toxicol. 2014, 38, 387–396. [Google Scholar] [CrossRef] [PubMed] [Green Version]
- Thirakul, P.; Hair, L.S.; Bergen, K.L.; Pearson, J.M. Clinical Presentation, Autopsy Results and Toxicology Findings in an Acute N-Ethylpentylone Fatality. J. Anal. Toxicol. 2017, 41, 342–346. [Google Scholar] [CrossRef] [PubMed] [Green Version]
- Brandt, S.D.; Baumann, M.H.; Partilla, J.S.; Kavanagh, P.V.; Power, J.D.; Talbot, B.; Twamley, B.; Mahony, O.; O’Brien, J.; Elliott, S.P.; et al. Characterization of a Novel and Potentially Lethal Designer Drug (±)-Cis-Para-Methyl-4-Methylaminorex (4,4’-DMAR, or ’Serotoni’). Drug Test. Anal. 2014, 6, 684–695. [Google Scholar] [CrossRef] [PubMed] [Green Version]
- Paul, L.D.; Musshoff, F.; Aebi, B.; Auwaeter, V.; Kraemer, T.; Peters, F.T. GTFCh Guideline for Quality Control in Forensic-Toxicological Analyses. Toxichem Krimtech. 2018, 85, 2–6. [Google Scholar]
- Scientific Working Group for Forensic Toxicology. Scientific Working Group for Forensic Toxicology (SWGTOX) Standard Practices for Method Validation in Forensic Toxicology. J. Anal. Toxicol. 2013, 37, 452–474. [Google Scholar] [CrossRef]
- Lebeau, M.A. ANSI/ASB Standard 036 for Method Validation in Forensic Toxicology Has Replaced SWGTOX’s Version. J. Anal. Toxicol. 2020, 44, 414. [Google Scholar] [CrossRef]


| Analyte No. | Target Analyte | Rt (min) | Precursor Ion (m/z) | Product Ion(s) (m/z) | CV (V) | CE(eV) | Ion Ratio | Dwell Time (s) |
|---|---|---|---|---|---|---|---|---|
| 1 | Methylone | 5.23 | 208 | 160 | 22 | 17 | 0.27 | 0.150 |
| 132 | 25 | |||||||
| 2 | Ethylone | 5.63 | 222 | 174 | 24 | 19 | 0.18 | 0.050 |
| 146 | 24 | |||||||
| 3 | Methedrone | 5.63 | 194 | 161 | 23 | 19 | 0.34 | 0.010 |
| 176 | 12 | |||||||
| 4 | Dihydro-mephedrone | 5.64 | 180 | 131 | 24 | 18 | - | 0.050 |
| 147 * | 19 | |||||||
| 5 | Mephedrone | 5.72 | 178 | 145 | 24 | 20 | 0.52 | 0.050 |
| 160 | 12 | |||||||
| 6 | Butylone | 5.94 | 222 | 146 | 24 | 24 | 0.28 | 0.020 |
| 204 | 13 | |||||||
| 7 | Dihydro-dibutylone | 6.02 | 238 | 220 | 26 | 12 | - | 0.050 |
| 191 * | 20 | |||||||
| 8 | Dibutylone | 6.07 | 236 | 86 | 26 | 21 | 0.60 | 0.050 |
| 191 | 15 | |||||||
| 9 | Dihydro-N-ethylpentylone | 6.49 | 252 | 191 | 27 | 23 | - | 0.010 |
| 234 * | 15 | |||||||
| 10 | N-ethylpentylone | 6.60 | 250 | 202 | 27 | 18 | 0.76 | 0.010 |
| 232 | 13 | |||||||
| 11 | 4-CEC | 6.63 | 212 | 159 | 27 | 18 | 0.74 | 0.050 |
| 194 | 13 | |||||||
| 12 | Dihydro-4-CEC | 6.71 | 214 | 181 | 23 | 23 | - | 0.050 |
| 141 * | 14 | |||||||
| 13 | Dihydro-4-EMC | 6.84 | 194 | 117 | 26 | 22 | - | 0.010 |
| 176 * | 12 | |||||||
| 14 | 4-Cl-α-PPP | 6.87 | 238 | 139 | 30 | 27 | 0.87 | 0.010 |
| 98 | 25 | |||||||
| 15 | 4-EMC | 6.92 | 192 | 145 | 26 | 21 | 0.51 | 0.010 |
| 174 | 12 | |||||||
| 16 | Dihydro-4-Cl-α-PPP | 6.96 | 240 | 207 | 30 | 22 | - | 0.010 |
| 115 * | 30 | |||||||
| 17 | α-PVP | 7.00 | 232 | 91 | 35 | 25 | 0.24 | 0.010 |
| 105 | 21 | |||||||
| 18 | MDPV | 7.16 | 276 | 126 | 30 | 27 | 0.52 | 0.010 |
| 135 | 24 | |||||||
| 19 | Dihydro-4-MPD | 7.17 | 208 | 147 | 25 | 22 | - | 0.010 |
| 159 * | 16 | |||||||
| 20 | Dihydro-MDPV | 7.19 | 278 | 217 | 30 | 22 | - | 0.010 |
| 260* | 16 | |||||||
| 21 | 4-MPD | 7.25 | 206 | 188 | 25 | 13 | 0.45 | 0.010 |
| 145 | 20 | |||||||
| 22 | N-ethylhexedrone | 7.48 | 220 | 202 | 27 | 14 | 0.55 | 0.010 |
| 91 | 22 | |||||||
| 23 | Dihydro-N-ethylhexedrone | 7.55 | 222 | 147 | 27 | 23 | - | 0.010 |
| 117 * | 22 | |||||||
| 24 | 4-F-PHP | 7.90 | 264 | 109 | 35 | 25 | 0.39 | 0.050 |
| 140 | 30 | |||||||
| 25 | 4-Cl-α-PVP | 7.92 | 266 | 125 | 31 | 21 | 0.26 | 0.050 |
| 139 | 24 | |||||||
| 26 | Dihydro-4-F-PHP | 8.01 | 266 | 109 | 35 | 25 | - | 0.050 |
| 191 * | 20 | |||||||
| 27 | MDPV-d8 | 6.84 | 284 | 134 | 33 | 26 | - | 0.020 |
| Analyte | LOD (ng/mL) | LOQ (ng/mL) | Intercept ± SD (n = 5) | Intercept ± SD (n = 5) | Slope ± SD (n = 5) | R2 ± SD (n = 5) |
|---|---|---|---|---|---|---|
| Mephedrone | 0.22 | 1 | 1–1000 | 0.0023 ± 0.0079 | 0.1173 ± 0.0119 | 0.9974 ± 0.0009 |
| Methylone | 0.11 | 1 | 1–1000 | −0.0105 ± 0.0037 | 0.1154 ± 0.0168 | 0.9978 ± 0.0021 |
| Methedrone | 0.37 | 1 | 1–1000 | 0.0013 ± 0.0075 | 0.0662 ± 0.0039 | 0.9975 ± 0.0026 |
| Ethylone | 0.23 | 1 | 1–1000 | −0.0005 ± 0.0084 | 0.1206 ± 0.0094 | 0.9983 ± 0.0019 |
| Butylone | 0.29 | 1 | 1–1000 | 0.0032 ± 0.0028 | 0.0309 ± 0.0013 | 0.9979 ± 0.0015 |
| Dibutylone | 0.23 | 1 | 1–1000 | 0.0024 ± 0.0120 | 0.1714 ± 0.0256 | 0.9977 ± 0.0015 |
| 4-CEC | 0.09 | 1 | 1–1000 | −0.0042 ± 0.0017 | 0.0662 ± 0.0038 | 0.9984 ± 0.0013 |
| 4-Cl-α-PPP | 0.30 | 1 | 1–1000 | 0.0079 ± 0.0193 | 0.2147 ± 0.0172 | 0.9979 ± 0.0014 |
| N-ethylpentylone | 0.26 | 1 | 1–1000 | 0.0104 ± 0.0083 | 0.1045 ± 0.0039 | 0.9984 ± 0.0007 |
| 4-EMC | 0.11 | 1 | 1–1000 | 0.0068 ± 0.0035 | 0.1021 ± 0.0064 | 0.9984 ± 0.0016 |
| α-PVP | 0.13 | 1 | 1–1000 | −0.0219 ± 0.0090 | 0.2255 ± 0.0157 | 0.9988 ± 0.0008 |
| MDPV | 0.35 | 1 | 1–1000 | −0.0033 ± 0.0159 | 0.1511 ± 0.0147 | 0.9987 ± 0.0009 |
| 4-MPD | 0.22 | 1 | 1–1000 | −0.0252 ± 0.0255 | 0.3841 ± 0.0395 | 0.9960 ± 0.0039 |
| N-ethylhexedrone | 0.25 | 1 | 1–1000 | −0.0040 ± 0.0141 | 0.1901 ± 0.0140 | 0.9993 ± 0.0003 |
| 4-F-PHP | 0.19 | 1 | 1–1000 | −0.0246 ± 0.0167 | 0.2849 ± 0.0234 | 0.9972 ± 0.0027 |
| 4-Cl-α-PVP | 0.30 | 1 | 1–1000 | 0.0050 ± 0.0162 | 0.1761 ± 0.0139 | 0.9990 ± 0.0006 |
| Dihydro-mephedrone | 0.39 | 1 | 1–1000 | 0.0174 ± 0.0168 | 0.1426 ± 0.0212 | 0.9983 ± 0.0012 |
| Dihydro-MDPV | 0.43 | 1 | 1–1000 | 0.0224 ± 0.0104 | 0.0797 ± 0.0059 | 0.9985 ± 0.0015 |
| Dihydro-4-Cl-α-PPP | 0.49 | 1 | 1–1000 | 0.0292 ± 0.0183 | 0.1223 ± 0.0137 | 0.9965 ± 0.0030 |
| Dihydro-4-EMC | 0.23 | 1 | 1–1000 | 0.0218 ± 0.0114 | 0.1609 ± 0.0195 | 0.9984 ± 0.0009 |
| Dihydro-N-ethylhexedrone | 0.32 | 1 | 1–1000 | 0.0296 ± 0.0239 | 0.2455 ± 0.0189 | 0.9981 ± 0.0014 |
| Dihydro-dibutylone | 0.20 | 1 | 1–1000 | 0.0696 ± 0.0700 | 1.1340 ± 0.1303 | 0.9989 ± 0.0010 |
| Dihydro-N-ethylpentylone | 0.36 | 1 | 1–1000 | 0.0305 ± 0.0176 | 0.1610 ± 0.0121 | 0.9989 ± 0.0013 |
| Dihydro-4-MPD | 0.25 | 1 | 1–1000 | 0.1267 ± 0.0559 | 0.7330 ± 0.0820 | 0.9982 ± 0.0011 |
| Dihydro-4-CEC | 0.24 | 1 | 1–1000 | 0.0125 ± 0.0058 | 0.0802 ± 0.0076 | 0.9983 ± 0.0013 |
| Dihydro-4-F-PHP | 0.30 | 1 | 1–1000 | −0.0081 ± 0.0436 | 0.4782 ± 0.0213 | 0.9988 ± 0.0011 |
| Analyte | Nominal Conc. | Run 1 (n = 3) | Run 2 (n = 3) | Run 3 (n = 3) | Run 4 (n = 3) | Run 5 (n = 3) | Grand Average (n = 15) | Bias(%) (n = 15) | Within-Run (n = 15) | Between-Run (n = 15) | |
|---|---|---|---|---|---|---|---|---|---|---|---|
| Mephedrone | 30 | CV (%) | 5.6 | 4.4 | 6.8 | 2.9 | 4.7 | 25.7 | −14.4 | 7.7 | 7.8 |
| Bias (%) | −2.7 | −19.3 | −12.5 | −17.2 | −16.2 | ||||||
| 400 | CV (%) | 3.6 | 8.8 | 4.9 | 2.5 | 6.2 | 429.5 | 7.4 | 6.9 | 7.0 | |
| Bias (%) | −1.9 | 8.5 | 10.9 | 3.6 | 12.8 | ||||||
| 800 | CV (%) | 2.5 | 0.8 | 7.2 | 1.2 | 4.3 | 823.4 | 2.9 | 7.4 | 7.6 | |
| Bias (%) | 3.1 | −3.4 | 6.5 | −4.1 | 12.5 | ||||||
| Methylone | 30 | CV (%) | 0.1 | 0.7 | 2.3 | 0.9 | 2.0 | 25.4 | −15.5 | 4.7 | 4.9 |
| Bias (%) | −16.6 | −19.9 | −18.3 | −10.4 | −12.6 | ||||||
| 400 | CV (%) | 3.4 | 0.6 | 1.9 | 2.2 | 2.9 | 414.4 | 3.6 | 5.5 | 5.7 | |
| Bias (%) | −1.4 | −1.8 | 8.0 | 0.6 | 10.8 | ||||||
| 800 | CV (%) | 4.1 | 1.0 | 1.6 | 2.1 | 3.5 | 840.7 | 5.1 | 7.0 | 7.2 | |
| Bias (%) | −1.3 | 2.9 | 0.0 | 4.3 | 17.3 | ||||||
| Methedrone | 30 | CV (%) | 11.0 | 8.3 | 8.7 | 1.9 | 4.0 | 27.3 | −9.0 | 9.6 | 9.7 |
| Bias (%) | 0.1 | −13.4 | −0.8 | −15.5 | −12.3 | ||||||
| 400 | CV (%) | 3.6 | 3.2 | 5.0 | 2.2 | 7.0 | 386.4 | −3.4 | 7.9 | 8.1 | |
| Bias (%) | −14.9 | 1.4 | −1.9 | −8.8 | 3.3 | ||||||
| 800 | CV (%) | 2.0 | 2.0 | 2.5 | 2.4 | 4.4 | 787.0 | −1.6 | 3.5 | 3.5 | |
| Bias (%) | −1.0 | −2.5 | −4.6 | −3.0 | 2.1 | ||||||
| Ethylone | 30 | CV (%) | 0.9 | 3.7 | 5.3 | 5.7 | 5.5 | 26.3 | −12.2 | 8.7 | 9.0 |
| Bias (%) | 0.8 | −14.2 | −7.8 | −19.2 | −16.3 | ||||||
| 400 | CV (%) | 6.6 | 3.6 | 3.3 | 2.7 | 2.1 | 411.8 | 0.3 | 6.2 | 6.4 | |
| Bias (%) | −9.7 | 6.7 | 7.1 | 1.9 | 4.5 | ||||||
| 800 | CV (%) | 4.5 | 0.4 | 1.9 | 0.6 | 2.7 | 800.1 | 0.0 | 2.9 | 3.0 | |
| Bias (%) | −1.8 | −1.6 | −2.1 | 2.6 | 2.4 | ||||||
| Butylone | 30 | CV (%) | 9.3 | 8.4 | 9.2 | 4.9 | 1.7 | 27.4 | −8.7 | 11.0 | 11.3 |
| Bias (%) | 4.2 | −12.5 | −13.5 | −17.8 | 0.5 | ||||||
| 400 | CV (%) | 0.2 | 3.2 | 4.7 | 5.8 | 1.4 | 391.4 | −2.2 | 9.3 | 9.6 | |
| Bias (%) | −18.6 | 6.9 | −0.7 | −6.8 | 2.9 | ||||||
| 800 | CV (%) | 2.9 | 4.6 | 0.7 | 5.2 | 2.9 | 770.1 | −3.7 | 5.7 | 5.8 | |
| Bias (%) | −8.0 | 0.7 | −9.2 | −5.1 | 1.5 | ||||||
| Dibutylone | 30 | CV (%) | 7.1 | 2.2 | 3.8 | 7.1 | 2.3 | 27.3 | −9.1 | 9.9 | 10.2 |
| Bias (%) | 7.8 | −5.1 | −16.8 | −12.5 | −13.0 | ||||||
| 400 | CV (%) | 1.8 | 13.9 | 7.7 | 4.0 | 3.1 | 433.6 | 8.4 | 8.6 | 8.6 | |
| Bias (%) | 8.0 | 12.0 | 0.9 | 4.5 | 16.5 | ||||||
| 800 | CV (%) | 4.6 | 11.0 | 10.1 | 7.6 | 2.3 | 816.7 | 2.1 | 7.8 | 7.8 | |
| Bias (%) | −1.7 | −0.5 | −0.6 | 9.1 | 2.8 | ||||||
| 4-CEC | 30 | CV (%) | 8.4 | 1.6 | 3.7 | 2.2 | 1.0 | 25.0 | −16.6 | 4.3 | 4.4 |
| Bias (%) | −14.6 | −17.2 | −18.6 | −12.6 | −19.2 | ||||||
| 400 | CV (%) | 1.8 | 5.1 | 1.3 | 3.3 | 5.3 | 419.3 | 4.8 | 7.0 | 7.2 | |
| Bias (%) | −8.6 | 3.1 | 8.3 | 5.3 | 11.6 | ||||||
| 800 | CV (%) | 2.4 | 2.9 | 1.1 | 5.3 | 0.6 | 803.5 | 0.4 | 4.0 | 4.0 | |
| Bias (%) | −0.8 | −3.2 | −1.7 | 4.0 | 3.4 | ||||||
| 4-Cl-α-PPP | 30 | CV (%) | 5.1 | 9.2 | 8.5 | 3.6 | 2.1 | 28.3 | −5.8 | 12.2 | 12.5 |
| Bias (%) | 9.3 | −8.8 | 4.7 | −10.7 | −18.3 | ||||||
| 400 | CV (%) | 3.4 | 1.5 | 1.8 | 3.5 | 2.2 | 420.1 | 7.5 | 7.5 | 7.8 | |
| Bias (%) | −12.3 | 5.2 | 10.4 | 8.1 | 7.8 | ||||||
| 800 | CV (%) | 4.0 | 1.4 | 1.0 | 0.5 | 2.1 | 815.4 | 1.9 | 4.9 | 5.1 | |
| Bias (%) | 6.2 | −5.5 | 0.5 | 2.7 | 7.1 | ||||||
| N-ethylpentylone | 30 | CV (%) | 0.6 | 6.0 | 3.1 | 2.0 | 8.8 | 28.2 | −6.2 | 11.5 | 11.8 |
| Bias (%) | 11.6 | −12.6 | 2.7 | −12.1 | −14.5 | ||||||
| 400 | CV (%) | 6.8 | 5.7 | 2.2 | 3.3 | 3.3 | 423.2 | 5.8 | 5.3 | 5.4 | |
| Bias (%) | 1.5 | 0.3 | 11.1 | 6.3 | 8.4 | ||||||
| 800 | CV (%) | 2.2 | 3.7 | 1.9 | 3.8 | 1.5 | 779.4 | −2.6 | 3.7 | 3.7 | |
| Bias (%) | −4.0 | −6.1 | −3.9 | −0.3 | 0.9 | ||||||
| 4-EMC | 30 | CV (%) | 5.8 | 5.0 | 2.8 | 3.3 | 7.5 | 27.4 | −8.5 | 10.5 | 10.8 |
| Bias (%) | −3.5 | −7.1 | 3.9 | −19.7 | −14.6 | ||||||
| 400 | CV (%) | 3.5 | 5.2 | 2.9 | 4.7 | 4.6 | 402.4 | 0.6 | 6.6 | 6.7 | |
| Bias (%) | −12.3 | 2.2 | 3.7 | 2.6 | 2.6 | ||||||
| 800 | CV (%) | 2.2 | 3.1 | 0.9 | 5.6 | 2.0 | 811.5 | 1.4 | 3.2 | 3.2 | |
| Bias (%) | 3.3 | 1.7 | −1.4 | 1.8 | 2.5 | ||||||
| α-PVP | 30 | CV (%) | 1.2 | 0.5 | 5.9 | 1.6 | 0.7 | 24.9 | −16.9 | 4.5 | 4.6 |
| Bias (%) | −9.7 | −19.5 | −17.5 | −18.2 | −16.9 | ||||||
| 400 | CV (%) | 8.3 | 6.0 | 3.4 | 6.2 | 2.0 | 401.0 | 0.3 | 6.0 | 6.1 | |
| Bias (%) | −7.5 | −2.6 | 4.9 | 0.9 | 3.0 | ||||||
| 800 | CV (%) | 1.7 | 3.8 | 0.8 | 2.7 | 4.9 | 812.3 | 1.5 | 4.4 | 4.5 | |
| Bias (%) | 0.9 | −3.6 | 0.2 | 4.2 | 5.8 | ||||||
| MDPV | 30 | CV (%) | 10.7 | 10.2 | 4.5 | 1.8 | 5.6 | 26.6 | −11.2 | 7.9 | 12.5 |
| Bias (%) | 5.0 | −10.9 | −18.1 | −15.4 | −16.7 | ||||||
| 400 | CV (%) | 0.3 | 5.3 | 4.4 | 4.5 | 5.7 | 415.1 | 3.8 | 4.5 | 5.0 | |
| Bias (%) | −0.6 | 7.0 | 6.0 | 0.6 | 5.9 | ||||||
| 800 | CV (%) | 1.7 | 5.3 | 1.3 | 2.6 | 4.5 | 817.9 | 2.2 | 3.5 | 5.4 | |
| Bias (%) | −3.6 | 1.2 | 3.5 | 0.9 | 9.2 | ||||||
| 4-MPD | 30 | CV (%) | 3.0 | 1.9 | 3.1 | 5.5 | 4.3 | 27.9 | −7.0 | 12.9 | 13.4 |
| Bias (%) | 9.8 | 5.2 | −7.8 | −17.9 | −18.6 | ||||||
| 400 | CV (%) | 2.0 | 6.3 | 0.4 | 3.2 | 1.7 | 406.7 | 1.7 | 5.8 | 5.9 | |
| Bias (%) | −5.7 | −2.8 | 4.5 | 1.1 | 8.7 | ||||||
| 800 | CV (%) | 8.5 | 0.6 | 1.4 | 1.9 | 2.4 | 809.5 | 1.2 | 4.9 | 4.9 | |
| Bias (%) | 9.3 | −0.7 | 0.1 | −2.3 | 2.7 | ||||||
| N-ethylhexedrone | 30 | CV (%) | 0.6 | 2.0 | 2.0 | 3.3 | 0.2 | 26.8 | −10.7 | 8.0 | 8.3 |
| Bias (%) | −1.4 | −5.3 | −7.4 | −18.8 | −17.5 | ||||||
| 400 | CV (%) | 2.8 | 4.5 | 1.0 | 1.6 | 0.8 | 409.4 | 2.4 | 3.1 | 3.1 | |
| Bias (%) | −0.9 | 0.2 | 2.3 | 5.6 | 3.6 | ||||||
| 800 | CV (%) | 1.6 | 0.9 | 1.9 | 1.3 | 4.1 | 824.1 | 3.0 | 4.6 | 4.7 | |
| Bias (%) | 8.3 | −3.1 | 0.7 | 3.7 | 7.2 | ||||||
| 4-F-PHP | 30 | CV (%) | 4.6 | 0.9 | 2.9 | 0.5 | 5.0 | 25.8 | −14.2 | 4.5 | 4.6 |
| Bias (%) | −8.3 | −17.0 | −13.8 | −16.9 | −13.0 | ||||||
| 400 | CV (%) | 1.8 | 5.0 | 2.2 | 3.3 | 5.0 | 388.8 | −2.8 | 6.9 | 7.1 | |
| Bias (%) | −10.1 | −1.7 | 2.1 | −10.0 | 3.2 | ||||||
| 800 | CV (%) | 2.4 | 2.2 | 3.7 | 3.5 | 1.8 | 788.9 | −1.4 | 6.0 | 6.2 | |
| Bias (%) | −1.4 | −3.6 | 2.8 | −9.6 | 4.8 | ||||||
| 4-Cl-α-PVP | 30 | CV (%) | 6.0 | 8.4 | 2.3 | 0.9 | 1.6 | 25.1 | −16.2 | 9.0 | 9.3 |
| Bias (%) | −0.3 | −18.2 | −17.6 | −19.7 | −19.9 | ||||||
| 400 | CV (%) | 4.4 | 2.2 | 1.2 | 2.3 | 0.4 | 397.6 | −0.6 | 6.6 | 6.8 | |
| Bias (%) | −11.5 | 0.1 | −1.7 | −2.3 | 8.8 | ||||||
| 800 | CV (%) | 0.1 | 2.0 | 1.0 | 0.7 | 2.0 | 785.8 | −1.8 | 4.3 | 4.4 | |
| Bias (%) | −1.4 | −1.4 | −5.9 | −4.8 | 4.8 | ||||||
| Dihydro-mephedrone | 30 | CV (%) | 0.9 | 8.8 | 5.9 | 5.4 | 7.8 | 31.5 | 5.1 | 9.2 | 9.4 |
| Bias (%) | 16.0 | −0.1 | 13.3 | −4.2 | 4.5 | ||||||
| 400 | CV (%) | 6.1 | 7.3 | 3.2 | 0.8 | 0.4 | 428.6 | 7.1 | 5.8 | 5.9 | |
| Bias (%) | 7.1 | 13.5 | 10.3 | 1.6 | 3.2 | ||||||
| 800 | CV (%) | 3.1 | 4.5 | 2.9 | 0.9 | 2.2 | 767.0 | −4.1 | 3.1 | 3.1 | |
| Bias (%) | 7.1 | 13.5 | 10.3 | 1.6 | 3.2 | ||||||
| Dihydro-MDPV | 30 | CV (%) | 3.6 | 8.6 | 12.3 | 4.9 | 8.0 | 30.5 | 1.7 | 10.5 | 10.6 |
| Bias (%) | 17.2 | 6.7 | −0.6 | −5.3 | −4.4 | ||||||
| 400 | CV (%) | 6.9 | 4.4 | 6.7 | 2.2 | 1.5 | 410.7 | 2.7 | 5.1 | 5.1 | |
| Bias (%) | −1.5 | 8.5 | 8.5 | 2.7 | 1.0 | ||||||
| 800 | CV (%) | 0.6 | 1.7 | 5.4 | 1.8 | 3.3 | 752.1 | −6.0 | 5.0 | 5.1 | |
| Bias (%) | −6.5 | −9.9 | −5.2 | −8.9 | 0.4 | ||||||
| Dihydro-4-Cl-α-PPP | 30 | CV (%) | 10.3 | 7.5 | 10.5 | 8.4 | 3.7 | 28.1 | −6.4 | 8.5 | 8.5 |
| Bias (%) | 13 | −5.7 | −3.1 | −11.2 | −10.7 | ||||||
| 400 | CV (%) | 0.5 | 5.8 | 5.3 | 3.6 | 1.2 | 429.9 | 7.5 | 5.1 | 5.2 | |
| Bias (%) | −0.4 | 7.6 | 10.1 | 5.7 | 11.8 | ||||||
| 800 | CV (%) | 5.5 | 5.0 | 6.7 | 7.6 | 8.7 | 769.9 | −3.8 | 7.8 | 7.9 | |
| Bias (%) | −8.4 | −2.7 | −10.5 | −1.6 | 2.8 | ||||||
| Dihydro-4-EMC | 30 | CV (%) | 3.2 | 9.3 | 4.0 | 7.9 | 9.3 | 31.6 | 5.2 | 9.9 | 10.1 |
| Bias (%) | 18.0 | 3.8 | 12.2 | −6.0 | 2.4 | ||||||
| 400 | CV (%) | 3.1 | 1.7 | 2.1 | 3.8 | 1.7 | 438.1 | 9.5 | 6.9 | 7.1 | |
| Bias (%) | −6.0 | 7.8 | 14.1 | 10.8 | 15.7 | ||||||
| 800 | CV (%) | 6.9 | 0.3 | 2.0 | 2.6 | 0.7 | 796.8 | −0.4 | 4.1 | 4.2 | |
| Bias (%) | −3.3 | −3.9 | −2.0 | 1.6 | 4.6 | ||||||
| Dihydro-N-ethylhexedrone | 30 | CV (%) | 2.0 | 3.6 | 2.6 | 0.6 | 3.8 | 29.5 | −1.6 | 5.1 | 5.3 |
| Bias (%) | 5.0 | 1.4 | −2.3 | −1.3 | −8.6 | ||||||
| 400 | CV (%) | 1.4 | 3.7 | 1.4 | 1.2 | 2.1 | 435.2 | 8.8 | 4.7 | 4.9 | |
| Bias (%) | −1.8 | 7.8 | 10.6 | 11.5 | 12.3 | ||||||
| 800 | CV (%) | 3.5 | 1.9 | 2.6 | 4.1 | 4.0 | 801.9 | 0.2 | 5.1 | 5.2 | |
| Bias (%) | −1.4 | −7.0 | 2.9 | 3.0 | 3.1 | ||||||
| Dihydro-dibutylone | 30 | CV (%) | 3.3 | 3.9 | 7.7 | 8.9 | 4.6 | 29.4 | −1.9 | 8.2 | 8.3 |
| Bias (%) | −2.1 | −6.2 | 9.1 | −5.3 | −4.9 | ||||||
| 400 | CV (%) | 3.6 | 2.2 | 1.0 | 2.0 | 1.6 | 427.4 | 6.8 | 7.9 | 8.2 | |
| Bias (%) | −8.5 | 12.7 | 13.7 | 11.0 | 0.3 | ||||||
| 800 | CV (%) | 1.0 | 1.2 | 0.2 | 1.0 | 1.7 | 800.1 | 0.0 | 2.9 | 3.0 | |
| Bias (%) | 1.3 | −4.1 | −1.7 | 2.7 | 2.3 | ||||||
| Dihydro-N-ethylpentylone | 30 | CV (%) | 8.7 | 7.8 | 2.5 | 7.9 | 2.2 | 29.1 | −2.9 | 8.3 | 8.4 |
| Bias (%) | 7.4 | −9.3 | 2.0 | −2.1 | −8.9 | ||||||
| 400 | CV (%) | 4.6 | 0.4 | 3.2 | 7.0 | 2.9 | 430.5 | 7.6 | 6.7 | 6.9 | |
| Bias (%) | −4.9 | 5.3 | 7.7 | 12.8 | 13.0 | ||||||
| 800 | CV (%) | 0.3 | 1.5 | 4.6 | 2.6 | 2.3 | 794.3 | −0.7 | 6.7 | 7.0 | |
| Bias (%) | −11.9 | −0.8 | −4.2 | 7.5 | 2.1 | ||||||
| Dihydro-4-MPD | 30 | CV (%) | 2.8 | 4.5 | 6.0 | 5.0 | 2.7 | 31.5 | 5.2 | 7.0 | 7.1 |
| Bias (%) | 18.3 | 3.0 | 3.6 | −1.4 | 6.6 | ||||||
| 400 | CV (%) | 1.4 | 8.1 | 1.6 | 7.2 | 9.6 | 414.2 | 3.5 | 9.9 | 10.1 | |
| Bias (%) | −9.4 | −1.7 | 3.5 | 5.3 | 15.7 | ||||||
| 800 | CV (%) | 0.1 | 1.4 | 3.6 | 3.9 | 5.7 | 801.1 | 0.1 | 6.1 | 6.3 | |
| Bias (%) | −1.4 | −8.3 | 2.8 | 0.7 | 6.4 | ||||||
| Dihydro-4-CEC | 30 | CV (%) | 6.8 | 6.8 | 9.4 | 3.0 | 5.2 | 31.0 | 3.2 | 8.3 | 8.4 |
| Bias (%) | 15.3 | 0.3 | 7.6 | −3.0 | 0.0 | ||||||
| 400 | CV (%) | 1.7 | 2.1 | 3.5 | 1.7 | 4.0 | 432.8 | 8.2 | 7.1 | 7.3 | |
| Bias (%) | 6.0 | 12.9 | 13.0 | 12.7 | −4.4 | ||||||
| 800 | CV (%) | 0.0 | 1.3 | 1.3 | 2.0 | 1.5 | 795.6 | −0.5 | 2.2 | 2.2 | |
| Bias (%) | 1.8 | −2.3 | −2.2 | 1.4 | −0.7 | ||||||
| Dihydro-4-F-PHP | 30 | CV (%) | 10.2 | 6.9 | 1.2 | 0.2 | 1.0 | 25.8 | 7.2 | 7.2 | 7.4 |
| Bias (%) | −3.0 | −17.8 | −15.7 | −12.0 | −17.2 | ||||||
| 400 | CV (%) | 11.6 | 2.4 | 15.0 | 8.3 | 0.9 | 410.1 | 2.5 | 10.2 | 10.4 | |
| Bias (%) | −11.6 | 4.1 | −1.9 | 6.4 | 10.9 | ||||||
| 800 | CV (%) | 0.4 | 5.7 | 4.8 | 4.0 | 4.7 | 801.1 | 0.1 | 5.1 | 5.1 | |
| Bias (%) | 0.0 | −5.1 | 0.5 | 0.5 | 4.8 |
| 24 h | 48 h | 72 h | ||||
|---|---|---|---|---|---|---|
| QC-Low | QC-High | QC-Low | QC-High | QC-Low | QC-High | |
| Analyte | % Loss (RSD) | % Loss (RSD) | % Loss (RSD) | % Loss (RSD) | % Loss (RSD) | % Loss (RSD) |
| Mephedrone | −1.1 | 1.0 | −2.9 | 0.4 | −2.0 | −1.1 |
| (1.0) | (3.6) | (1.8) | (2.3) | (2.7) | (1.0) | |
| Methylone | 9.2 | 0.0 | −8.3 | −5.1 | −8.1 | 9.2 |
| (5.2) | (3.4) | (7.0) | (2.4) | (12.6) | (5.2) | |
| Methedrone | −6.2 | −11.6 | −8.5 | −11.9 | −12.3 | −6.2 |
| (18.3) | (2.2) | (15.6) | (4.9) | (14.6) | (18.3) | |
| Ethylone | −7.1 | 1.7 | −12.2 | −1.7 | −14.5 | −0.4 |
| (6.2) | (2.4) | (6.6) | (4.0) | (6.8) | (4.5) | |
| Butylone | 3.8 | −5.9 | −14.2 | −13.0 | −12.7 | −11.7 |
| (2.6) | (8.8) | (17.0) | (5.4) | (8.9) | (3.1) | |
| Dibutylone | 5.7 | 0.2 | 4.1 | −0.3 | −6.5 | −1.3 |
| (3.5) | (2.9) | (6.5) | (1.8) | (5.2) | (1.1) | |
| 4-CEC | 0.3 | −8.5 | 5.1 | −2.5 | 2.0 | −3.5 |
| (8.1) | (8.8) | (14.3) | (9.8) | (4.3) | (4.4) | |
| 4-Cl-α-PPP | −2.2 | −5.5 | 3.2 | −2.2 | 1.4 | −4.8 |
| (6.6) | (3.1) | (8.4) | (1.2) | (8.9) | (2.2) | |
| N-ethylpentylone | 0.1 | −9.2 | −8.5 | −4.3 | −2.1 | −11.4 |
| (9.6) | (8.5) | (10.6) | (2.0) | (7.2) | (0.6) | |
| 4-EMC | −9.4 | −6.8 | −6.6 | 2.1 | −7.0 | −1.2 |
| (14.4) | (9.8) | (14.9) | (2.0) | (6.3) | (7.8) | |
| α-PVP | −3.2 | −10.8 | 9.9 | −5.6 | 0.4 | −13.3 |
| (4.8) | (3.3) | (14.3) | (1.5) | (3.1) | (2.1) | |
| MDPV | 3.6 | −8.8 | 5.6 | 0.3 | 1.7 | −1.2 |
| (8.0) | (17.3) | (8.9) | (3.7) | (8.0) | (7.4) | |
| 4-MPD | 1.5 | −0.7 | −3.0 | −1.0 | −0.5 | −10.5 |
| (6.9) | (5.3) | (13.9) | (2.8) | (5.5) | (6.6) | |
| N-ethylhexedrone | −3.6 | −6.5 | −5.9 | 1.8 | −5.8 | −5.7 |
| (13.1) | (2.7) | (12.2) | (1.0) | (6.1) | (2.1) | |
| 4-F-PHP | −7.7 | −9.0 | −6.5 | −2.4 | −13.8 | −11.0 |
| (12.8) | (4.8) | (3.4) | (0.3) | (3.9) | (0.6) | |
| 4-Cl-α-PVP | −10.1 | −7.0 | −12.6 | −4.8 | −16.1 | −11.8 |
| (17.4) | (14.4) | (12.0) | (2.9) | (7.4) | (3.0) | |
| Dihydro-mephedrone | −12.5 | −5.4 | −17.3 | −4.2 | −15.1 | −2.4 |
| (11.5) | (5.0) | (15.0) | (5.0) | (12.5) | (1.9) | |
| Dihydro-MDPV | −13.0 | −10.3 | −7.7 | 1.3 | −18.0 | −5.4 |
| (15.0) | (8.3) | (11.9) | (5.3) | (6.3) | (8.5) | |
| Dihydro-4-Cl-α-PPP | 8.8 | −3.4 | 10.8 | −4.0 | 6.8 | −6.6 |
| (15.6) | (2.3) | (10.3) | (4.3) | (14.8) | (3.1) | |
| Dihydro-4-EMC | −1.9 | −5.7 | −0.7 | 3.2 | −17.0 | −3.9 |
| (3.3) | (2.7) | (17.6) | (1.7) | (6.3) | (2.3) | |
| Dihydro-N-ethylhexedrone | −3.9 | −3.8 | 2.0 | 6.6 | −1.6 | −2.1 |
| (11.1) | (6.1) | (16.5) | (3.0) | (3.3) | (0.9) | |
| Dihydro-dibutylone | −3.8 | −7.9 | 4.8 | −6.5 | −8.6 | −8.0 |
| (11.8) | (6.8) | (13.9) | (2.0) | (21.0) | (1.8) | |
| Dihydro-N-ethylpentylone | −3.0 | −9.1 | −5.4 | −5.6 | −1.7 | −9.4 |
| (2.1) | (3.9) | (6.2) | (3.0) | (5.9) | (2.5) | |
| Dihydro-4-MPD | 3.9 | −5.3 | 0.7 | −2.2 | 1.6 | −7.9 |
| (13.8) | (10.9) | (15.1) | (2.9) | (8.5) | (1.1) | |
| Dihydro-4-CEC | −3.2 | −4.7 | 5.5 | −1.8 | −3.0 | −4.1 |
| (11.1) | (5.3) | (4.0) | (2.8) | (6.1) | (2.0) | |
| Dihydro-4-F-PHP | −8.8 | −12.7 | −3.3 | −9.2 | −5.4 | −10.9 |
| (6.3) | (13.0) | (11.8) | (7.7) | (12.5) | (1.9) |
| Sample No. | Detected Target Analytes (ng/mL) | Other Stimulant Findings (Qualitative Screening) |
|---|---|---|
| 19 | Dihydro-mephedrone (metabolite): 172 | Methamphetamine (+) * |
| 34 | N-ethylpentylone: 52; dihydro-N-ethylpentylone (metabolite); 1378 | Methamphetamine (+++) * |
| 49 | Mephedrone: 1537; dihydro-mephedrone (metabolite): >5000 | Methamphetamine (+++); MDMA (+) * |
Publisher’s Note: MDPI stays neutral with regard to jurisdictional claims in published maps and institutional affiliations. |
© 2022 by the authors. Licensee MDPI, Basel, Switzerland. This article is an open access article distributed under the terms and conditions of the Creative Commons Attribution (CC BY) license (https://creativecommons.org/licenses/by/4.0/).
Share and Cite
Aldubayyan, A.A.; Castrignanò, E.; Elliott, S.; Abbate, V. A Quantitative LC–MS/MS Method for the Detection of 16 Synthetic Cathinones and 10 Metabolites and Its Application to Suspicious Clinical and Forensic Urine Samples. Pharmaceuticals 2022, 15, 510. https://doi.org/10.3390/ph15050510
Aldubayyan AA, Castrignanò E, Elliott S, Abbate V. A Quantitative LC–MS/MS Method for the Detection of 16 Synthetic Cathinones and 10 Metabolites and Its Application to Suspicious Clinical and Forensic Urine Samples. Pharmaceuticals. 2022; 15(5):510. https://doi.org/10.3390/ph15050510
Chicago/Turabian StyleAldubayyan, Abdulaziz A., Erika Castrignanò, Simon Elliott, and Vincenzo Abbate. 2022. "A Quantitative LC–MS/MS Method for the Detection of 16 Synthetic Cathinones and 10 Metabolites and Its Application to Suspicious Clinical and Forensic Urine Samples" Pharmaceuticals 15, no. 5: 510. https://doi.org/10.3390/ph15050510