
The Development of Positron Emission Tomography Tracers for In Vivo Targeting the Kinase Domain of the Epidermal Growth Factor Receptor

 ,
,
Abstract
:1. Introduction
1.1. EGFR and the Erb Receptor Family
1.2. Role of EGFR in Cancer
1.3. PET Imaging
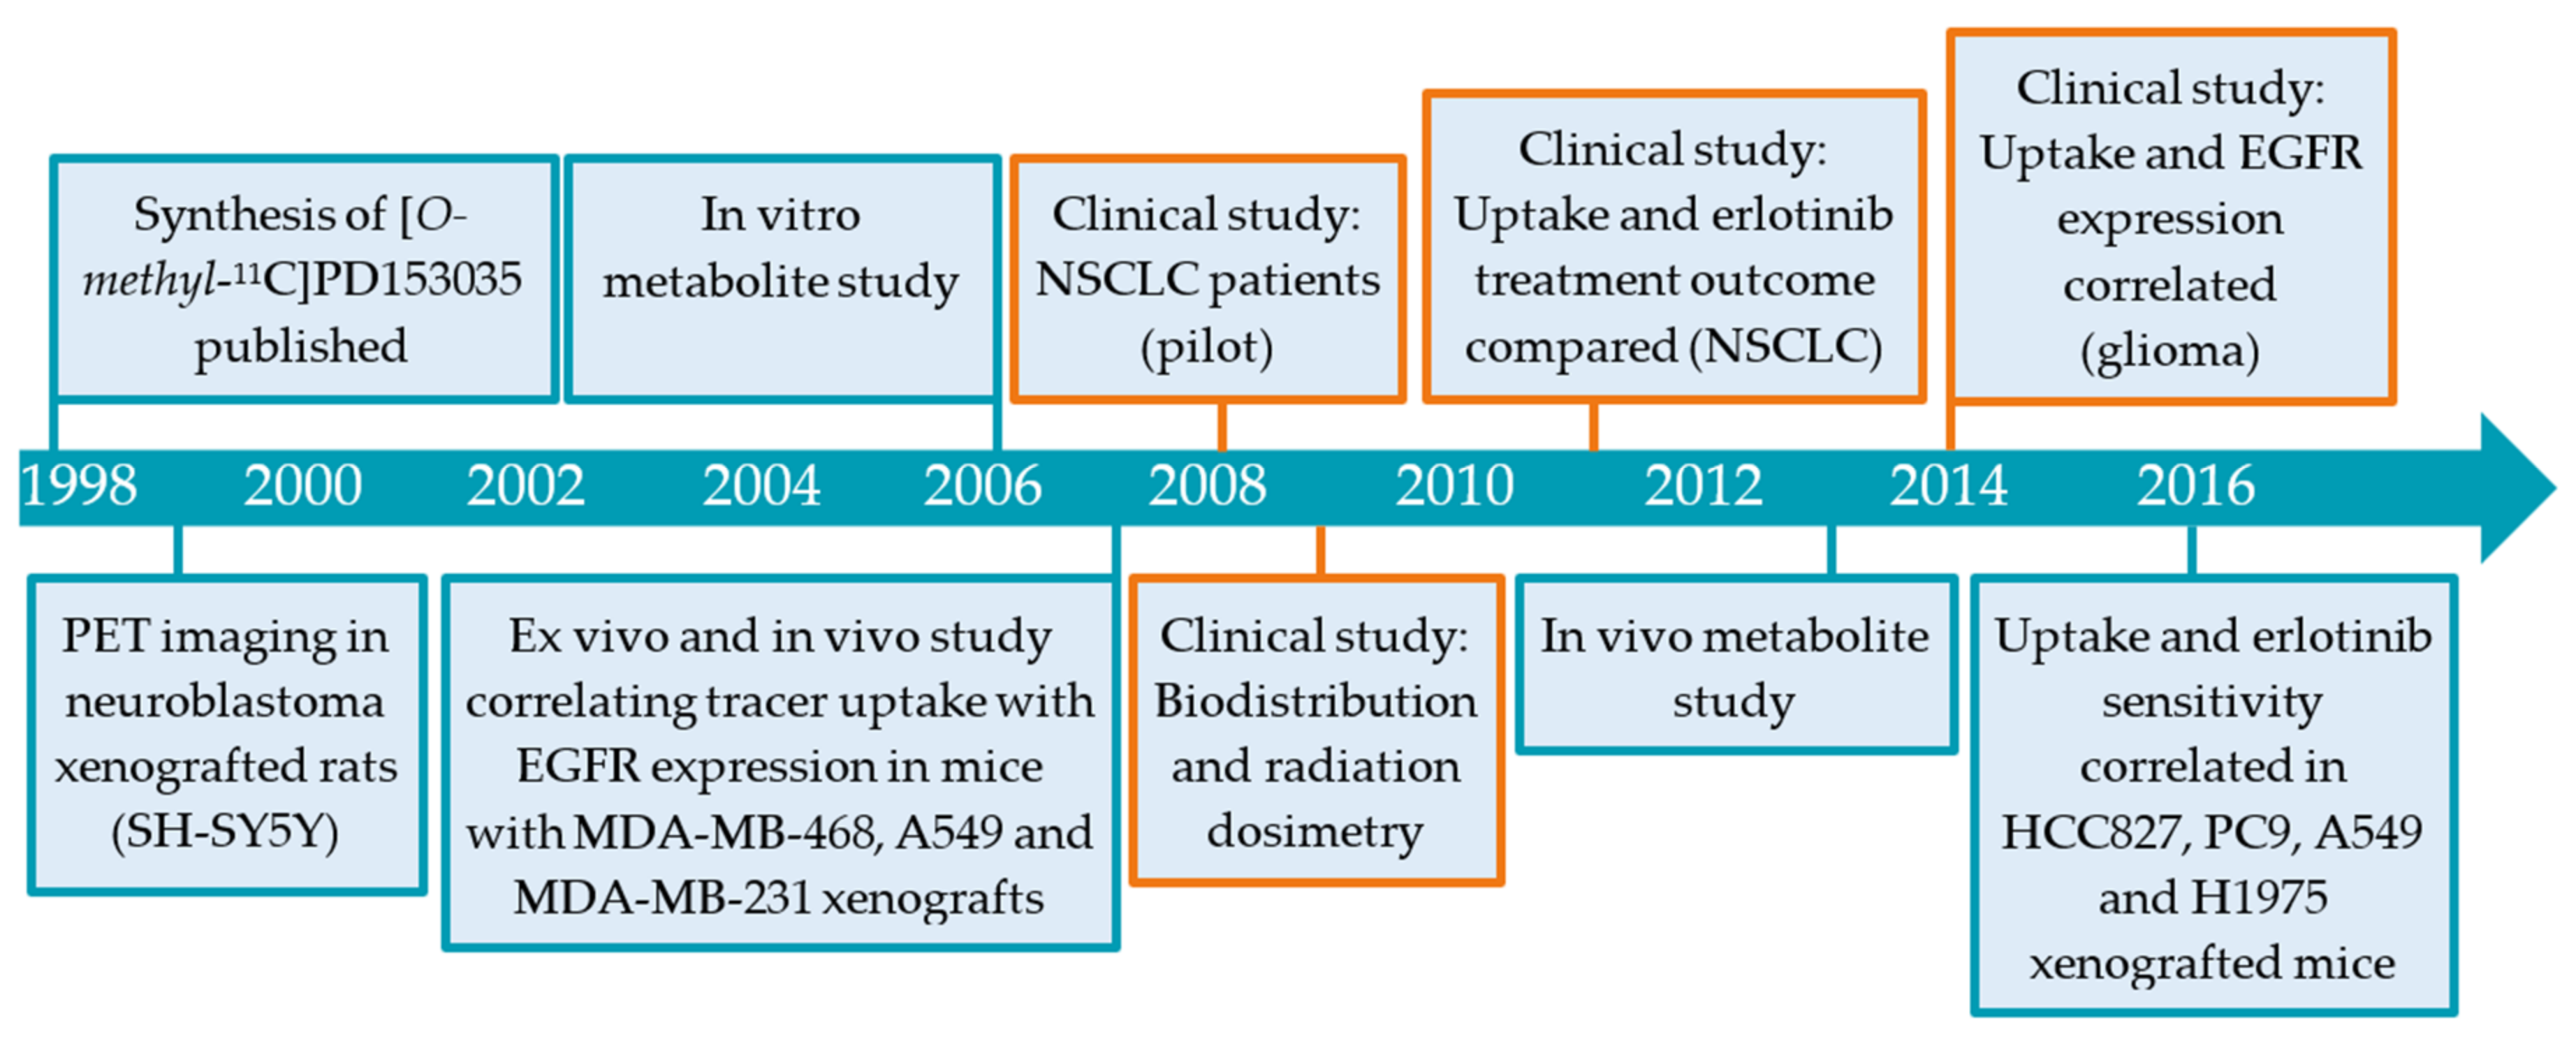
2. EGFR TKI PET Tracer Development
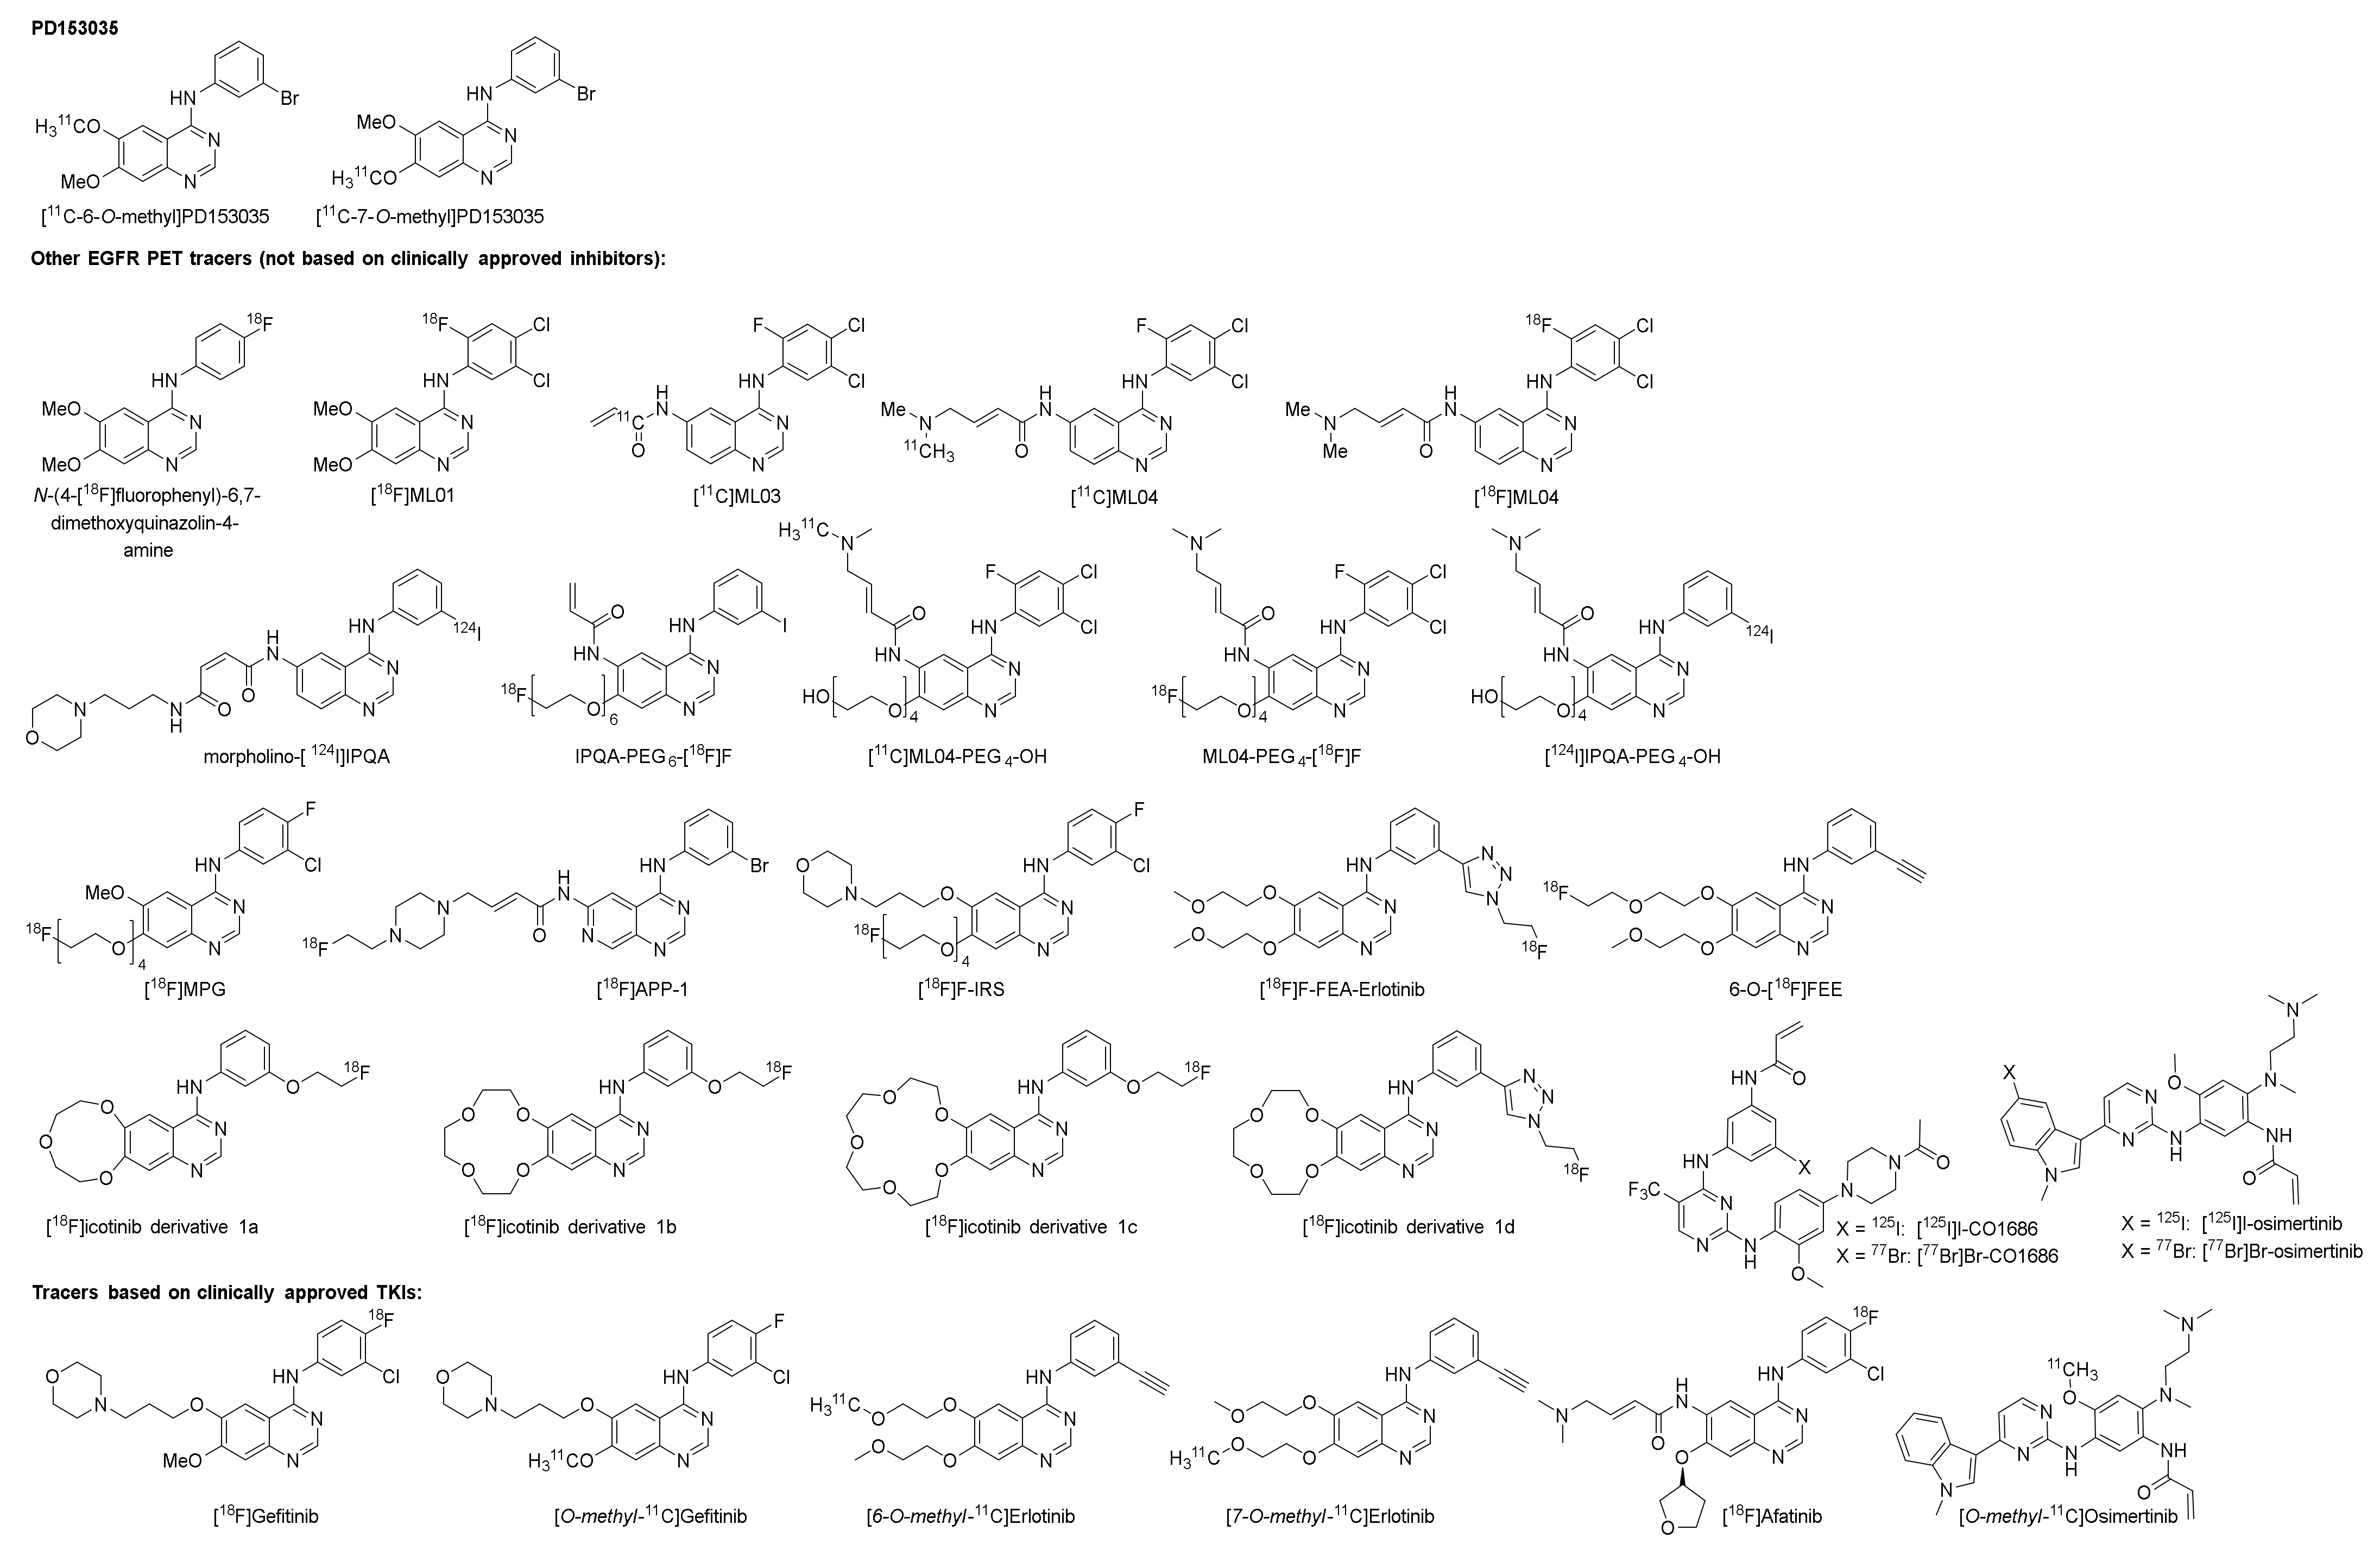
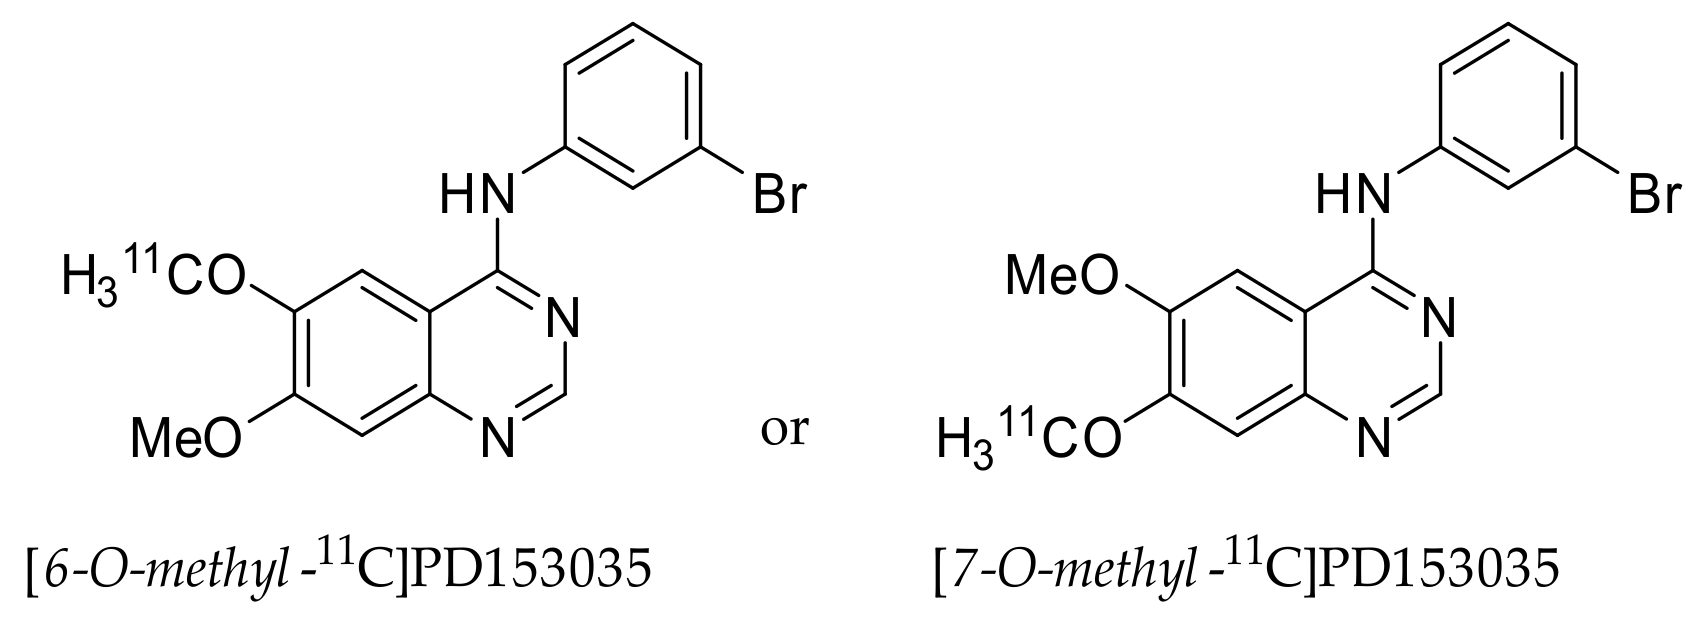
2.1. [11C]PD153035
2.1.1. Preclinical Development of [O-methyl-11C]PD153035
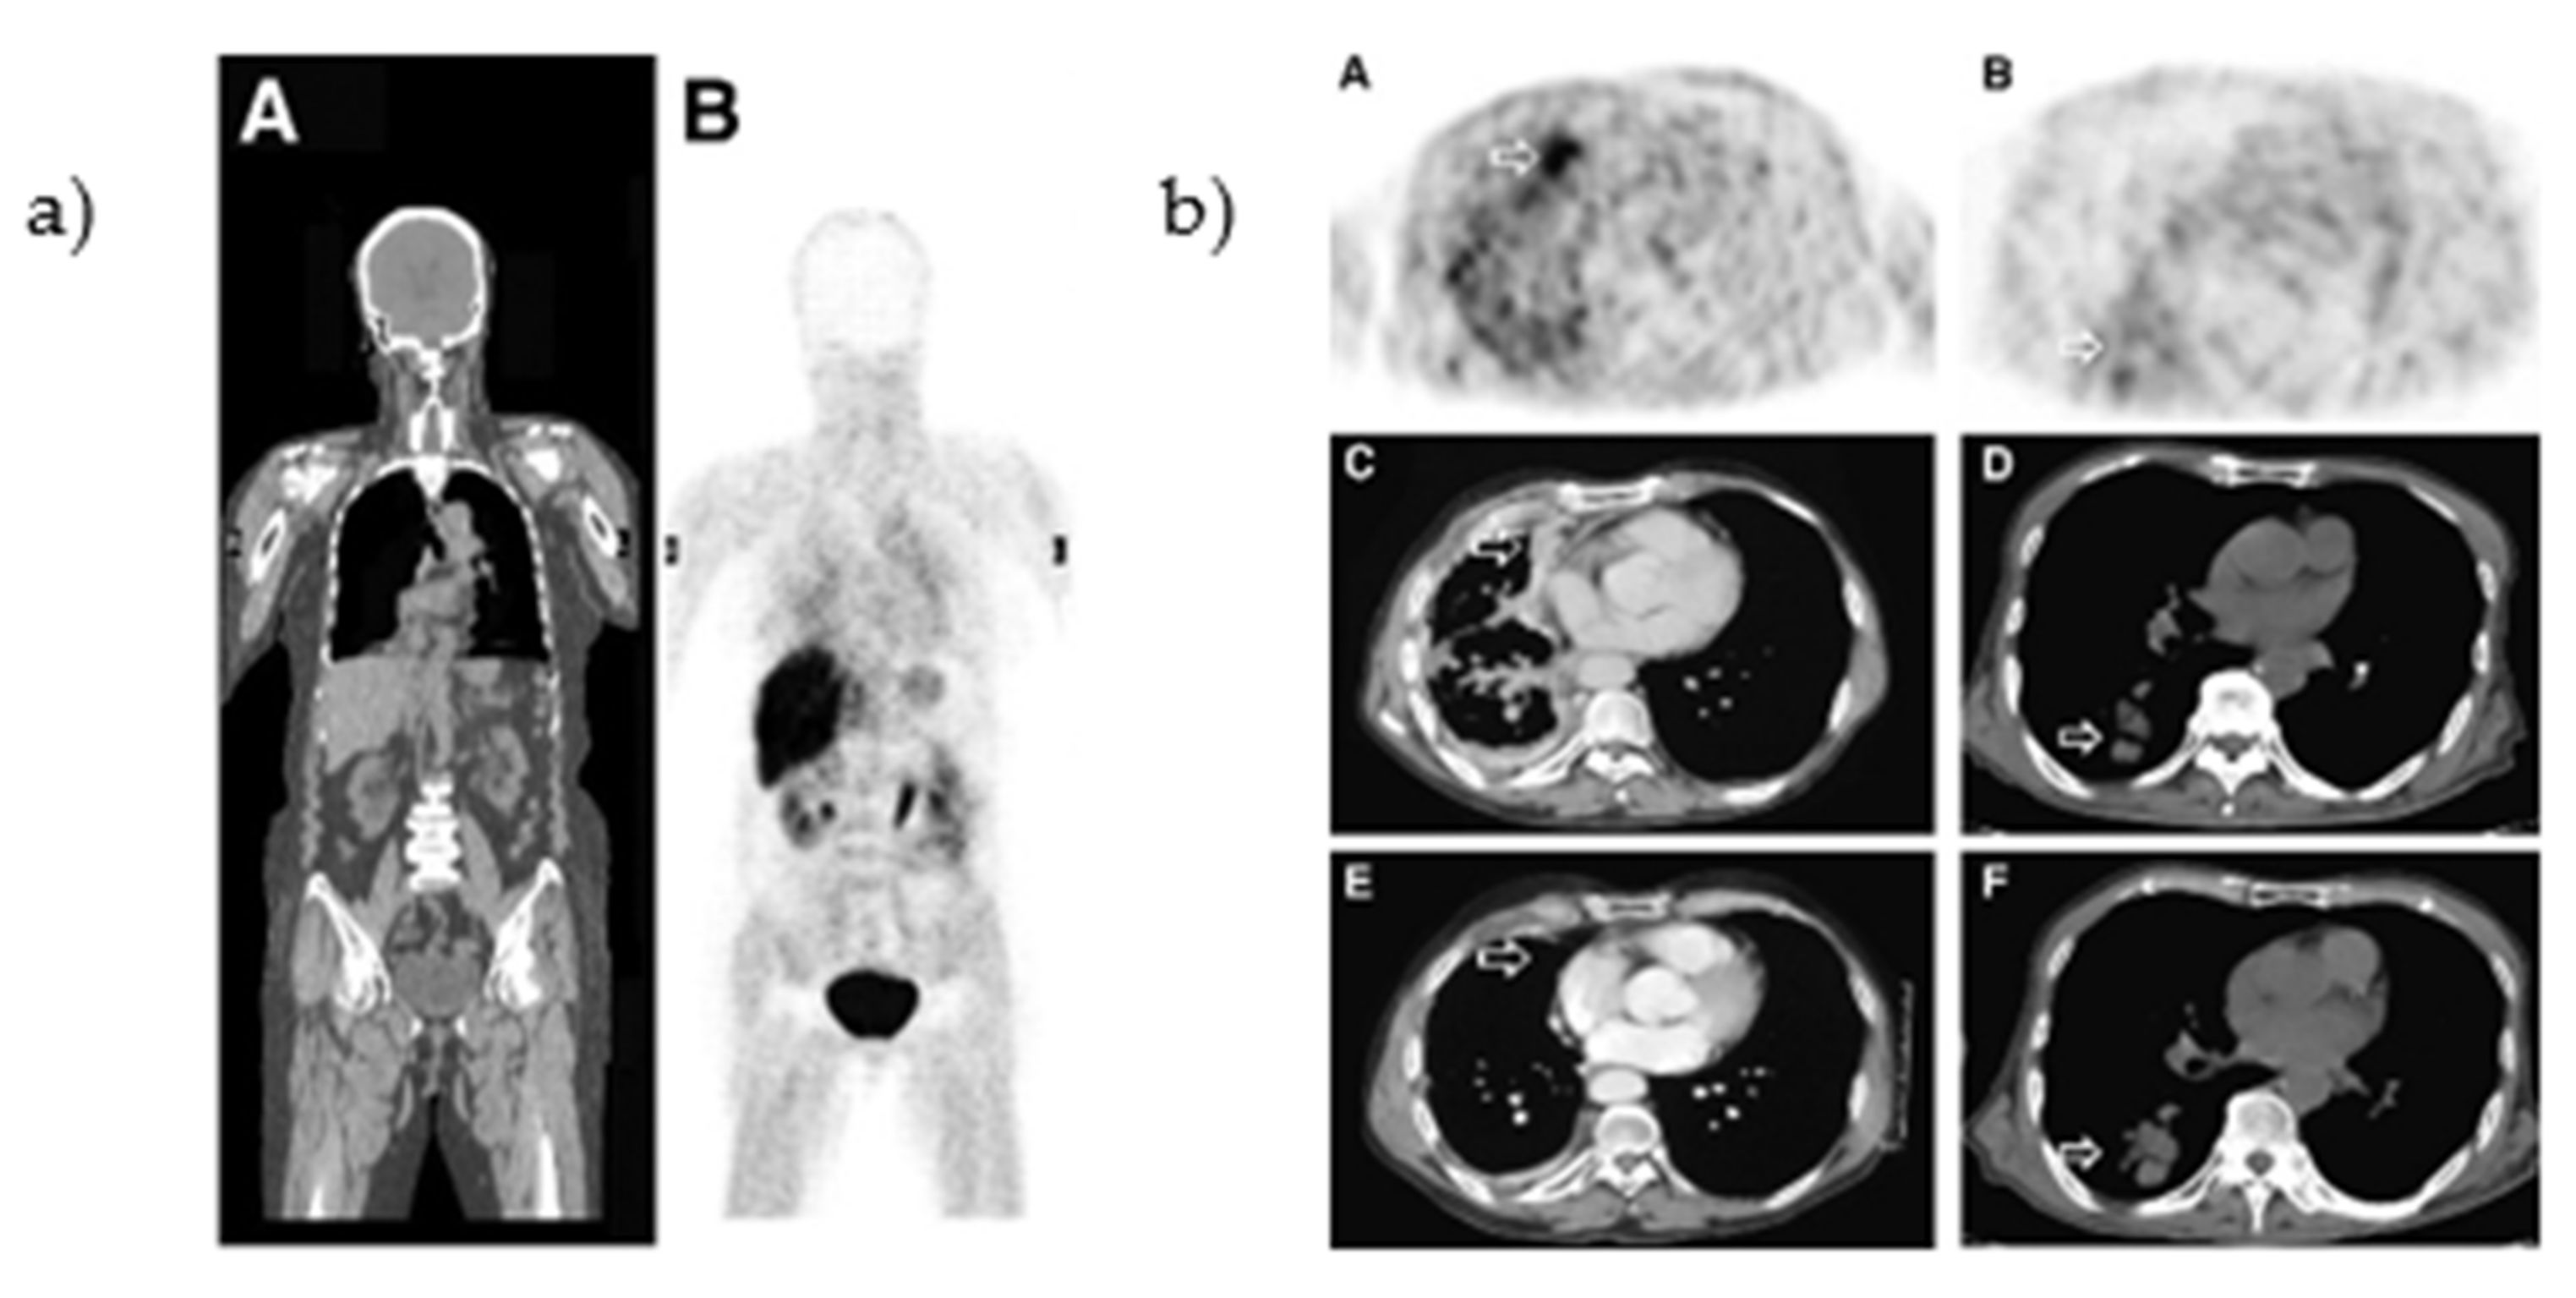
2.1.2. Clinical Evaluation [O-methyl-11C]PD153035
2.1.3. Limitations in [O-methyl-11C]PD153035 Evaluation Interpretation
2.2. Other EGFR TKI PET Tracers (Not Based on Clinically Approved Inhibitors)
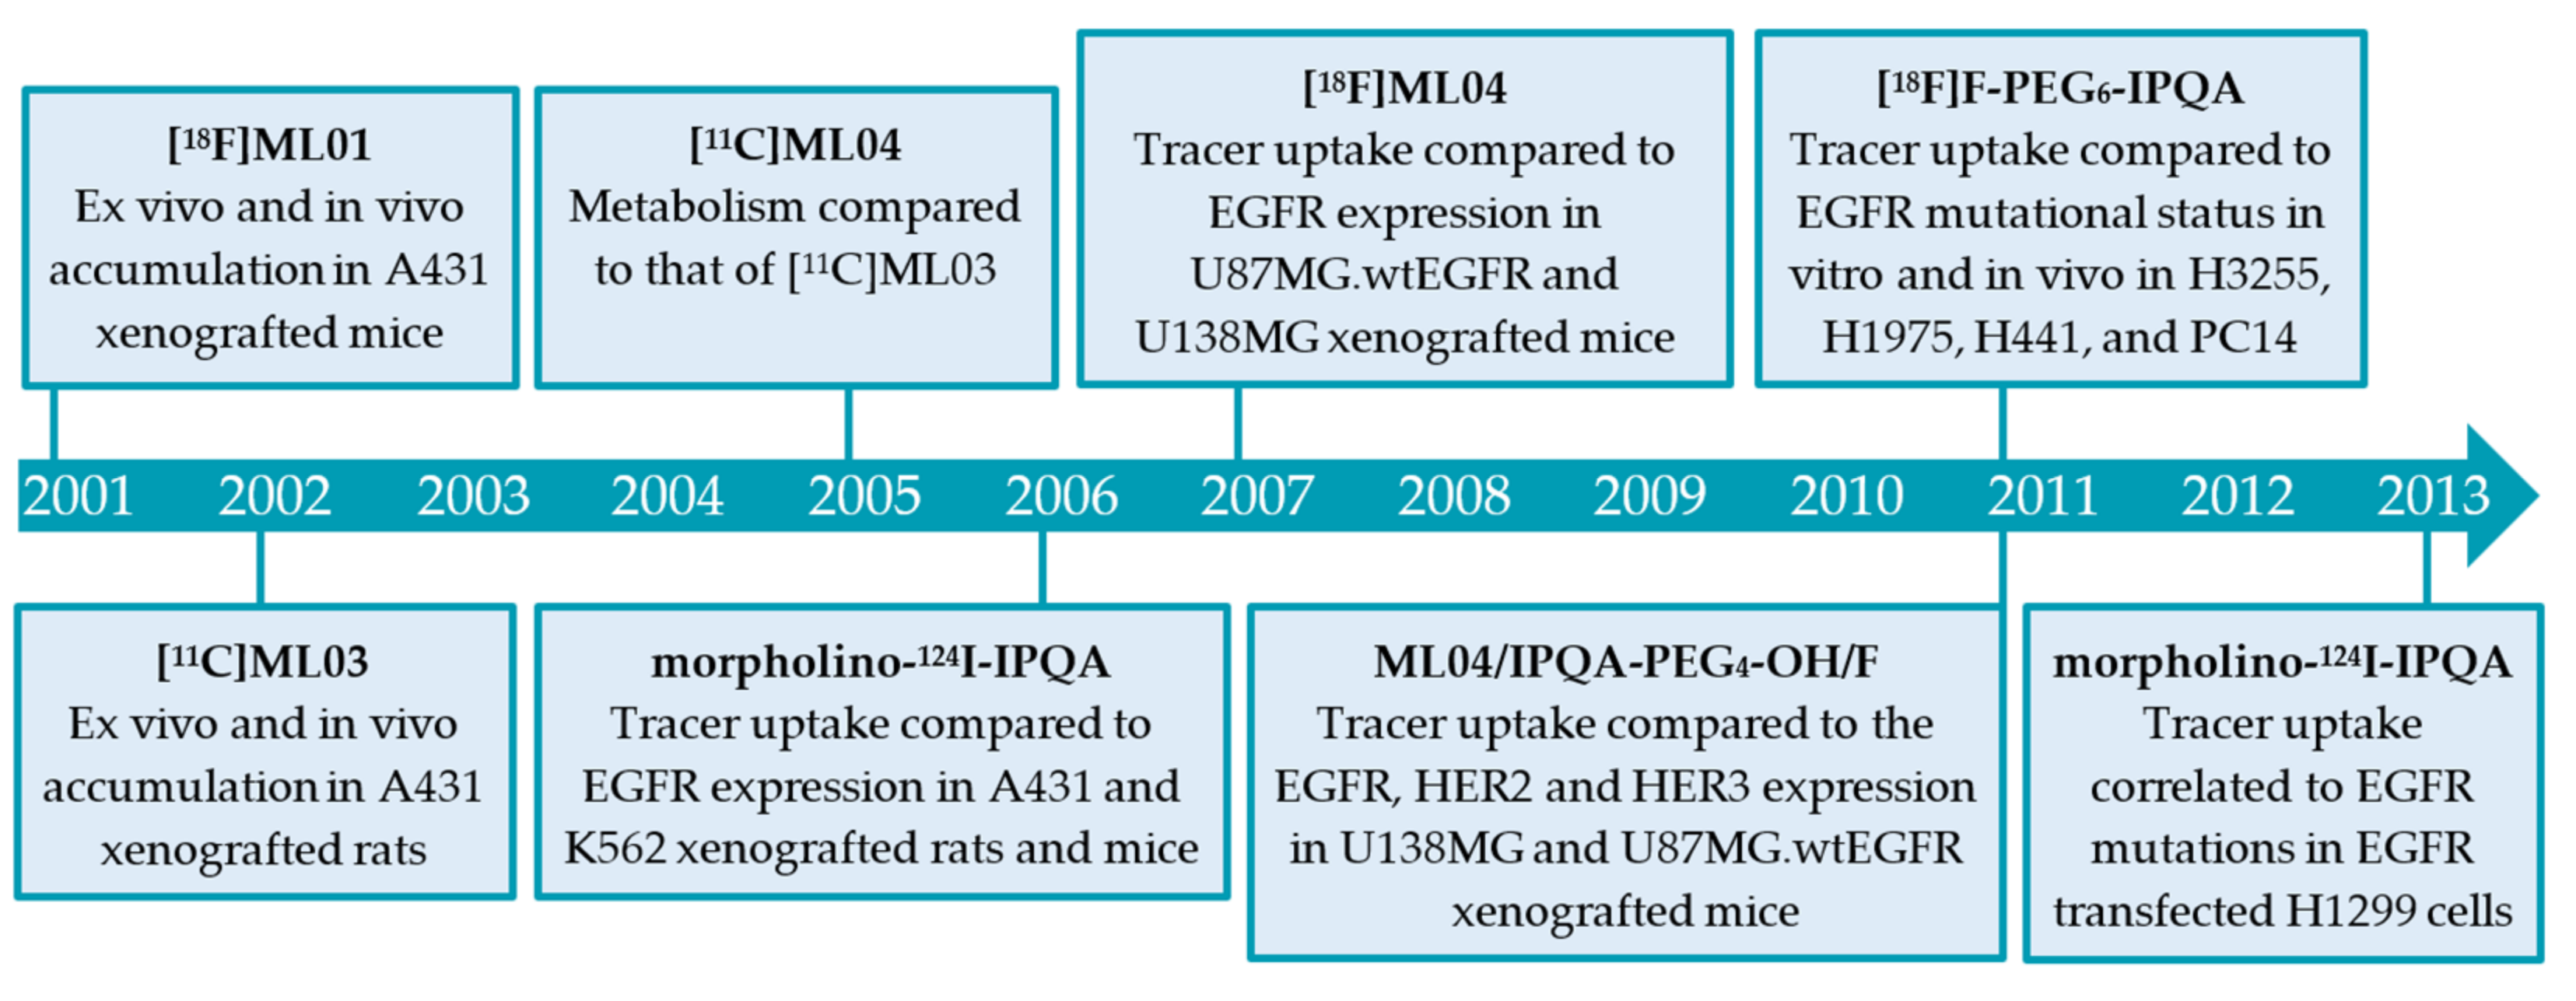
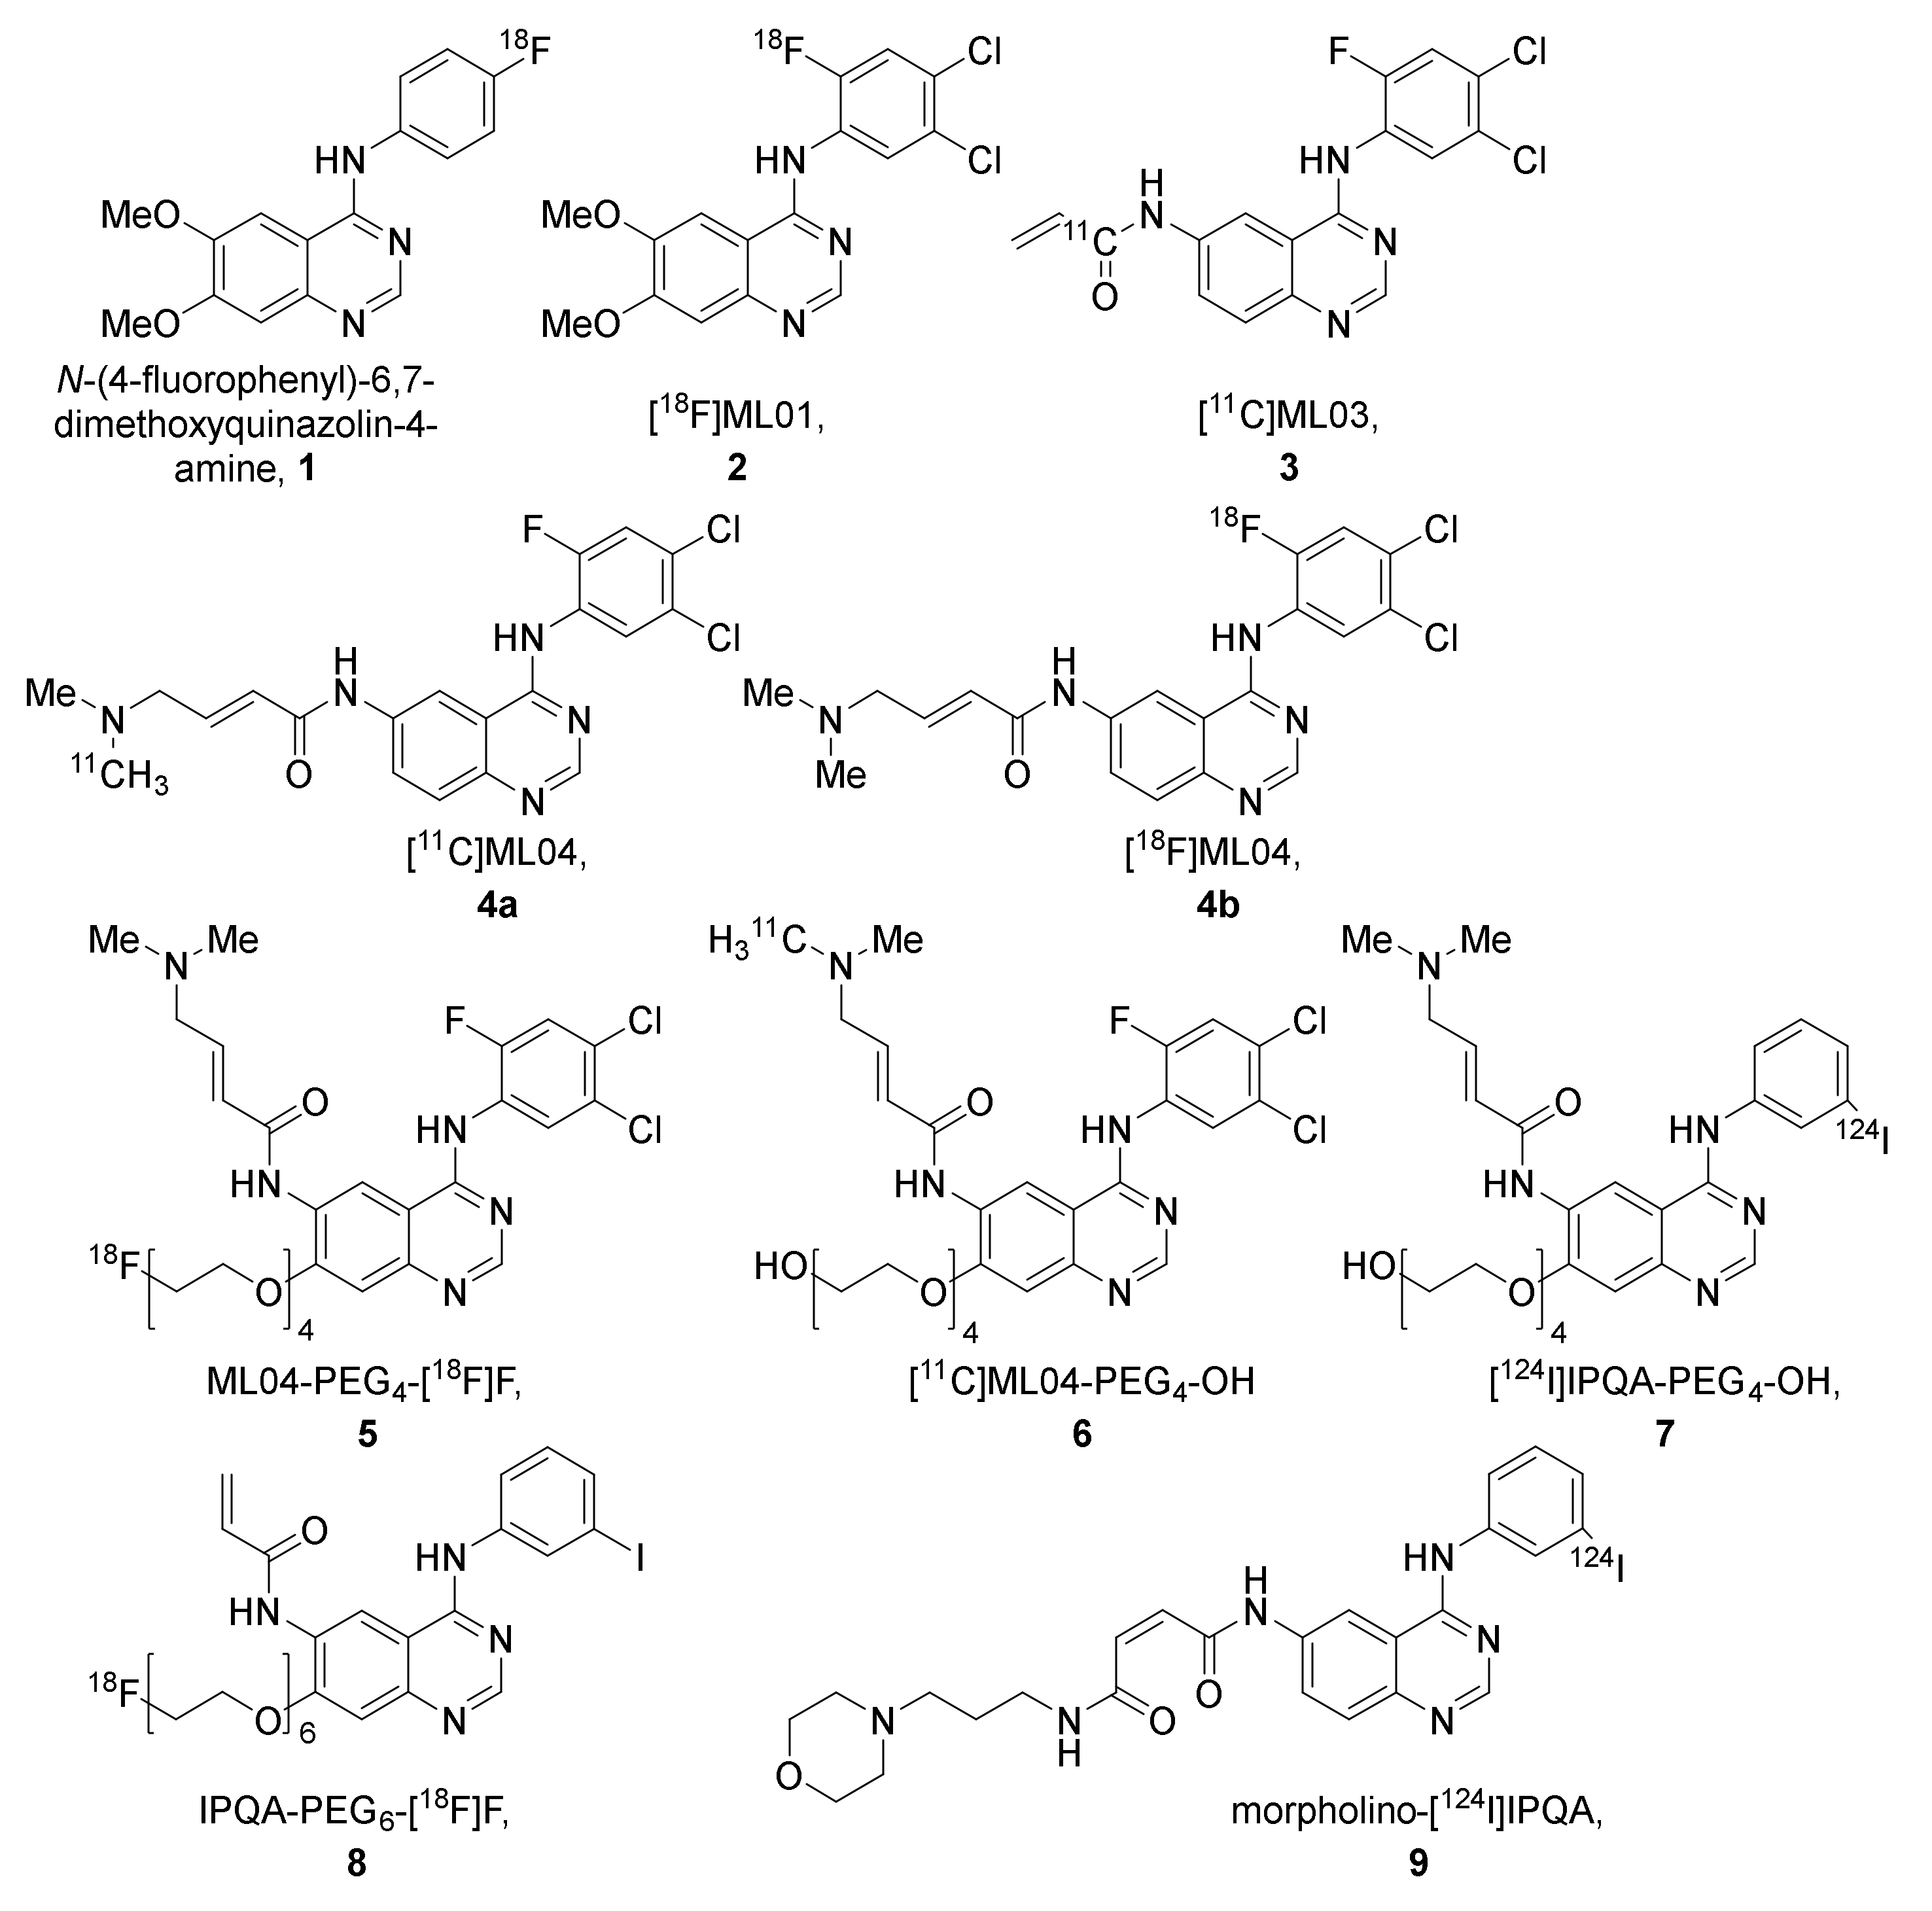
2.2.1. The ML-Series
2.2.2. The IPQA-Series
2.2.3. Derivatives of PD153035, Gefitinib, Erlotinib, Icotinib, and Rociletinib
2.3. Isotopologue Labelled Tracers of Clinically Approved TKIs
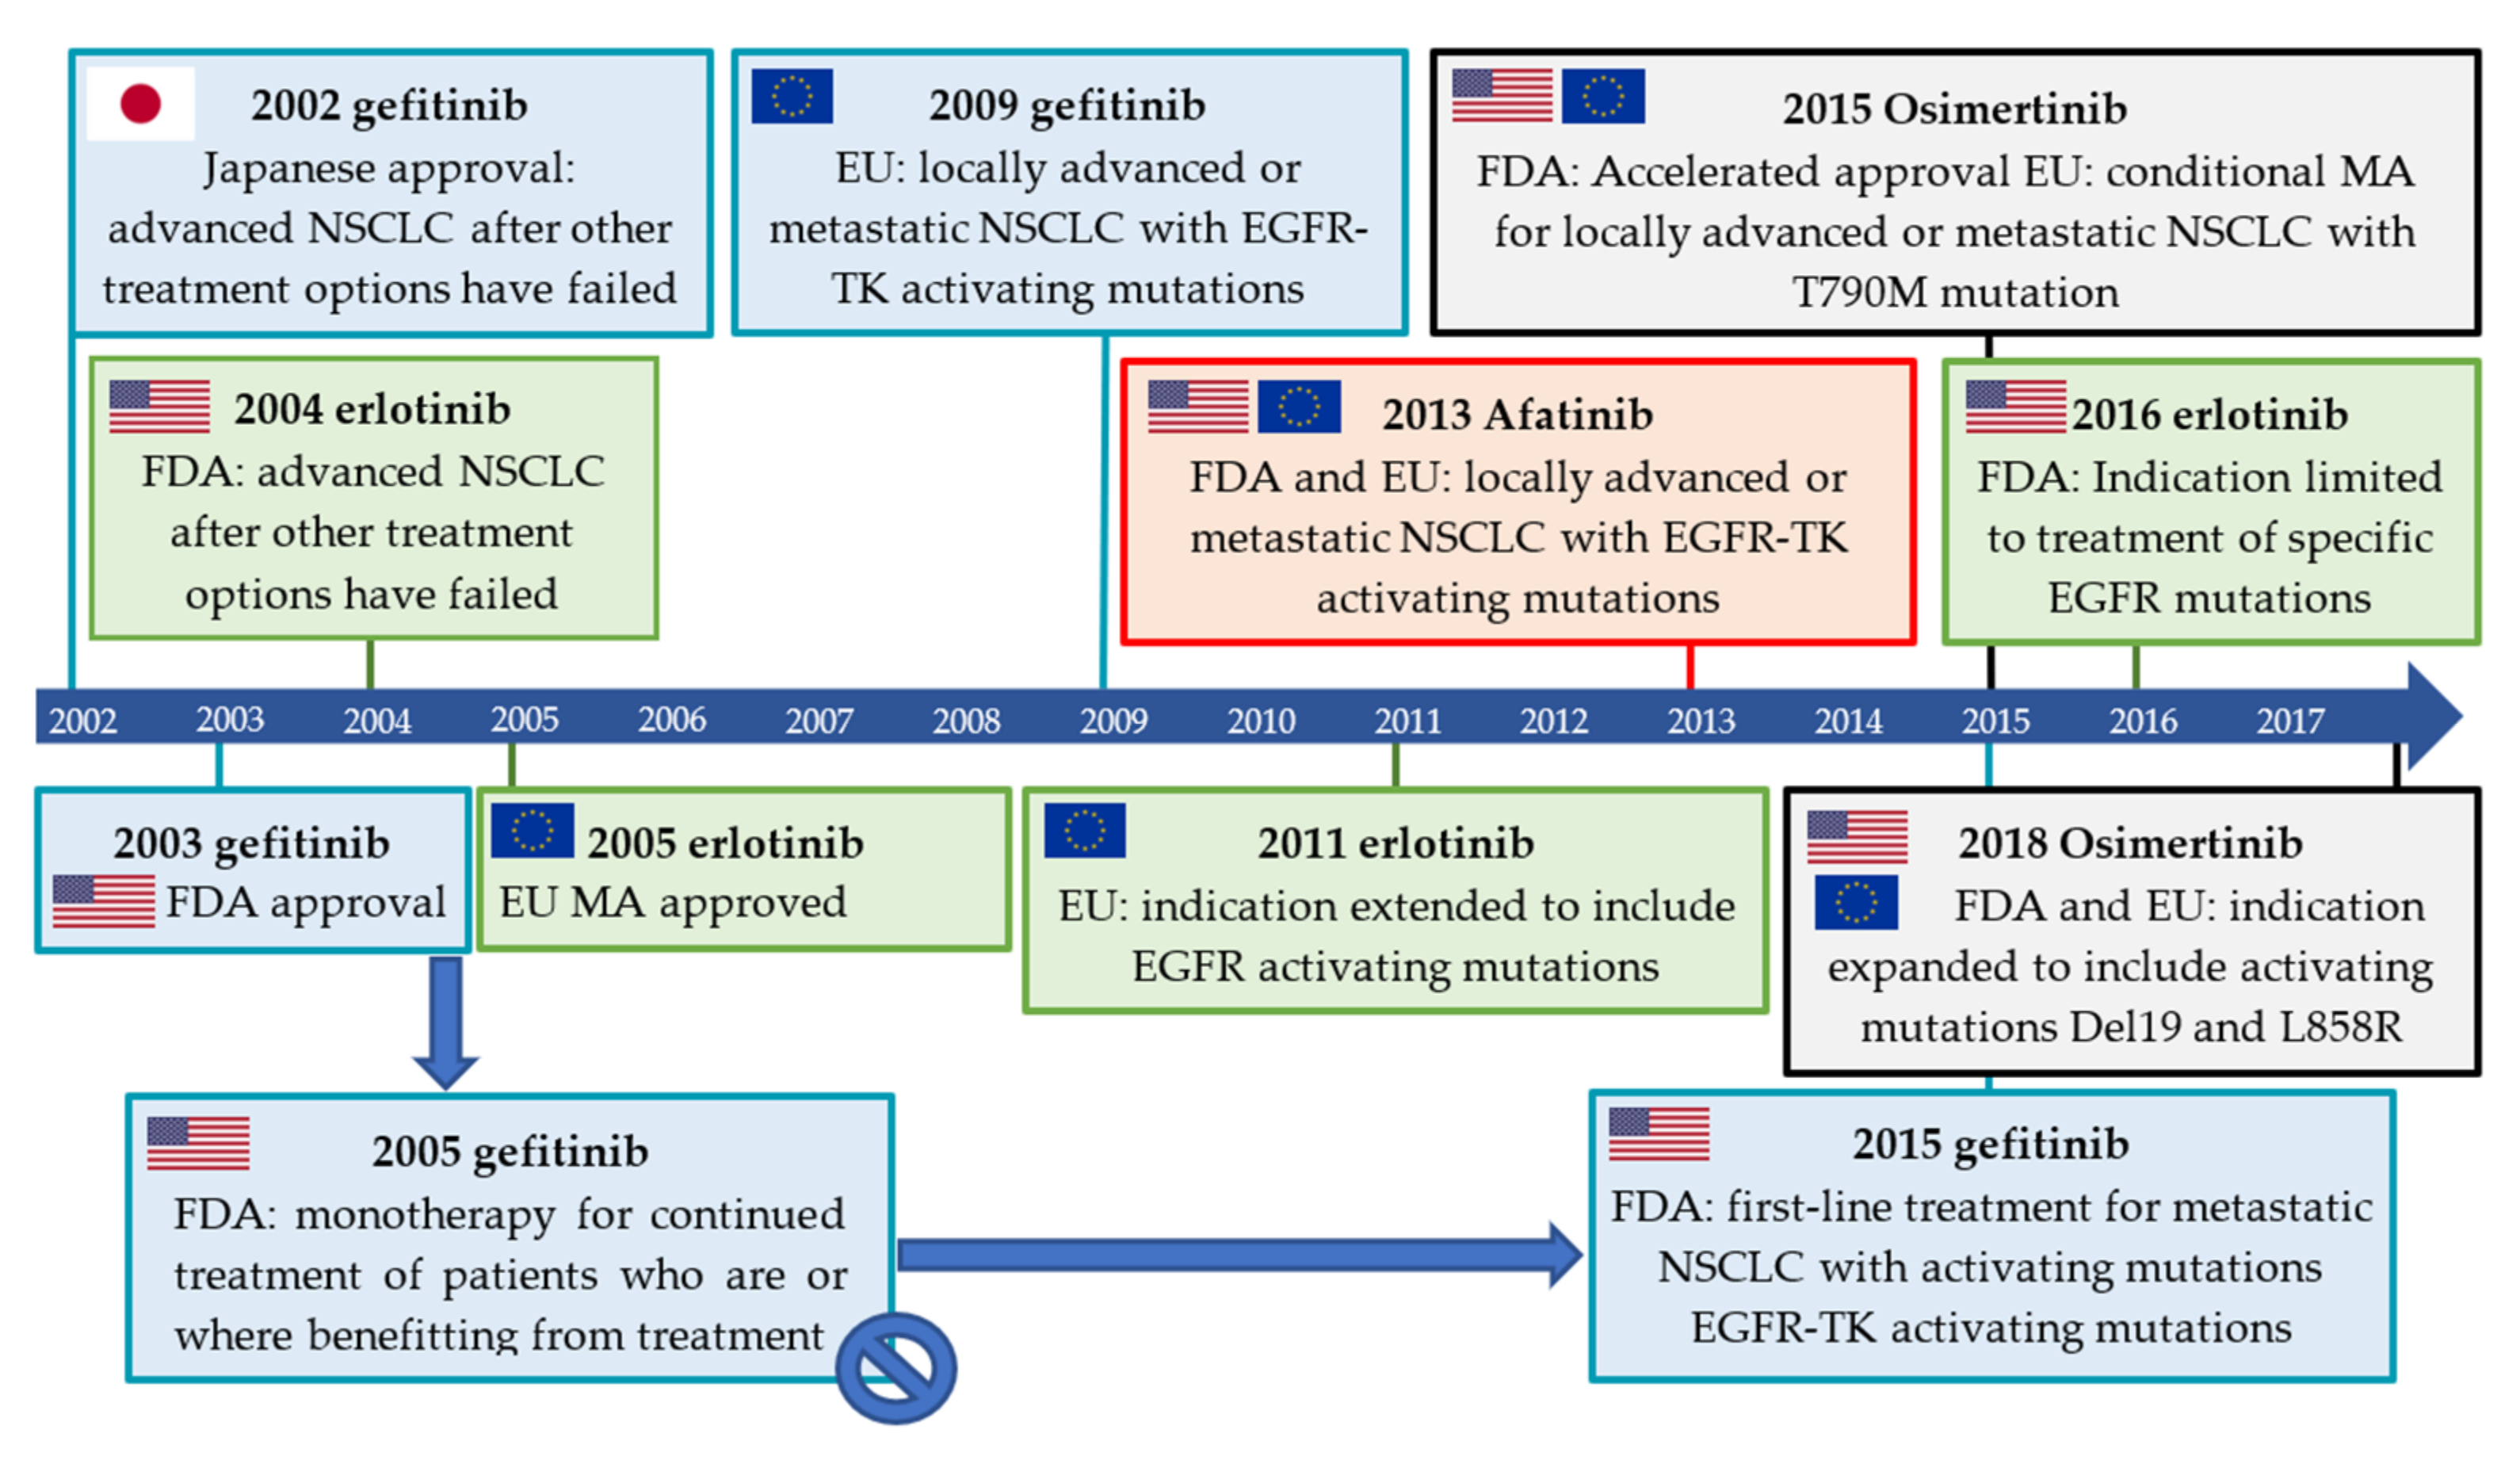
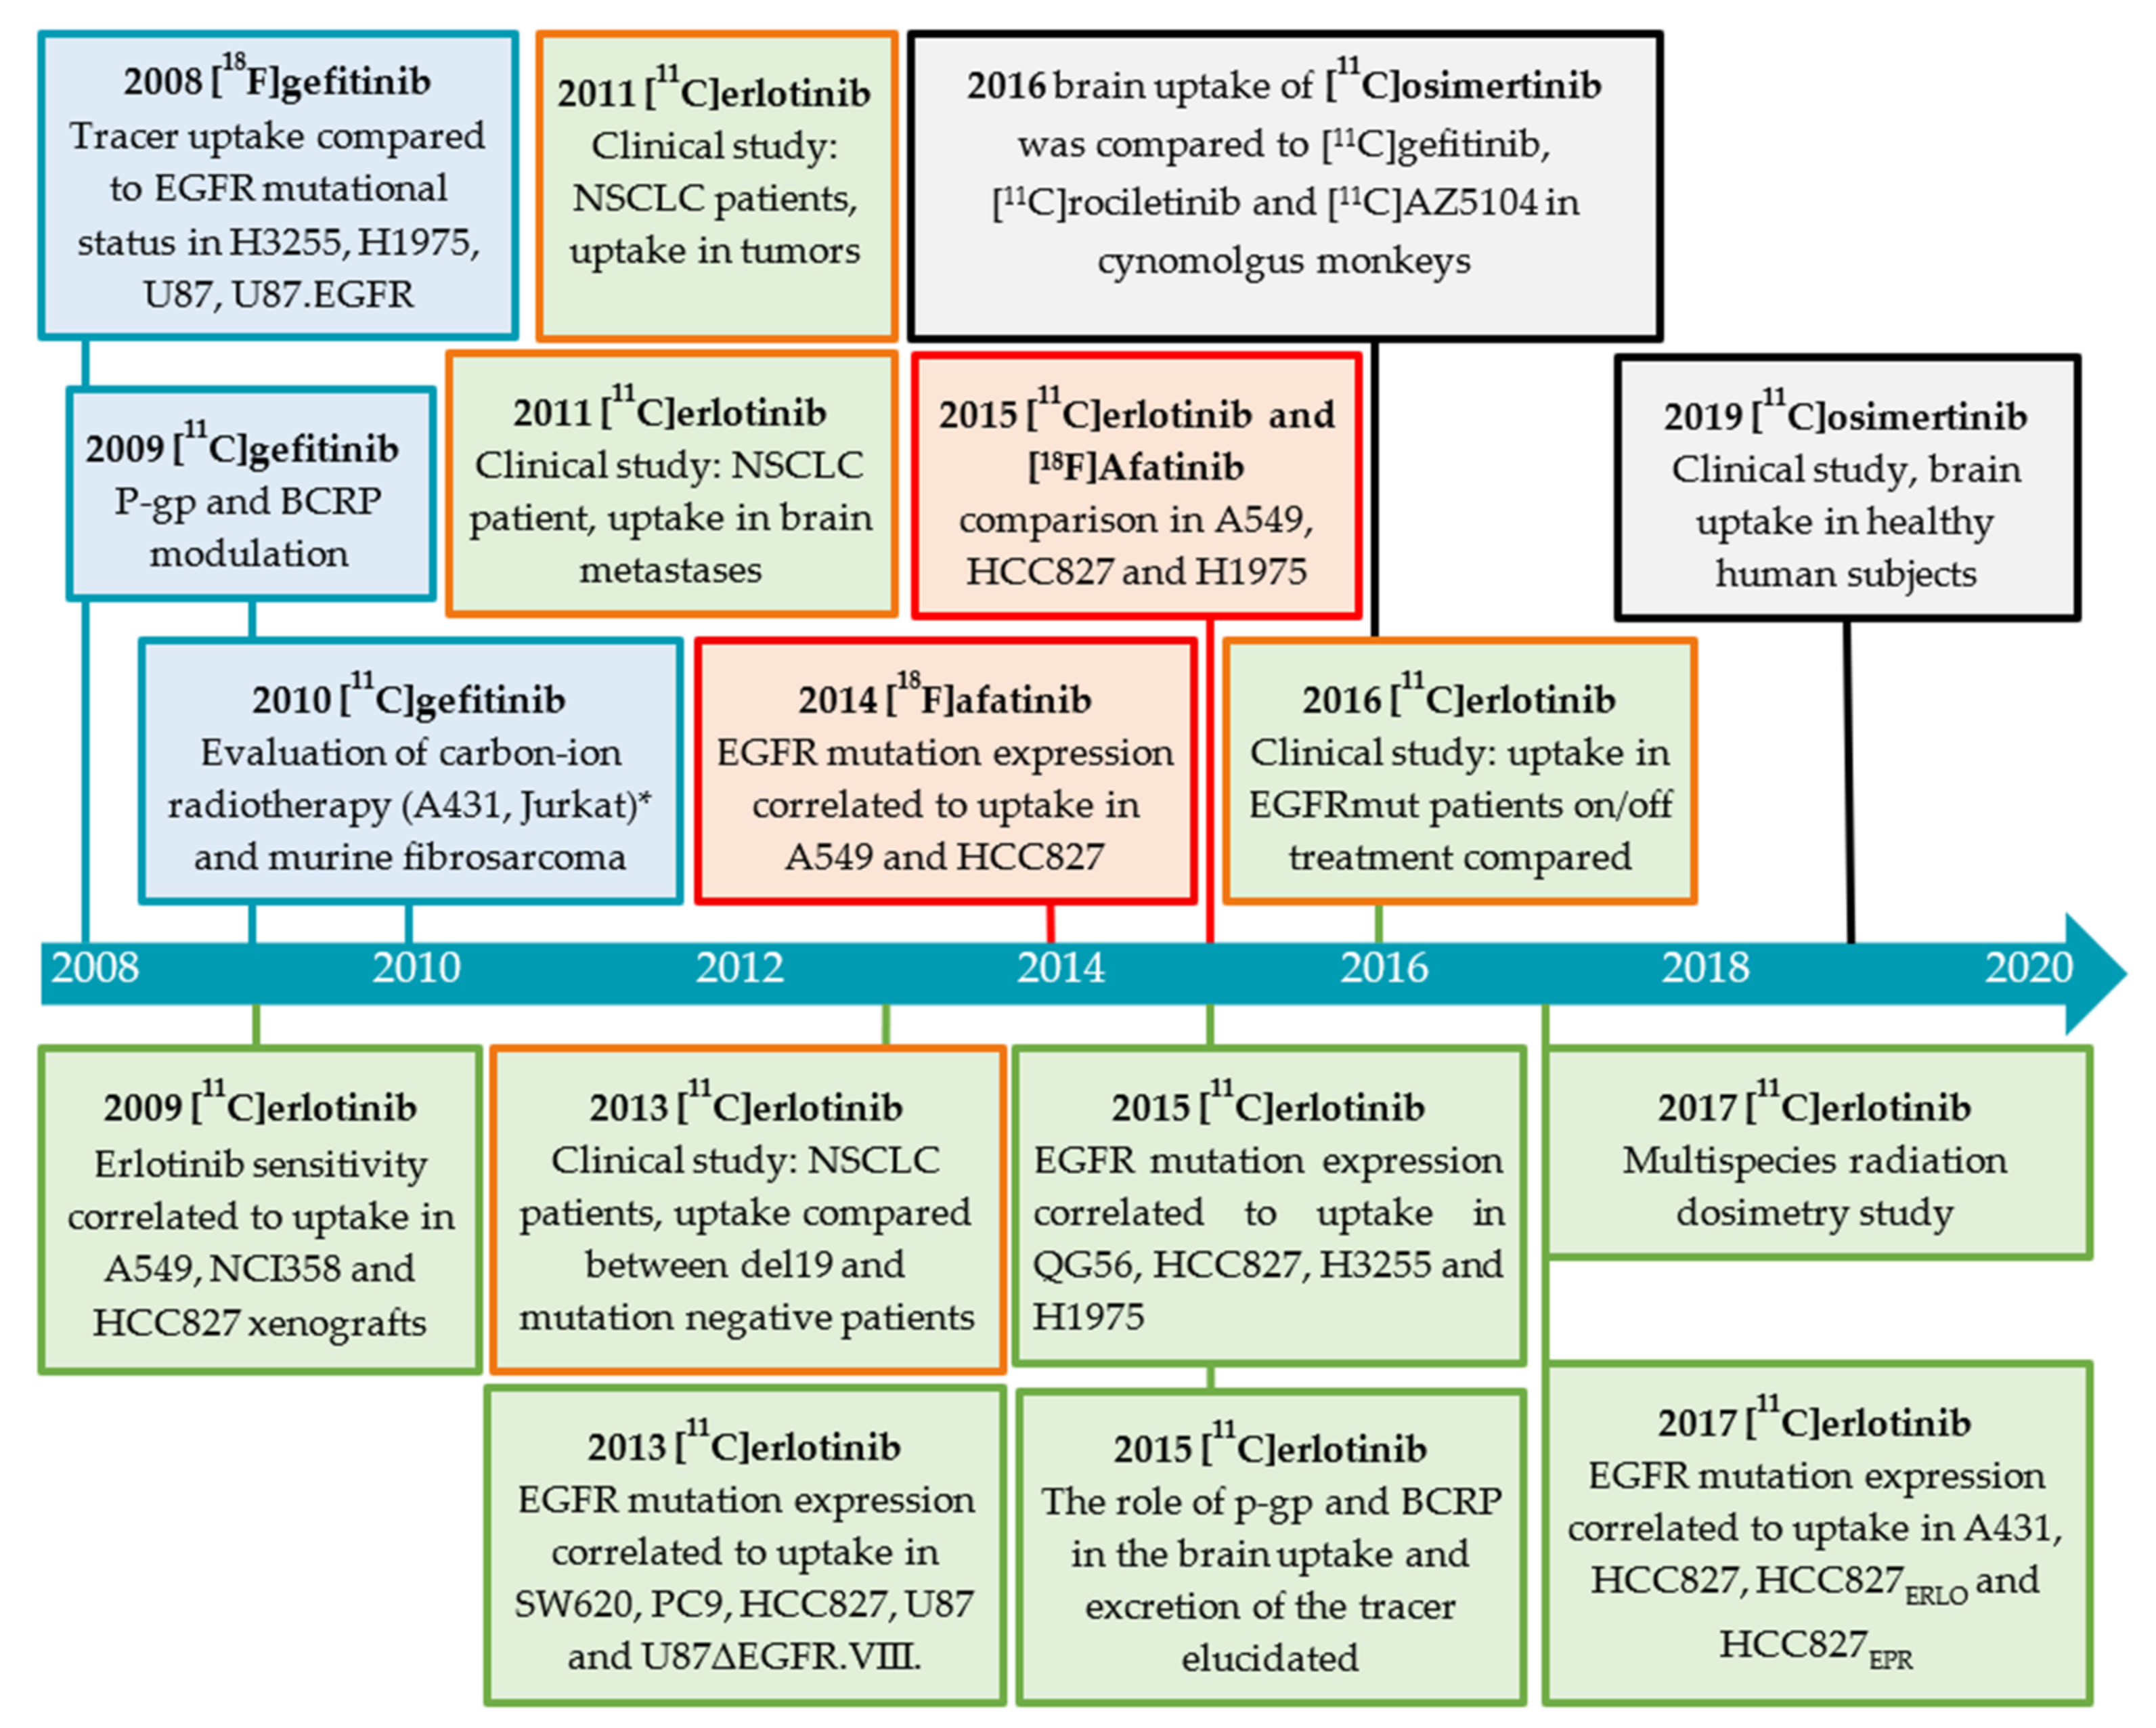
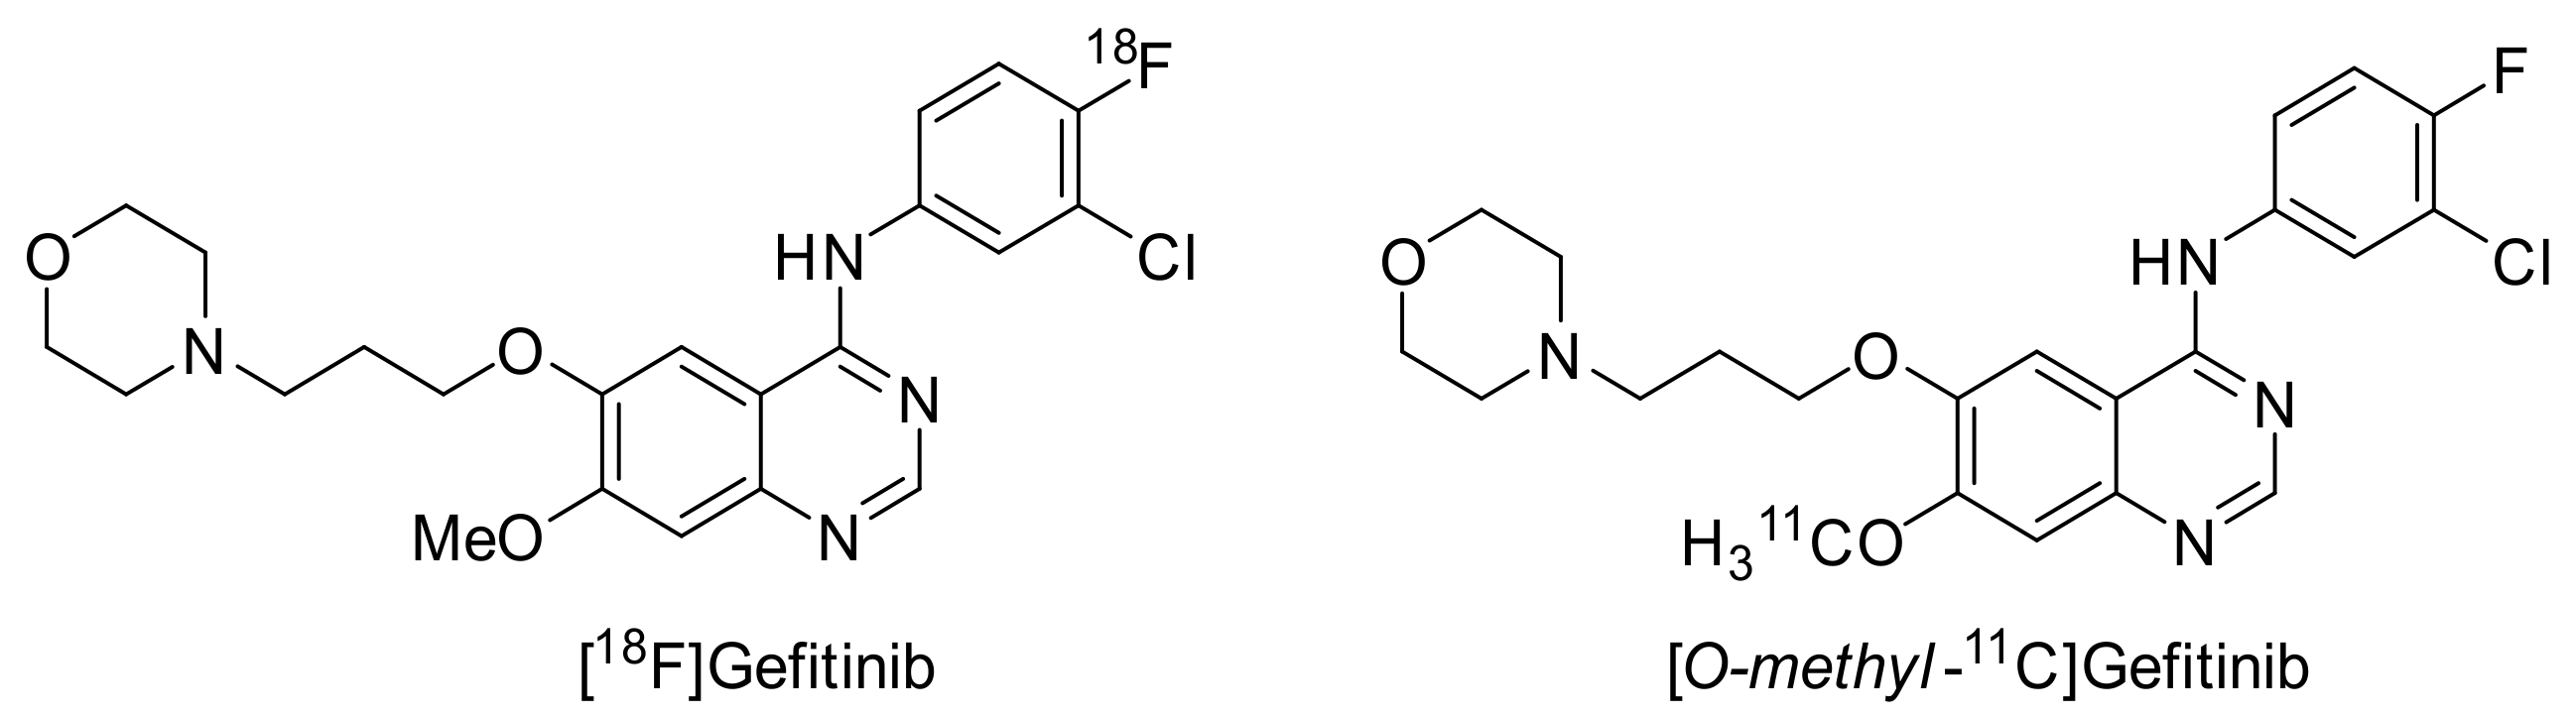
2.3.1. Gefitinib
Preclinical Investigations
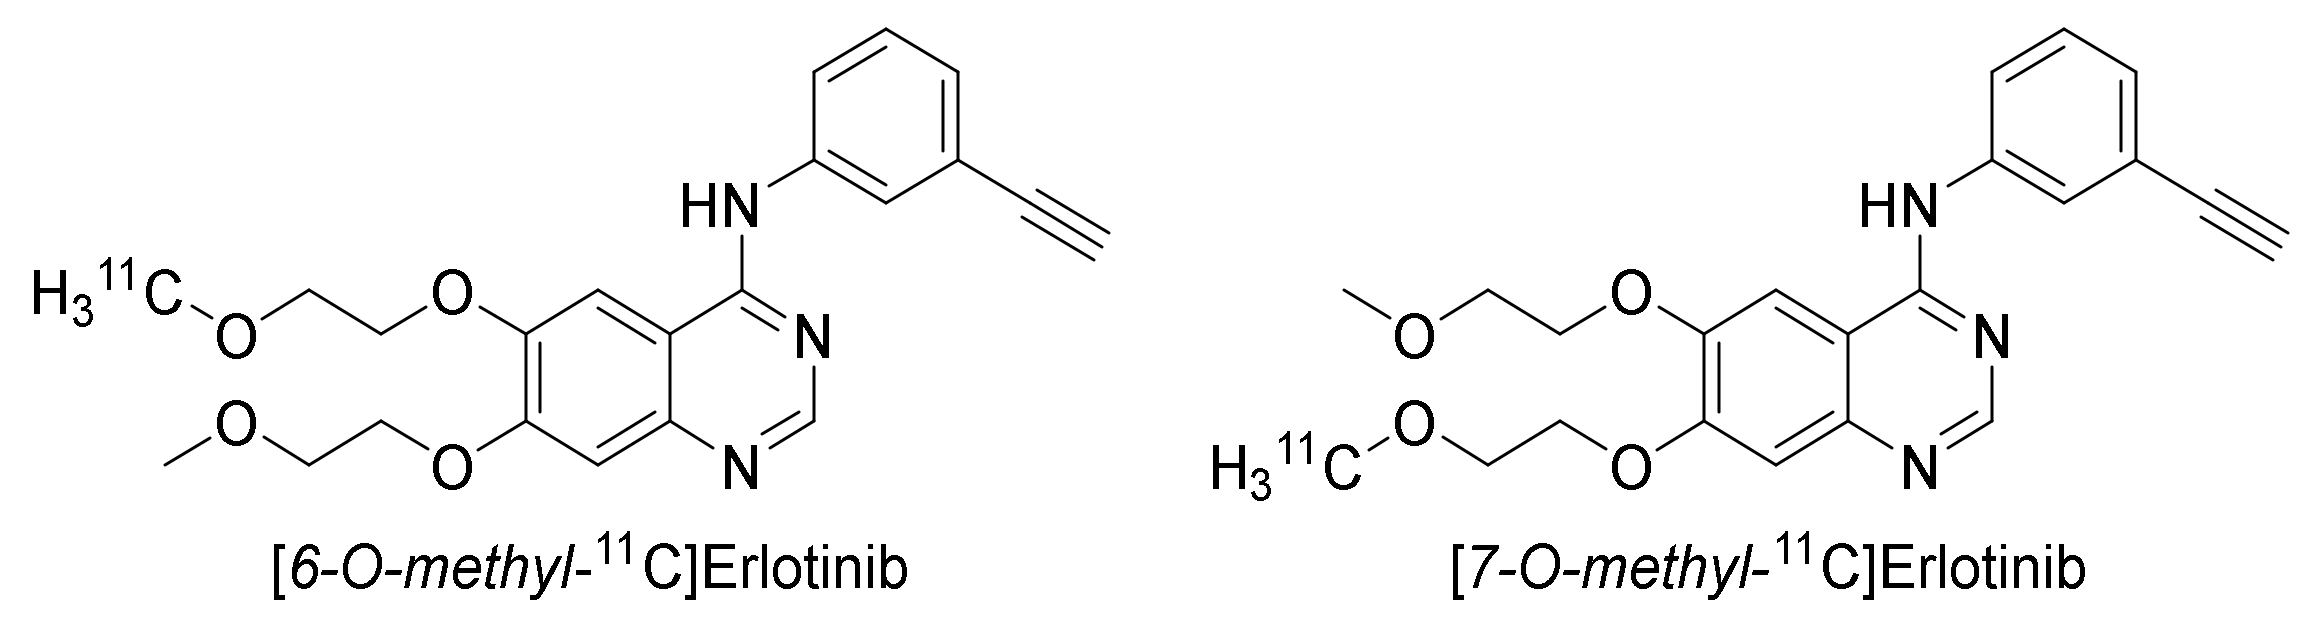
2.3.2. Erlotinib
Preclinical Investigations
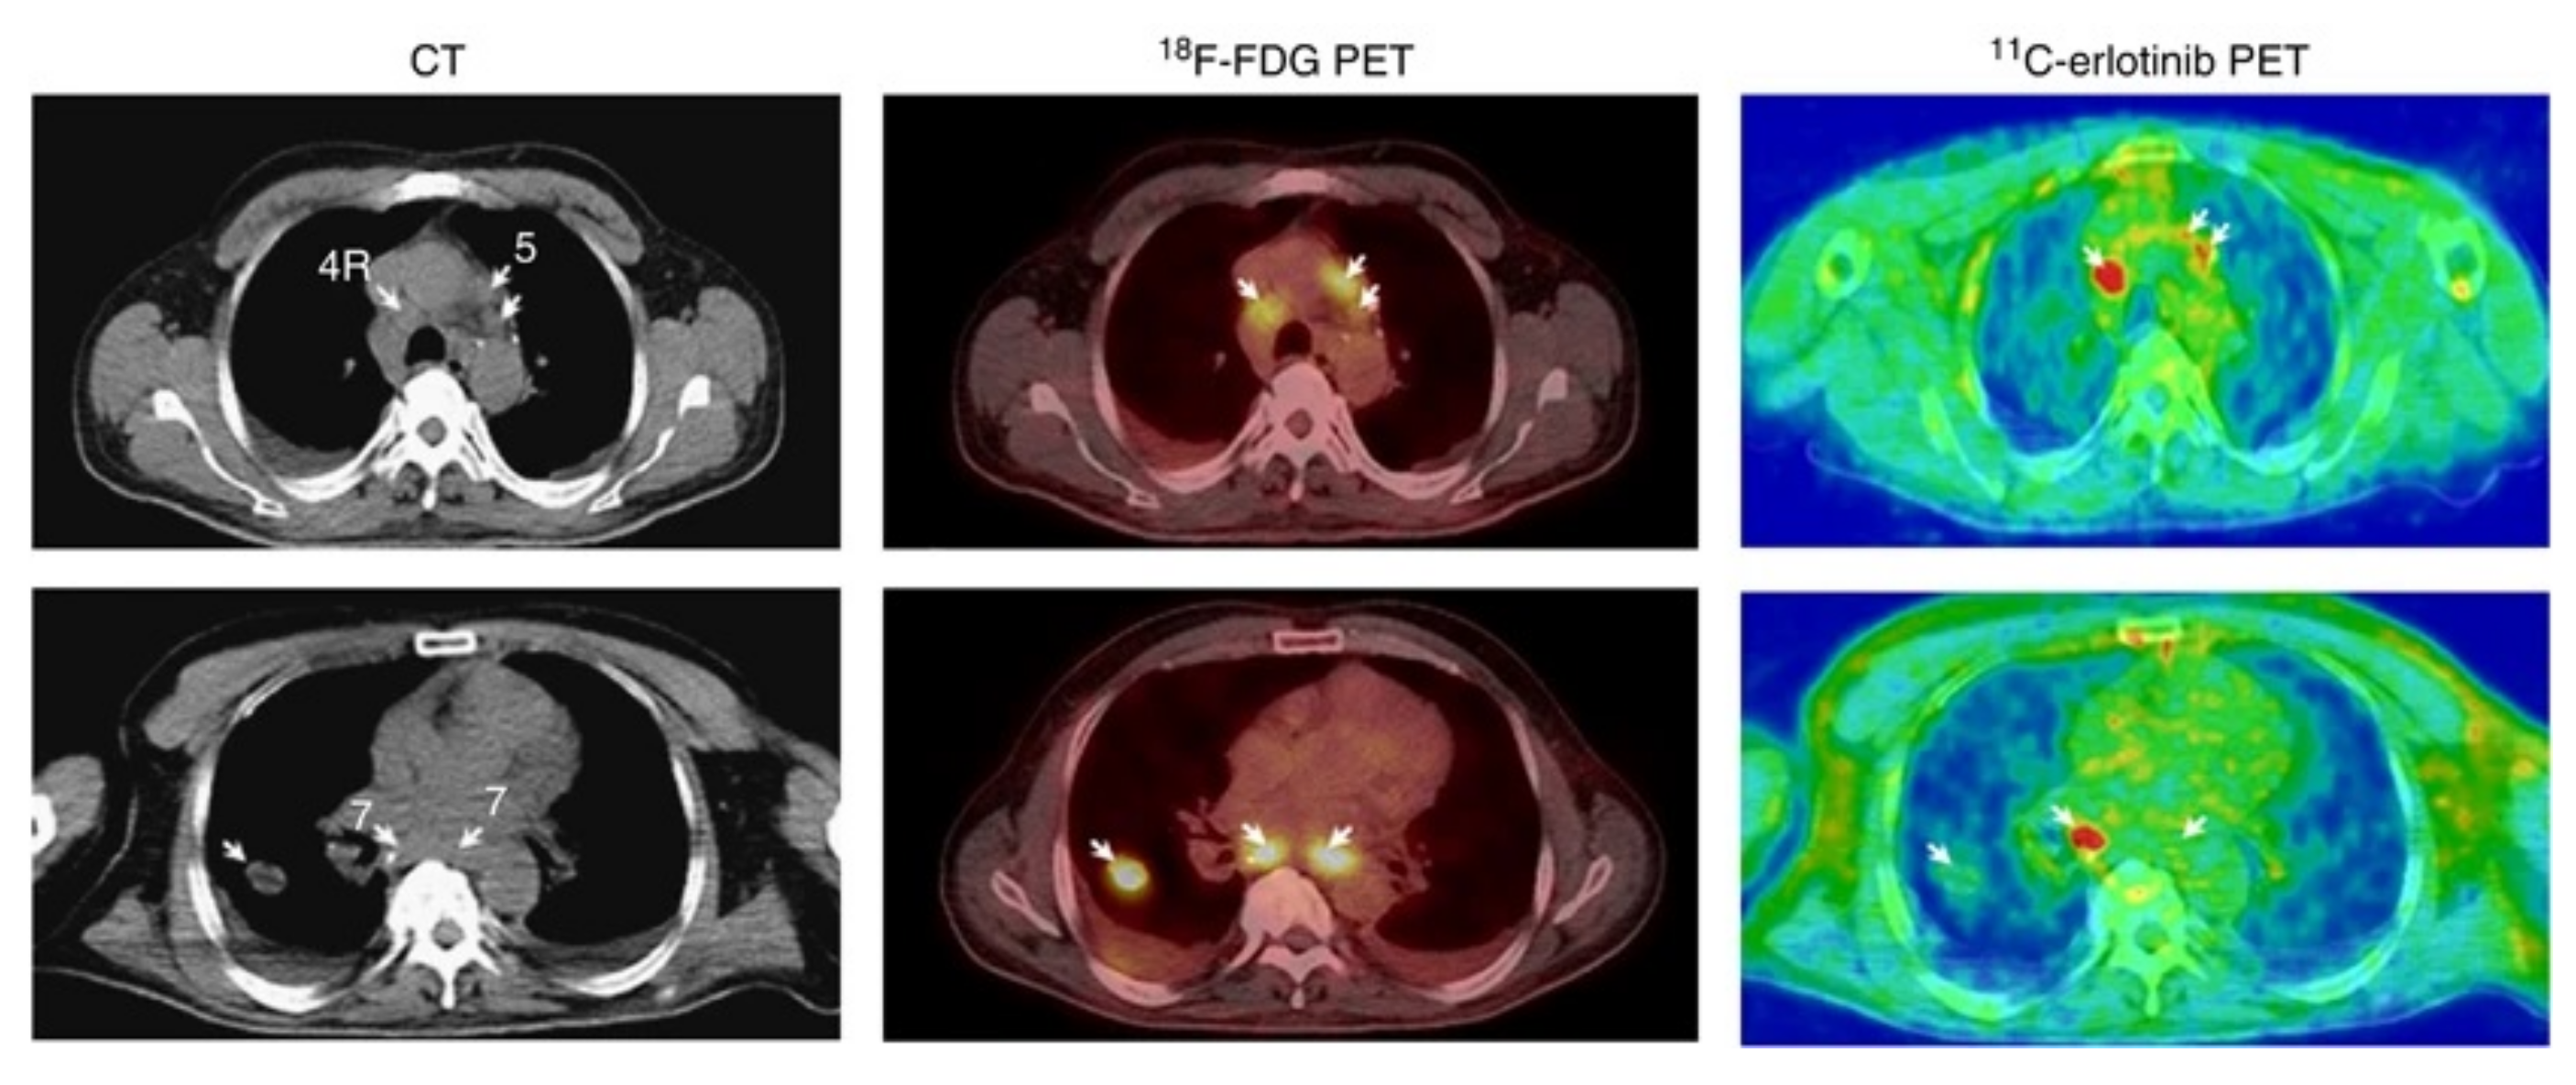
Clinical Investigations
Brain Uptake of [O-methyl-11C]erlotinib
2.3.3. Afatinib
Preclinical Investigation
Clinical Investigations
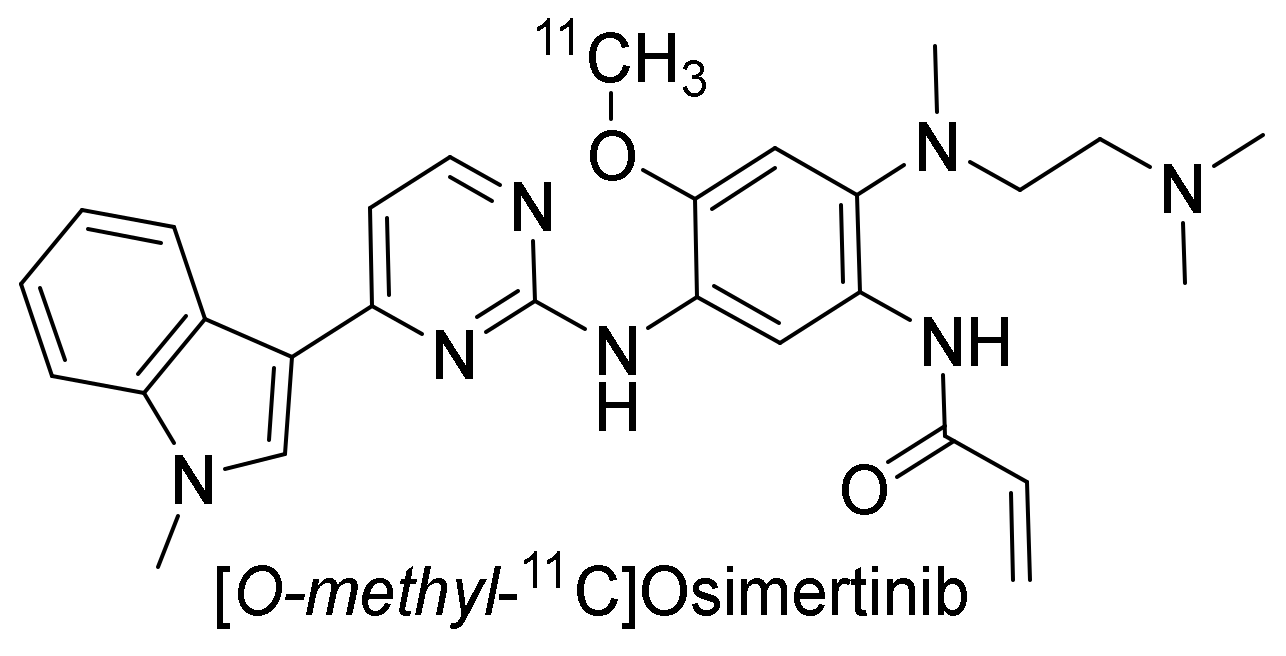
2.3.4. Osimertinib
Preclinical Investigation
Clinical Investigations
2.3.5. Toward Standardizing Evaluation of EGFR TKI PET Tracers
3. Discussion
4. Conclusions
Author Contributions
Funding
Institutional Review Board Statement
Informed Consent Statement
Data Availability Statement
Conflicts of Interest
References
- Martin-Fernandez, M.L.; Clarke, D.T.; Roberts, S.K.; Zanetti-Domingues, L.C.; Gervasio, F.L. Structure and Dynamics of the EGF Receptor as Revealed by Experiments and Simulations and Its Relevance to Non-Small Cell Lung Cancer. Cells 2019, 8, 316. [Google Scholar] [CrossRef] [PubMed] [Green Version]
- Bublil, E.M.; Yarden, Y. The EGF receptor family: Spearheading a merger of signaling and therapeutics. Curr. Opin. Cell Biol. 2007, 19, 124–134. [Google Scholar] [CrossRef] [PubMed]
- Purba, E.R.; Saita, E.-I.; Maruyama, I.N. Activation of the EGF Receptor by Ligand Binding and Oncogenic Mutations: The “Rotation Model”. Cells 2017, 6, 13. [Google Scholar] [CrossRef] [PubMed] [Green Version]
- Harris, R.C.; Chung, E.; Coffey, R.J. EGF receptor ligands. Exp. Cell Res. 2003, 284, 2–13. [Google Scholar] [CrossRef]
- Downward, J.; Yarden, Y.; Mayes, E.; Scrace, G.; Totty, N.; Stockwell, P.; Ullrich, A.; Schlessinger, J.; Waterfield, M.D. Close similarity of epidermal growth factor receptor and v-erb-B oncogene protein sequences. Nature 1984, 307, 521–527. [Google Scholar] [CrossRef] [PubMed]
- Nicholson, R.I.; Gee, J.M.W.; Harper, M.E. EGFR and cancer prognosis. Eur. J. Cancer 2001, 37, 9–15. [Google Scholar] [CrossRef]
- Attwood, M.M.; Fabbro, D.; Sokolov, A.V.; Knapp, S.; Schiöth, H.B. Trends in kinase drug discovery: Targets, indications and inhibitor design. Nat. Rev. Drug Discov. 2021, 20, 839–861. [Google Scholar] [CrossRef]
- Mendelsohn, J. The epidermal growth factor receptor as a target for cancer therapy. Endocr. Relat. Cancer 2001, 8, 3–9. [Google Scholar] [CrossRef] [Green Version]
- Bishop, P.C.; Myers, T.; Robey, R.; Fry, D.W.; Liu, E.T.; Blagosklonny, M.V.; Bates, S.E. Differential sensitivity of cancer cells to inhibitors of the epidermal growth factor receptor family. Oncogene 2002, 21, 119–127. [Google Scholar] [CrossRef] [Green Version]
- Ono, M.; Hirata, A.; Kometani, T.; Miyagawa, M.; Ueda, S.; Kinoshita, H.; Fujii, T.; Kuwano, M. Sensitivity to gefitinib (Iressa, ZD1839) in non-small cell lung cancer cell lines correlates with dependence on the epidermal growth factor (EGF) receptor/extracellular signal-regulated kinase 1/2 and EGF receptor/Akt pathway for proliferation. Mol. Cancer Ther. 2004, 3, 465–472. [Google Scholar]
- Humphrey, P.A.; Wong, A.J.; Vogelstein, B.; Zalutsky, M.R.; Fuller, G.N.; Archer, G.E.; Friedman, H.S.; Kwatra, M.M.; Bigner, S.H.; Bigner, D.D. Anti-synthetic peptide antibody reacting at the fusion junction of deletion-mutant epidermal growth factor receptors in human glioblastoma. Proc. Nati. Acad. Sci. USA 1990, 87, 4207–4211. [Google Scholar] [CrossRef] [Green Version]
- Ekstrand, A.J.; Sugawa, N.; James, C.D.; Collins, V.P. Amplified and rearranged epidermal growth factor receptor genes in human glioblastomas reveal deletions of sequences encoding portions of the N- and/or C-terminal tails. Proc. Nati. Acad. Sci. USA 1992, 89, 4309–4313. [Google Scholar] [CrossRef] [Green Version]
- De Palazzo, I.E.G.; Adams, G.P.; Sundareshan, P.; Wong, A.J.; Testa, J.R.; Bigner, D.D.; Weiner, L.M. Expression of Mutated Epidermal Growth Factor Receptor by Non-Small Cell Lung Carcinomas. Cancer Res. 1993, 53, 3217–3220. [Google Scholar]
- Gan, H.K.; Cvrljevic, A.N.; Johns, T.G. The epidermal growth factor receptor variant III (EGFRvIII): Where wild things are altered. FEBS J. 2013, 280, 5350–5370. [Google Scholar] [CrossRef]
- Duan, J.; Wang, Z.; Bai, H.; An, T.; Zhuo, M.; Wu, M.; Wang, Y.; Yang, L.; Wang, J. Epidermal growth factor receptor variant III mutation in Chinese patients with squamous cell cancer of the lung. Thorac. Cancer 2015, 6, 319–326. [Google Scholar] [CrossRef] [Green Version]
- Paez, J.G.; Jänne, P.A.; Lee, J.C.; Tracy, S.; Greulich, H.; Gabriel, S.; Herman, P.; Kaye, F.J.; Lindeman, N.; Boggon, T.J.; et al. EGFR Mutations in Lung Cancer: Correlation with Clinical Response to Gefitinib Therapy. Science 2004, 304, 1497–1500. [Google Scholar] [CrossRef] [Green Version]
- Lynch, T.J.; Bell, D.W.; Sordella, R.; Gurubhagavatula, S.; Okimoto, R.A.; Brannigan, B.W.; Harris, P.L.; Haserlat, S.M.; Supko, J.G.; Haluska, F.G.; et al. Activating Mutations in the Epidermal Growth Factor Receptor Underlying Responsiveness of Non-Small-Cell Lung Cancer to Gefitinib. N. Engl. J. Med. 2004, 350, 2129–2139. [Google Scholar] [CrossRef]
- Pao, W.; Miller, V.; Zakowski, M.; Doherty, J.; Politi, K.; Sarkaria, I.; Singh, B.; Heelan, R.; Rusch, V.; Fulton, L.; et al. EGF receptor gene mutations are common in lung cancers from “‘never smokers’” and are associated with sensitivity of tumors to gefitinib and erlotinib. Proc. Natl. Acad. Sci. USA 2004, 101, 1306–1311. [Google Scholar] [CrossRef] [Green Version]
- Cross, D.A.E.; Ashton, S.E.; Ghiorghiu, S.; Eberlein, C.; Nebhan, C.A.; Spitzler, P.J.; Orme, J.P.; Finlay, M.R.V.; Ward, R.A.; Mellor, M.J.; et al. AZD9291, an irreversible EGFR TKI, overcomes T790M-mediated resistance to EGFR inhibitors in lung cancer. Cancer Discov. 2014, 4, 1046–1061. [Google Scholar] [CrossRef] [Green Version]
- Li, D.; Ambrogio, L.; Shimamura, T.; Kubo, S.; Takahashi, M.; Chirieac, L.R.; Padera, R.F.; Shapiro, G.I.; Baum, A.; Himmelsbach, F.; et al. BIBW2992, an irreversible EGFR/HER2 inhibitor highly effective in preclinical lung cancer models. Oncogene 2008, 27, 4702–4711. [Google Scholar] [CrossRef] [Green Version]
- Pao, W.; Miller, V.A.; Politi, K.A.; Riely, G.J.; Somwar, R.; Zakowski, M.F.; Kris, M.G.; Varmus, H. Acquired Resistance of Lung Adenocarcinomas to Gefitinib or Erlotinib is Associated with a Second Mutation in the EGFR Kinase Domain. PLoS Med. 2005, 2, 0225–0235. [Google Scholar] [CrossRef] [PubMed] [Green Version]
- Kobayashi, S.; Boggon, T.J.; Dayaram, T.; Jänne, P.A.; Kocher, O.; Meyerson, M.; Johnson, B.E.; Eck, M.J.; Tenen, D.G.; Halmos, B. EGFR Mutation and Resistance of Non-Small-Cell Lung Cancer to Gefitinib. N. Engl. J. Med. 2005, 352, 786–792. [Google Scholar] [CrossRef] [PubMed]
- Karachaliou, N.; Fernandez-Bruno, M.; Bracht, J.W.P.; Rosell, R. EGFR first- and second-generation TKIs—there is still place for them in EGFR -mutant NSCLC patients. Transl. Cancer Res. 2019, 8, S23–S47. [Google Scholar] [CrossRef] [PubMed]
- Yu, H.A.; Riely, G.J. Second Generation Epidermal Growth Factor Receptor Tyrosine Kinase Inhibitors In Lung Cancers. J. Natl. Compr. Cancer Netw. 2013, 11, 161–169. [Google Scholar] [CrossRef] [Green Version]
- Nakamura, T.; Nakashima, C.; Komiya, K.; Kitera, K.; Hirai, M.; Kimura, S.; Aragane, N. Mechanisms of acquired resistance to afatinib clarified with liquid biopsy. PLoS ONE 2018, 13, e0209384. [Google Scholar] [CrossRef]
- Tanaka, K.; Nosaki, K.; Otsubo, K.; Azuma, K.; Sakata, S.; Ouchi, H.; Morinaga, R.; Wataya, H.; Fujii, A.; Nakagaki, N.; et al. Acquisition of the T790M resistance mutation during afatinib treatment in EGFR tyrosine kinase inhibitor–naïve patients with non–small cell lung cancer harboring EGFR mutations. Oncotarget 2017, 8, 68123–68130. [Google Scholar] [CrossRef]
- Leonetti, A.; Sharma, S.; Minari, R.; Perego, P.; Giovannetti, E.; Tiseo, M. Resistance mechanisms to osimertinib in EGFR-mutated non-small cell lung cancer. Br. J. Cancer 2019, 121, 725–737. [Google Scholar] [CrossRef]
- Murtuza, A.; Bulbul, A.; Shen, J.P.; Keshavarzian, P.; Woodward, B.D.; Lopez-Diaz, F.J.; Lippman, S.M.; Husain, H. Novel Third-Generation EGFR Tyrosine Kinase Inhibitors and Strategies to Overcome Therapeutic Resistance in Lung Cancer. Cancer Res. 2019, 79, 689–698. [Google Scholar] [CrossRef] [Green Version]
- Jia, Y.; Yun, C.-H.; Park, E.; Ercan, D.; Manuia, M.; Juarez, J.; Xu, C.; Rhee, K.; Chen, T.; Zhang, H.; et al. Overcoming EGFR(T790M) and EGFR(C797S) resistance with mutant-selective allosteric inhibitors. Nature 2016, 534, 129–132. [Google Scholar] [CrossRef] [Green Version]
- Bois, F.; Noirot, C.; Dietemann, S.; Mainta, I.C.; Zilli, T.; Garibotto, V.; Walter, M.A. [68Ga]Ga-PSMA-11 in prostate cancer: A comprehensive review. Am. J. Nucl. Med. Mol. Imaging 2020, 10, 349–374. [Google Scholar]
- Dei Tos, A.P.; Ellis, I. Assessing epidermal growth factor receptor expression in tumours: What is the value of current test methods? Eur. J. Cancer 2005, 41, 1383–1392. [Google Scholar] [CrossRef]
- Fry, D.W.; Kraker, A.J.; McMichael, A.; Ambroso, L.A.; Nelson, J.M.; Leopold, W.R.; Connors, R.W.; Bridges, A.J. A Specific Inhibitor of the Epidermal Growth Factor Receptor Tyrosine Kinase. Science 1994, 265, 1093–1095. [Google Scholar] [CrossRef]
- Johnström, P.; Fredriksson, A.; Thorell, J.-O.; Hassan, M.; Kogner, P.; Borgström, P.; Ingvar, M.; Stone-Elander, S. Synthesis and in vivo biodistribution of tyrosine kinase inhibitor, [methoxy-11C]PD 153035. J. Label. Compd. Radiopharm. 1997, 40, 377. [Google Scholar]
- Mulholland, G.K.; Winkle, W.; Mock, B.H.; Sledge, G. Radioiodinated epidermal growth factor receptor ligands as tumor probes. Dramatic potentiation of binding to MDA-468 cancer cells in presence of EGF. J. Nucl. Med. 1995, 36, P71. [Google Scholar]
- Johnström, P.; Fredriksson, A.; Thorell, J.-O.; Stone-Elander, S. Synthesis of [Methoxy-11C]PD15035, a Selective EGF Receptor Tyrosine Kinase Inhibitor. J. Label. Compd. Radiopharm. 1998, 41, 623–629. [Google Scholar] [CrossRef]
- Fredriksson, A.; Johnström, P.; Thorell, J.-O.; Von Heijne, G.; Hassan, M.; Eksborg, S.; Kogner, P.; Borgström, P.; Ingvar, M.; Stone-Elander, S. In vivo evaluation of the biodistribution of 11C-labeled PD153035 in rats without and with neuroblastoma implants. Life Sci. 1999, 65, 165–174. [Google Scholar] [CrossRef]
- Samén, E.; Arnberg, F.; Lu, L.; Olofsson, M.H.; Tegnebratt, T.; Thorell, J.O.; Holmin, S.; Stone-Elander, S. Metabolism of Epidermal Growth Factor Receptor Targeting Probe [11C]PD153035: Impact on Biodistribution and Tumor Uptake in Rats. J. Nucl. Med. 2013, 54, 1804–1811. [Google Scholar] [CrossRef] [Green Version]
- Wang, H.; Yu, J.; Yang, G.; Song, X.; Sun, X.; Zhao, S.; Mu, D. Assessment of 11C-labeled-4-N-(3-bromoanilino)-6, 7-dimethoxyquinazoline as a positron emission tomography agent to monitor epidermal growth factor receptor expression. Cancer Sci. 2007, 98, 1413–1416. [Google Scholar] [CrossRef]
- Samén, E.; Thorell, J.O.; Fredriksson, A.; Stone-Elander, S. The tyrosine kinase inhibitor PD153035: Implication of labeling position on radiometabolites formed in vitro. Nucl. Med. Biol. 2006, 33, 1005–1011. [Google Scholar] [CrossRef]
- Wang, H.; Yu, J.; Yang, G.; Song, X.; Sun, X.; Zhao, S.; Wang, X.; Zhao, W. Further characterization of the epidermal growth factor receptor ligand 11C-PD153035. Chin. Med. J. 2007, 120, 960–964. [Google Scholar] [CrossRef]
- SIB Swiss Institute of Bioinformatics Cellosaurus query. Available online: https://web.expasy.org/cgi-bin/cellosaurus/search (accessed on 30 December 2021).
- Dai, D.; Li, X.F.; Wang, J.; Liu, J.-J.; Zhu, Y.J.; Zhang, Y.; Wang, Q.; Xu, W.G. Predictive efficacy of 11C-PD153035 PET imaging for EGFR-tyrosine kinase inhibitor sensitivity in non-small cell lung cancer patients. Int. J. Cancer 2016, 138, 1003–1012. [Google Scholar] [CrossRef] [Green Version]
- Yu, J.M.; Liu, N.; Yang, G.; Guo, H.; Ma, L.; Zhao, S.; Kong, L. 11C-PD153035 PET/CT for molecular imaging of EGFR in patients with non-small cell lung cancer (NSCLC). J. Clin. Oncol. 2008, 26, 3503. [Google Scholar] [CrossRef]
- Liu, N.; Li, M.; Li, X.; Meng, X.; Yang, G.; Zhao, S.; Yang, Y.; Ma, L.; Fu, Z.; Yu, J. PET-based biodistribution and radiation dosimetry of epidermal growth factor receptor-selective tracer 11C-PD153035 in humans. J. Nucl. Med. 2009, 50, 303–308. [Google Scholar] [CrossRef] [PubMed] [Green Version]
- Sun, J.; Cai, L.; Zhang, K.; Zhang, A.L.; Pu, P.Y.; Yang, W.D.; Gao, S. A Pilot Study on EGFR-Targeted Molecular Imaging of PET/CT With 11C-PD153035 in Human Gliomas. Clin. Nucl. Med. 2014, 39, e20–e26. [Google Scholar] [CrossRef]
- Meng, X.; Loo, B.W.; Ma, L.; Murphy, J.D.; Sun, X.; Yu, J. Molecular Imaging with 11C-PD153035 PET/CT Predicts Survival in Non-Small Cell Lung Cancer Treated with EGFR-TKI: A Pilot Study. J. Nucl. Med. 2011, 52, 1573–1579. [Google Scholar] [CrossRef] [PubMed] [Green Version]
- Kunkel, M.W.; Hook, K.E.; Howard, C.T.; Przybranowski, S.; Roberts, B.J.; Elliott, W.L.; Leopold, W.R. Inhibition of the epidermal growth factor receptor tyrosine kinase by PD153035 in human A431 tumors in athymic nude mice. Investig. New Drugs 1996, 13, 295–302. [Google Scholar] [CrossRef]
- Bonasera, T.A.; Ortu, G.; Rozen, Y.; Krais, R.; Freedman, N.M.T.; Chisin, R.; Gazit, A.; Levitzki, A.; Mishani, E. Potential 18F-labeled biomarkers for epidermal growth factor receptor tyrosine kinase. Nucl. Med. Biol. 2001, 28, 359–374. [Google Scholar] [CrossRef]
- Ortu, G.; Ben-David, I.; Rozen, Y.; Freedman, N.M.T.; Chisin, R.; Levitzki, A.; Mishani, E. Labeled EGFR-TK irreversible inhibitor (ML03): In vitro and in vivo properties, potential as PET biomarker for cancer and feasibility as anticancer drug. Int. J. Cancer 2002, 101, 360–370. [Google Scholar] [CrossRef]
- Mishani, E.; Abourbeh, G.; Jacobson, O.; Dissoki, S.; Ben Daniel, R.; Rozen, Y.; Shaul, M.; Levitzki, A. High-affinity epidermal growth factor receptor (EGFR) irreversible inhibitors with diminished chemical reactivities as positron emission tomography (PET)-imaging agent candidates of EGFR overexpressing tumors. J. Med. Chem. 2005, 48, 5337–5348. [Google Scholar] [CrossRef]
- Dissoki, S.; Eshet, R.; Billauer, H.; Mishani, E. Modified PEG-anilinoquinazoline derivatives as potential EGFR PET agents. J. Label. Compd. Radiopharm. 2009, 52, 41–52. [Google Scholar] [CrossRef]
- Abourbeh, G.; Dissoki, S.; Jacobson, O.; Litchi, A.; Daniel, R.B.; Laki, D.; Levitzki, A.; Mishani, E. Evaluation of radiolabeled ML04, a putative irreversible inhibitor of epidermal growth factor receptor, as a bioprobe for PET imaging of EGFR-overexpressing tumors. Nucl. Med. Biol. 2007, 34, 55–70. [Google Scholar] [CrossRef]
- Pantaleo, M.A.; Mishani, E.; Nanni, C.; Landuzzi, L.; Boschi, S.; Nicoletti, G.; Dissoki, S.; Paterini, P.; Piccaluga, P.P.; Lodi, F.; et al. Evaluation of Modified PEG-Anilinoquinazoline Derivatives as Potential Agents for EGFR Imaging in Cancer by Small Animal PET. Mol. Imaging Biol. 2010, 12, 616–625. [Google Scholar] [CrossRef] [Green Version]
- Yeh, H.H.; Ogawa, K.; Balatoni, J.; Mukhapadhyay, U.; Pal, A.; Gonzalez-Lepera, C.; Shavrin, A.; Soghomonyan, S.; Flores, L.I.; Young, D.; et al. Molecular imaging of active mutant L858R EGF receptor (EGFR) kinase-expressing nonsmall cell lung carcinomas using PET/CT. Proc. Natl. Acad. Sci. USA 2011, 108, 1603–1608. [Google Scholar] [CrossRef] [Green Version]
- Fawwaz, M.; Mishiro, K.; Nishii, R.; Makino, A.; Kiyono, Y.; Shiba, K.; Kinuya, S.; Ogawa, K. A Radiobrominated Tyrosine Kinase Inhibitor for EGFR with L858R/T790M Mutations in Lung Carcinoma. Pharmaceuticals 2021, 14, 256. [Google Scholar] [CrossRef]
- Sun, X.; Xiao, Z.; Chen, G.; Han, Z.; Liu, Y.; Zhang, C.; Sun, Y.; Song, Y.; Wang, K.; Fang, F.; et al. A PET imaging approach for determining EGFR mutation status for improved lung cancer patient management. Sci. Transl. Med. 2018, 10, eaan8840. [Google Scholar] [CrossRef] [Green Version]
- Kimura, H.; Okuda, H.; Ishiguro, M.; Arimitsu, K.; Makino, A.; Nishii, R.; Miyazaki, A.; Yagi, Y.; Watanabe, H.; Kawasaki, I.; et al. 18F-Labeled Pyrido[3,4-d]pyrimidine as an Effective Probe for Imaging of L858R Mutant Epidermal Growth Factor Receptor. ACS Med. Chem. Lett. 2017, 8, 418–422. [Google Scholar] [CrossRef] [Green Version]
- Song, Y.; Xiao, Z.; Wang, K.; Wang, X.; Zhang, C.; Fang, F.; Sun, X.; Shen, B. Development and Evaluation of 18F-IRS for Molecular Imaging Mutant EGF Receptors in NSCLC. Sci. Rep. 2017, 7, 3121. [Google Scholar] [CrossRef]
- Shamni, O.; Grievink, H.; Itamar, B.; Mishani, E.; Abourbeh, G. Development of a Fluorinated Analogue of Erlotinib for PET Imaging of EGFR Mutation–Positive NSCLC. Mol. Imaging Biol. 2019, 21, 696–704. [Google Scholar] [CrossRef] [Green Version]
- Fawwaz, M.; Mishiro, K.; Nishii, R.; Sawazaki, I.; Shiba, K.; Kinuya, S.; Ogawa, K. Synthesis and Fundamental Evaluation of Radioiodinated Rociletinib (CO-1686) as a Probe to Lung Cancer with L858R/T790M Mutations of Epidermal Growth Factor Receptor (EGFR). Molecules 2020, 25, 2914. [Google Scholar] [CrossRef]
- Mishiro, K.; Nishii, R.; Sawazaki, I.; Sofuku, T.; Fuchigami, T.; Sudo, H.; Effendi, N.; Makino, A.; Kiyono, Y.; Shiba, K.; et al. Development of Radiohalogenated Osimertinib Derivatives as Imaging Probes for Companion Diagnostics of Osimertinib. J. Med. Chem. 2022, 65, 1835–1847. [Google Scholar] [CrossRef]
- Pal, A.; Glekas, A.; Doubrovin, M.; Balatoni, J.; Beresten, T.; Maxwell, D.; Soghomonyan, S.; Shavrin, A.; Ageyeva, L.; Finn, R.; et al. Molecular Imaging of EGFR Kinase Activity in Tumors with 124I-Labeled Small Molecular Tracer and Positron Emission Tomography. Mol. Imaging Biol. 2006, 8, 262–277. [Google Scholar] [CrossRef] [PubMed]
- Yeh, S.H.-H.; Lin, C.-F.; Kong, F.-L.; Wang, H.-E.; Hsieh, Y.-J.; Gelovani, J.G.; Liu, R.-S. Molecular Imaging of Nonsmall Cell Lung Carcinomas Expressing Active Mutant EGFR Kinase Using PET with [124I]-morpholino-IPQA. Biomed. Res. Int. 2013, 2013, 549359. [Google Scholar] [CrossRef] [PubMed] [Green Version]
- Huang, S.; Han, Y.; Chen, M.; Hu, K.; Qi, Y.; Sun, P.; Wang, M.; Wu, H.; Li, G.; Wang, Q.; et al. Radiosynthesis and biological evaluation of 18F-labeled 4-anilinoquinazoline derivative (18F-FEA-Erlotinib) as a potential EGFR PET agent. Bioorg. Med. Chem. Lett. 2018, 28, 1143–1148. [Google Scholar] [CrossRef] [PubMed]
- Ren, H.; Ning, H.; Chang, J.; Zhao, M.; He, Y.; Chong, Y.; Qi, C. Evaluation of 18F-labeled icotinib derivatives as potential PET agents for tumor imaging. J. Radioanal. Nucl. Chem. 2016, 309, 517–523. [Google Scholar] [CrossRef]
- Lu, X.; Wang, C.; Li, X.; Gu, P.; Jia, L.; Zhang, L. Synthesis and preliminary evaluation of 18F-icotinib for EGFR-targeted PET imaging of lung cancer. Bioorganic Med. Chem. 2019, 27, 545–551. [Google Scholar] [CrossRef]
- Dissoki, S.; Aviv, Y.; Laky, D.; Abourbeh, G.; Levitzki, A.; Mishani, E. The effect of the [18F]-PEG group on tracer qualification of [4-(phenylamino)-quinazoline-6-YL]-amide moiety-An EGFR putative irreversible inhibitor. Appl. Radiat. Isot. 2007, 65, 1140–1151. [Google Scholar] [CrossRef]
- Pal, A.; Balatoni, J.A.; Mukhopadhyay, U.; Ogawa, K.; Gonzalez-Lepera, C.; Shavrin, A.; Volgin, A.; Tong, W.; Alauddin, M.M.; Gelovani, J.G. Radiosynthesis and Initial In Vitro Evaluation of [18F]F-PEG6-IPQA-A Novel PET Radiotracer for Imaging EGFR Expression-Activity in Lung Carcinomas. Mol. Imaging Biol. 2011, 13, 853–861. [Google Scholar] [CrossRef]
- Shi, Y.; Sun, Y.; Ding, C.; Wang, Z.; Wang, C.; Wang, Z.; Bai, C.; Bai, C.; Feng, J.; Liu, X.; et al. China experts consensus on icotinib for non-small cell lung cancer treatment (2015 version). Ann. Transl. Med. 2015, 3, 260. [Google Scholar]
- Muhsin, M.; Graham, J.; Kirkpatrick, P. Gefitinib. Nat. Rev. Drug Discov. 2003, 2, 515–516. [Google Scholar] [CrossRef]
- Thatcher, N.; Chang, A.; Parikh, P.; Pereira, J.R.; Ciuleanu, T.; Von Pawel, J.; Thongprasert, S.; Tan, E.H.; Pemberton, K.; Archer, V.; et al. Gefitinib plus best supportive care in previously treated patients with refractory advanced non-small-cell lung cancer: Results from a randomised, placebo-controlled, multicentre study (Iressa Survival Evaluation in Lung Cancer). Lancet 2005, 366, 1527–1537. [Google Scholar] [CrossRef]
- Food and Drug Administration (FDA) Summary Review—Iressa, Application Number: 206995Orig1s000. Available online: https://www.accessdata.fda.gov/drugsatfda_docs/nda/2015/206995Orig1s000SumR.pdf (accessed on 11 October 2021).
- Cohen, M.H.; Johnson, J.R.; Chen, Y.; Sridhara, R.; Pazdur, R. FDA Drug Approval Summary: Erlotinib (Tarceva) Tablets. Oncologist 2005, 10, 461–466. [Google Scholar] [CrossRef]
- European Medicines Agency Assessment report for Iressa, Procedure No EMEA/H/C/001016. Available online: https://www.ema.europa.eu/en/documents/assessment-report/iressa-epar-public-assessment-report_en.pdf (accessed on 8 April 2020).
- Food and Drug Administration (FDA) Erlotinib (Tarceva). Available online: https://www.fda.gov/drugs/resources-information-approved-drugs/erlotinib-tarceva (accessed on 8 April 2020).
- Food and Drug Administration (FDA) HIGHLIGHTS OF PRESCRIBING INFORMATION, Gilotrif (afatinib). Available online: https://www.accessdata.fda.gov/drugsatfda_docs/label/2013/201292s000lbl.pdf (accessed on 6 April 2020).
- European Medicines Agency Summary of the European public assessment report for Giotrif. Available online: https://www.ema.europa.eu/en/medicines/human/EPAR/giotrif (accessed on 6 April 2020).
- Food and Drug Administration (FDA) HIGHLIGHTS OF PRESCRIBING INFORMATION, Tagrisso (osimertinib). Available online: https://www.accessdata.fda.gov/drugsatfda_docs/label/2015/208065s000lbl.pdf (accessed on 8 April 2020).
- European Medicines Agency Press release: EMA fast-tracks new oral treatment for non-small cell lung cancer. Available online: https://www.ema.europa.eu/en/news/ema-fast-tracks-new-oral-treatment-non-small-cell-lung-cancer (accessed on 6 April 2020).
- European Medicines Agency Summary of opinion, Tagrisso (osimertinib), EMA/CHMP/254059/2018. Available online: https://www.ema.europa.eu/en/documents/smop/chmp-post-authorisation-summary-positive-opinion-tagrisso-ii/0019_en.pdf (accessed on 12 October 2021).
- AstraZeneca US FDA approves Tagrisso as 1st-line treatment for EGFR-mutated non-small cell lung cancer. Available online: https://www.astrazeneca.com/media-centre/press-releases/2018/us-fda-approves-tagrisso-as-1st-line-treatment-for-EGFR-mutated-non-small-cell-lung-cancer.html# (accessed on 12 October 2021).
- Barker, A.J.; Gibson, K.H.; Grundy, W.; Godfrey, A.A.; Barlow, J.J.; Healy, M.P.; Woodburn, J.R.; Ashton, S.E.; Curry, B.J.; Scarlett, L.; et al. Studies leading to the identification of ZD1839 (IressaTM): An orally active, selective epidermal growth factor receptor tyrosine kinase inhibitor targeted to the treatment of cancer. Bioorganic Med. Chem. Lett. 2001, 11, 1911–1914. [Google Scholar] [CrossRef]
- Zhang, M.R.; Kumata, K.; Hatori, A.; Takai, N.; Toyohara, J.; Yamasaki, T.; Yanamoto, K.; Yui, J.; Kawamura, K.; Koike, S.; et al. [11C]Gefitinib ([11C]Iressa): Radiosynthesis, In Vitro uptake, and In Vivo imaging of intact murine fibrosarcoma. Mol. Imaging Biol. 2010, 12, 181–191. [Google Scholar] [CrossRef]
- Su, H.; Seimbille, Y.; Ferl, G.Z.; Bodenstein, C.; Fueger, B.; Kim, K.J.; Hsu, Y.T.; Dubinett, S.M.; Phelps, M.E.; Czernin, J.; et al. Evaluation of [18F]gefitinib as a molecular imaging probe for the assessment of the epidermal growth factor receptor status in malignant tumors. Eur. J. Nucl. Med. Mol. Imaging 2008, 35, 1089–1099. [Google Scholar] [CrossRef]
- Kawamura, K.; Yamasaki, T.; Yui, J.; Hatori, A.; Konno, F.; Kumata, K.; Irie, T.; Fukumura, T.; Suzuki, K.; Kanno, I.; et al. In vivo evaluation of P-glycoprotein and breast cancer resistance protein modulation in the brain using [11C]gefitinib. Nucl. Med. Biol. 2009, 36, 239–246. [Google Scholar] [CrossRef]
- McKillop, D.; Hutchison, M.; Partridge, E.A.; Bushby, N.; Cooper, C.M.F.; Clarkson-Jones, J.A.; Herron, W.; Swaisland, H.C. Metabolic disposition of gefitinib, an epidermal growth factor receptor tyrosine kinase inhibitor, in rat, dog and man. Xenobiotica 2004, 34, 917–934. [Google Scholar] [CrossRef]
- Traxl, A.; Wanek, T.; Mairinger, S.; Stanek, J.; Filip, T.; Sauberer, M.; Muller, M.; Kuntner, C.; Langer, O. Breast Cancer Resistance Protein and P-Glycoprotein Influence In Vivo Disposition of 11C-Erlotinib. J. Nucl. Med. 2015, 56, 1930–1936. [Google Scholar] [CrossRef] [Green Version]
- Traxl, A.; Beikbaghban, T.; Wanek, T.; Kryeziu, K.; Pirker, C.; Mairinger, S.; Stanek, J.; Filip, T.; Sauberer, M.; Kuntner, C.; et al. [11C]Erlotinib PET cannot detect acquired erlotinib resistance in NSCLC tumor xenografts in mice. Nucl. Med. Biol. 2017, 52, 7–15. [Google Scholar] [CrossRef]
- Bahce, I.; Smit, E.F.; Lubberink, M.; Van Der Veldt, A.A.M.; Yaqub, M.; Windhorst, A.D.; Schuit, R.C.; Thunnissen, E.; Heideman, D.A.M.; Postmus, P.E.; et al. Development of [11C]erlotinib Positron Emission Tomography for In Vivo Evaluation of EGF Receptor Mutational Status. Clin. Cancer Res. 2013, 19, 183–193. [Google Scholar] [CrossRef] [Green Version]
- Bauer, M.; Traxl, A.; Matsuda, A.; Karch, R.; Philippe, C.; Nics, L.; Klebermass, E.M.; Wulkersdorfer, B.; Weber, M.; Poschner, S.; et al. Effect of Rifampicin on the Distribution of [11C]Erlotinib to the Liver, a Translational PET Study in Humans and in Mice. Mol. Pharm. 2018, 15, 4589–4598. [Google Scholar] [CrossRef]
- Slobbe, P.; Windhorst, A.D.; Stigter van-Walsum, M.; Schuit, R.C.; Smit, E.F.; Niessen, H.G.; Solca, F.; Stehle, G.; van Dongen, G.A.M.S.; Poot, A.J. Development of [18F]afatinib as new TKI-PET tracer for EGFR positive tumors. Nucl. Med. Biol. 2014, 41, 749–757. [Google Scholar] [CrossRef]
- Van de Stadt, E.A.; Yaqub, M.; Lammertsma, A.A.; Poot, A.J.; Schober, P.R.; Schuit, R.C.; Smit, E.F.; Bahce, I.; Hendrikse, N.H. Quantification of [18F]afatinib using PET/CT in NSCLC patients: A feasibility study. EJNMMI Res. 2020, 10, 97. [Google Scholar] [CrossRef]
- Varrone, A.; Varnäs, K.; Jucaite, A.; Cselényi, Z.; Johnström, P.; Schou, M.; Vazquez-Romero, A.; Moein, M.M.; Halldin, C.; Brown, A.P.; et al. A PET study in healthy subjects of brain exposure of 11C-labelled osimertinib - A drug intended for treatment of brain metastases in non-small cell lung cancer. J. Cereb. Blood Flow Metab. 2019, 40, 799–807. [Google Scholar] [CrossRef]
- Petrulli, J.R.; Sullivan, J.M.; Zheng, M.-Q.; Bennett, D.C.; Charest, J.; Huang, Y.; Morris, E.D.; Contessa, J.N. Quantitative Analysis of [11C]-Erlotinib PET Demonstrates Specific Binding for Activating Mutations of the EGFR Kinase Domain. Neoplasia 2013, 15, 1347–1353. [Google Scholar] [CrossRef] [Green Version]
- Memon, A.; Jakobsen, S.; Dagnaes-Hansen, F.; Sorensen, B.S.; Keiding, S.; Nexo, E. Positron Emission Tomography (PET) Imaging with [11C]-Labeled Erlotinib: A Micro-PET Study on Mice with Lung Tumor Xenografts. Cancer Res. 2009, 69, 873–878. [Google Scholar] [CrossRef] [Green Version]
- Slobbe, P.; Windhorst, A.D.; Stigter-van Walsum, M.; Smit, E.F.; Niessen, H.G.; Solca, F.; Stehle, G.; van Dongen, G.A.M.S.; Poot, A.J. A comparative PET imaging study with the reversible and irreversible EGFR tyrosine kinase inhibitors [11C]erlotinib and [18F]afatinib in lung cancer-bearing mice. EJNMMI Res. 2015, 5, 14. [Google Scholar] [CrossRef] [Green Version]
- Abourbeh, G.; Itamar, B.; Salnikov, O.; Beltsov, S.; Mishani, E. Identifying erlotinib-sensitive non-small cell lung carcinoma tumors in mice using [11C]erlotinib PET. EJNMMI Res. 2015, 5, 4. [Google Scholar] [CrossRef] [PubMed] [Green Version]
- Ballard, P.; Yates, J.W.T.; Yang, Z.; Kim, D.-W.; Yang, J.C.H.; Cantarini, M.; Pickup, K.; Jordan, A.; Hickey, M.; Grist, M.; et al. Preclinical Comparison of Osimertinib with Other EGFR-TKIs in EGFR-Mutant NSCLC Brain Metastases Models, and Early Evidence of Clinical Brain Metastases Activity. Clin. Cancer Res. 2016, 22, 5130–5140. [Google Scholar] [CrossRef] [PubMed] [Green Version]
- Moyer, J.D.; Barbacci, E.G.; Iwata, K.K.; Arnold, L.; Boman, B.; Cunningham, A.; DiOrio, C.; Doty, J.; Morin, M.J.; Moyer, M.P.; et al. Induction of Apoptosis and Cell Cycle Arrest by CP-358,774, an Inhibitor of Epidermal Growth Factor Receptor Tyrosine Kinase. Cancer Res. 1997, 57, 4838–4848. [Google Scholar] [PubMed]
- Adis International Ltd Erlotinib: CP 358774, NSC 718781, OSI 774, R 1415. Drugs R D 2003, 4, 243–248.
- Ling, J.; Johnson, K.A.; Miao, Z.; Rakhit, A.; Pantze, M.P.; Hamilton, M.; Lum, B.L.; Prakash, C. Metabolism and excretion of erlotinib, a small molecule inhibitor of epidermal growth factor receptor tyrosine kinase, in healthy male volunteers. Drug Metab. Dispos. 2006, 34, 420–426. [Google Scholar] [CrossRef] [Green Version]
- Petrulli, J.R.; Hansen, S.B.; Abourbeh, G.; Yaqub, M.; Bahce, I.; Holden, D.; Huang, Y.; Nabulsi, N.B.; Contessa, J.N.; Mishani, E.; et al. A multi species evaluation of the radiation dosimetry of [11C]erlotinib, the radiolabeled analog of a clinically utilized tyrosine kinase inhibitor. Nucl. Med. Biol. 2017, 47, 56–61. [Google Scholar] [CrossRef] [Green Version]
- Memon, A.; Weber, B.; Winterdahl, M.; Jakobsen, S.; Meldgaard, P.; Madsen, H.H.T.; Keiding, S.; Nexo, E.; Sorensen, B.S. PET imaging of patients with non-small cell lung cancer employing an EGF receptor targeting drug as tracer. Br. J. Cancer 2011, 105, 1850–1855. [Google Scholar] [CrossRef]
- Weber, B.; Winterdahl, M.; Memon, A.; Sorensen, B.S.; Keiding, S.; Sorensen, L.; Nexo, E.; Meldgaard, P. Erlotinib Accumulation in Brain Metastases from Non-small Cell Lung Cancer: Visualization by Positron Emission Tomography in a Patient Harboring a Mutation in the Epidermal Growth Factor Receptor. J. Thorac. Oncol. 2011, 6, 1287–1289. [Google Scholar] [CrossRef] [Green Version]
- Bahce, I.; Yaqub, M.; Errami, H.; Schuit, R.C.; Schober, P.; Thunnissen, E.; Windhorst, A.D.; Lammertsma, A.A.; Smit, E.F.; Hendrikse, N.H. Effects of erlotinib therapy on [11C]erlotinib uptake in EGFR mutated, advanced NSCLC. EJNMMI Res. 2016, 6, 10. [Google Scholar] [CrossRef] [Green Version]
- Traxl, A.; Mairinger, S.; Filip, T.; Sauberer, M.; Stanek, J.; Poschner, S.; Jaäger, W.; Zoufal, V.; Novarino, G.; Tournier, N.; et al. Inhibition of ABCB1 and ABCG2 at the Mouse Blood−Brain Barrier with Marketed Drugs To Improve Brain Delivery of the Model ABCB1/ABCG2 Substrate [11C]erlotinib. Mol. Pharm. 2019, 16, 1282–1293. [Google Scholar] [CrossRef]
- Tournier, N.; Goutal, S.; Auvity, S.; Traxl, A.; Mairinger, S.; Wanek, T.; Helal, O.-B.; Buvat, I.; Soussan, M.; Caillé, F.; et al. Strategies to Inhibit ABCB1-and ABCG2-Mediated Efflux Transport of Erlotinib at the Blood-Brain Barrier: A PET Study on Nonhuman Primates. J. Nucl. Med. 2017, 58, 117–122. [Google Scholar] [CrossRef] [Green Version]
- Tournier, N.; Goutal, S.; Mairinger, S.; Hernández-Lozano, I.; Filip, T.; Sauberer, M.; Caillé, F.; Breuil, L.; Stanek, J.; Freeman, A.F.; et al. Complete inhibition of ABCB1 and ABCG2 at the blood-brain barrier by co-infusion of erlotinib and tariquidar to improve brain delivery of the model ABCB1/ABCG2 substrate [11C]erlotinib. J. Cereb. Blood Flow Metab. 2020, 41, 1634–1646. [Google Scholar] [CrossRef]
- Verheijen, R.B.; Yaqub, M.; Sawicki, E.; Van Tellingen, O.; Lammertsma, A.A.; Nuijen, B.; Schellens, J.H.M.; Beijnen, J.H.; Huitema, A.D.R.; Harry Hendrikse, N.; et al. Molecular Imaging of ABCB1 and ABCG2 Inhibition at the Human Blood-Brain Barrier Using Elacridar and 11C-Erlotinib PET. J. Nucl. Med. 2018, 59, 973–979. [Google Scholar] [CrossRef] [Green Version]
- Bauer, M.; Karch, R.; Wulkersdorfer, B.; Philippe, C.; Nics, L.; Klebermass, E.M.; Weber, M.; Poschner, S.; Haslacher, H.; Jäger, W.; et al. A proof-of-concept study to inhibit ABCG2- And ABCB1-mediated efflux transport at the human blood–brain barrier. J. Nucl. Med. 2019, 60, 486–491. [Google Scholar] [CrossRef] [Green Version]
- Solca, F.; Dahl, G.; Zoephel, A.; Bader, G.; Sanderson, M.; Klein, C.; Kraemer, O.; Himmelsbach, F.; Haaksma, E.; Adolf, G.R. Target Binding Properties and Cellular Activity of Afatinib (BIBW 2992), an Irreversible ErbB Family Blocker. J. Pharmacol. Exp. Ther. 2012, 343, 342–350. [Google Scholar] [CrossRef]
- Dickinson, P.A.; Cantarini, M.V.; Collier, J.; Frewer, P.; Martin, S.; Pickup, K.; Ballard, P. Metabolic Disposition of Osimertinib in Rats, Dogs, and Humans: Insights into a Drug Designed to Bind Covalently to a Cysteine Residue of Epidermal Growth Factor Receptor. Drug Metab. Dispos. 2016, 44, 1201–1212. [Google Scholar] [CrossRef] [PubMed] [Green Version]
- Colclough, N.; Chen, K.; Johnström, P.; Strittmatter, N.; Yan, Y.; Wrigley, G.L.; Schou, M.; Goodwin, R.; Varnäs, K.; Adua, S.J.; et al. Preclinical Comparison of the Blood–brain barrier Permeability of Osimertinib with Other EGFR TKIs. Clin. Cancer Res. 2021, 27, 189–201. [Google Scholar] [CrossRef] [PubMed]
- Wakeling, A.E.; Guy, S.P.; Woodburn, J.R.; Ashton, S.E.; Curry, B.J.; Barker, A.J.; Gibson, K.H. ZD1839 (Iressa): An orally active inhibitor of epidermal growth factor signaling with potential for cancer therapy. Cancer Res. 2002, 62, 5749–5754. [Google Scholar] [PubMed]
- Engelman, J.A.; Zejnullahu, K.; Gale, C.M.; Lifshits, E.; Gonzales, A.J.; Shimamura, T.; Zhao, F.; Vincent, P.W.; Naumov, G.N.; Bradner, J.E.; et al. PF00299804, an Irreversible Pan-ERBB Inhibitor, Is Effective in Lung Cancer Models with EGFR and ERBB2 Mutations that Are Resistant to Gefitinib. Cancer Res. 2007, 67, 11924–11932. [Google Scholar] [CrossRef] [PubMed] [Green Version]
- Dong, Q.; Yu, P.; Ye, L.; Zhang, J.; Wang, H.; Zou, F.; Tian, J.; Kurihara, H. PCC0208027, a novel tyrosine kinase inhibitor, inhibits tumor growth of NSCLC by targeting EGFR and HER2 aberrations. Sci. Rep. 2019, 9, 5692. [Google Scholar] [CrossRef] [Green Version]
- Mitsudomi, T.; Yatabe, Y. Epidermal growth factor receptor in relation to tumor development: EGFR gene and cancer. FEBS J. 2010, 277, 301–308. [Google Scholar] [CrossRef]
- Hildebrandt, I.J.; Su, H.; Weber, W.A. Anesthesia and Other Considerations for in Vivo Imaging of Small Animals. ILAR J. 2008, 49, 17–26. [Google Scholar] [CrossRef] [Green Version]
- Li, J.; Zhao, M.; He, P.; Hidalgo, M.; Baker, S.D. Differential Metabolism of Gefitinib and Erlotinib by Human Cytochrome P450 Enzymes. Clin. Cancer Res. 2007, 13, 3731–3737. [Google Scholar] [CrossRef] [Green Version]
- Waxman, D.J.; Holloway, M.G. Sex Differences in the Expression of Hepatic Drug Metabolizing Enzymes. Mol. Pharmacol. 2009, 76, 215–228. [Google Scholar] [CrossRef] [Green Version]
- Kato, R.; Yamazoe, Y. Sex-specific cytochrome P450 as a cause of sex-and species-related differences in drug toxicity. Toxicol. Lett. 1992, 64–65, 661–667. [Google Scholar] [CrossRef]
- Midha, A.; Dearden, S.; McCormack, R. EGFR mutation incidence in non-small-cell lung cancer of adenocarcinoma histology: A systematic review and global map by ethnicity (mutMapII). Am. J. Cancer Res. 2015, 5, 2892–2911. [Google Scholar]


| Cell Line | Disease | Tissue | EGFR Status [41] | Other Mutations [41] | Maximum Uptake (Determined By) |
|---|---|---|---|---|---|
| SH-SY5Y | Neuroblastoma | Bone marrow | Wild-type EGFR | ALK | 0.23–0.33%ID/mL at 8 min * (PET) [36] |
| MDA-MB-231 | Adenocarcinoma | Mammary gland/breast; pleural effusion | Wild-type EGFR | CDKN2A, BRAF, KRAS, TERT, TP53 | 0.54 ± 0.10%ID/g at 10 min (ex vivo), T/M 0.84 [38] |
| MDA-MB-468 | Adenocarcinoma | Mammary gland/breast; pleural effusion | Wild-type EGFR (amplification) | PTEN, RB1, TP53 | 1.39 ± 0.28%ID/g at 10 min (ex vivo), T/M 1.81 [38] |
| A549 | Carcinoma | Lung | Wild-type EGFR | KRAS, STK11, TP53 | 0.89 ± 0.13%ID/g at 10 min (ex vivo), T/M 1.32 [38] Unknown (PET) [42] |
| HCC827 | Adenocarcinoma | Lung | Del19 | TP53 | Unknown (PET) [42] |
| H1975 | Adenocarcinoma; NSCLC | Lung | L858R/T790M | PIK3CA, TP53 | Unknown (PET) [42] |
| A431 | Epidermoid carcinoma | Skin/epidermis | EGFR-PPARGC1A fusion | TP53 | 0.3%ID/g at 2–3 min (PET) [37] |
| PC9 | Adenocarcinoma | Lung | Del19 | TP53 | Unknown (PET) [42] |
| Tracer | Animal | Metabolism | Method | Maximum Uptake in A431 Xenografts |
|---|---|---|---|---|
| 1 | BALB cBy nu/nu male mice | Extractable fraction in blood: 16% Intact tracer in the fraction: 75% at 20 min | Radio-TLC [48] | Ex vivo: 1.34 ± 0.79%ID/g T/B 1.62 ± 0.68 at 60 min [48] |
| 2 | BALB cBy nu/nu male mice | Extractable fraction in blood: 36% Intact tracer in the fraction: 56% at 10 min | Radio-TLC [48] | Ex vivo: 2.90 ± 1.67%ID/g T/B 0.89 ± 0.63 at 5 min In vivo: T/B ratio of 0.55, T/M ratio of 0.83 at 10 min [48] |
| 3 | WAG rnu/rnu male rats | Extractable fraction in blood: 32% Intact tracer in the fraction: 90% at 15 min Extractable fraction in blood: 17% Intact tracer in the fraction: 75% at 60 min | Radio-TLC [49] | Ex vivo: 0.09 ± 0.039%ID/g T/B 0.54 ± 0.04 at 15 min In vivo: T/B 2.86, T/M 4.61 at 120 min [49] |
| Nude Hsd:RH-rnu/rnu male rats | Intact tracer in blood: 29% at 15 min * Intact tracer in blood: 13% at 60 min * | Radio-TLC [50] | ND | |
| 4 | Nude Hsd:RH-rnu/rnu male rats | Intact tracer in blood: 40% at 15 min * Intact tracer in blood: 38% at 60 min * | Radio-TLC [50] | ND |
| PD153035 [48] | 1 [48] | 2 [48] | 3 [50] | 4 [50] | 5 [51] | 6 [51] | |
|---|---|---|---|---|---|---|---|
| Lysate EGFR TK AP | 0.19 nM | 75 nM | 0.21 nM | 0.04 nM | 0.11 nM | ND | ND |
| A431 EGFR AP | 14.6 nM | 3230 nM | 3.8 nM | 6.7–20 nM | 4–10 nM | 3 ± 2 nM | 8 ± 2.5 nM |
| A431 EGFR AP, 8 h * | ND | ND | ND | 6.7–20 nM | 10–50 nM | 15 ± 7 nM | 20 ± 5 nM |
| A431 cell growth | ~2.9 μM | ~10 μM | 4.5 μM | ND | ND | ND | ND |
| Cell Line | Tissue | Disease | EGFR Status | Other Mutations [41] | Tracer | Maximum Tracer Uptake |
|---|---|---|---|---|---|---|
| U87 (U87MG) | Brain | Likely glioblastoma | Low amount of wild-type EGFR | IDH1, NF1, PTEN, TERT, TP53 | [18F]ML04 | Transfected with EGFR: 0.92 ± 0.03%ID/g, T/B 6.97 ± 0.52, T/M 5.11 ± 0.29 at 3h [52] |
| ML04-PEG4-[18F]F | Transfected with EGFR: Not specified [53] | |||||
| [11C]ML04-PEG4-OH | Transfected with EGFR: Not specified [53] | |||||
| [124I]IPQA-PEG4-OH | Transfected with EGFR: Not specified [53] | |||||
| U138MG | Brain | Glioblastoma | EGFR-negative | CDKN2A, IDH1, PTEN, TP53 | [18F]ML04 | 0.68%ID/g at 3h [52] |
| ML04-PEG4-[18F]F | Not specified [53] | |||||
| [11C]ML04-PEG4-OH | Not specified [53] | |||||
| [124I]IPQA-PEG4-OH | Not specified [53] | |||||
| H441 | Lung | Papillary adenocarcinoma | Wild-type EGFR | KRAS, TP53 | IPQA-PEG6-[18F]F | 1.59 ± 0.06 %ID/g, T/M 1.47 ± 0.09 at 120 min [54] |
| [77Br]Br-CO1686 | 3.71 ± 0.13 %ID/g at 60 min [55] | |||||
| [125I]I-CO1686 | 0.44 ± 0.06 %ID/g at 60 min [55] | |||||
| H1975 | Lung | Adenocarcinoma; NSCLC | L858R/T790M | PIK3CA, TP53 | IPQA-PEG6-[18F]F | 1.17 ± 0.18%ID/g, T/M 1.05 ± 0.10 at 120 min [54] |
| [18F]MPG | 3.93 ± 0.44%ID/g at 60 min, T/M ratio not specified [56] | |||||
| [18F]APP-1 | T/M 2.95 at 180 min [57] | |||||
| [18F]F-IRS | 1.71 ± 0.18%ID/g at 120 min [58] | |||||
| 6-O-[18F]FEE | SUV of 0.5 at 60 min [59] | |||||
| [125I]I-CO1686 | 1.77 ± 0.43%ID/g[60], 0.68 ± 0.11%ID/g at 60 min [55] | |||||
| [77Br]Br-CO1686 | 4.51 ± 0.17%ID/g at 60 min [55] | |||||
| [125I]I-osimertinib | 1.97 ± 0.30%ID/g at 4h [61] | |||||
| [77Br]Br-osimertinib | 1.96 ± 0.33%ID/g at 4h [61] | |||||
| H3255 | Lung | Adenocarcinoma | L858R | TP53 | IPQA-PEG6-[18F]F | 2.34 ± 0.13%ID/g, T/M 2.08 ± 0.19 at 120 min [54] |
| [18F]APP-1 | 3.80 ± 0.88%ID/g, T/M 13.37± 4.02 at 180 min [57] | |||||
| [125I]I-CO1686 | 1.63 ± 0.23%ID/g at 60 min [60] | |||||
| [125I]I- osimertinib | 2.93 ± 0.11%ID/g at 4h [61] | |||||
| [77Br]Br-osimertinib | 3.42 ± 0.05%ID/g at 4h [61] | |||||
| PC14 * | Lung; Lymph node | Adenocarcinoma | Del19 | TP53 | IPQA-PEG6-[18F]F | 0.99 ± 0.18%ID/g, T/M 0.9 ± 0.11 at 120 min [54] |
| K562 | Bone marrow | Chronic myelogenous leukemia | Low amount of wild-type EGFR | BCR-ABL1, TP53 | Morpholino-[124I]IPQA | rats: 0.20 ± 0.03%ID/g, T/M 1.25 at 60 min [62] mice: 0.43 ± 0.02%ID/g, T/M 1.79 at 69 min [62] |
| A431 | Skin/ epidermis | Epidermoid carcinoma | EGFR-PPARGC1A fusion | TP53 | Morpholino-[124I]IPQA | rats: 0.72 ± 0.12%ID/g, T/M 4.52 at 60 min [62] mice: 1.32 ± 0.26%ID/g, T/M 5.8 at 69 min [62] |
| H1299 | Lung; lymph node | Carcinoma; NSCLC | Wild-type EGFR | TP53, NRAS | Morpholino-[131I]IPQA | Transfected with L858R: 0.28 ± 0.00%ID/g, Del19: 0.30 ± 0.00%ID/g, EGFR: 0.35 ± 0.00%ID/g, Vector: 0.22 ± 0.00%ID/g at 60 min [63] |
| HCC827 | Lung | Adenocarcinoma | Del19 | TP53 | [18F]MPG | 7.22 ± 0.28%ID/g, T/M 5.56 at 60 min [56] |
| [18F]F-FEA-erlotinib | 0.70 ± 0.37%ID/g at 15 min, T/M 3.19 ± 0.5 at 60 min [64] | |||||
| 6-O-[18F]FEE | SUV of 1.0 at 60 min [59] | |||||
| [18F]F-IRS | 4.27 ± 0.15 %ID/g at 120 min [58] | |||||
| H520 | Lung | Squamous cell carcinoma | EGFR-negative | ATM, CDKN2A, TP53 | [18F]MPG [18F]F-IRS | 3.59 ± 0.93%ID/g at 60 min, T/M ratio not specified [56] 1.62 ± 0.08%ID/g at 120 min [58] |
| H358 | Lung /bronchiole | bronchioalveolar carcinoma: NSCLC | Wild-type EGFR | TP53, KRAS | [18F]MPG [18F]F-IRS | 4.11 ± 0.46%ID/g at 60 min, T/M ratio not specified [56] 1.68 ± 0.29%ID/g at 120 min [58] |
| QG56 | Lung | Squamous cell carcinoma | Wild-type EGFR | TP53 | 6-O-[18F]FEE | SUV of 0.3 at 60 min [59] |
| S180 | Murine | Sarcoma | [18F]icotinib derivative 1a | 1.61 ± 0.33%ID/g, T/M 1.45 at 30 min [65] | ||
| [18F]icotinib derivative 1b | 4.70 ± 0.23%ID/g, T/M 2.3 at 30 min [65] | |||||
| [18F]icotinib derivative 1c | 3.06 ± 0.22%ID/g, T/M 1.11 at 30 min [65] | |||||
| A549 | Lung | Carcinoma | Wild-type EGFR | KRAS, STK11, TP53 | [18F]icotinib derivative 1d | 0.90 ± 0.24%ID/g at 90 min [66] |
| Tracer | Animal | Metabolism | Method |
|---|---|---|---|
| [18F]Gefitinib | Scid/Scid mice | Intact tracer in plasma: >97% at 120 min | Radio-TLC [84] |
| [11C]Gefitinib | ddY mice | Intact tracer in plasma: 93 ± 3.3% at 30 min | Radio-HPLC [85] |
| C3H/HeMsNrsf mice | 86.2 ±1.5% at 60 min | Radio-HPLC [83] | |
| [11C]Erlotinib | FVB/N wild-type mice Abcb1a/b(-/-)Abcg2(-/-) mice | Intact tracer in plasma: 80 ± 9% at 25 min 54 ± 12% at 25 min | Radio-TLC [87] |
| BALB/c nude CAnN.Cg-Foxn1nu/Crl | Intact tracer in plasma: >95% at 25 min | Radio-TLC [88] | |
| NSCLC patients | Intact tracer in plasma: 54 ± 2% at 60 min 43 ± 7% at 60 min | Radio-HPLC [89] | |
| Healthy human volunteers | Intact tracer in plasma: 96.4 ± 1.3% at 40 min | Solid-phase extraction [90] | |
| [18F]Afatinib | BALB/c mice | Intact tracer in plasma: 83.3 ± 1.3% at 45 min | Radio-HPLC [91] |
| NSCLC patients | Intact tracer in plasma: 30% at 75 min | Radio-HPLC [92] | |
| [11C]Osimertinib | Healthy human volunteers | Intact tracer in plasma: 73 ± 8% at 30 min | Radio-HPLC [93] |
| U87 | A549 | H3255 | PC9/PC14 | HCC827 | H1975 | Other: | |
|---|---|---|---|---|---|---|---|
| [18F]Gefitinib | Ex vivo: | ND | Ex vivo: | ND | ND | Ex vivo: | Ex vivo: |
| SUV 0.14 ± 0.05 | SUV 0.22 ± 0.09 | SUV 0.15 ± 0.10 | U87-EGFR | ||||
| at 120 min [84] | at 120 min [84] | at 120 min [84] | SUV 0.14 ± 0.06 at 120 min [84] | ||||
| Fibrosarcoma: | |||||||
| 3.5%ID/g at 60 min [83] | |||||||
| [11C]Erlotinib | Ex vivo: | Ex vivo: | Ex vivo: | ||||
| 1.62 ± 0.47%ID/g | 3.66 ± 0.14%ID/g | NCI358: 0.69 ± 0.11%ID/g at 60 min [95] | |||||
| at 60 min [95] | at 60 min [95] | ||||||
| In vivo: | In vivo: | In vivo: | In vivo: | In vivo: | In vivo: | In vivo: | |
| SUV 0.51 ± 0.56 | T/NT 1.0 ± 0.3 | SUV 0.43 ± 0.01 at 12 min [97] | SUV 0.45 ± 0.31 at 90 min [94] | SUV 0.91 ± 0.60 at 90 min [94] | SUV 0.33 ± 0.03 | SW620 (n = 1): SUV of 0.28 [94] | |
| at 90 min [94] | at 60–90 min [96] | SUV 0.33 ± 0.09 at 60 min [97] | SUV 0.60 ± 0.01 at 12 min [97] | at 12 min [97] | U87ΔEGFRvIII: SUV of 0.46 ± 0.29 [94] | ||
| SUV 0.71 ± 0.07 at 60 min [97] | SUV 0.21 ± 0.03 | ||||||
| 3.2 ± 0.3%ID/g at 25 min [96] | at 60 min [97] | QG56: SUV 0.34 ± 0.04 at 12 min [97] | |||||
| T/NT 1.9 ± 0.5 at 60–90 min [96] | T/NT 1.0 ± 0.3 at 60–90 min [96] | SUV 0.20 ± 0.01 at 60 min [97] IC50: 8.9 µM [97] | |||||
| VT 0.96 ± 0.15 in 10–60 min interval [88] | A431: VT 0.75 ± 0.06 in 10–60 min [88] | ||||||
| IC50: 40nM [97] | IC50: 28.5 ± 4.5nM [88] | IC50: 4.3 µM [97] | HCC827ERLO: VT 1.05 ± 0.26 in 10–60 min, IC50: 9.8 ± 7.4µM | ||||
| IC50: 4 nM [97] | HCC827EPR: VT 1.00 ± 0.15 in 10–60 min, IC50: 5.4 ± 2.3µM [88] | ||||||
| [18F]Afatinib | ND | Ex vivo: | ND | ND | Ex vivo: | ND | |
| 2.17 %ID/g at 5 min, | 1.56 %ID/g at 5 min, | ||||||
| T/M 6.37 at 120 min | T/M 3.83 at 120 min | ||||||
| [91] | [91] | ||||||
| In vivo: | In vivo: | In vivo: | |||||
| T/NT 1.5 ± 0.3 | T/NT 2.3 ± 0.4 | T/NT 0.8 ± 0.2 | |||||
| at 90–120 min [96] | at 90–120 min [96] | at 90–120 min [96] | |||||
| 1.2 ± 0.2%ID/g at 10 min [96] |
| Inhibitor | EGFR Wild-Type | EGFR L858R | EGFR D746–750 | HER2 | HER4 |
|---|---|---|---|---|---|
| PD153035 | 29 ± 5.1 pM | 2.3 µM | |||
| Gefitinib | 33 nM [114] 3 nM [20,115] | 0.8 nM [20] | 3.7–10 µM [114] 1.83 µM [20] 343 nM [115] | 476 nM [115] | |
| Erlotinib | 0.56 nM [115] 0.25 nM [116] | 0.36 nM [116] | 0.41 nM [116] | 512 nM [115] 22 nM [116] | 790 nM [115] 265 nM [116] |
| Afatinib | 0.5 nM [20] | 0.4 nM [20] | 14 nM [20] | ||
| Osimertinib | 1.2 nM [116] | 2.1 nM [116] | 1.2 nM [116] | 1.69 nM [116] | 3.06 nM [116] |
Publisher’s Note: MDPI stays neutral with regard to jurisdictional claims in published maps and institutional affiliations. |
© 2022 by the authors. Licensee MDPI, Basel, Switzerland. This article is an open access article distributed under the terms and conditions of the Creative Commons Attribution (CC BY) license (https://creativecommons.org/licenses/by/4.0/).
Share and Cite
Högnäsbacka, A.; Poot, A.J.; Vugts, D.J.; van Dongen, G.A.M.S.; Windhorst, A.D. The Development of Positron Emission Tomography Tracers for In Vivo Targeting the Kinase Domain of the Epidermal Growth Factor Receptor. Pharmaceuticals 2022, 15, 450. https://doi.org/10.3390/ph15040450
Högnäsbacka A, Poot AJ, Vugts DJ, van Dongen GAMS, Windhorst AD. The Development of Positron Emission Tomography Tracers for In Vivo Targeting the Kinase Domain of the Epidermal Growth Factor Receptor. Pharmaceuticals. 2022; 15(4):450. https://doi.org/10.3390/ph15040450
Chicago/Turabian StyleHögnäsbacka, Antonia, Alex J. Poot, Danielle J. Vugts, Guus A. M. S. van Dongen, and Albert D. Windhorst. 2022. "The Development of Positron Emission Tomography Tracers for In Vivo Targeting the Kinase Domain of the Epidermal Growth Factor Receptor" Pharmaceuticals 15, no. 4: 450. https://doi.org/10.3390/ph15040450