
Validation of a Custom Interface Pressure Measurement System to Improve Fitting of Transtibial Prosthetic Check Sockets
 ,
,  ,
,
Abstract
:1. Introduction
2. Materials and Methods
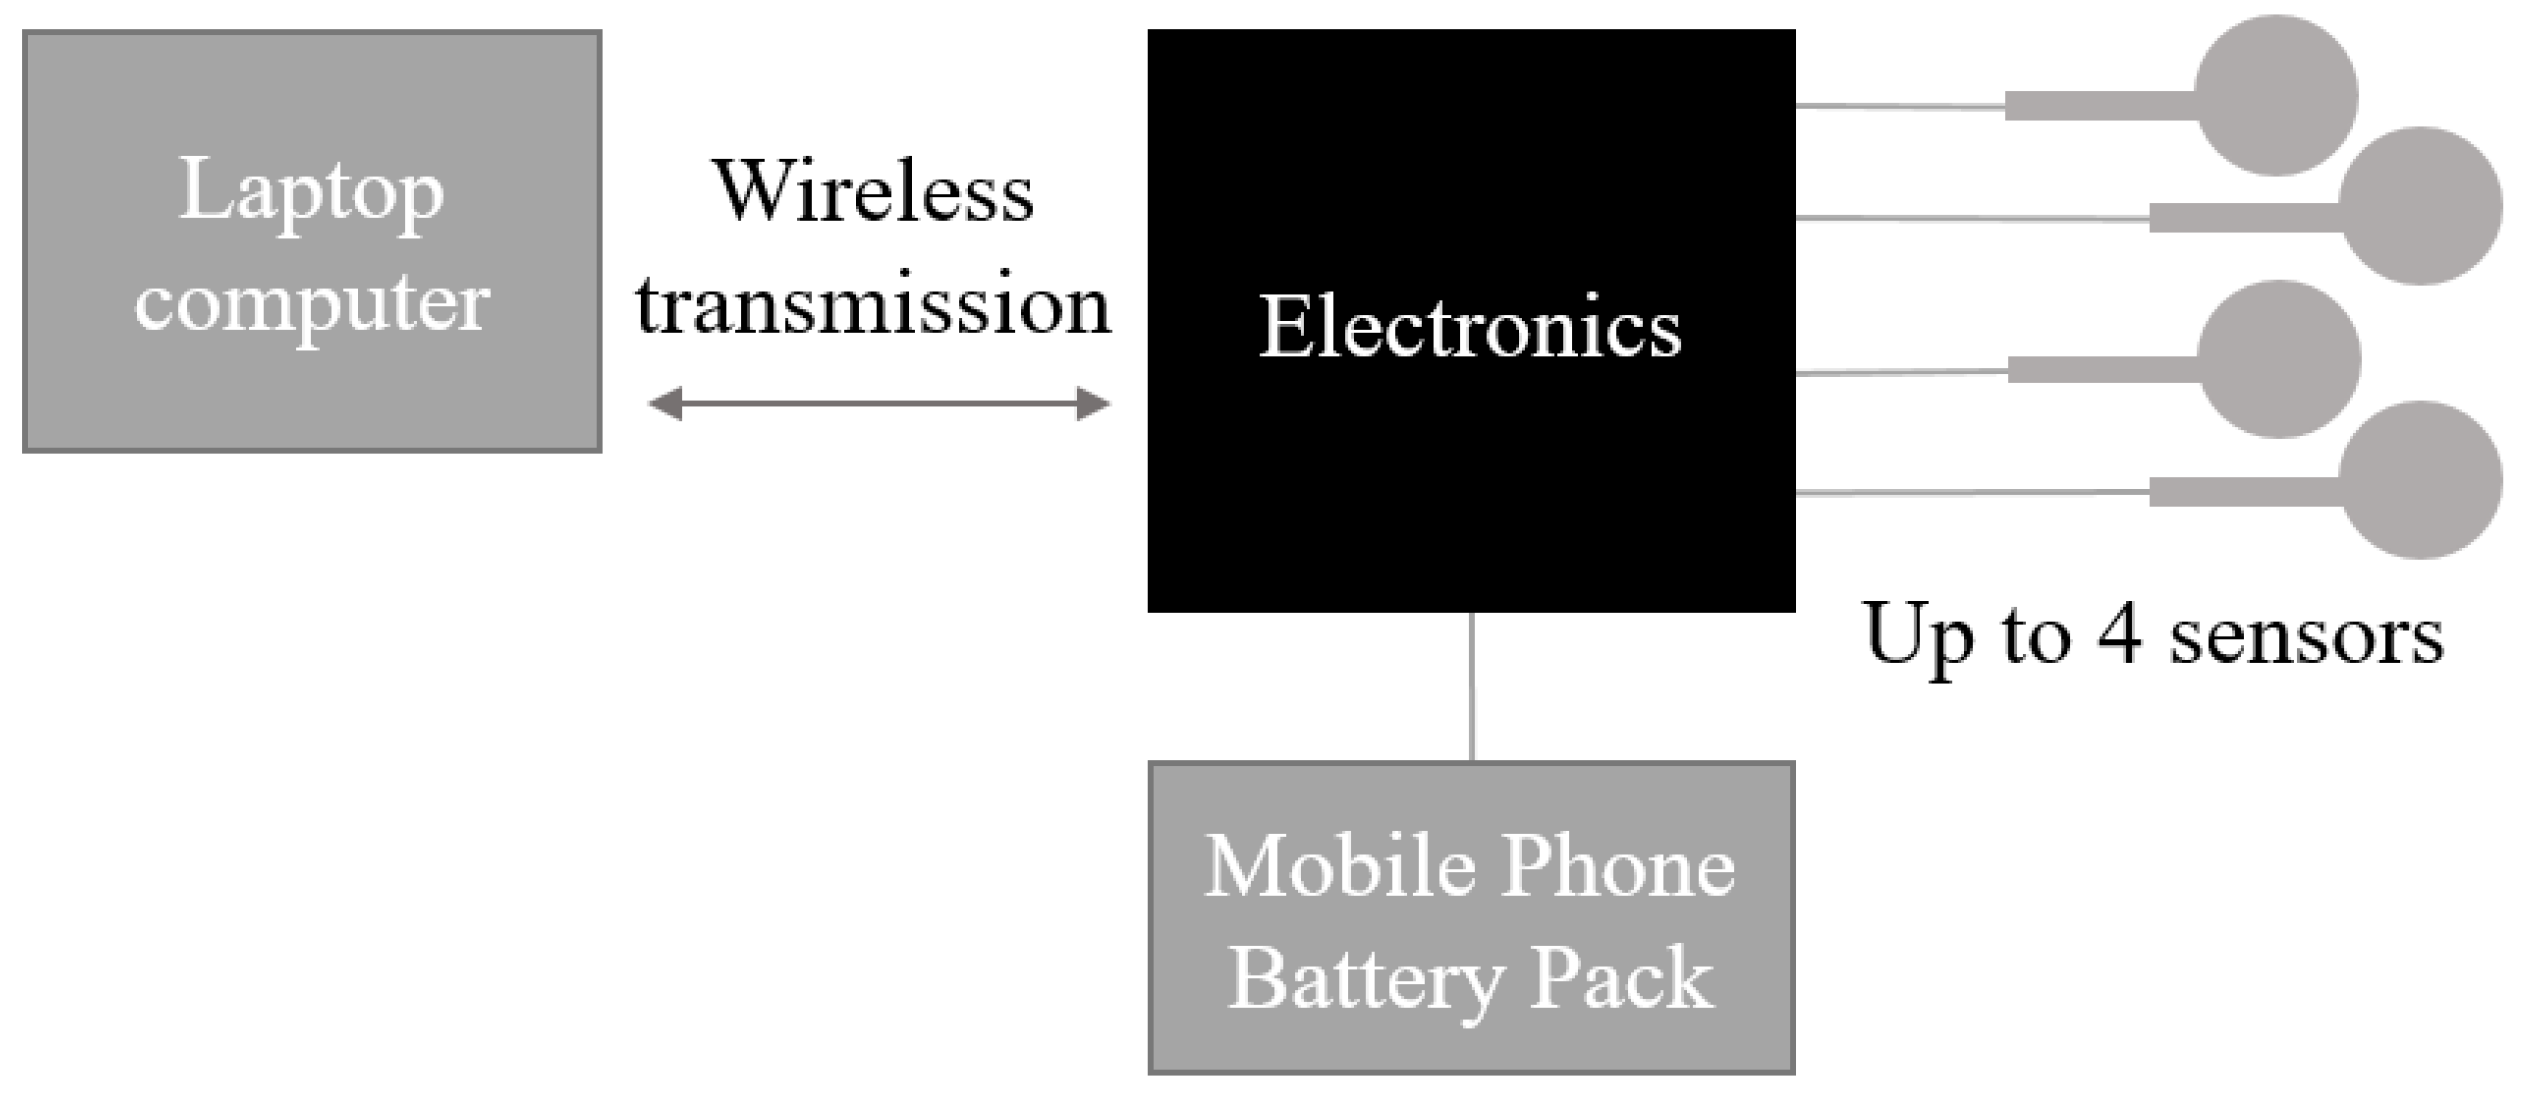
2.1. Sensor System Development
2.1.1. Portable Electronics Module
2.1.2. Laptop Fixed Module
2.1.3. Firmware Description
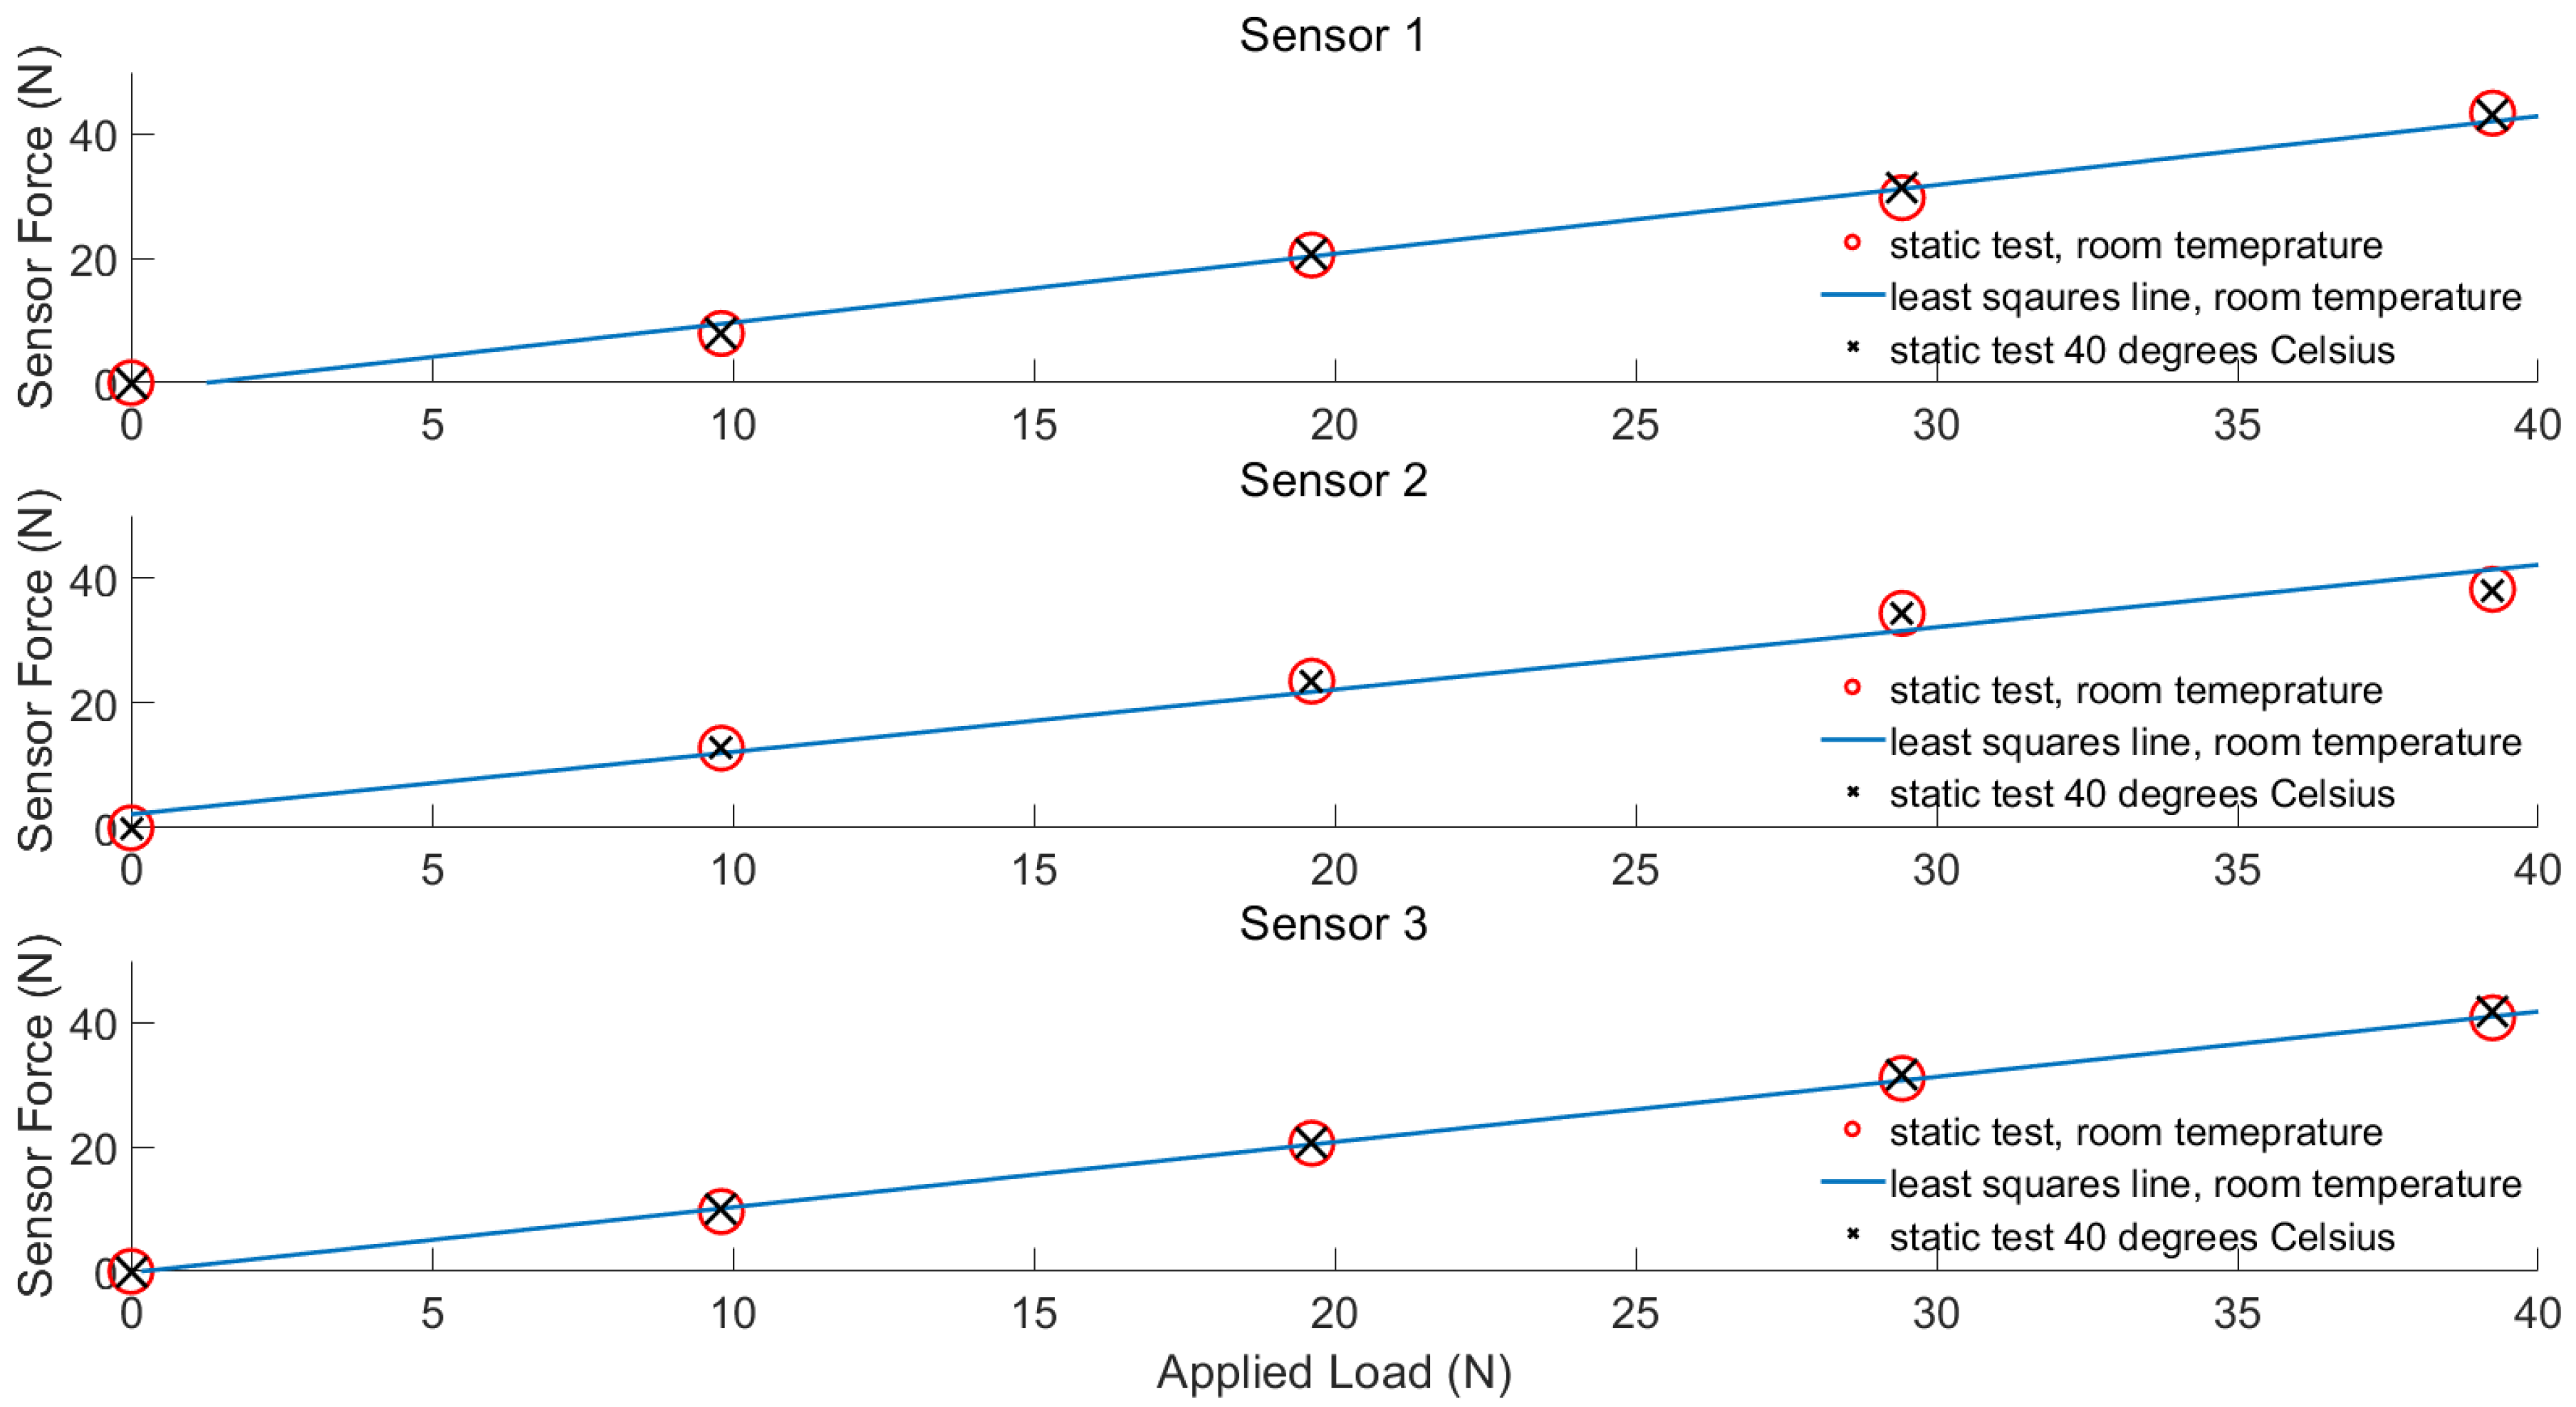
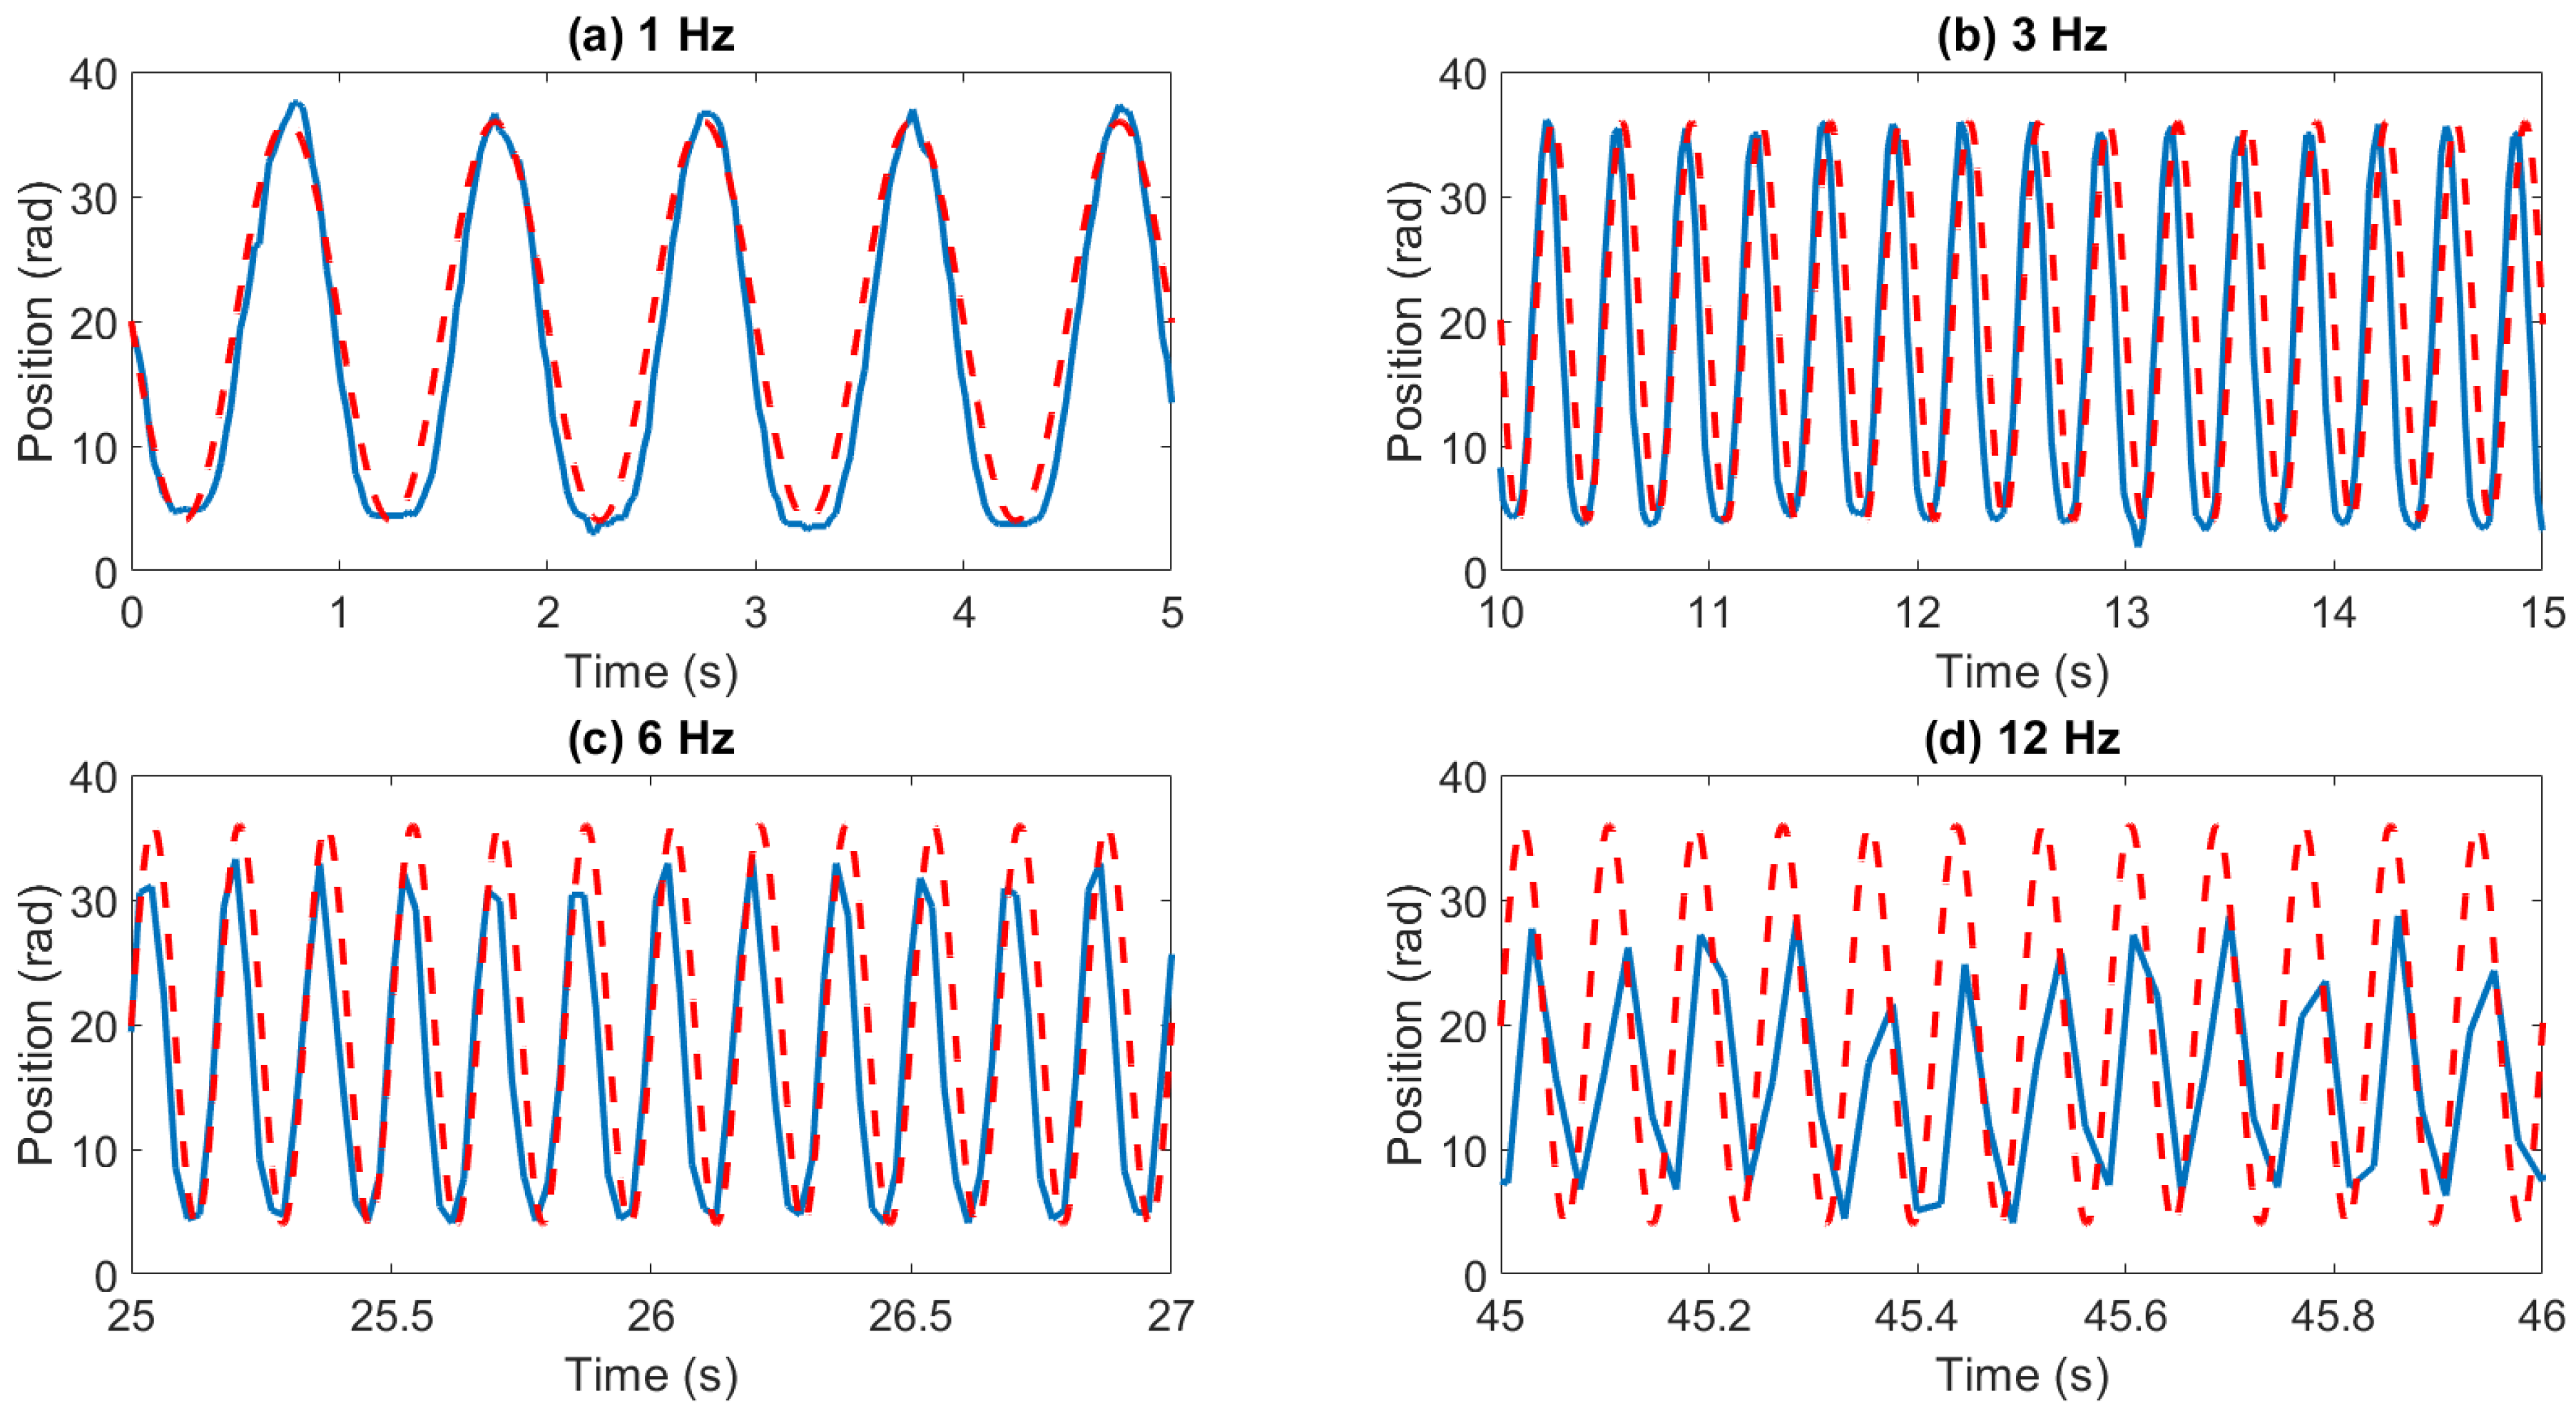
2.2. Sensor Characterisation
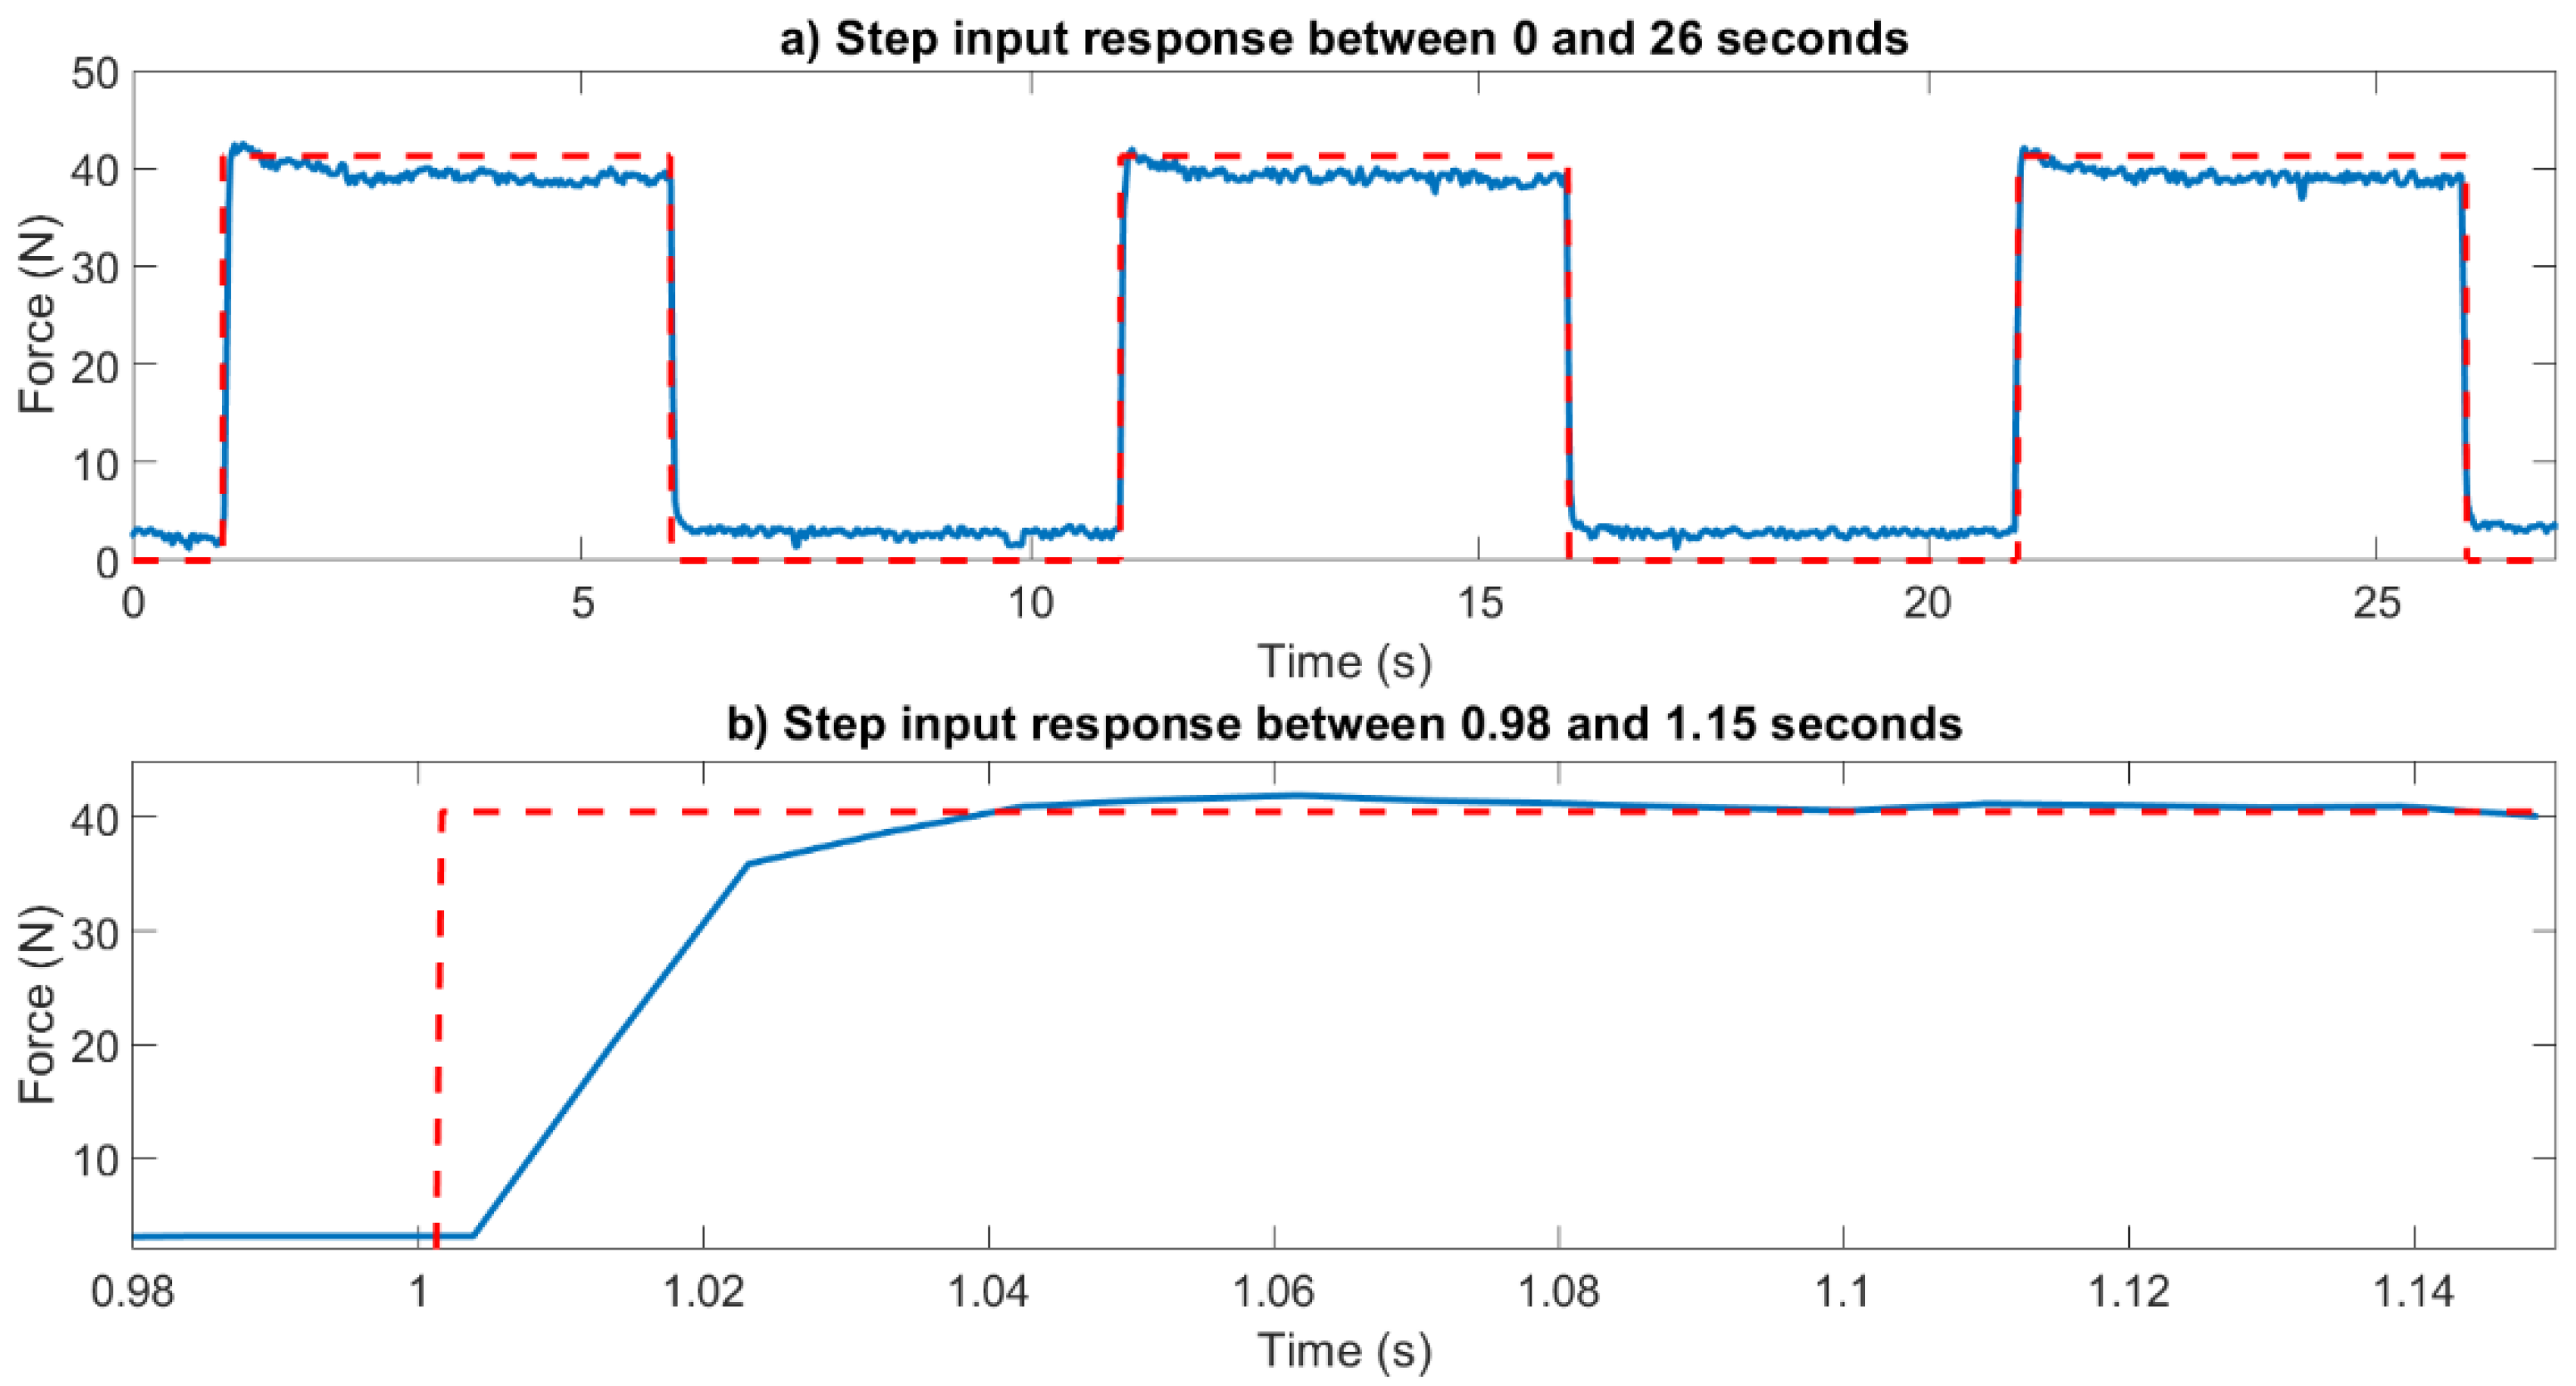
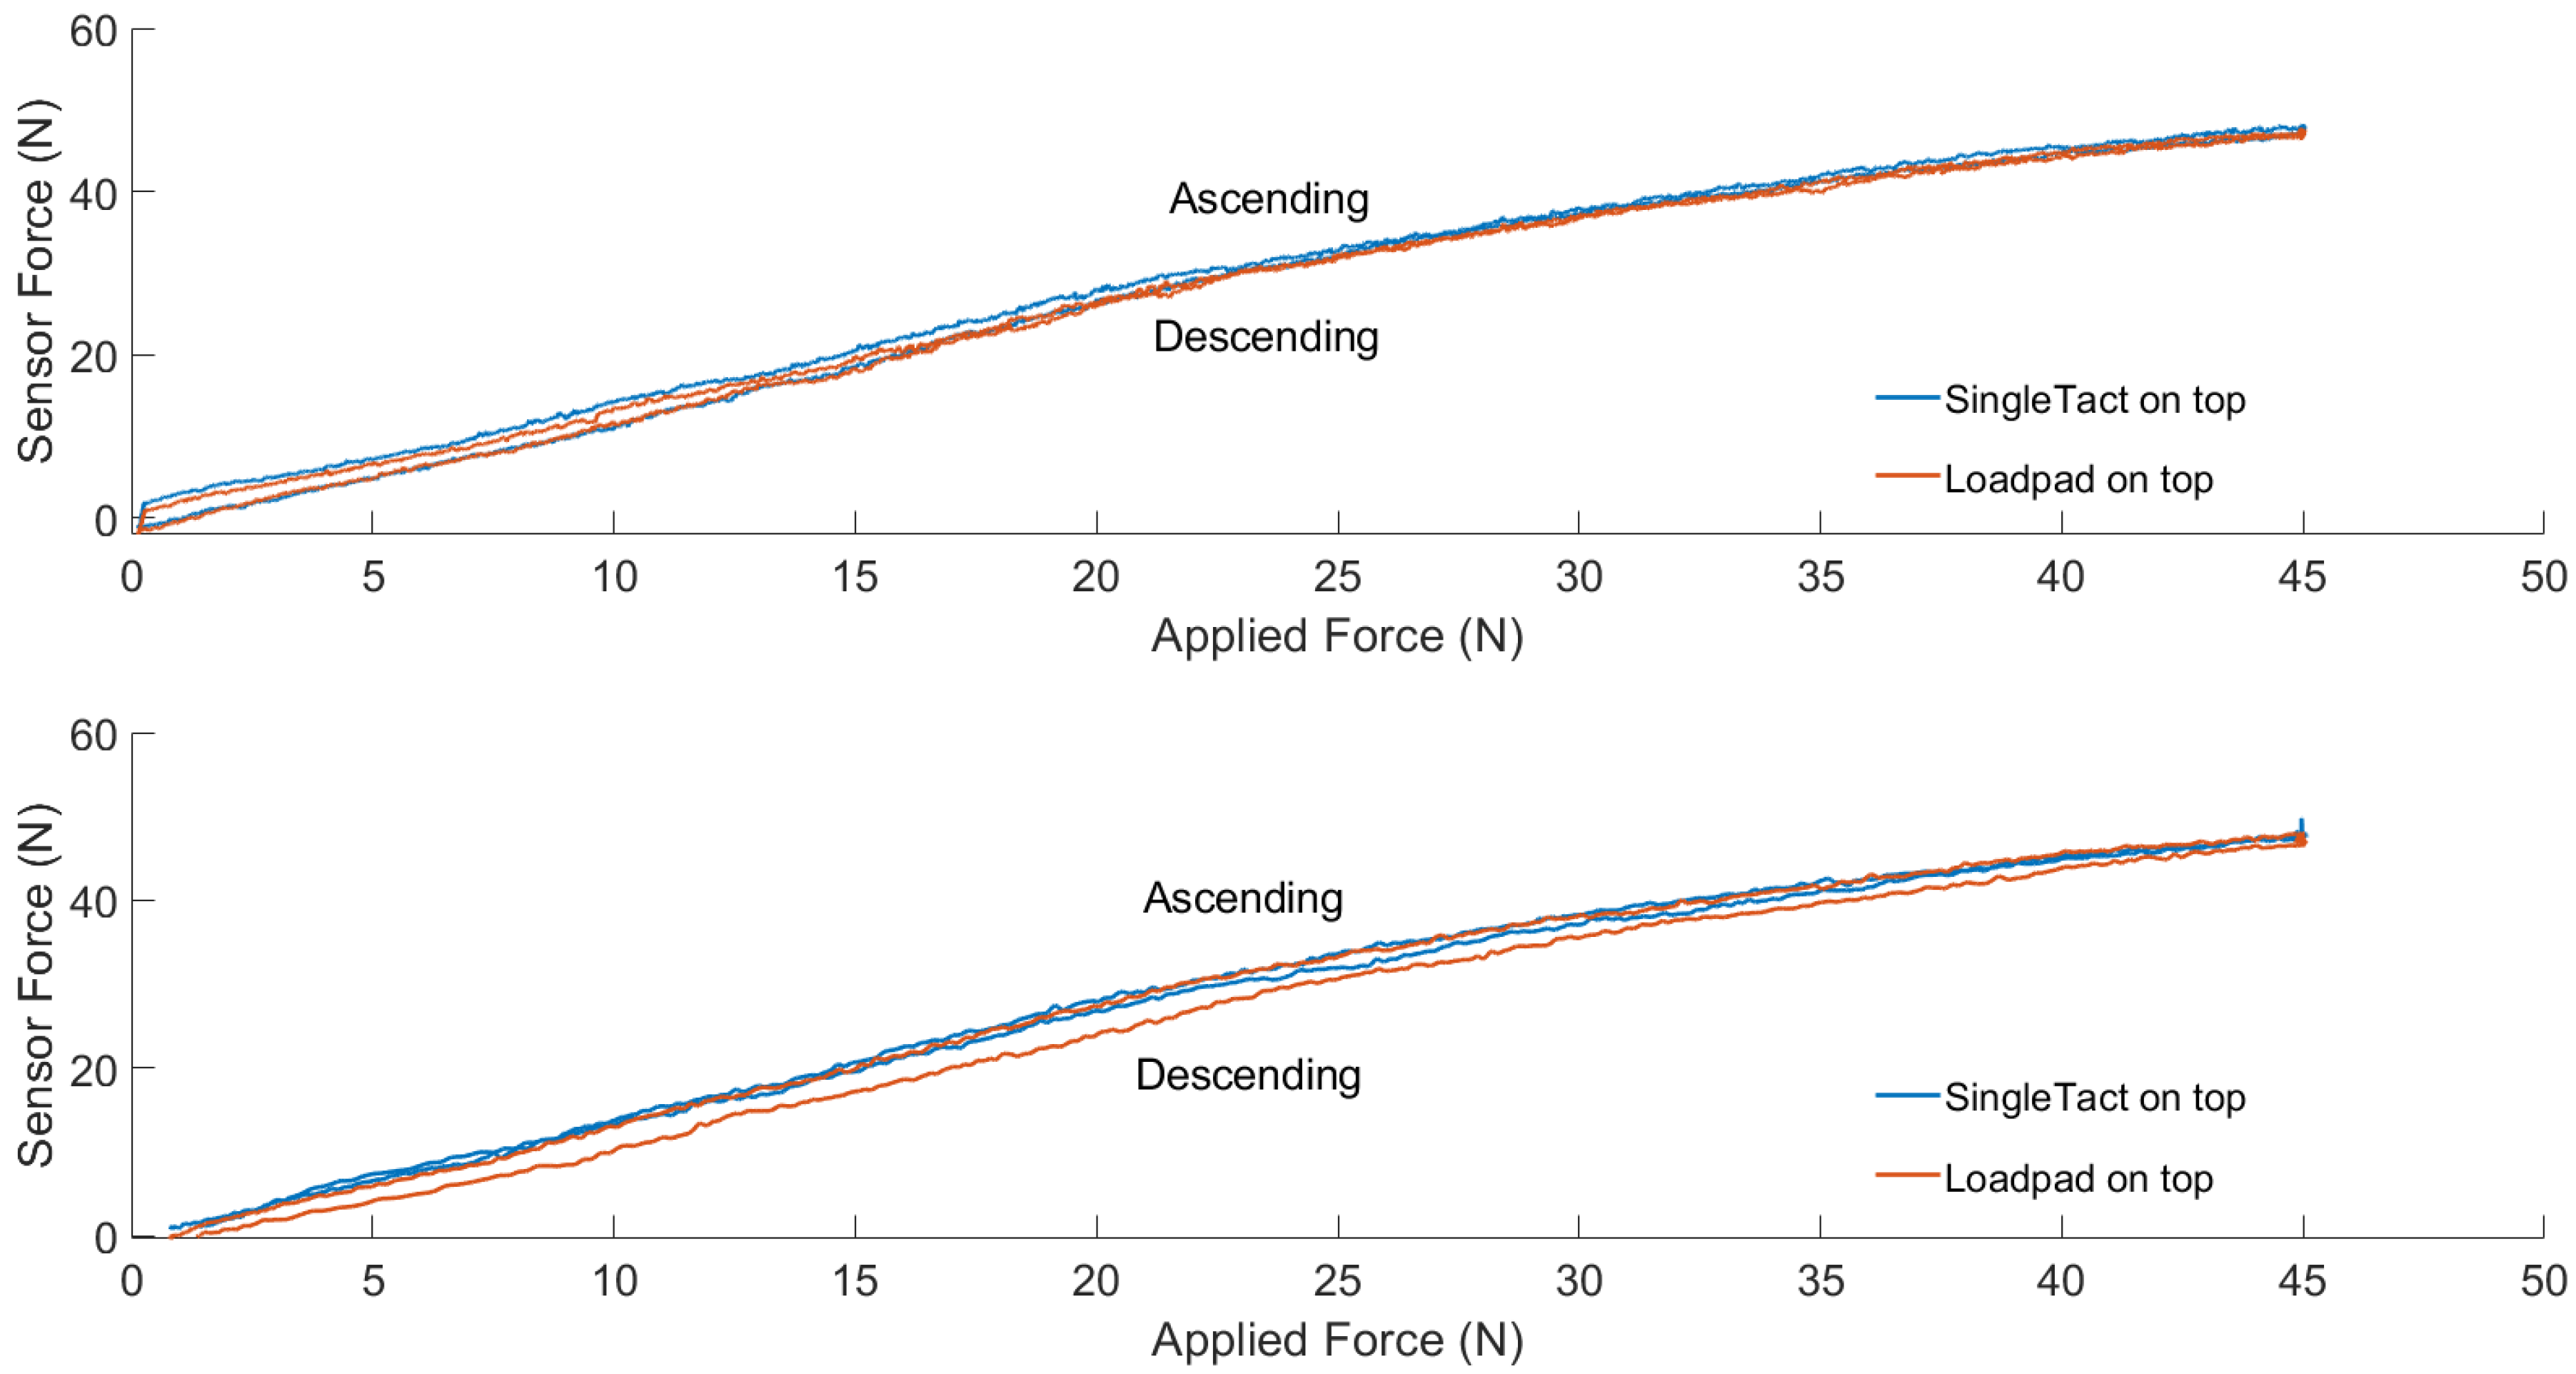
2.3. Benchtop Validation
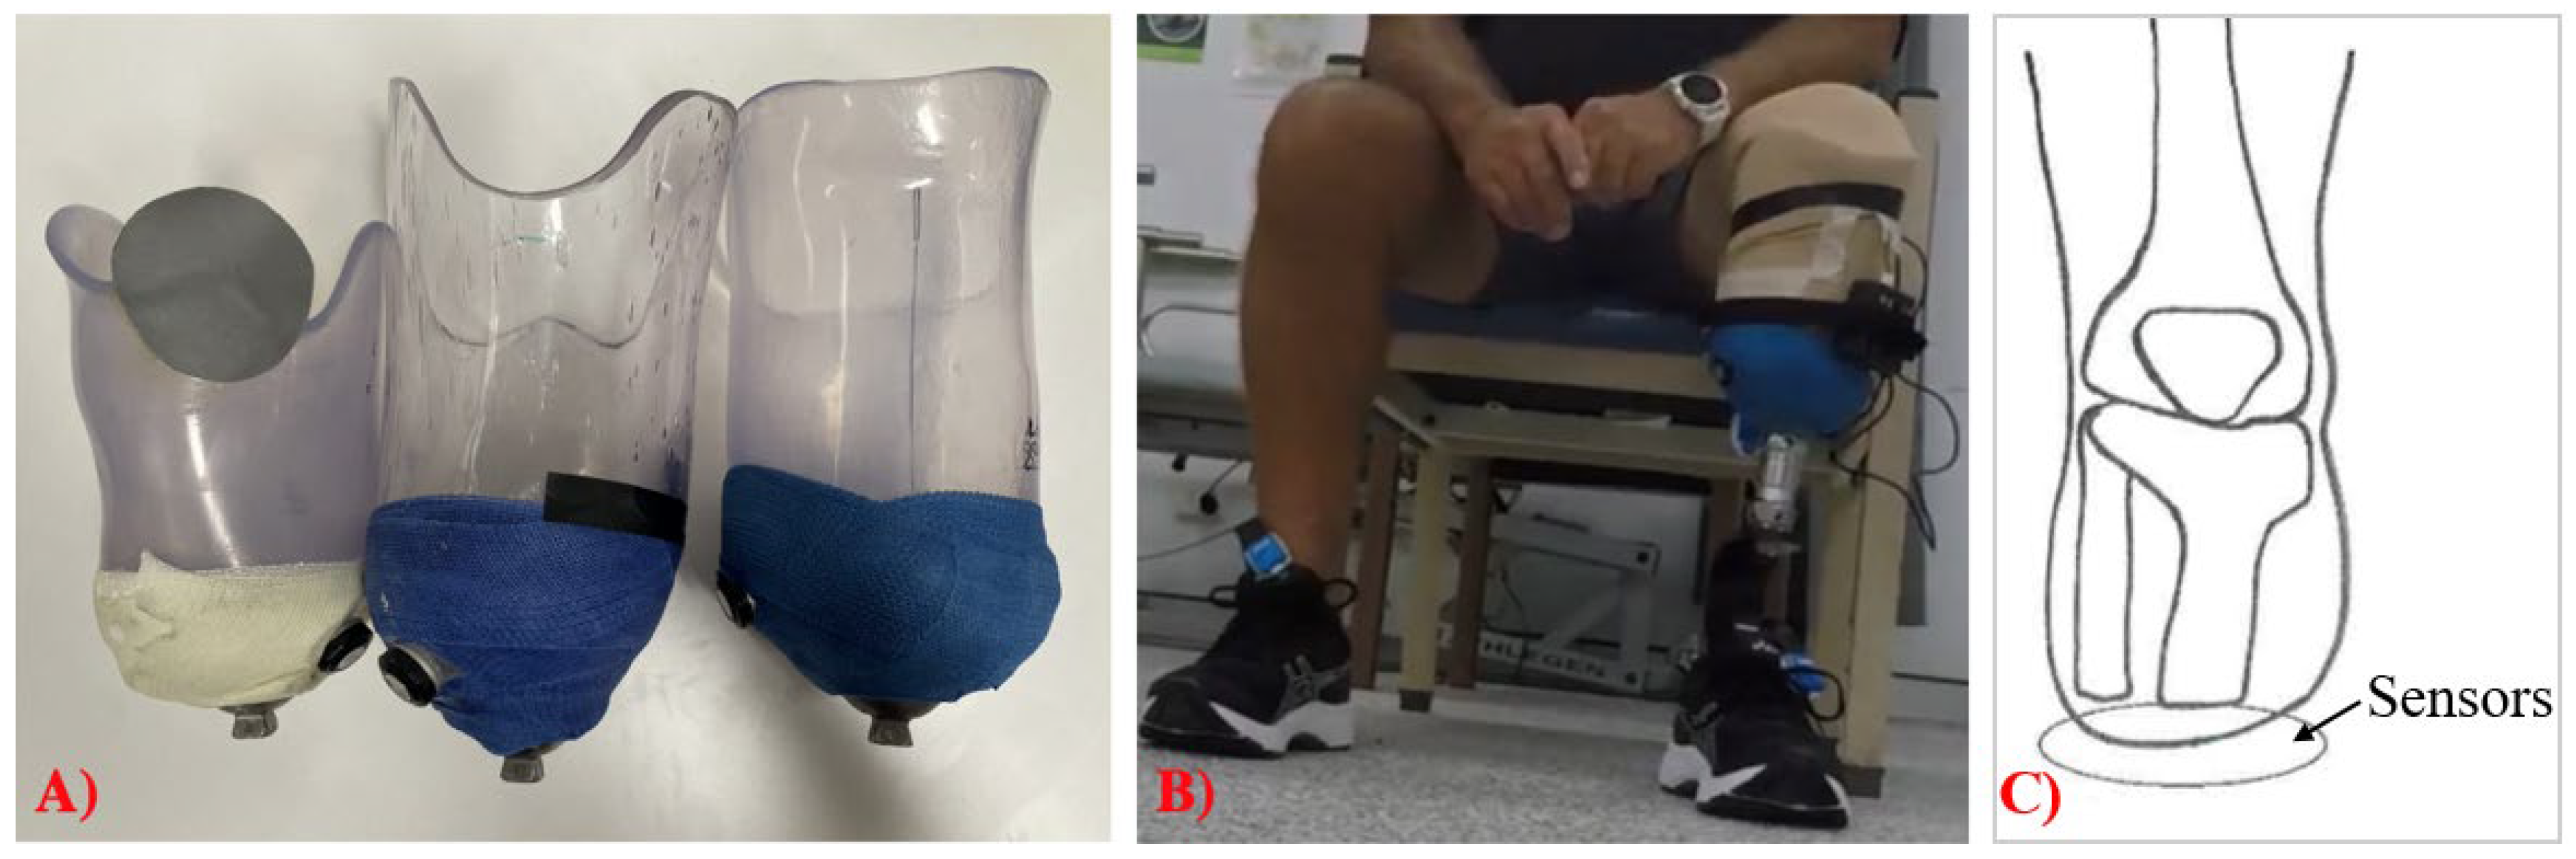
2.4. Clinical Sensor Validation
2.4.1. Participants
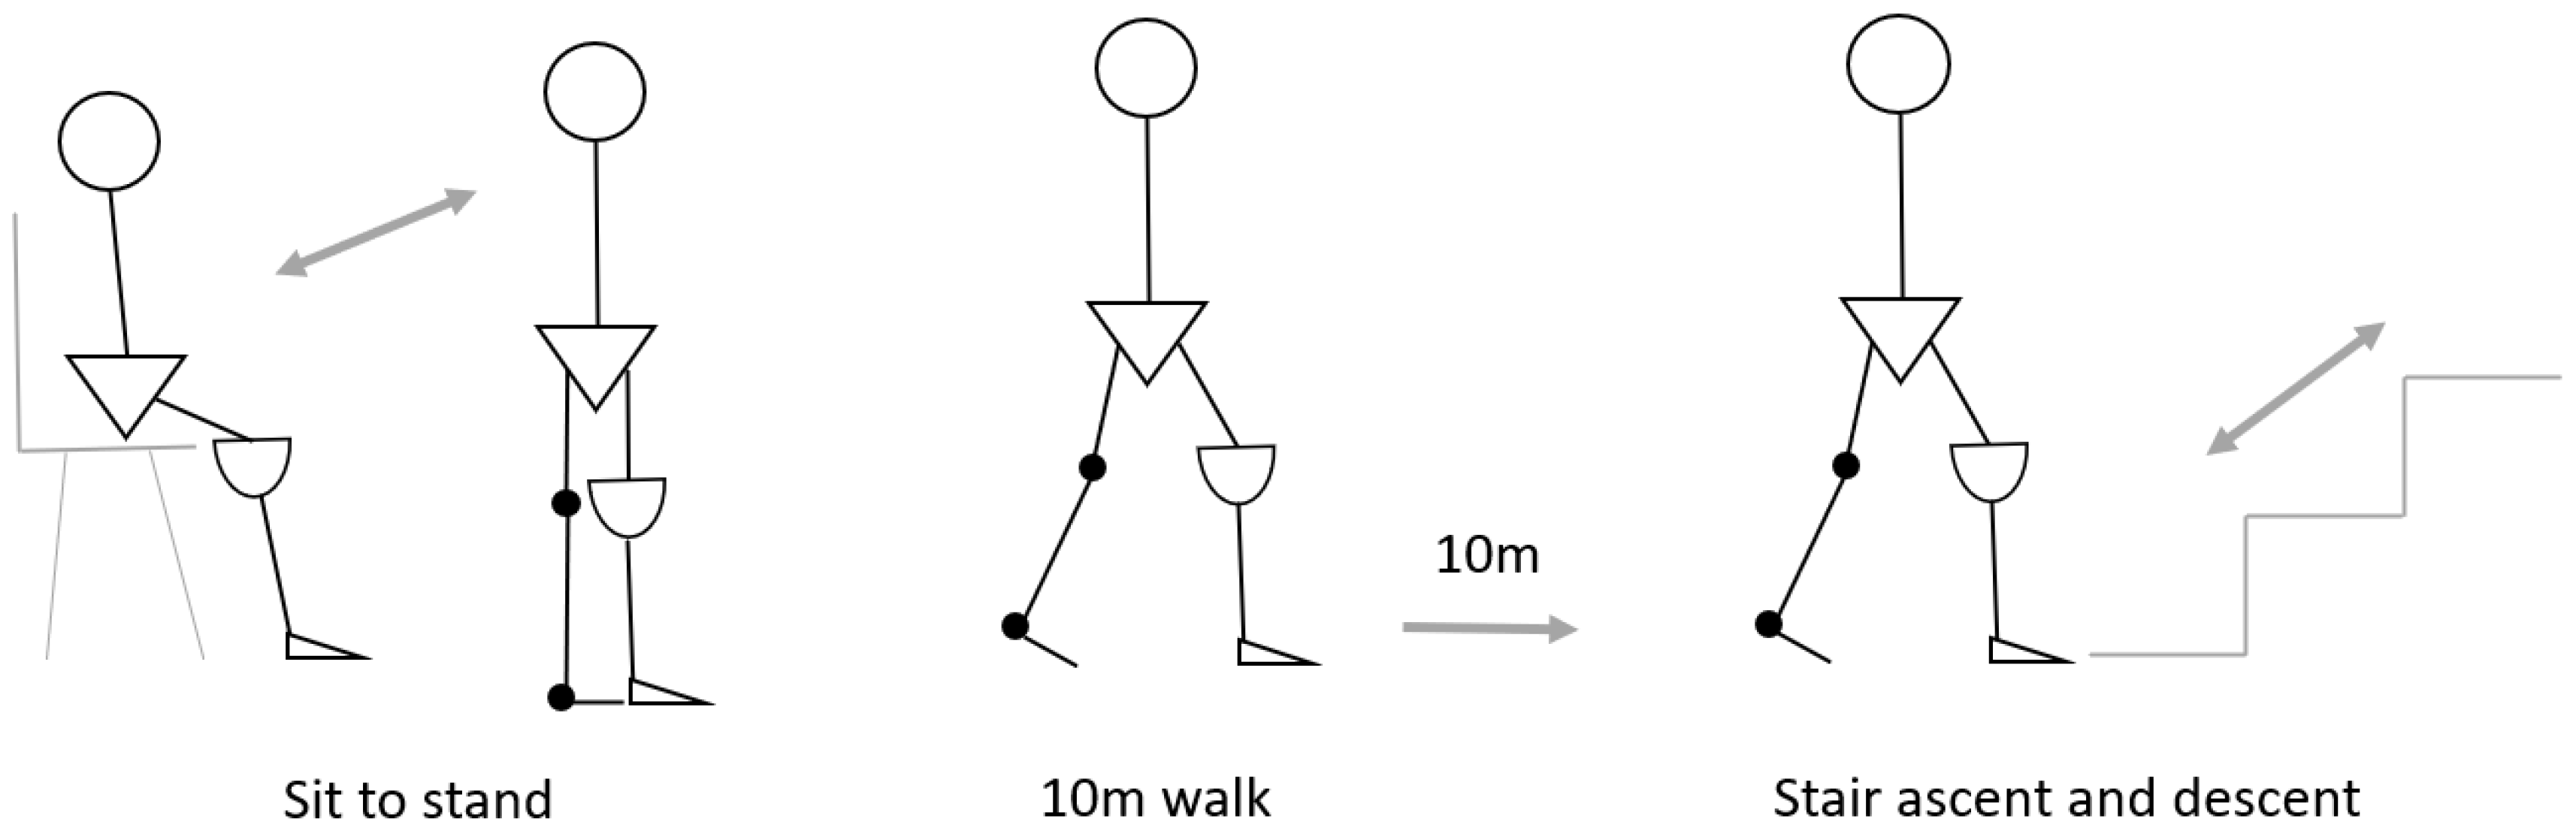
2.4.2. Experimental Design
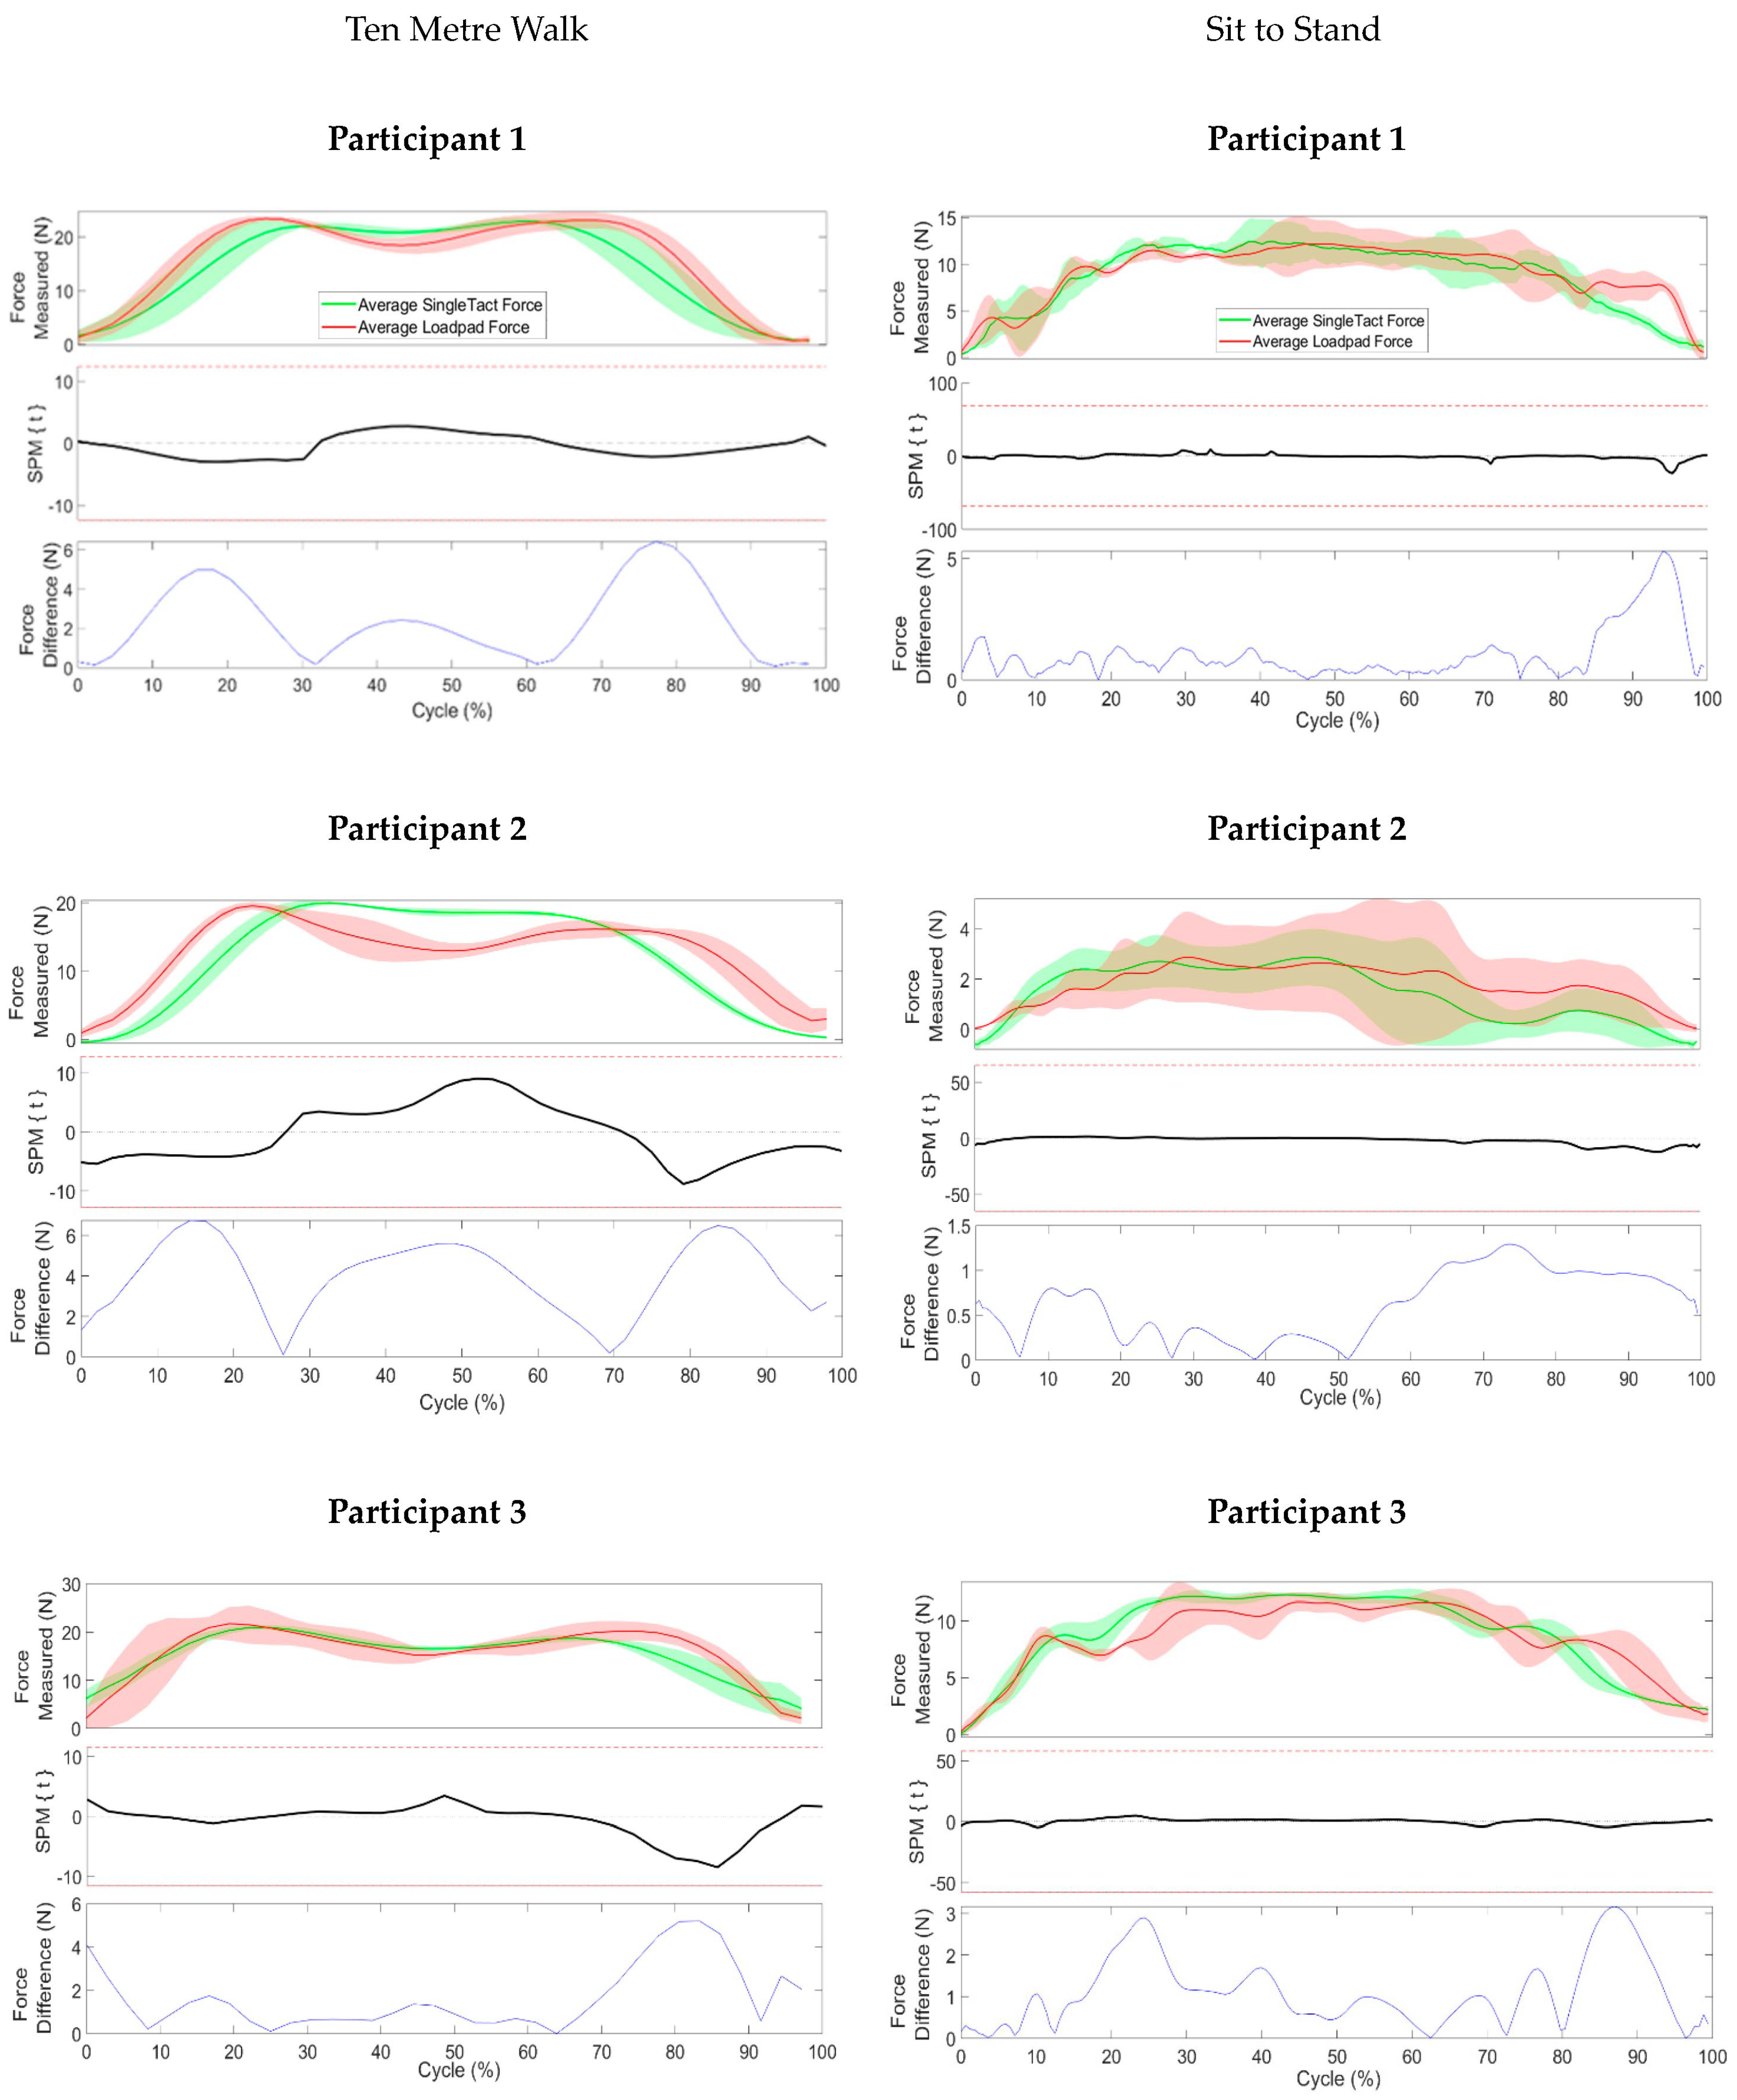
Ten Metre Walk
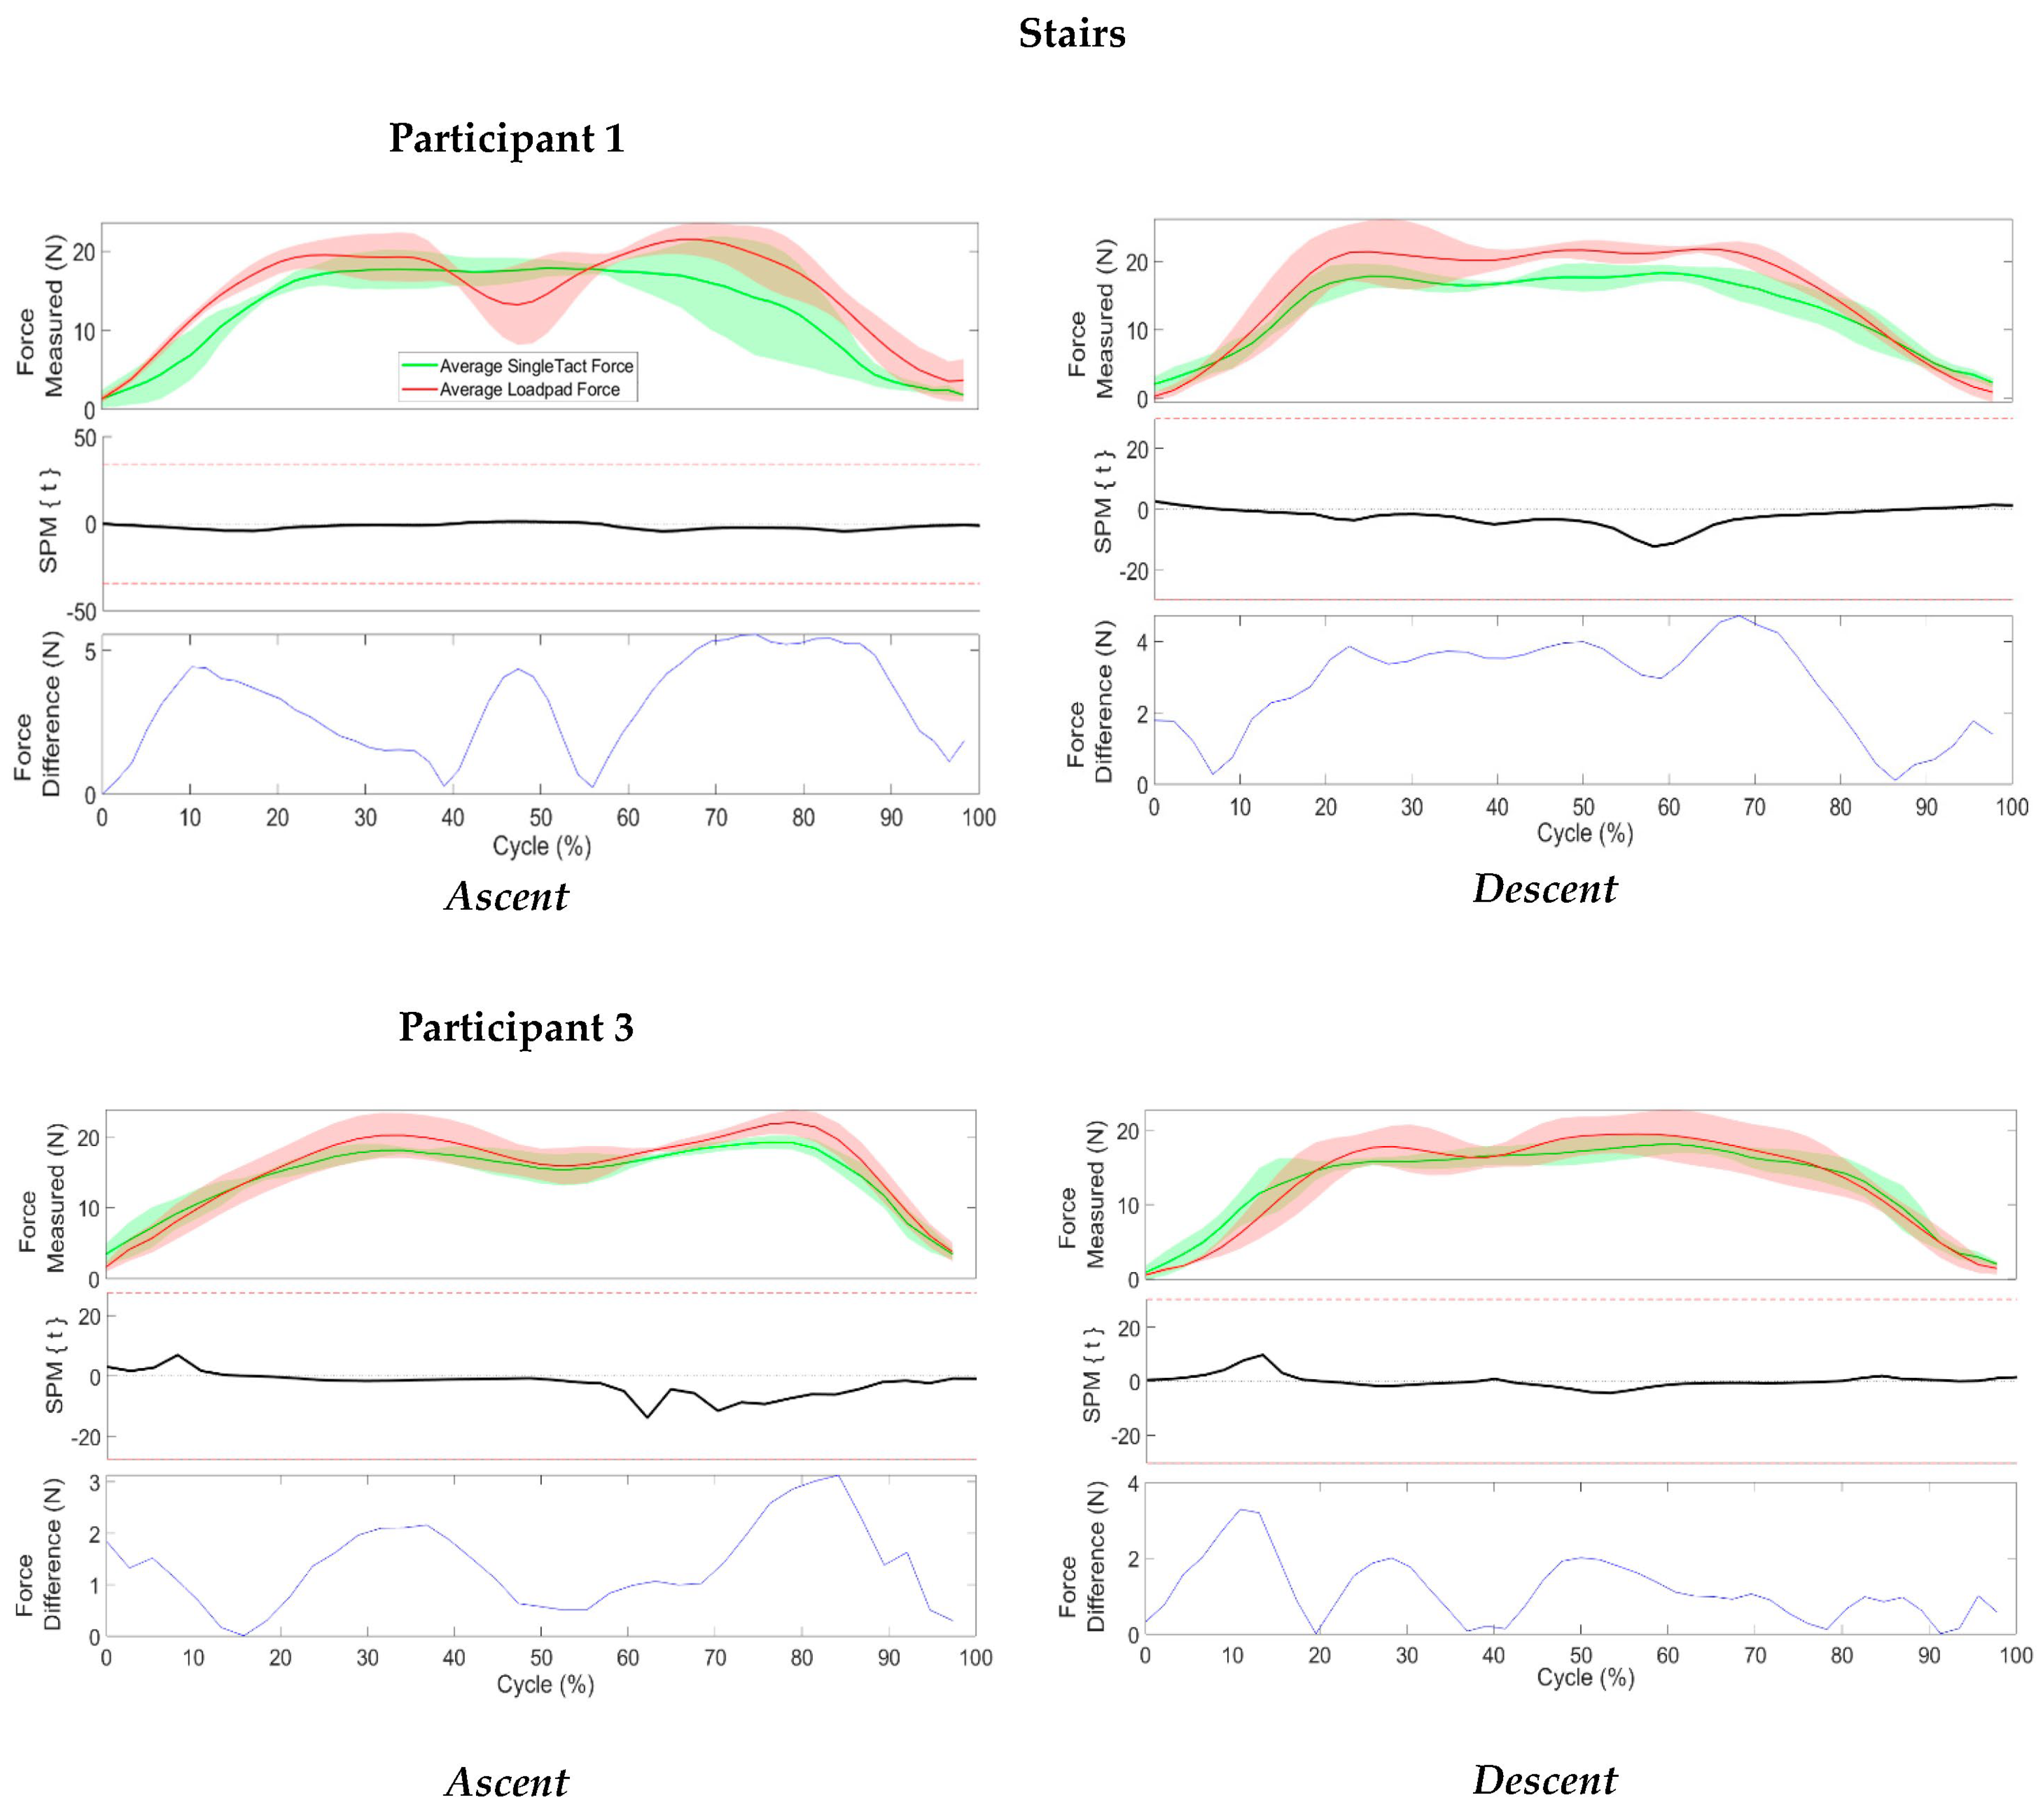
Stairs
Sit to Stand
2.5. Patient and Clinician Feedback
2.6. Data Processing and Statistical Analysis
3. Results
3.1. Sensor Characterization
3.2. Benchtop Validation
3.3. Clinical Implementation and Validation
3.4. Participant and Clinician Feedback
4. Discussion
5. Conclusions
Author Contributions
Funding
Institutional Review Board Statement
Informed Consent Statement
Data Availability Statement
Conflicts of Interest
References
- Legro, M.W.; Reiber, G.; del Aguila, M.; Ajax, M.J.; Boone, D.A.; Larsen, J.A.; Smith, D.G.; Sangeorzan, B. Issues of importance reported by persons with lower limb amputations and prostheses. J. Rehabil. Res. Dev. 1999, 36, 155–163. [Google Scholar] [PubMed]
- Gailey, R.; Allen, K.; Castles, J.; Kucharik, J.; Roeder, M. Review of secondary physical conditions associated with lower-limb amputation and long-term prosthesis use. J. Rehabil. Res. Dev. 2008, 45, 15–29. [Google Scholar] [CrossRef] [PubMed]
- Meulenbelt, H.E.; Geertzen, J.H.; Jonkman, M.F.; Dijkstra, P.U. Skin problems of the stump in lower limb amputees: 1. A clinical study. Acta Derm. Venereol. 2011, 91, 173. [Google Scholar] [CrossRef] [PubMed] [Green Version]
- Turner, S.; McGregor, A.H. Perceived Effect of Socket Fit on Major Lower Limb Prosthetic Rehabilitation: A Clinician and Amputee Perspective. Arch. Rehabil. Res. Clin. Transl. 2020, 2, 100059. [Google Scholar] [CrossRef]
- Paterno, L.; Ibrahimi, M.; Gruppioni, E.; Menciassi, A.; Ricotti, L. Sockets for Limb Prostheses: A Review of Existing Technologies and Open Challenges. IEEE Trans. Biomed. Eng. 2018, 65, 1996–2010. [Google Scholar] [CrossRef]
- Klute, G.K.; Berge, J.S.; Biggs, W.; Pongnumkul, S.; Popovic, Z.; Curless, B. Vacuum-assisted socket suspension compared with pin suspension for lower extremity amputees: Effect on fit, activity, and limb volume. Arch. Phys. Med. Rehabil. 2011, 92, 1570–1575. [Google Scholar] [CrossRef]
- Morgan, S.J.; Friedly, J.L.; Amtmann, D.; Salem, R.; Hafner, B.J. Cross-Sectional Assessment of Factors Related to Pain Intensity and Pain Interference in Lower Limb Prosthesis Users. Arch. Phys. Med. Rehabil. 2017, 98, 105–113. [Google Scholar] [CrossRef] [Green Version]
- Armitage, L.; Turner, S.; Sreenivasa, M. Human-device interface pressure measurement in prosthetic, orthotic and exoskeleton applications: A systematic review. Med. Eng. Phys. 2021, 97, 56–69. [Google Scholar] [CrossRef]
- Safari, R. Lower limb prosthetic interfaces: Clinical and technological advancement and potential future direction. Prosthet. Orthot. Int. 2020, 44, 384–401. [Google Scholar] [CrossRef]
- Kwak, J.W.; Han, M.; Xie, Z.; Chung, H.U.; Lee, J.Y.; Avila, R.; Yohay, J.; Chen, X.; Liang, C.; Patel, M.; et al. Wireless sensors for continuous, multimodal measurements at the skin interface with lower limb prostheses. Sci. Transl. Med. 2020, 12, eabc4327. [Google Scholar] [CrossRef]
- Radcliffe, C.W. The Patellar-Tendon-Bearing below-Knee Prosthesis; Biomechanics Laboratory: Berkeley, CA, USA, 1961. [Google Scholar]
- Stevens, P.M.; DePalma, R.R.; Wurdeman, S.R. Transtibial Socket Design, Interface, and Suspension: A Clinical Practice Guideline. JPO J. Prosthet. Orthot. 2019, 31, 172–178. [Google Scholar] [CrossRef]
- Hopkins, M.O.; Turner, S.; Vaidyanathan, R.; McGregor, A. Mapping Lower-Limb Prosthesis Load Distributions Using a Low-Cost Pressure Measurement System. Front. Med. Technol. 2022, 4, 908002. [Google Scholar] [CrossRef]
- Staats, T.B.; Lundt, C. The UCLA total surface bearing suction below-knee prosthesis. Clin. Prosthet. Orthot. 1987, 11, 118–130. [Google Scholar]
- Lee, W.C.; Zhang, M.; Mak, A.F. Regional differences in pain threshold and tolerance of the transtibial residual limb: Including the effects of age and interface material. Arch. Phys. Med. Rehabil. 2005, 86, 641–649. [Google Scholar] [CrossRef] [Green Version]
- Yiğiter, K.; Şener, G.; Bayar, K. Comparison of the effects of patellar tendon bearing and total surface bearing sockets on prosthetic fitting and rehabilitation. Prosthet. Orthot. Int. 2002, 26, 206–212. [Google Scholar] [CrossRef] [Green Version]
- Murphy, E.; Wilson, A. Anatomical and physiological considerations in below-knee prosthetics. Artif. Limbs 1962, 6, 4–15. [Google Scholar]
- Armitage, L.; Buller, A.; Rajan, G.; Prusty, G.; Simmons, A.; Kark, L. Clinical utility of pressure feedback to socket design and fabrication. Prosthet. Orthot. Int. 2020, 44, 18–26. [Google Scholar] [CrossRef]
- Armitage, L.; McDonald, K.A.; Kark, L.; Buller, A.; Ford, B. Transtibial prosthetic socket fitting: Australian prosthetist perspectives on primary challenges, management strategies, and opportunities for workflow and technological innovation. Prosthet. Orthot. Int. 2022, 10, 1097. [Google Scholar] [CrossRef]
- Pataky, T.C. One-dimensional statistical parametric mapping in Python. Comput. Methods Biomech. Biomed. Eng. 2012, 15, 295–301. [Google Scholar] [CrossRef]
- Pachi, A.; Ji, T. Frequency and velocity of people walking. Struct. Eng. 2005, 84, 36–40. [Google Scholar]
- Novel. Loadpad®: Total Force between Any Objects. Available online: https://www.novel.de/products/loadpad/ (accessed on 14 March 2023).
- SingleTact. SingleTact Spec Sheet. 2023. Available online: https://www.singletact.com/SingleTact_Datasheet.pdf (accessed on 14 March 2023).
- Tang, K.P.M.; Yick, K.L.; Li, P.L.; Yip, J.; Or, K.H.; Chau, K.H. Effect of Contacting Surface on the Performance of Thin-Film Force and Pressure Sensors. Sensors 2020, 20, 6863. [Google Scholar] [CrossRef] [PubMed]
- Olsen, J.; Turner, S.; Chadwell, A.; Dickinson, A.; Ostler, C.; Armitage, L.; McGregor, A.H.; Dupan, S.; Day, S. The impact of limited prosthetic socket documentation: A researcher perspective. Front. Rehabil. Sci. 2022, 3, 853414. [Google Scholar] [CrossRef] [PubMed]
- Cagle, J.C.; Reinhall, P.G.; Allyn, K.J.; McLean, J.; Hinrichs, P.; Hafner, B.J.; Sanders, J.E. A finite element model to assess transtibial prosthetic sockets with elastomeric liners. Med. Biol. Eng. Comput. 2018, 56, 1227–1240. [Google Scholar] [CrossRef] [PubMed]


| Weight (N) | Sensor 1 (%) | Sensor 2 (%) | Sensor 3 (%) |
|---|---|---|---|
| 9.81 | 0.8 | 0.6 | 0.36 |
| 19.62 N | 0.88 | 0.7 | 1.45 |
| 29.43 N | 0.3 | 0.53 | 0.75 |
| 39.24 N | 0.4 | 0.07 | 0.01 |
| Participant | Age (Years) | Gender | Side and Type of Amputation | Weight (kg) |
|---|---|---|---|---|
| 1 | 64 | Male | Right transtibial | 83 |
| 2 | 75 | Male | Left transtibial | 115 |
| 3 | 72 | Male | Left transtibial | 90 |
| P1 | P2 | P3 | |
|---|---|---|---|
| Overall Comfort Rating (0–10) | 10 | 10 | 10 |
| Distal End Comfort (0–10) | 10 | 10 | 10 |
| Socket Fit Rating (0–10) | 10 | 10 | 10 |
| Qualitative Feedback | “The socket felt comfortable and was not able to feel any pressure at the distal end” “The hardware of the sensors could be improved” | “The socket fit perfectly without any pain” | “The socket was comfortable to wear, and it fit firmly.” |
Disclaimer/Publisher’s Note: The statements, opinions and data contained in all publications are solely those of the individual author(s) and contributor(s) and not of MDPI and/or the editor(s). MDPI and/or the editor(s) disclaim responsibility for any injury to people or property resulting from any ideas, methods, instructions or products referred to in the content. |
© 2023 by the authors. Licensee MDPI, Basel, Switzerland. This article is an open access article distributed under the terms and conditions of the Creative Commons Attribution (CC BY) license (https://creativecommons.org/licenses/by/4.0/).
Share and Cite
Armitage, L.; Cho, K.; Sariyildiz, E.; Buller, A.; O’Brien, S.; Kark, L. Validation of a Custom Interface Pressure Measurement System to Improve Fitting of Transtibial Prosthetic Check Sockets. Sensors 2023, 23, 3778. https://doi.org/10.3390/s23073778
Armitage L, Cho K, Sariyildiz E, Buller A, O’Brien S, Kark L. Validation of a Custom Interface Pressure Measurement System to Improve Fitting of Transtibial Prosthetic Check Sockets. Sensors. 2023; 23(7):3778. https://doi.org/10.3390/s23073778
Chicago/Turabian StyleArmitage, Lucy, Kenny Cho, Emre Sariyildiz, Angela Buller, Stephen O’Brien, and Lauren Kark. 2023. "Validation of a Custom Interface Pressure Measurement System to Improve Fitting of Transtibial Prosthetic Check Sockets" Sensors 23, no. 7: 3778. https://doi.org/10.3390/s23073778