
Development of an Open-Source Injection Mold Monitoring System
 , , and
Abstract
:1. Introduction
2. Materials and Methods
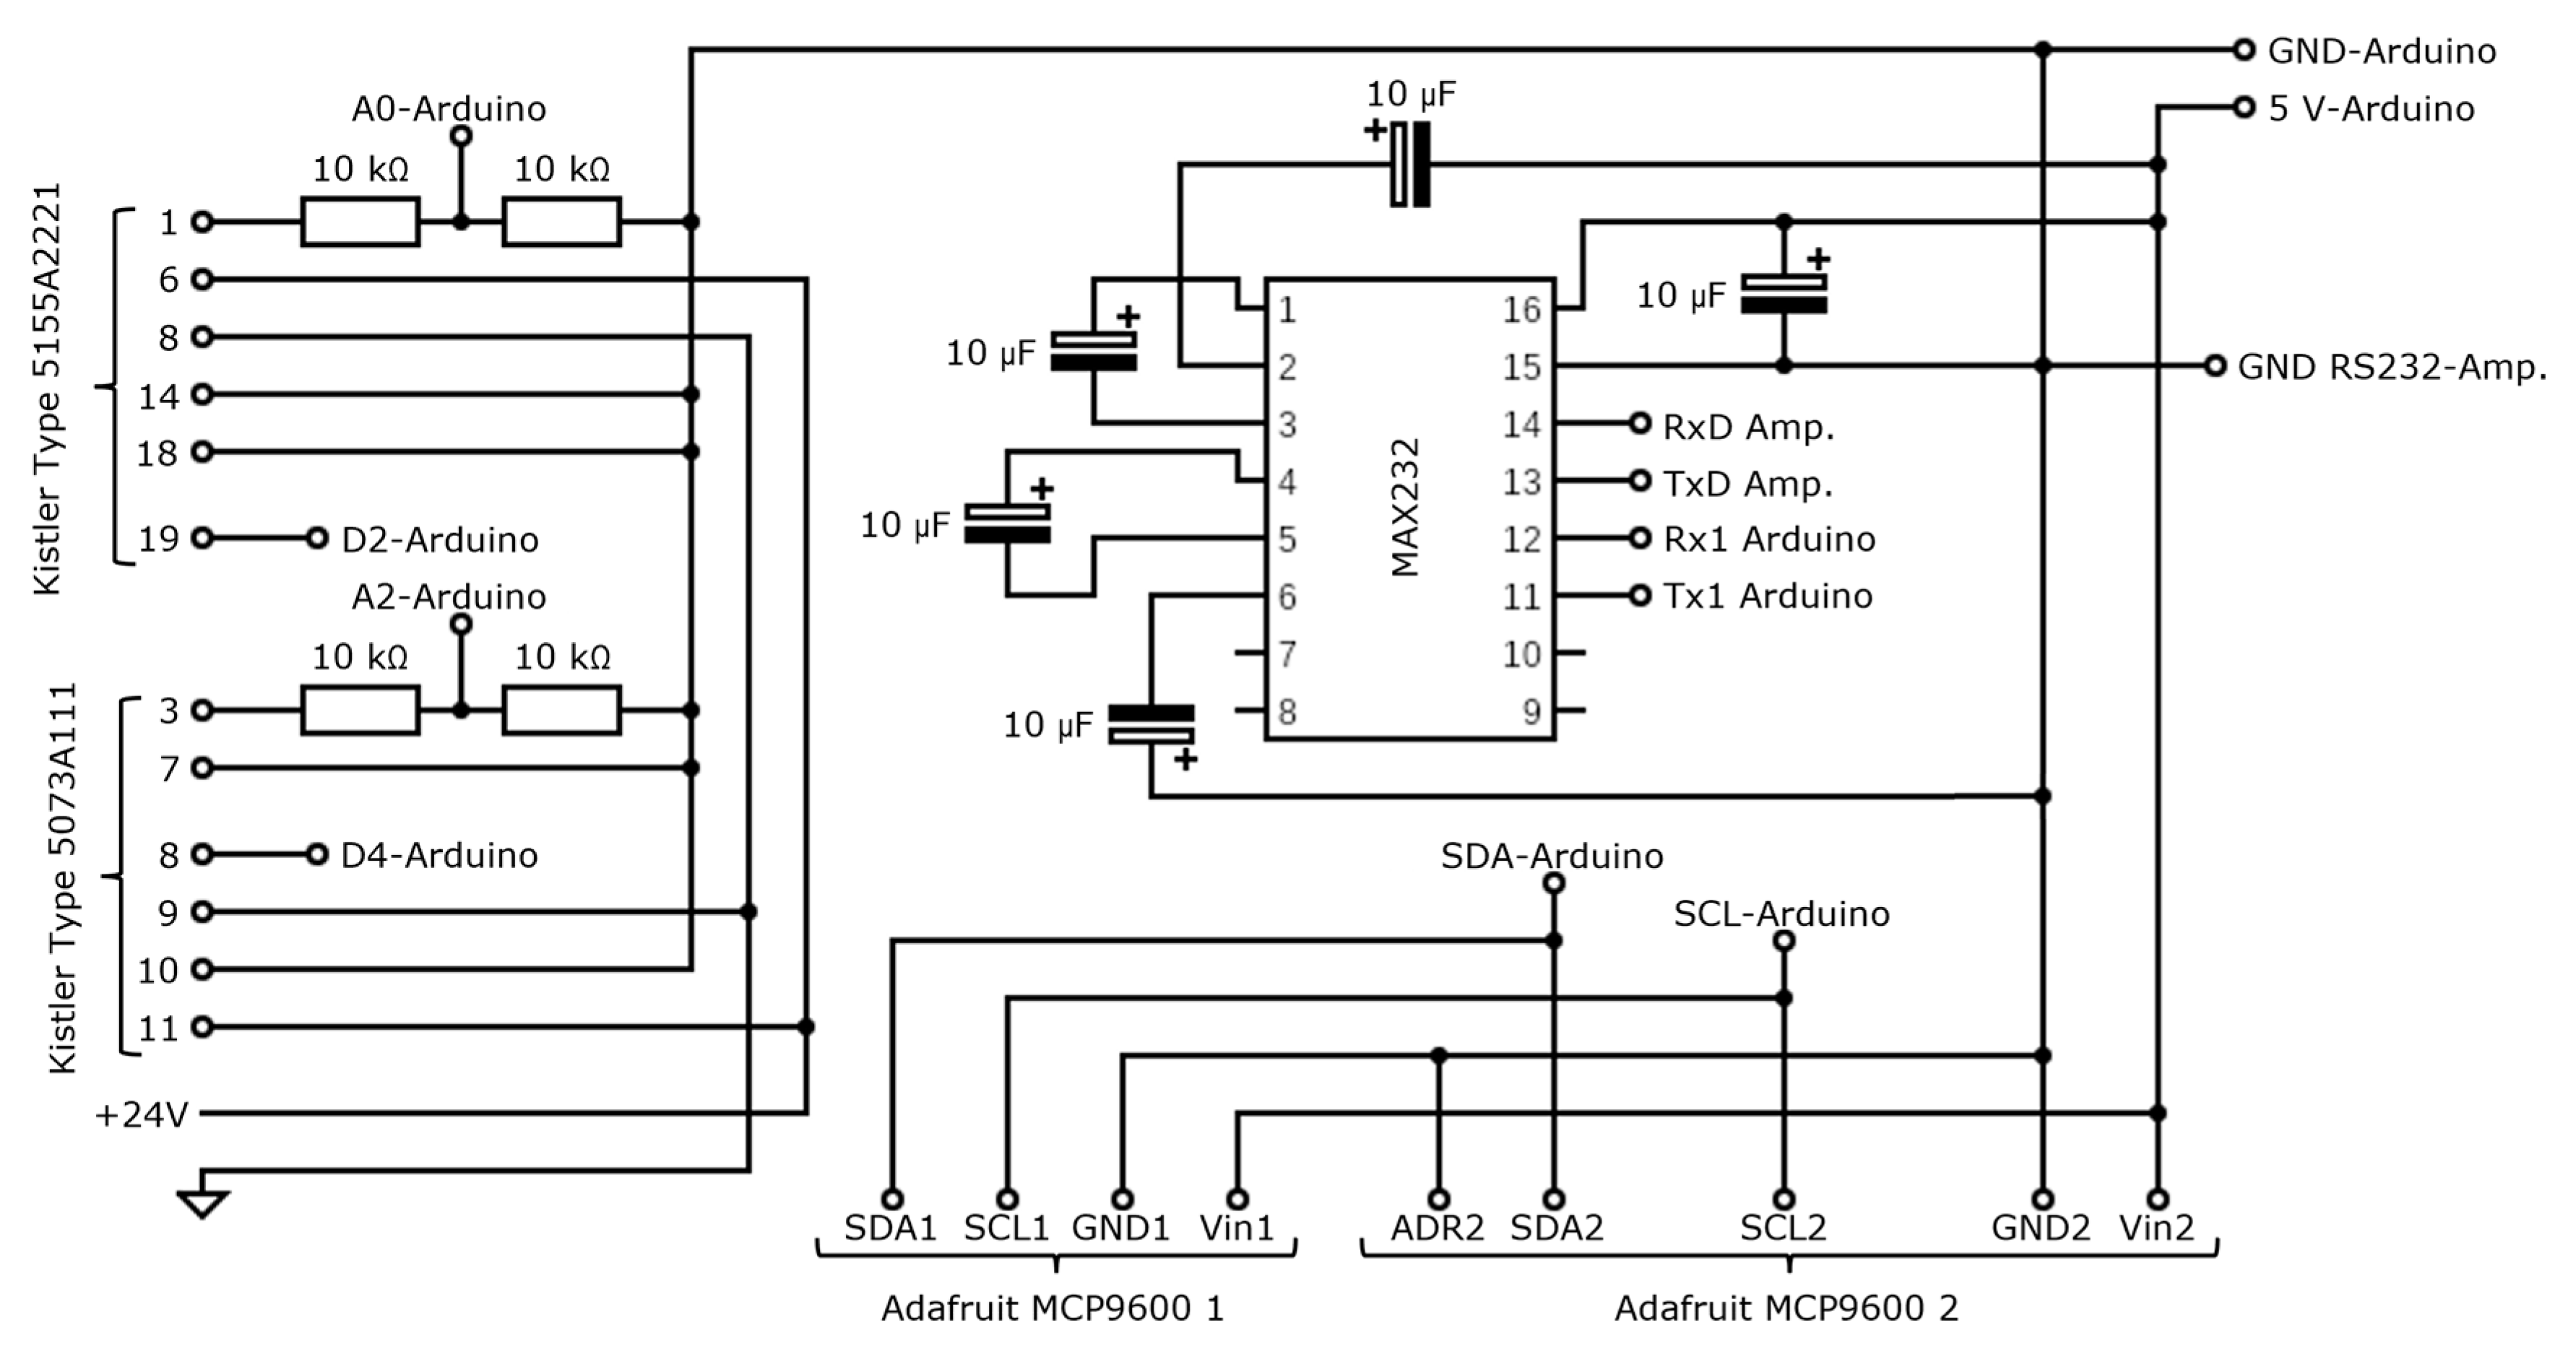
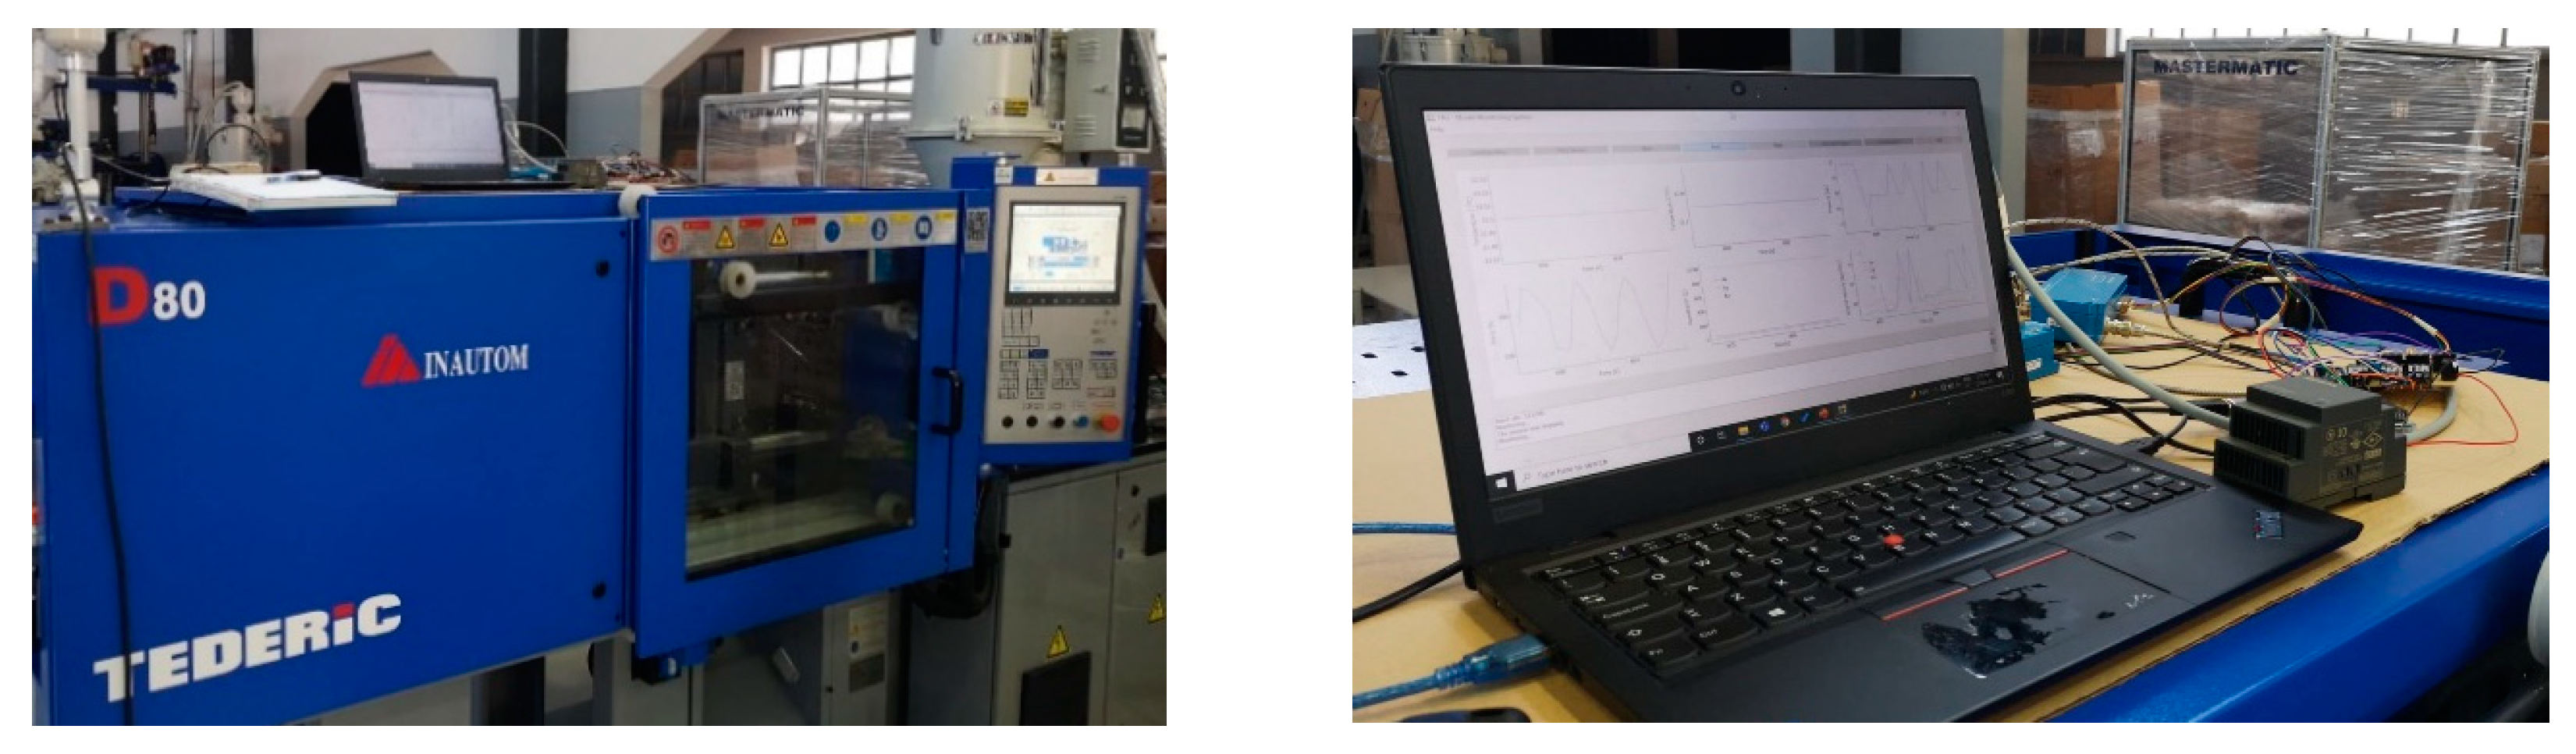
2.1. Hardware
2.2. Firmware
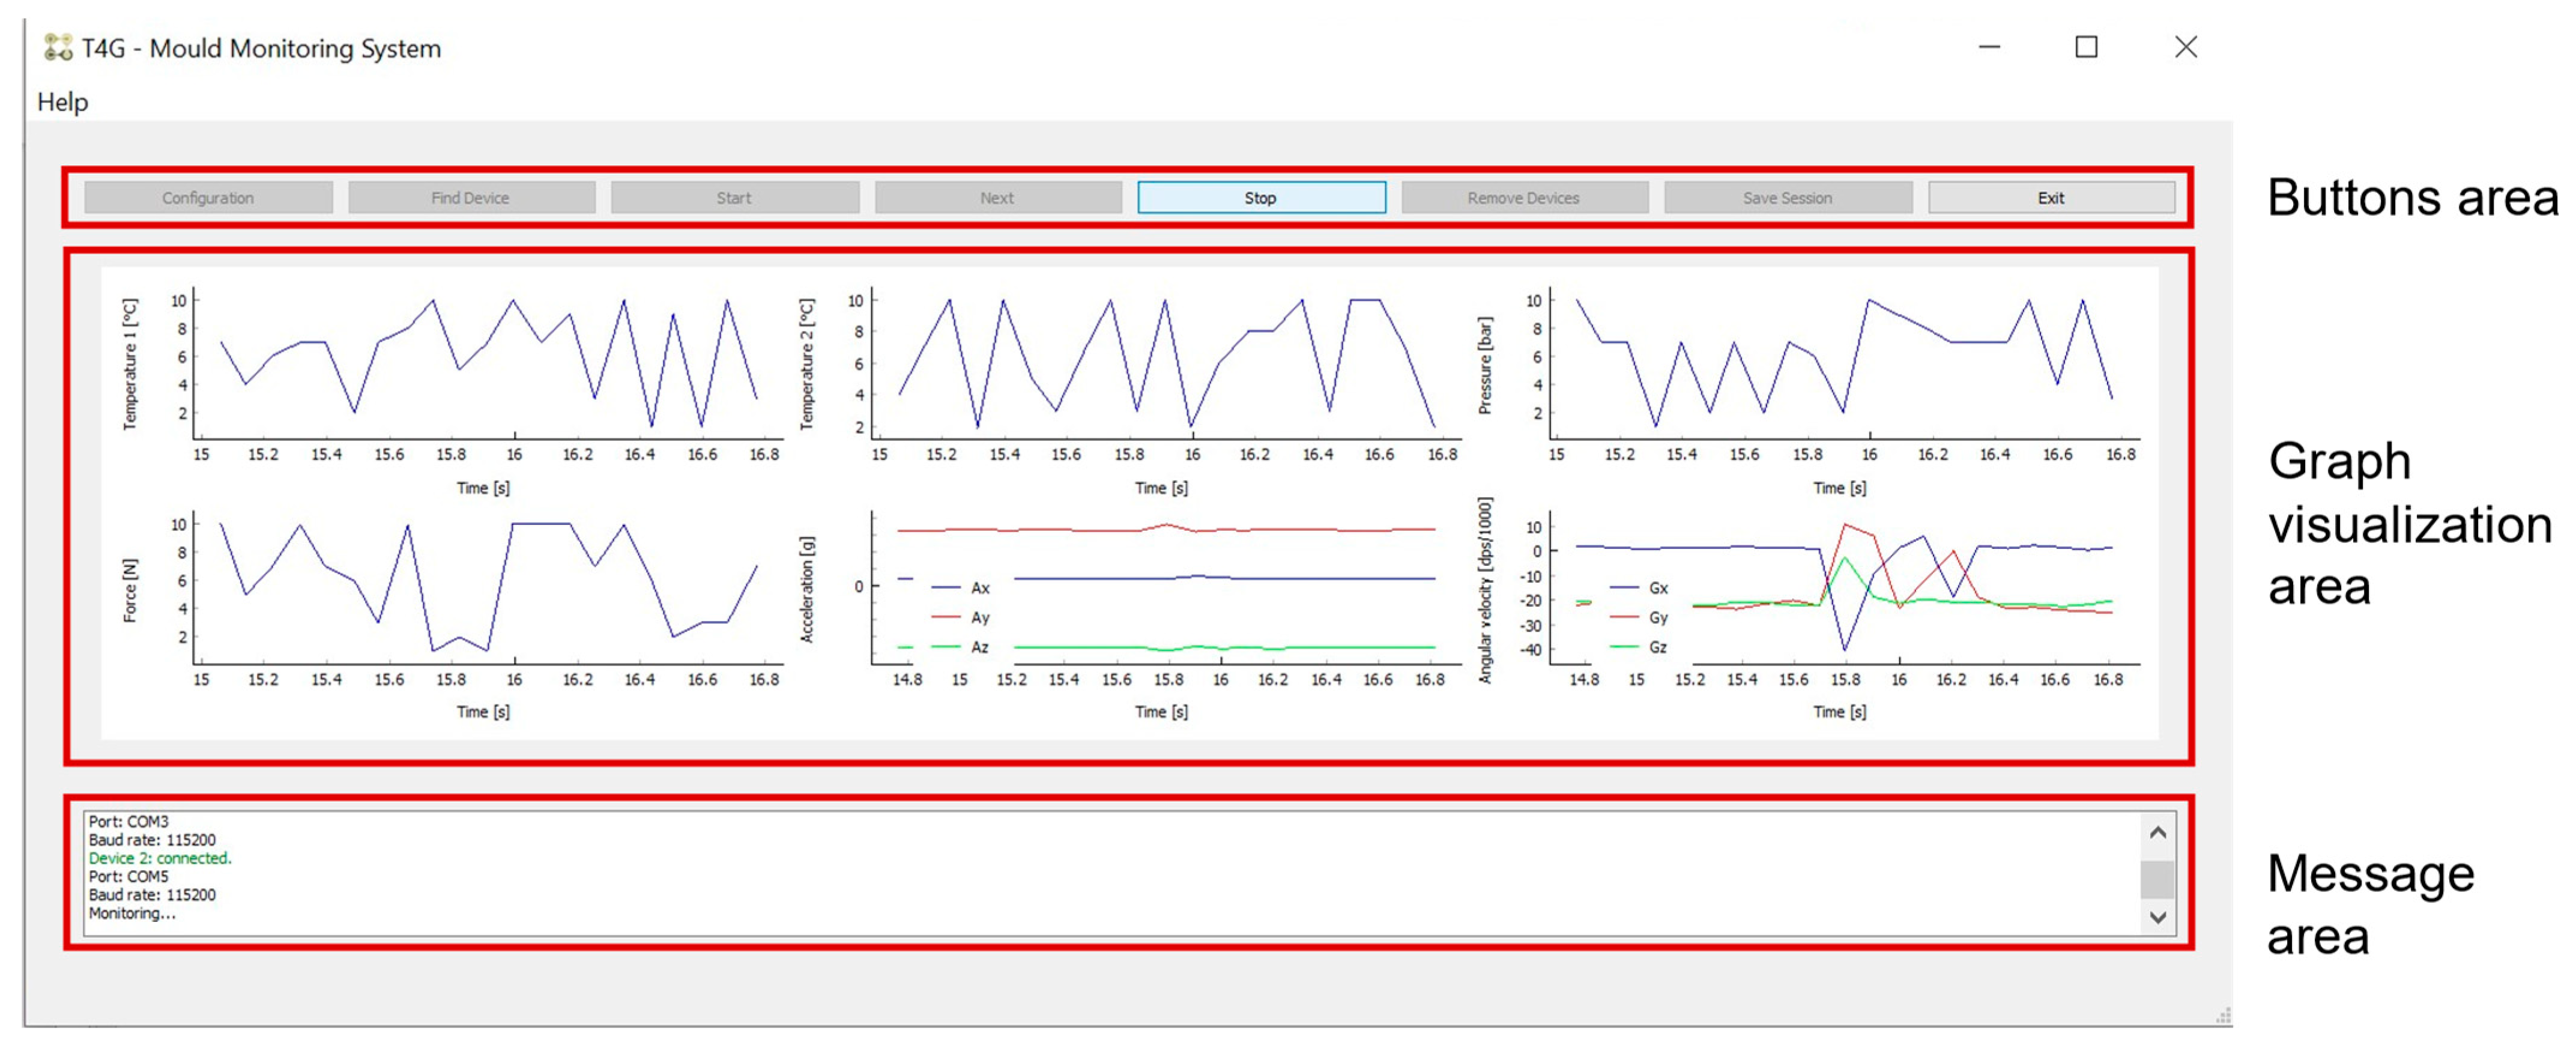
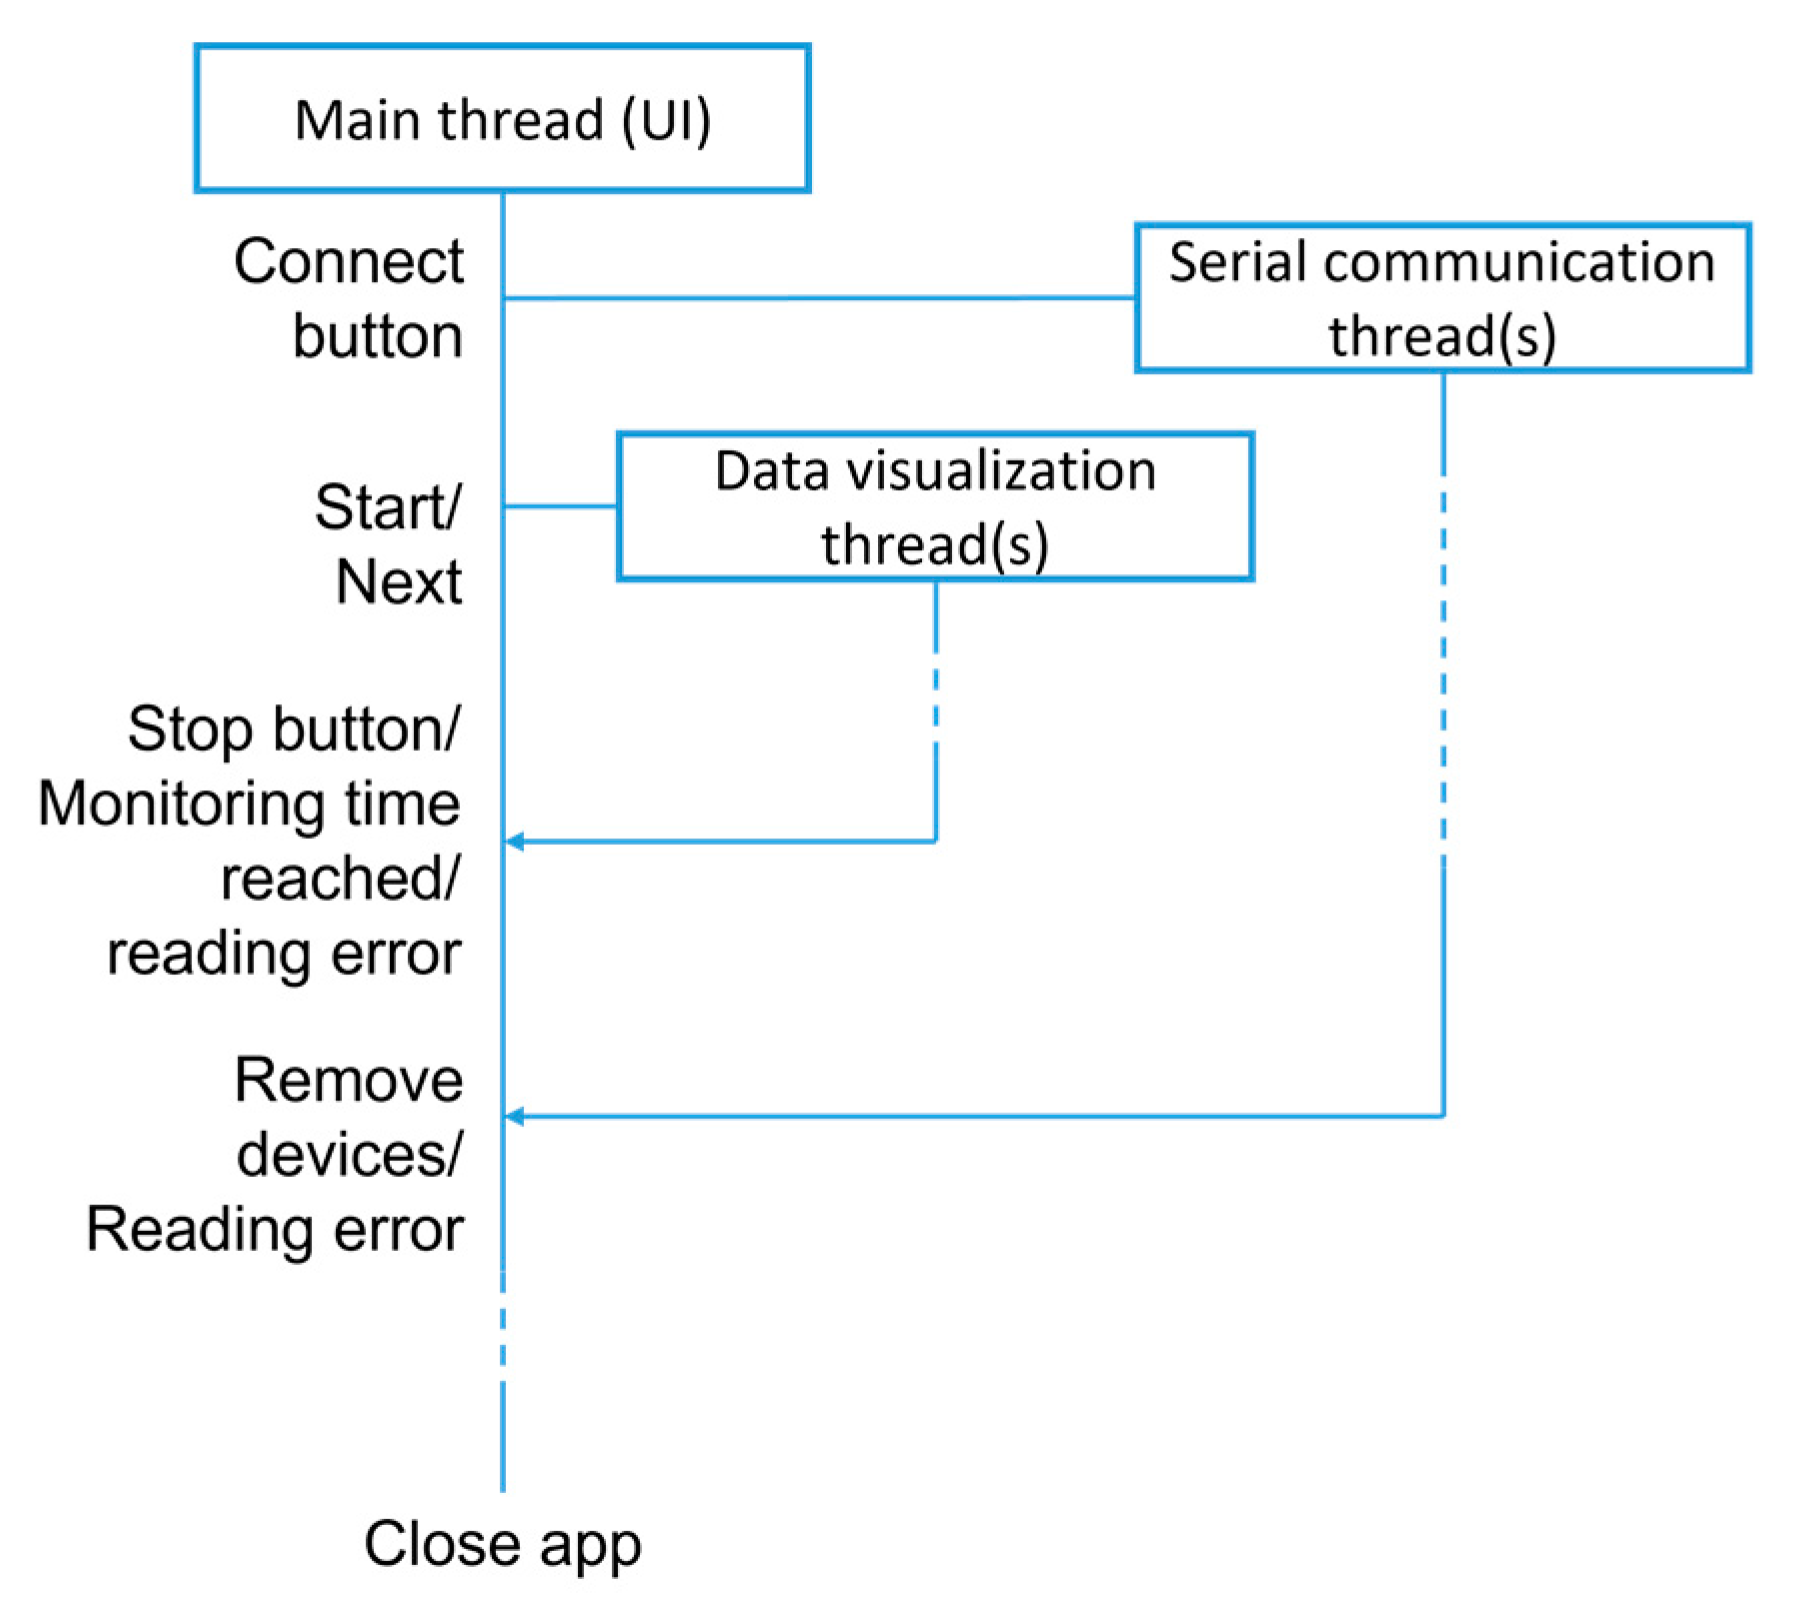
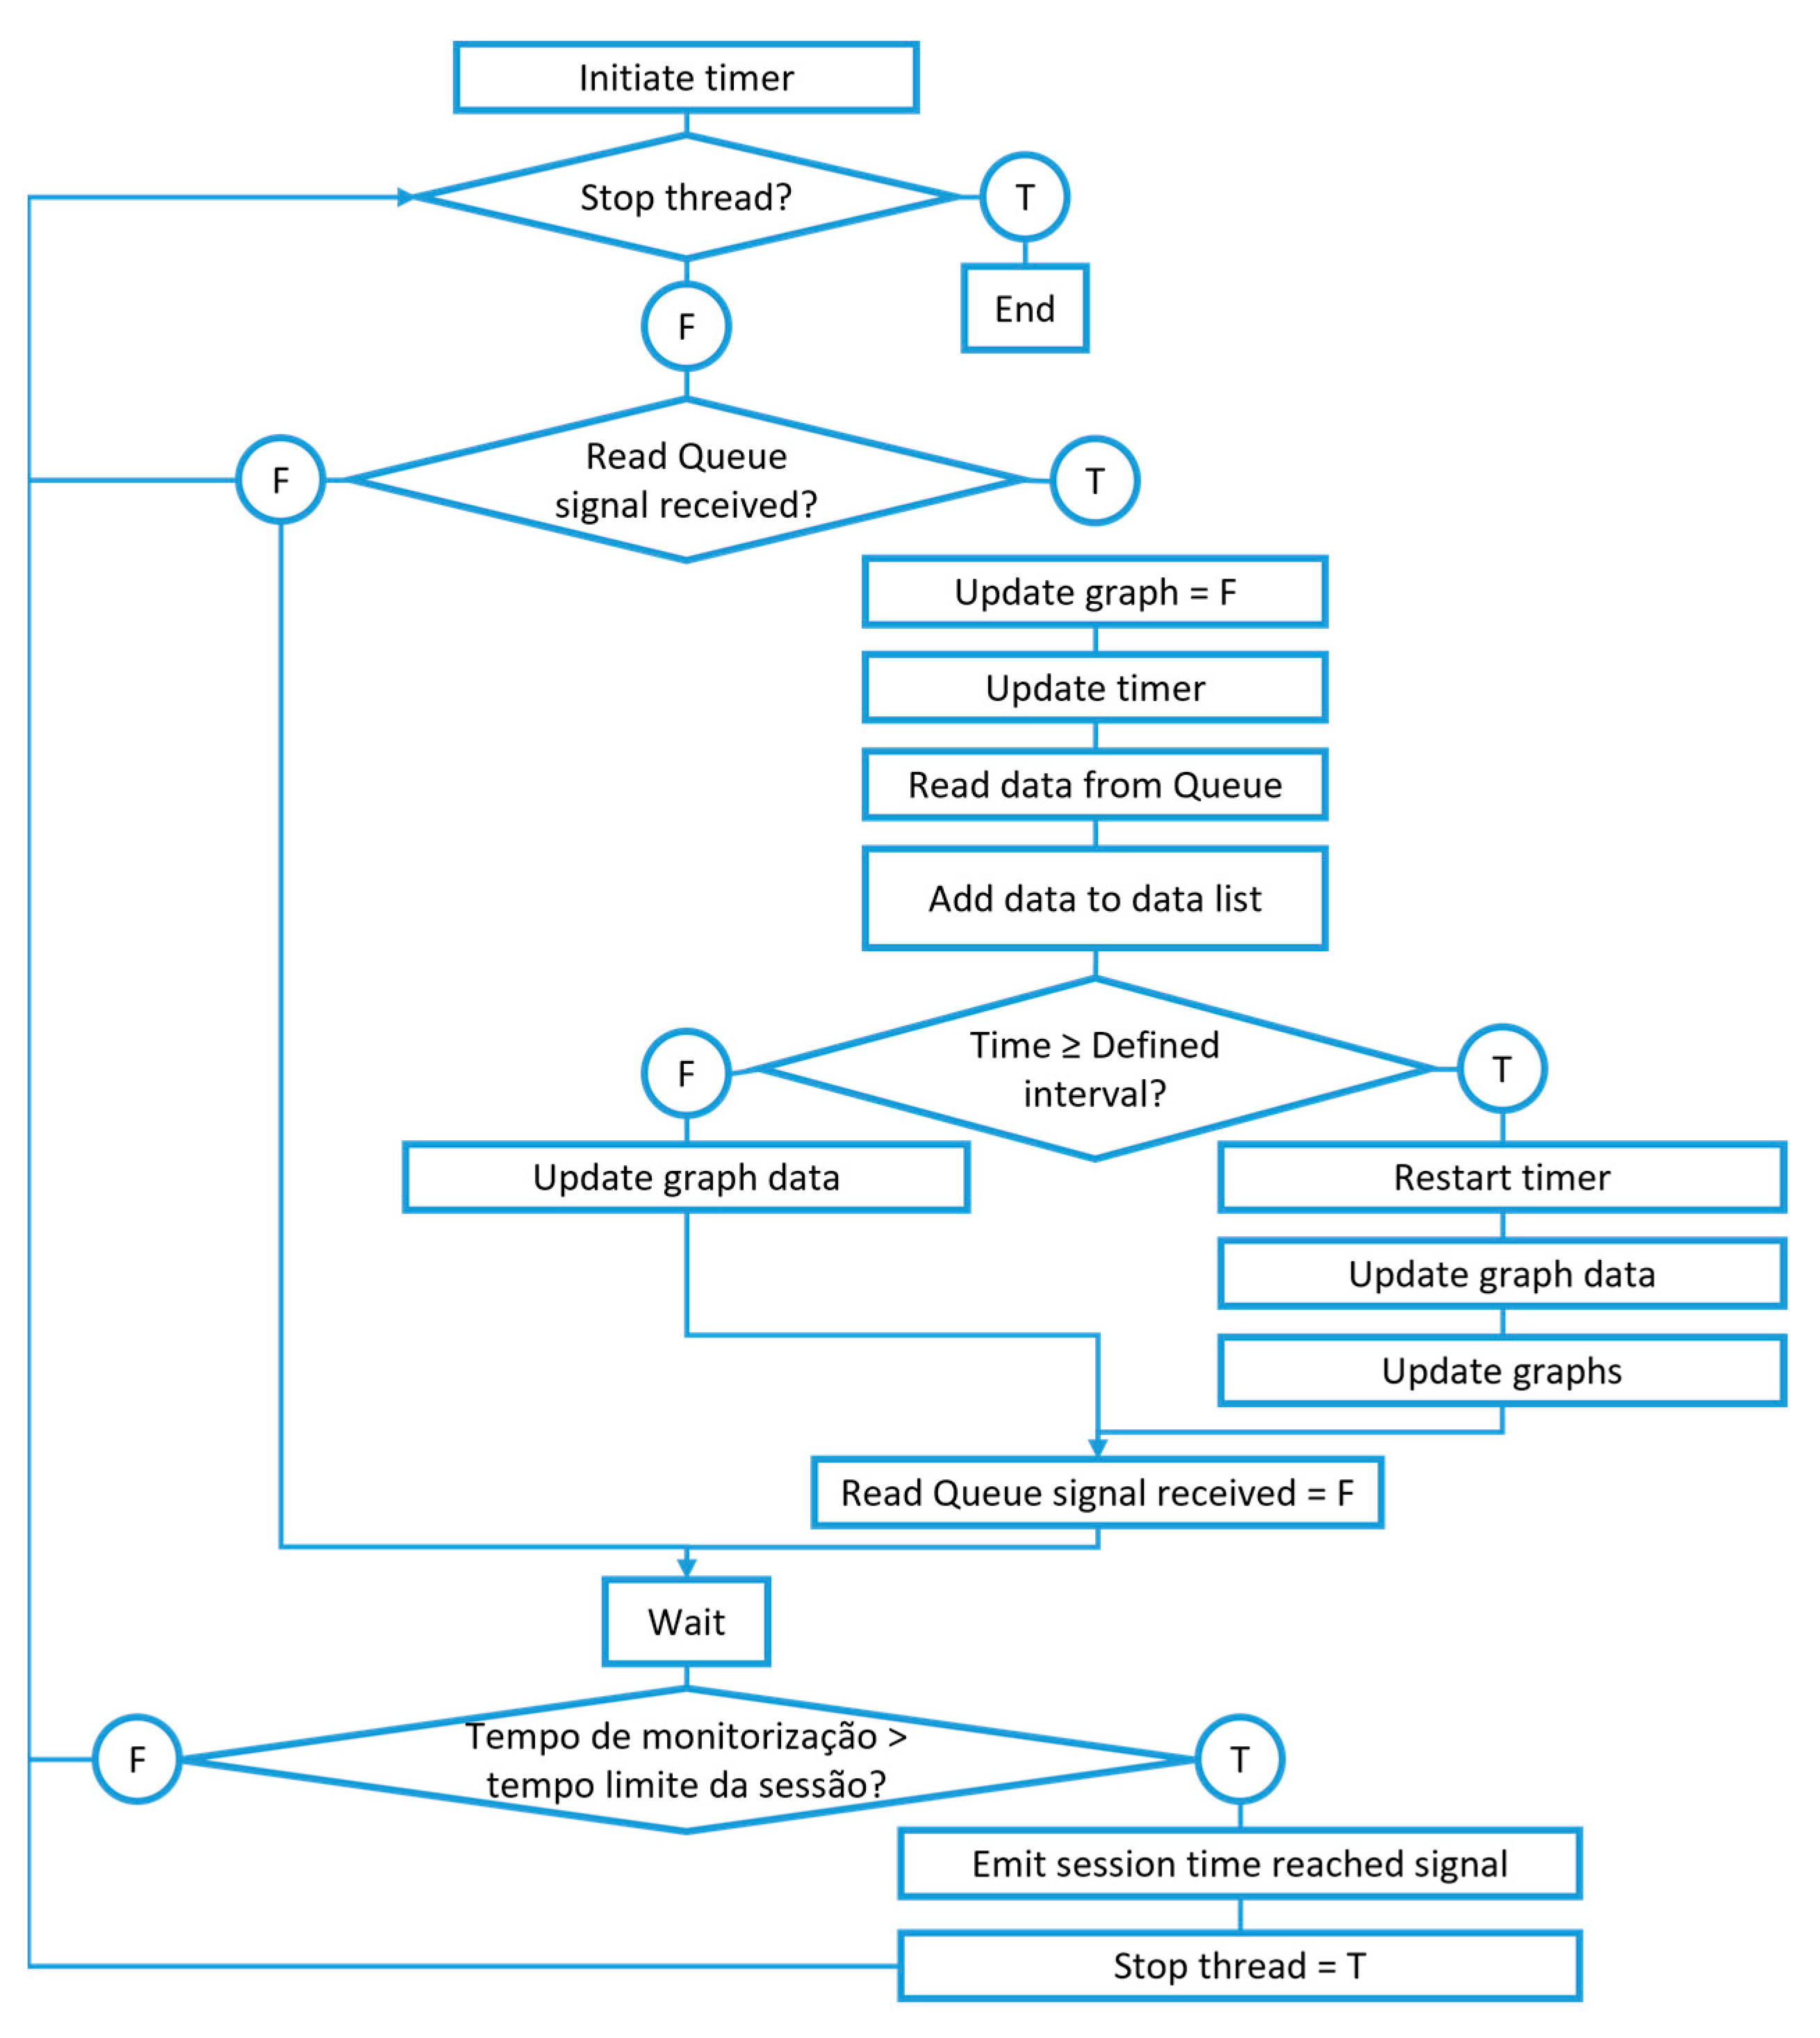
2.3. Software
2.4. Case Study Description
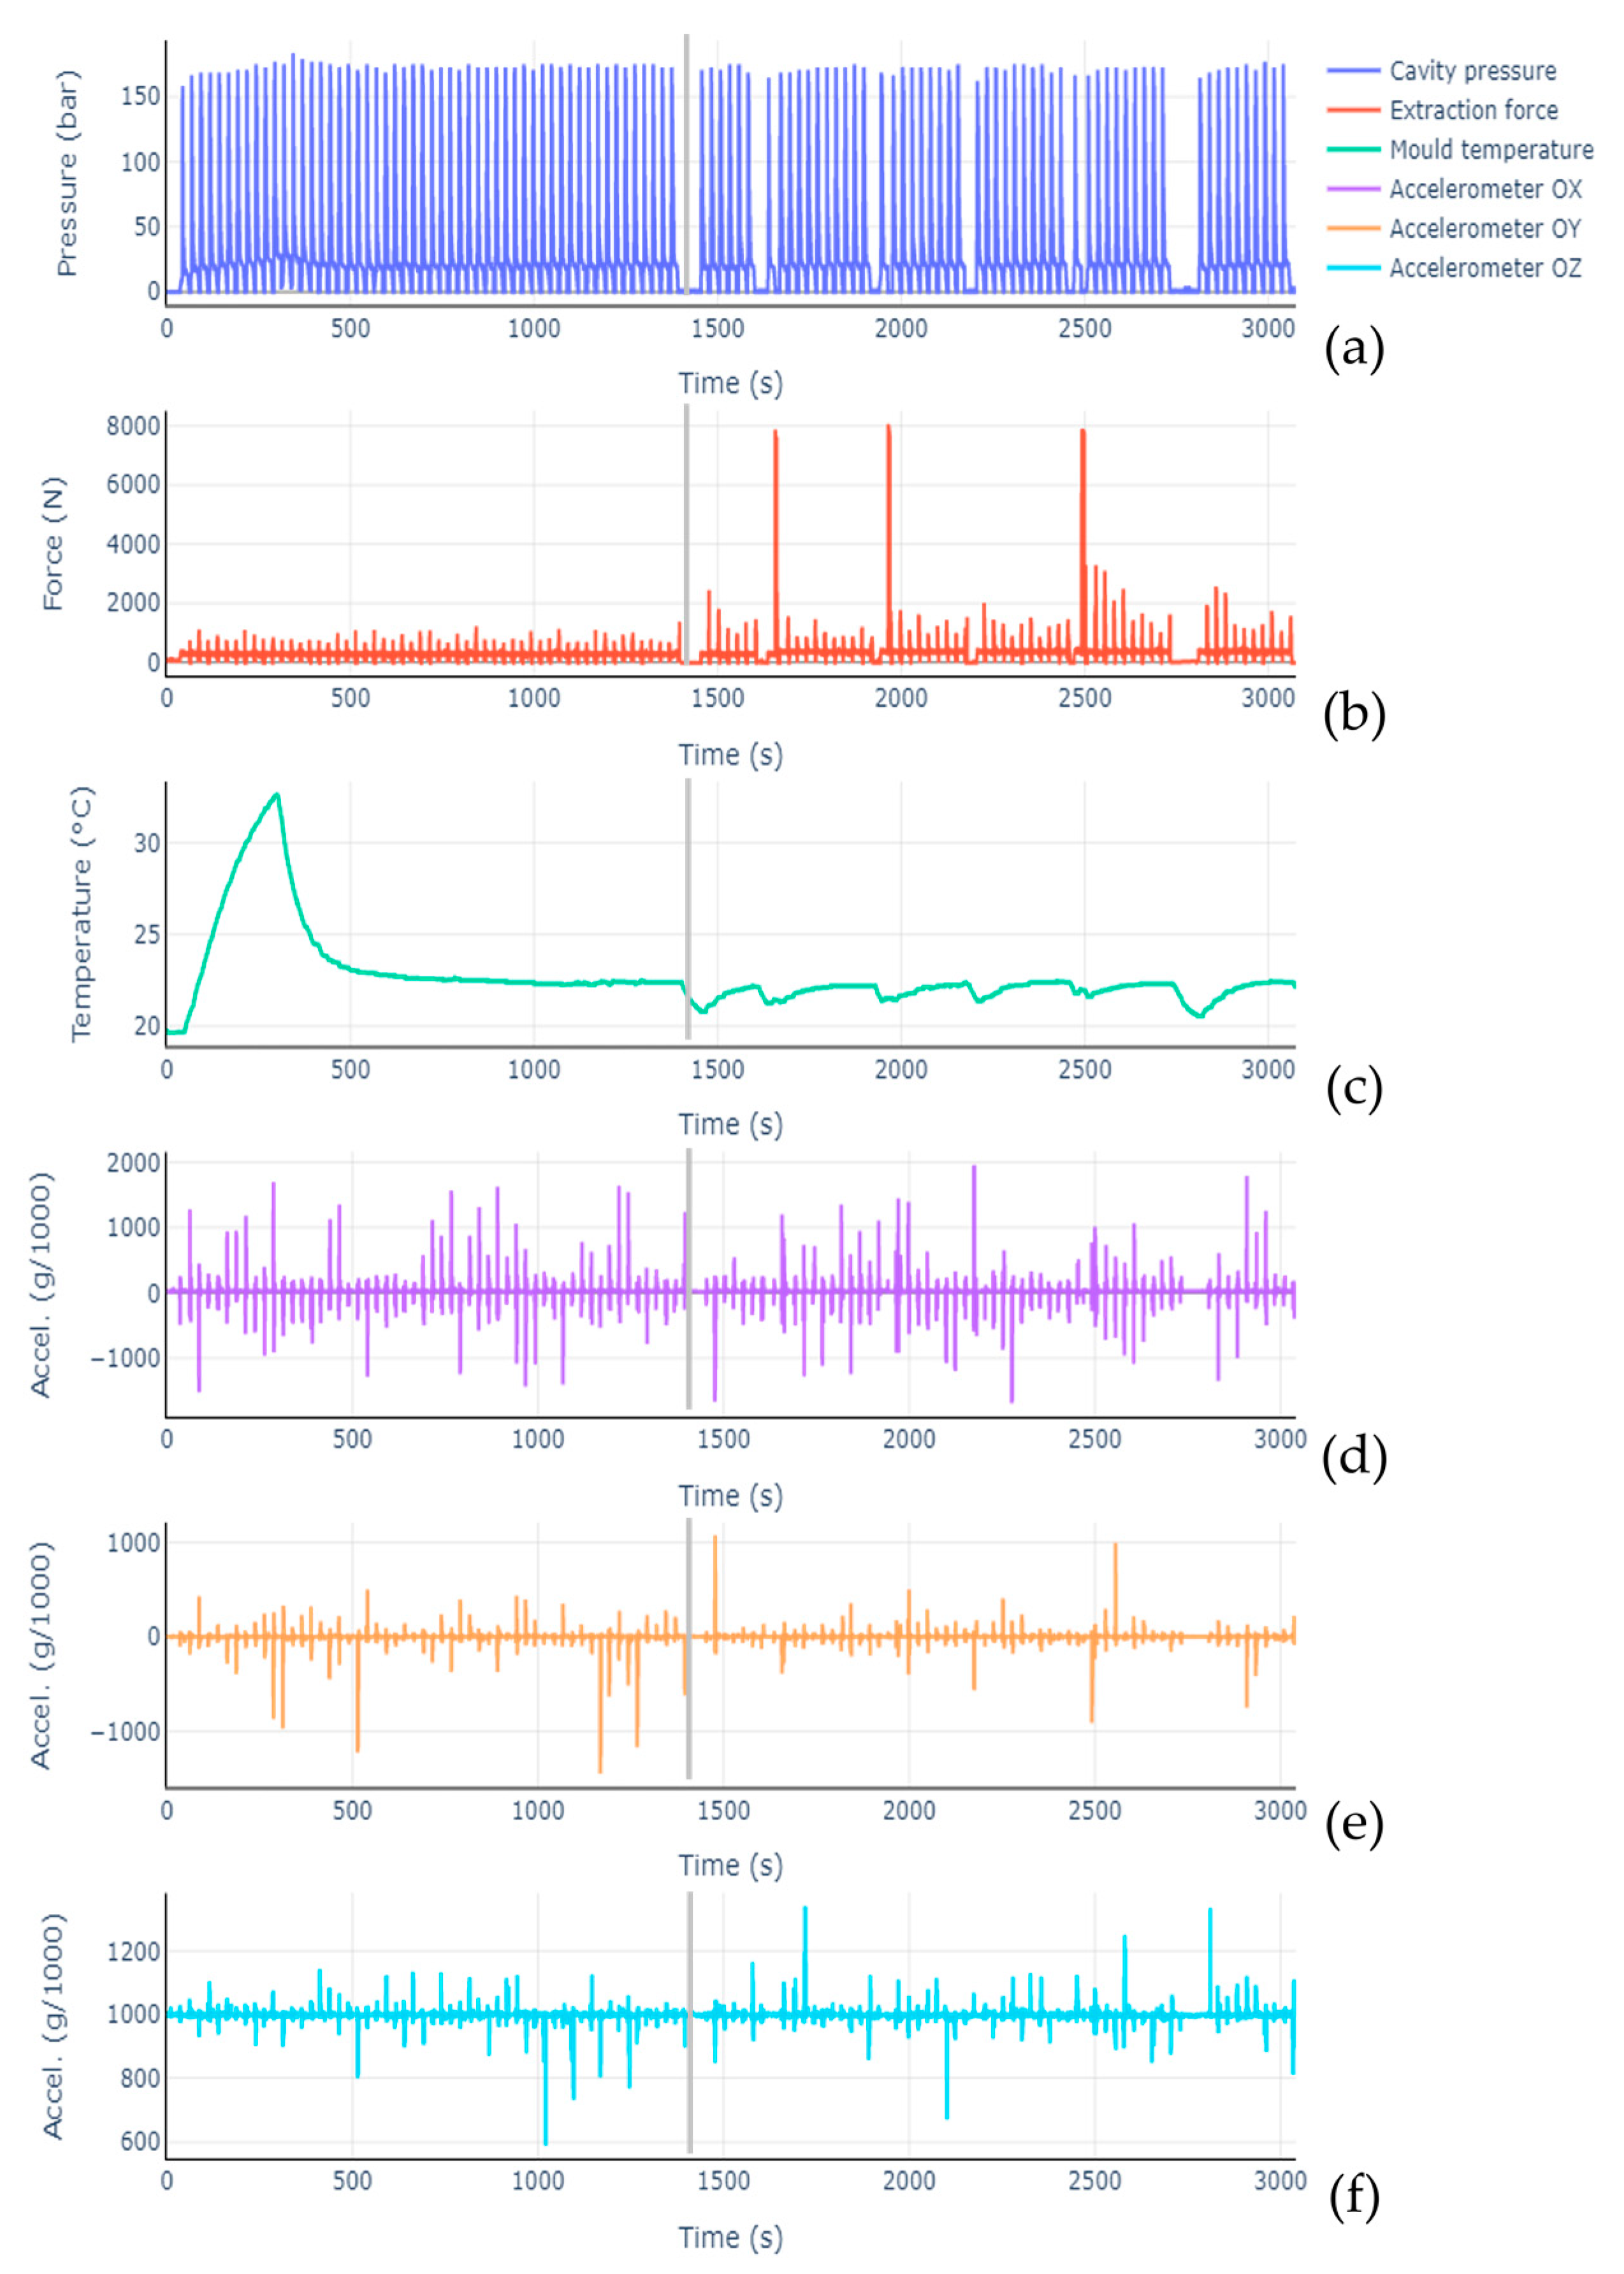
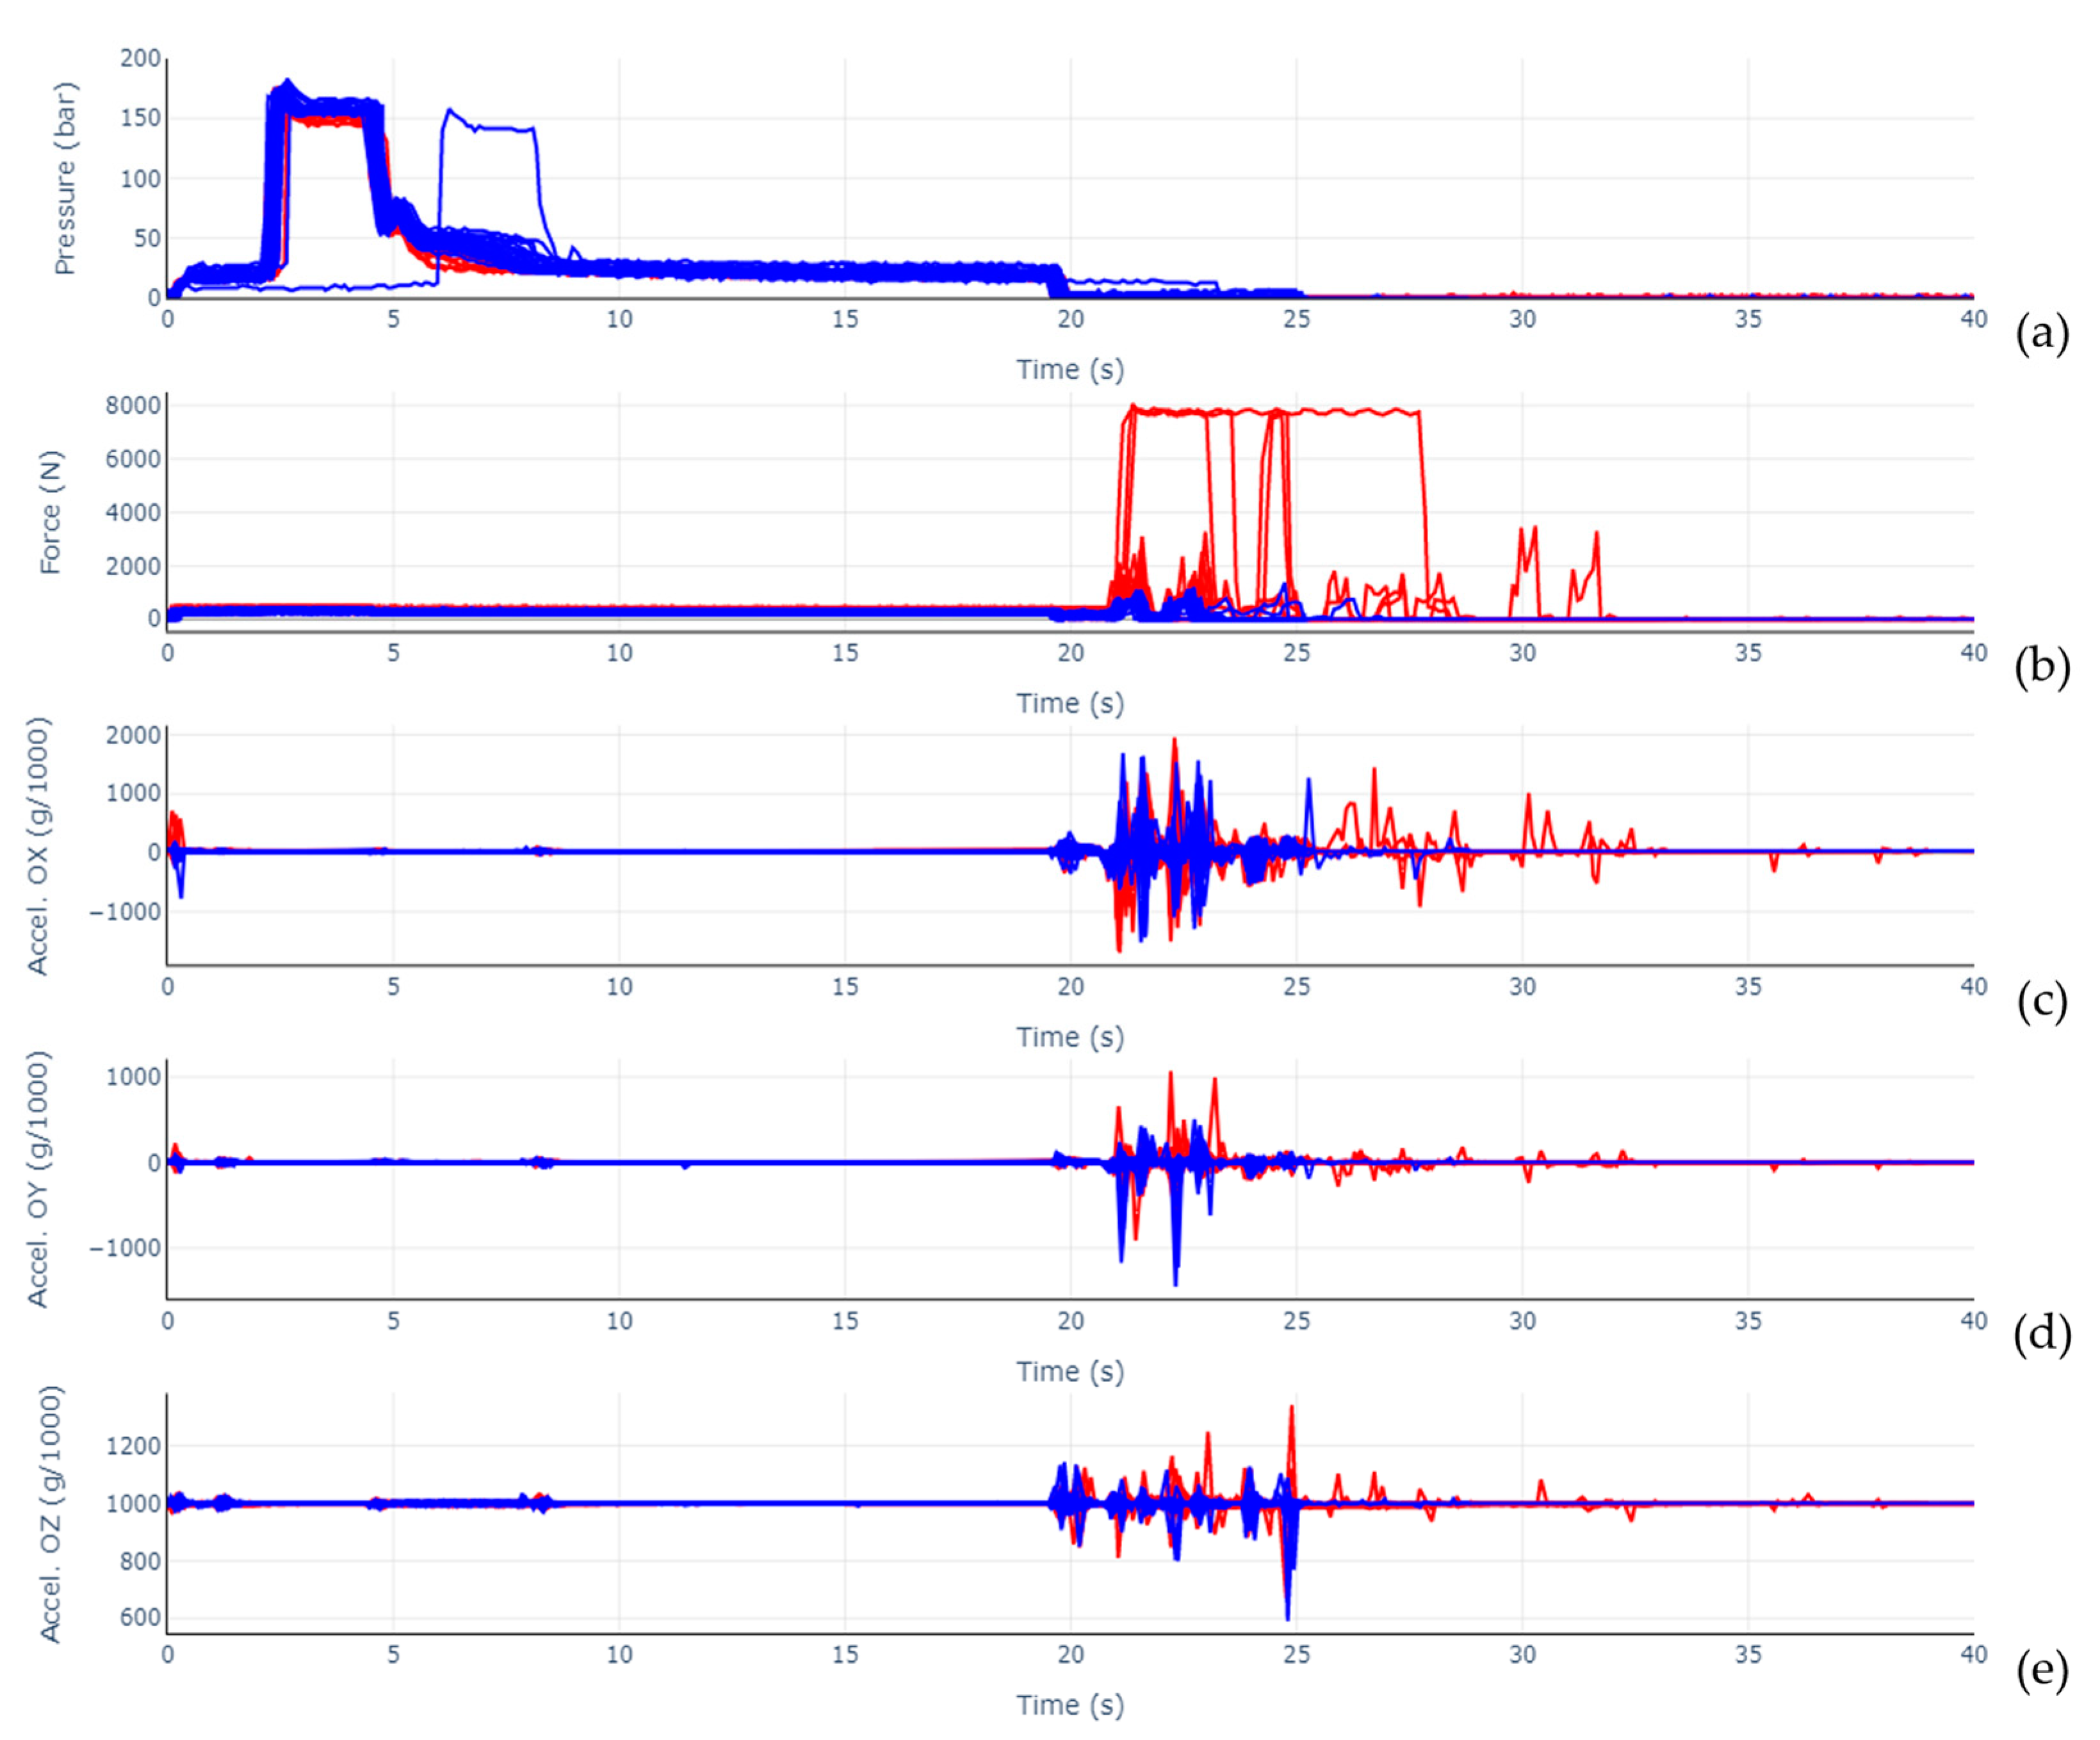
3. Results and Discussion
4. Conclusions
Supplementary Materials
Author Contributions
Funding
Institutional Review Board Statement
Informed Consent Statement
Data Availability Statement
Conflicts of Interest
References
- Ageyeva, T.; Horváth, S.; Kovács, J.G. In-Mold Sensors for Injection Molding: On the Way to Industry 4.0. Sensors 2019, 19, 3551. [Google Scholar] [CrossRef] [PubMed] [Green Version]
- Bousdekis, A.; Lepenioti, K.; Apostolou, D.; Mentzas, G. A Review of Data-Driven Decision-Making Methods for Industry 4.0 Maintenance Applications. Electronics 2021, 10, 828. [Google Scholar] [CrossRef]
- Garg, A.; Deshmukh, S.G. Maintenance management: Literature review and directions. J. Qual. Maint. Eng. 2006, 12, 205–238. [Google Scholar] [CrossRef]
- Farahani, S.; Khade, V.; Basu, S.; Pilla, S. A data-driven predictive maintenance framework for injection molding process. J. Manuf. Process. 2022, 80, 887–897. [Google Scholar] [CrossRef]
- Ogorodnyk, O.; Martinsen, K. Monitoring and Control for Thermoplastics Injection Molding A Review. Procedia CIRP 2018, 67, 380–385. [Google Scholar] [CrossRef]
- Kurt, M.; Saban Kamber, O.; Kaynak, Y.; Atakok, G.; Girit, O. Experimental investigation of plastic injection molding: Assessment of the effects of cavity pressure and mold temperature on the quality of the final products. Mater. Des. 2009, 30, 3217–3224. [Google Scholar] [CrossRef]
- Huang, M.S. Cavity pressure based grey prediction of the filling-to-packing switchover point for injection molding. J. Mater. Process. Technol. 2007, 183, 419–424. [Google Scholar] [CrossRef]
- Moreira, E.E.; Alves, F.S.; Martins, M.; Ribeiro, G.; Pina, A.; Aguiam, D.E.; Sotgiu, E.; Fernandes, E.P.; Gaspar, J. Industry 4.0: Real-time monitoring of an injection molding tool for smart predictive maintenance. In Proceedings of the 2020 25th IEEE International Conference on Emerging Technologies and Factory Automation (ETFA), Vienna, Austria, 8–11 September 2020; Volume 1, pp. 1209–1212. [Google Scholar]
- Rønsch, G.Ø.; López-Espejo, I.; Michelsanti, D.; Xie, Y.; Popovski, P.; Tan, Z.-H. Utilization of acoustic signals with generative Gaussian and autoencoder modeling for condition-based maintenance of injection moulds. Int. J. Comput. Integr. Manuf. 2022, 35, 1–16. [Google Scholar] [CrossRef]
- Nunes, P.; Rocha, E.; Santos, J.; Antunes, R. Predictive maintenance on injection molds by generalized fault trees and anomaly detection. Procedia Comput. Sci. 2023, 217, 1038–1047. [Google Scholar] [CrossRef]
- Párizs, R.D.; Török, D.; Ageyeva, T.; Kovács, J.G. Machine Learning in Injection Molding: An Industry 4.0 Method of Quality Prediction. Sensors 2022, 22, 2704. [Google Scholar] [CrossRef] [PubMed]
- Chen, J.C.; Guo, G.; Wang, W.N. Artificial neural network-based online defect detection system with in-mold temperature and pressure sensors for high precision injection molding. Int. J. Adv. Manuf. Technol. 2020, 110, 2023–2033. [Google Scholar] [CrossRef]
- Kistler. ComoNeo: Pioneering System-Based Injection Molding. Available online: https://www.kistler.com/INT/en/comoneo-pioneering-system-based-injection-molding/C00000425 (accessed on 18 January 2023).
- Priamus System Technologies. Products. Available online: https://www.priamus.com/en/products (accessed on 18 January 2023).
- Martikkala, A.; David, J.; Lobov, A.; Lanz, M.; Ituarte, I.F. Trends for Low-Cost and Open-Source IoT Solutions Development for Industry 4.0. Procedia Manuf. 2021, 55, 298–305. [Google Scholar] [CrossRef]
- Vidal-Pardo, A.; Pindado, S. Design and development of a 5-channel arduino-based data acquisition system (ABDAS) for experimental aerodynamics research. Sensors 2018, 18, 2382. [Google Scholar] [CrossRef] [PubMed] [Green Version]
- Subekti, S.; Pranoto, H.; Salmon, B.R.; Yusuf, S.Q.; Suyadiyanto, S.; Ariyadi, A.S.; Hamid, A. Preventive maintenance of taper bearing using Arduino in the application of industry 4.0. Int. Res. J. Eng. IT Sci. Res. 2020, 6, 1–14. [Google Scholar] [CrossRef]
- Silva, B.; Sousa, J.; Alenya, G. Data Acquisition and Monitoring System for Legacy Injection Machines. In Proceedings of the 2021 IEEE International Conference on Computational Intelligence and Virtual Environments for Measurement Systems and Applications (CIVEMSA), Hong Kong, China, 18–20 June 2021; pp. 1–6. [Google Scholar]
- Kusić, D.; Slapšak, M. Development of IoT Device for Temperature and Cavity Pressure Measurements. In Advances in Polymer Processing 2020; Springer: Berlin/Heidelberg, Germany, 2020; pp. 108–115. [Google Scholar] [CrossRef]
- Ogorodnyk, O.; Larsen, M.; Martinsen, K.; Lyngstad, O.V. Development of application programming interface prototype for injection molding machines. Procedia CIRP 2021, 97, 453–458. [Google Scholar] [CrossRef]
- Greene, J.P. Injection Molding. In Automotive Plastics and Composites; Elsevier: Amsterdam, The Netherlands, 2021; pp. 241–254. [Google Scholar] [CrossRef]
- Brunthaler, J.; Grabski, P.; Sturm, V.; Lubowski, W.; Efrosinin, D. On the Problem of State Recognition in Injection Molding Based on Accelerometer Data Sets. Sensors 2022, 22, 6165. [Google Scholar] [CrossRef] [PubMed]


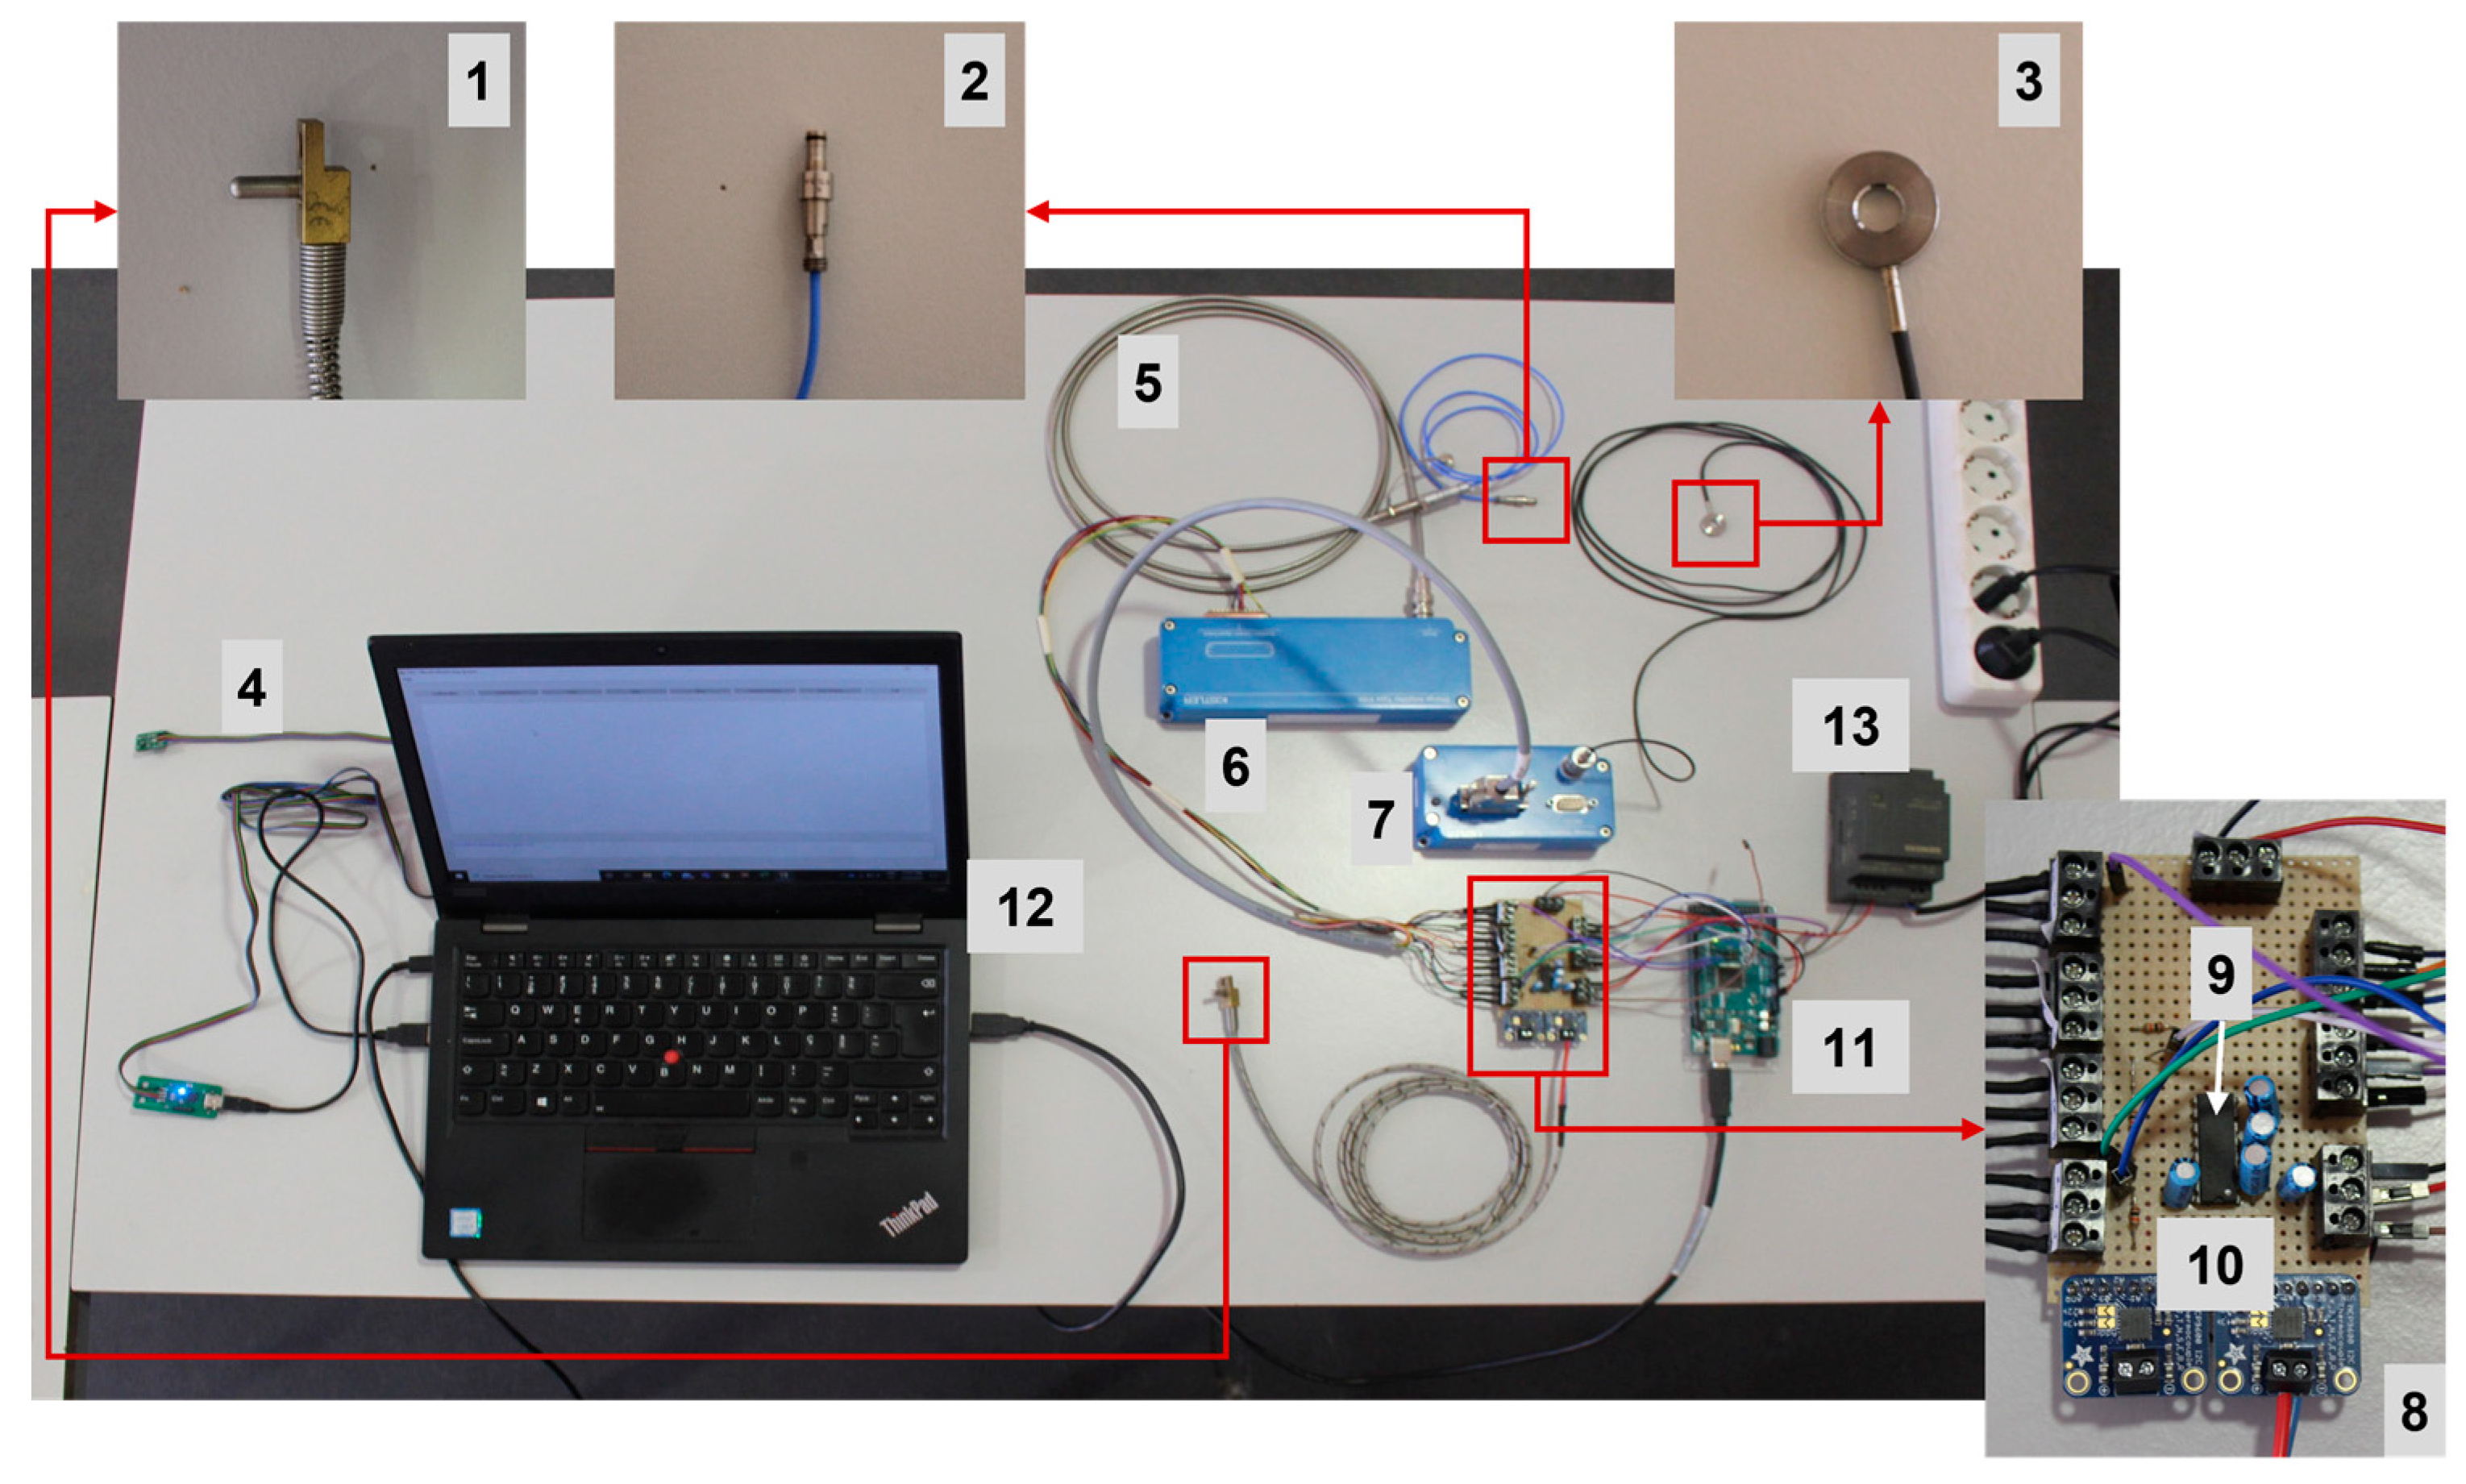
| Component | Designation |
|---|---|
| 1—Thermocouple | HASCO Z1295/1 (HASCO Hasenclever GmbH + Co KG, Lüdenscheid, Germany) |
| 2—Pressure sensor | Kistler Type 6157B (Kistler Group, Zurich, Switzerland) |
| 3—Force sensor | Kistler Type 9133B (Kistler Group, Zurich, Switzerland) |
| 4—Vibration monitoring module | Sensors: ST LSM6DSL (STMicroelectronics, Geneva, Switzerland); Microcontroller: Microchip PIC18F27K42 (Microchip Technology Inc., Shanghai, China) |
| 5—Pressure sensor extension cable | Kistler Type 1661A (Kistler Group, Zurich, Switzerland) |
| 6—Pressure sensor charge amplifier | Kistler Type 5155A2221 (Kistler Group, Zurich, Switzerland) |
| 7—Force sensor charge amplifier | Kistler Type 5073A111 (Kistler Group, Zurich, Switzerland) |
| 8—Arduino interface circuit | Made inhouse |
| 9—Device driver chip to communicate with component 7 | Texas Instruments MAX232 (Texas Instruments Inc., Dallas, TX, USA) |
| 10—Thermocouple signal amplifier | Adafruit MCP9600 (Adafruit Industries LLC, New York, NY, USA) |
| 11—Arduino | Arduino Mega 2560 R3 (Arduino, Monza, Italy) |
| 12—Computer | Laptop used in tests: Lenovo ThinkPad L380 (Lenovo Group Ltd., Hong Kong, China) |
| 13—Power supply | Generic |
| Parameter | Value |
|---|---|
| Barrel temperature zones (°C) | Nozzle: 220; Z1: 220; Z2: 210; Z3: 200 |
| Mold temperature (°C) | 20 |
| Hydraulic injection pressure (bar) | 100 |
| Injection time (s) | 0.8 |
| Hydraulic packing pressure (bar) | 20 |
| Packing time (s) | 4 |
| Cycle time (s) | 19 |
Disclaimer/Publisher’s Note: The statements, opinions and data contained in all publications are solely those of the individual author(s) and contributor(s) and not of MDPI and/or the editor(s). MDPI and/or the editor(s) disclaim responsibility for any injury to people or property resulting from any ideas, methods, instructions or products referred to in the content. |
© 2023 by the authors. Licensee MDPI, Basel, Switzerland. This article is an open access article distributed under the terms and conditions of the Creative Commons Attribution (CC BY) license (https://creativecommons.org/licenses/by/4.0/).
Share and Cite
Gomes, T.E.P.; Cadete, M.S.; Ferreira, J.A.F.; Febra, R.; Silva, J.; Noversa, T.; Pontes, A.J.; Neto, V. Development of an Open-Source Injection Mold Monitoring System. Sensors 2023, 23, 3569. https://doi.org/10.3390/s23073569
Gomes TEP, Cadete MS, Ferreira JAF, Febra R, Silva J, Noversa T, Pontes AJ, Neto V. Development of an Open-Source Injection Mold Monitoring System. Sensors. 2023; 23(7):3569. https://doi.org/10.3390/s23073569
Chicago/Turabian StyleGomes, Tiago E. P., Mylene S. Cadete, Jorge A. F. Ferreira, Renato Febra, João Silva, Tiago Noversa, António J. Pontes, and Victor Neto. 2023. "Development of an Open-Source Injection Mold Monitoring System" Sensors 23, no. 7: 3569. https://doi.org/10.3390/s23073569