
LIDAL, a Time-of-Flight Radiation Detector for the International Space Station: Description and Ground Calibration
 , , , ,
  , , , , , ,
Abstract
:1. Introduction
2. Materials and Methods
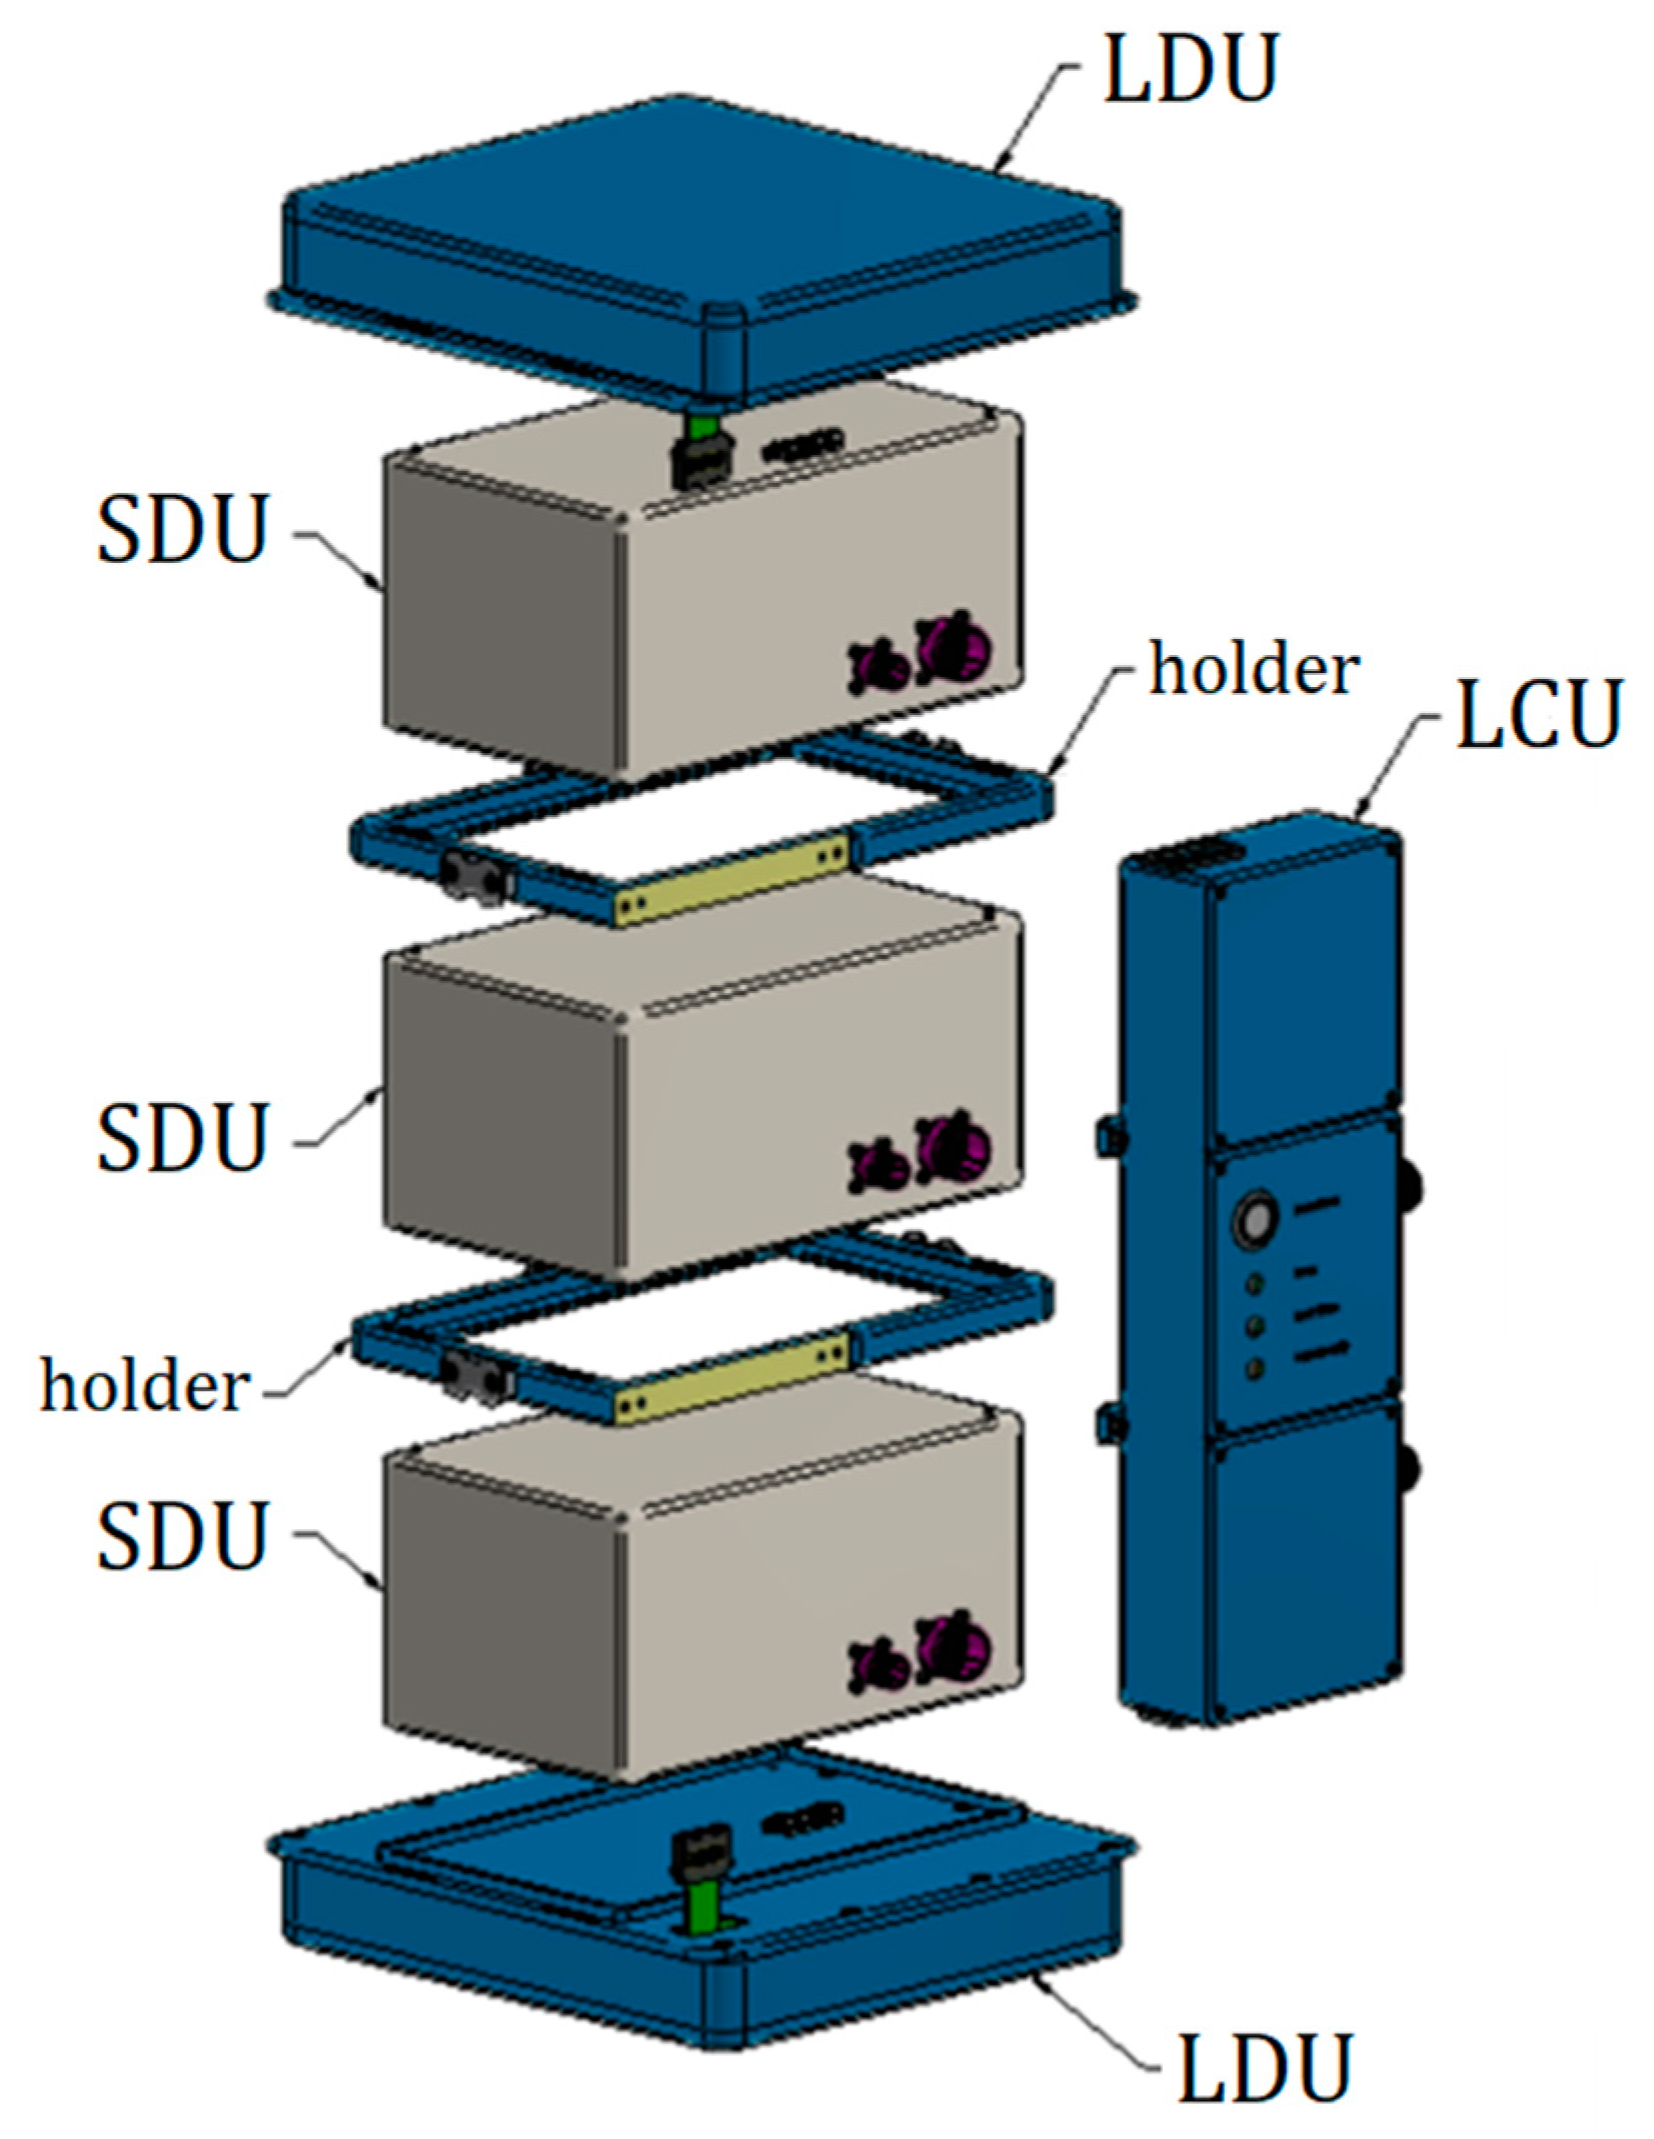
2.1. SDU
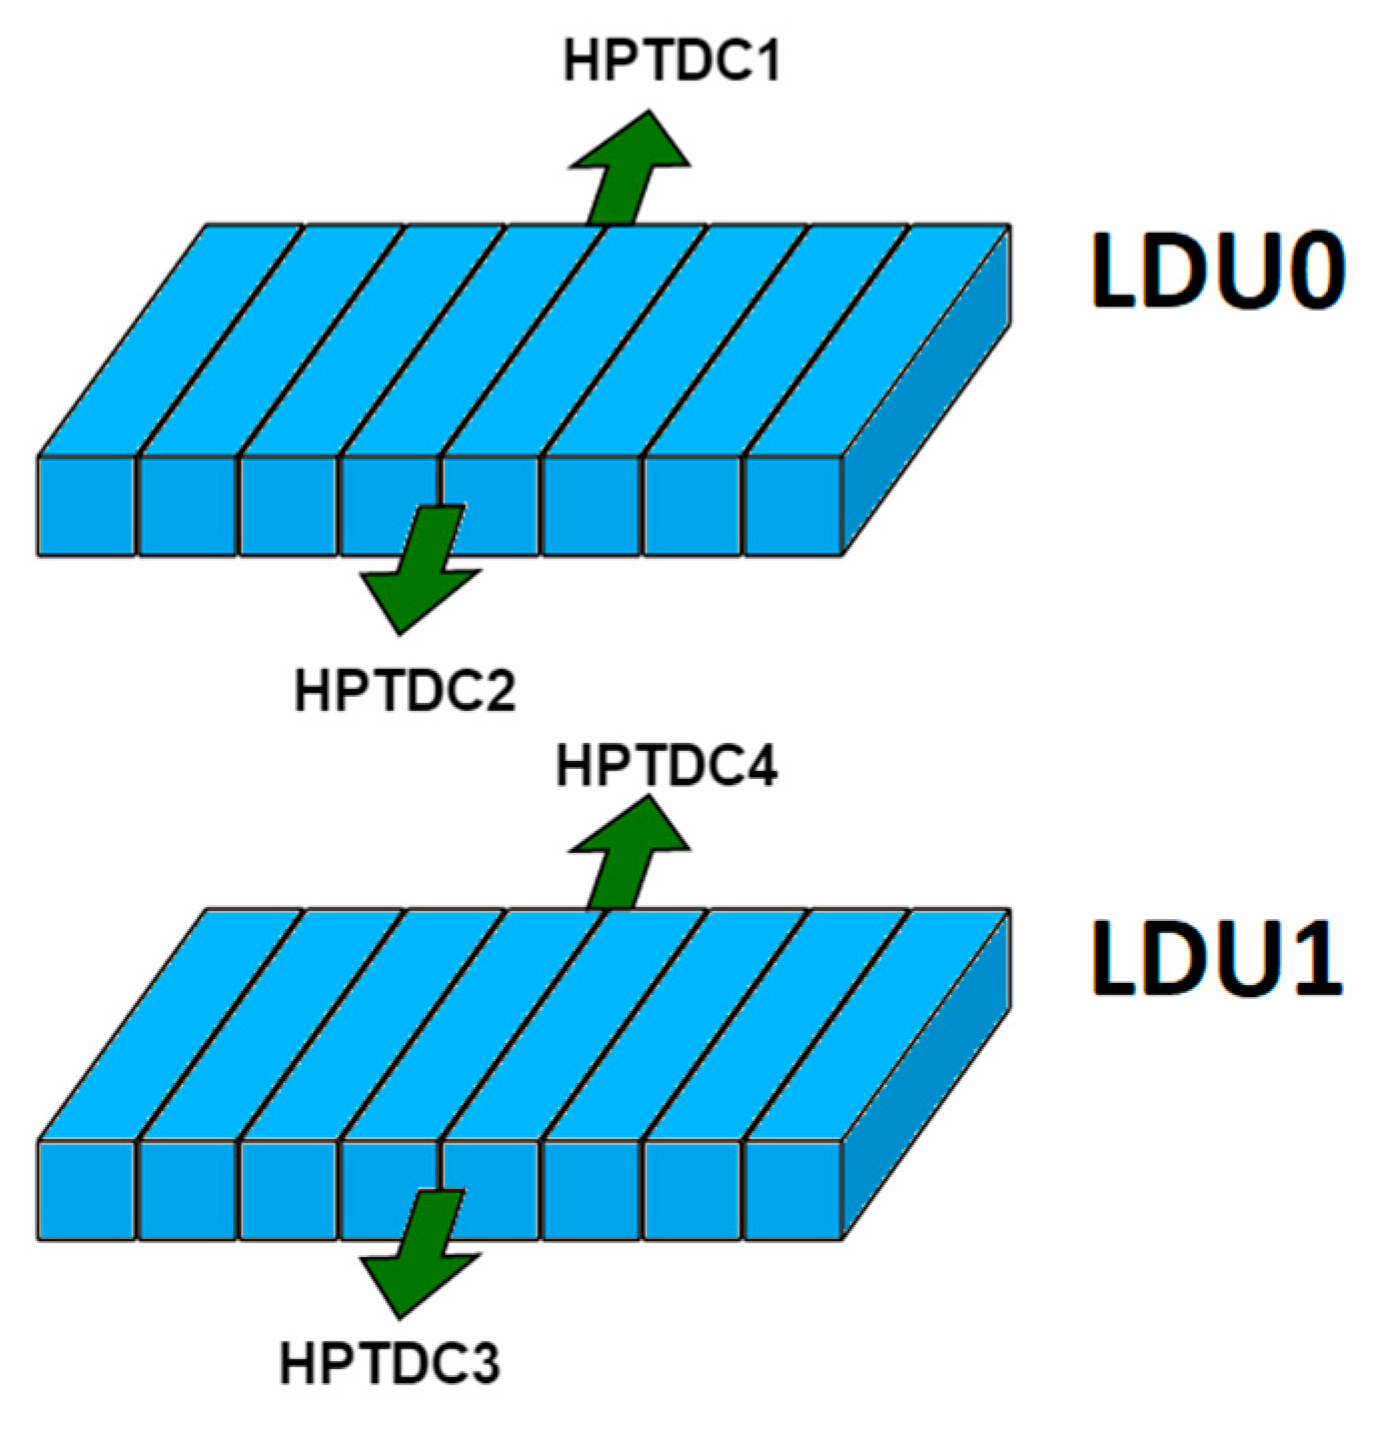
2.2. LDU and LCU
2.3. DAU
2.4. Pre-Processing
- Unpacking: Data from the binary stream are converted into a structured format, storing all times (coming from the scintillator bars) and released energies (coming from the silicon strips) for each particle event. LDU data require an additional step, namely the conversion of DAU data packets (24-bit length) into HPTDC data format (32-bit length).
- Calibration/reconstruction: Data from the silicon detectors must be calibrated and corrected (see next paragraph), and data from the scintillator bars must be combined to rebuild ToF (see Appendix A).
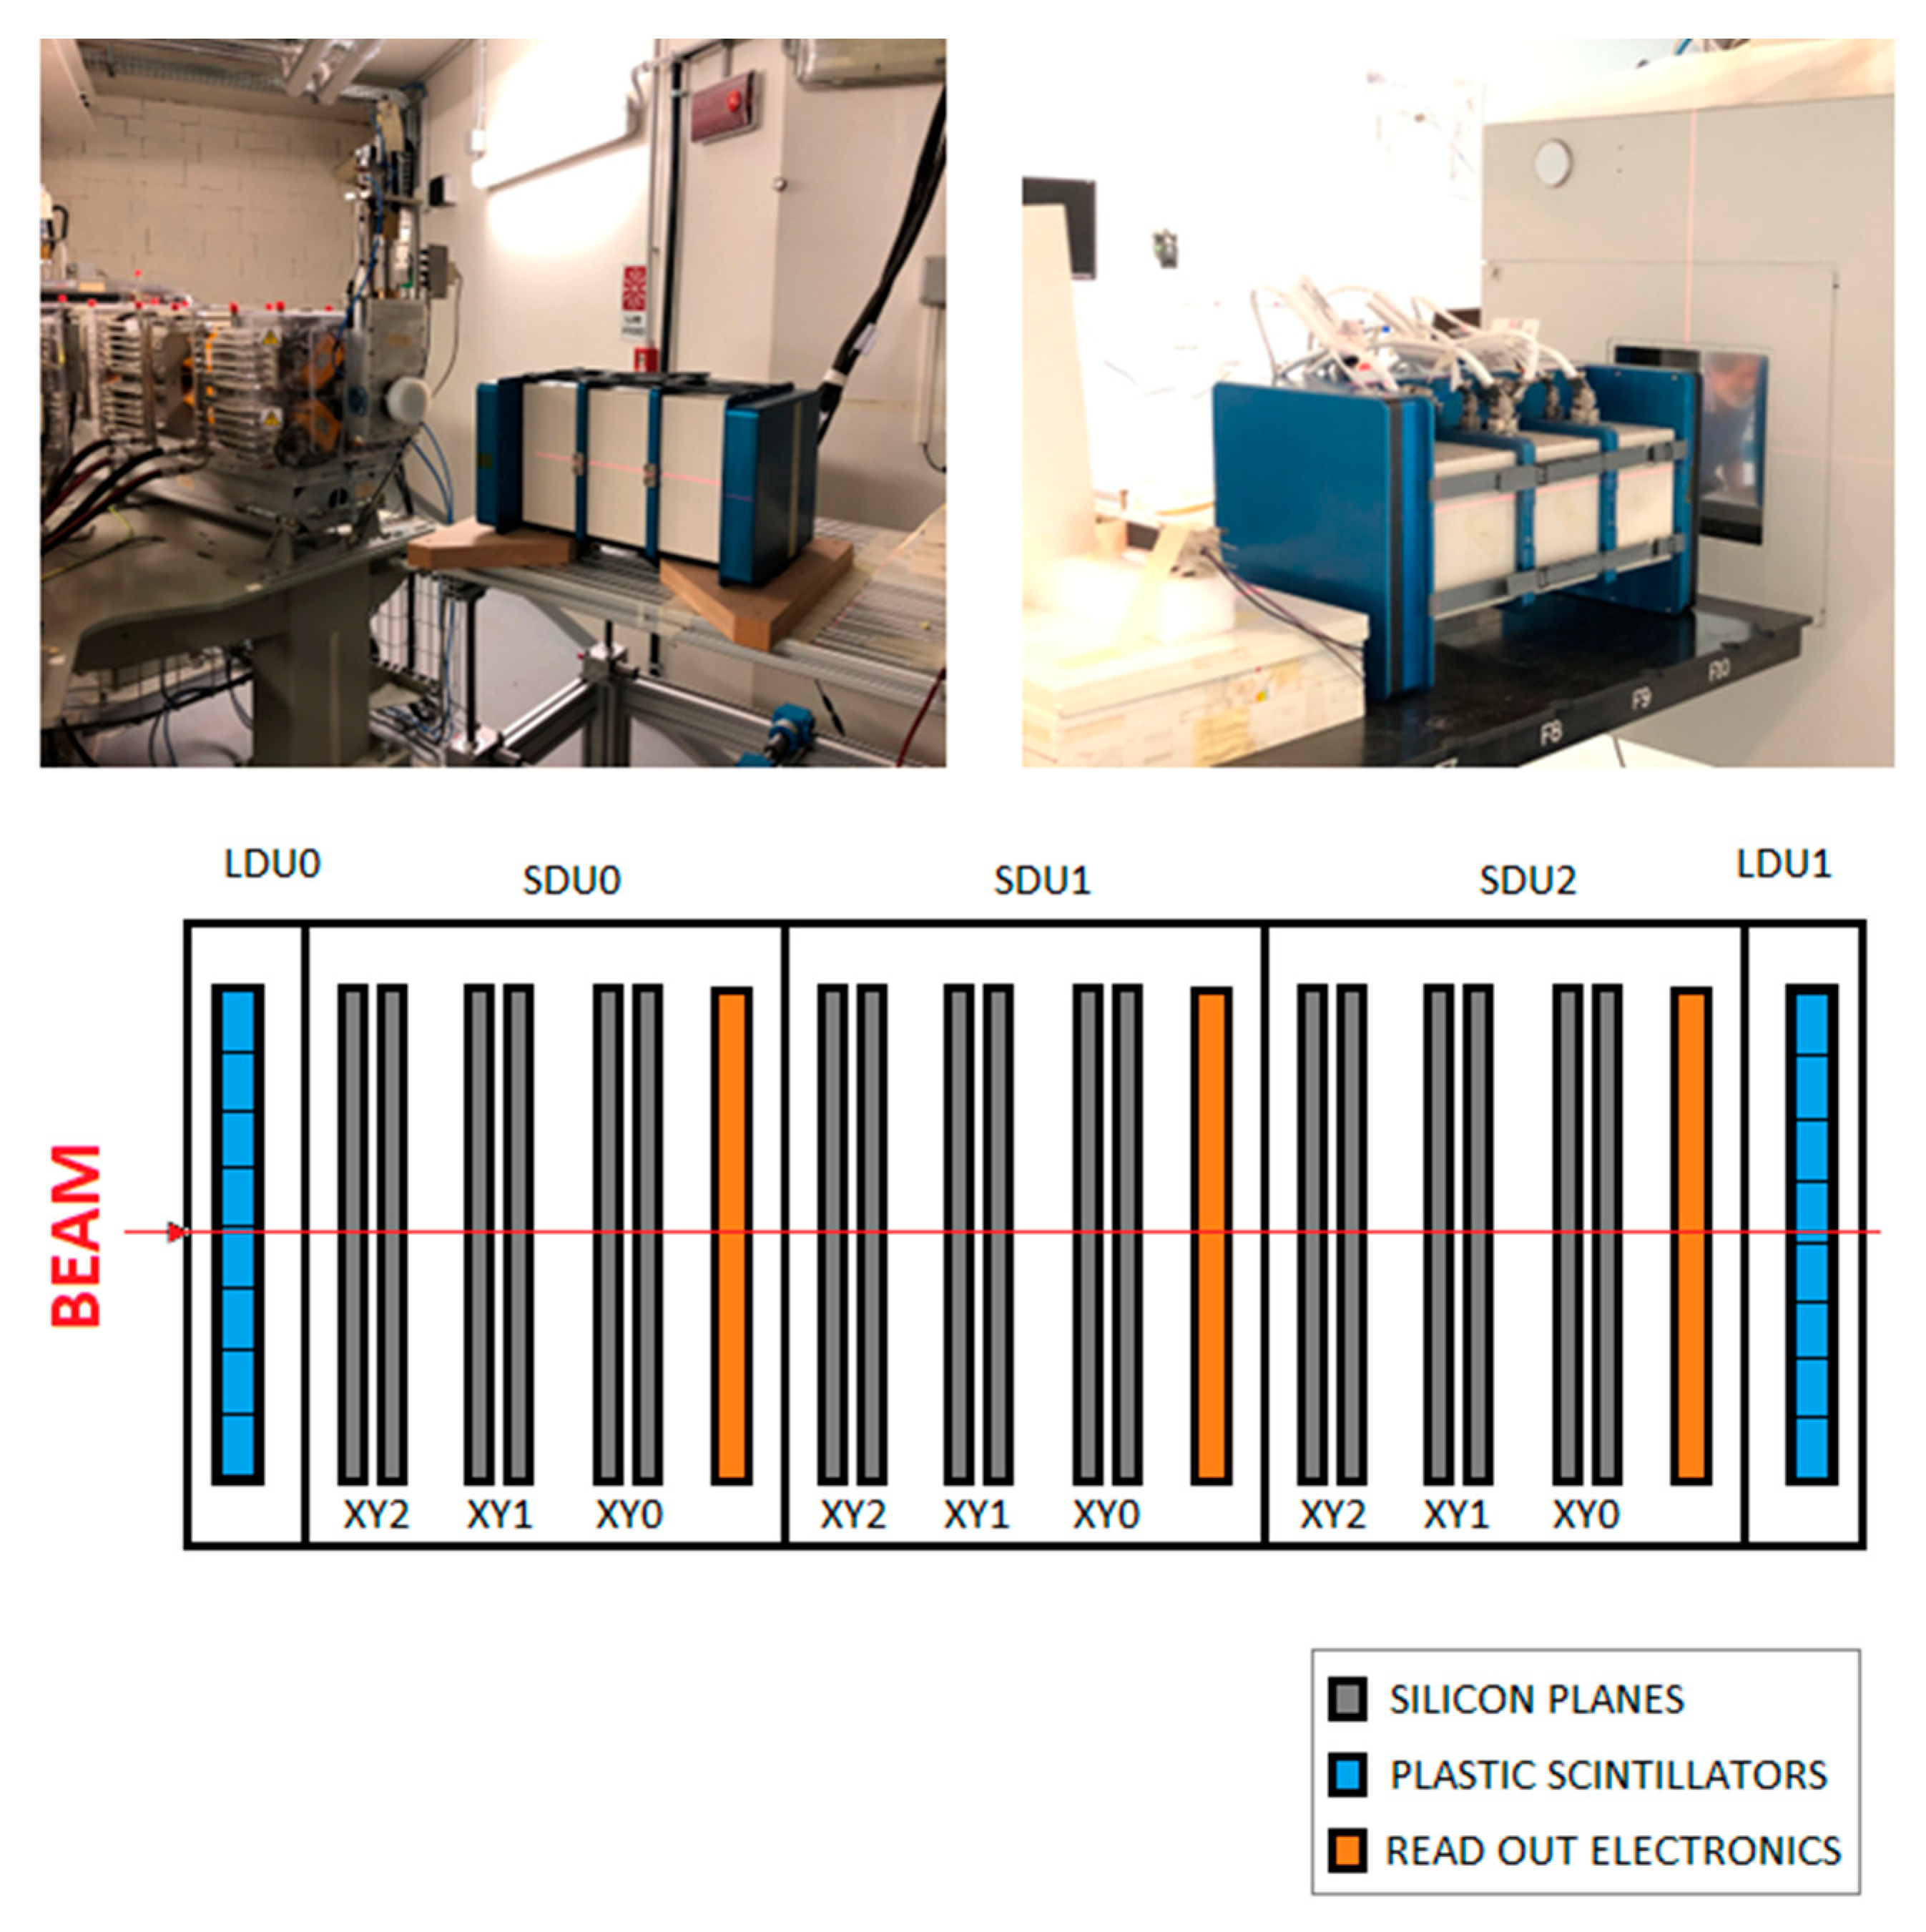
- Event selection: Recombined data must be checked to exclude incomplete (the accelerator rate was nominally kept below 102 Hz. However, the oscillations of the accelerator with these settings resulted in rates that could reach several hundred Hz. This high rate, focused on the same scintillators and silicon strips, could be a reason for incomplete events) and spurious events.
2.5. SDU Data Handling
2.6. LDU Data Handling
3. Results
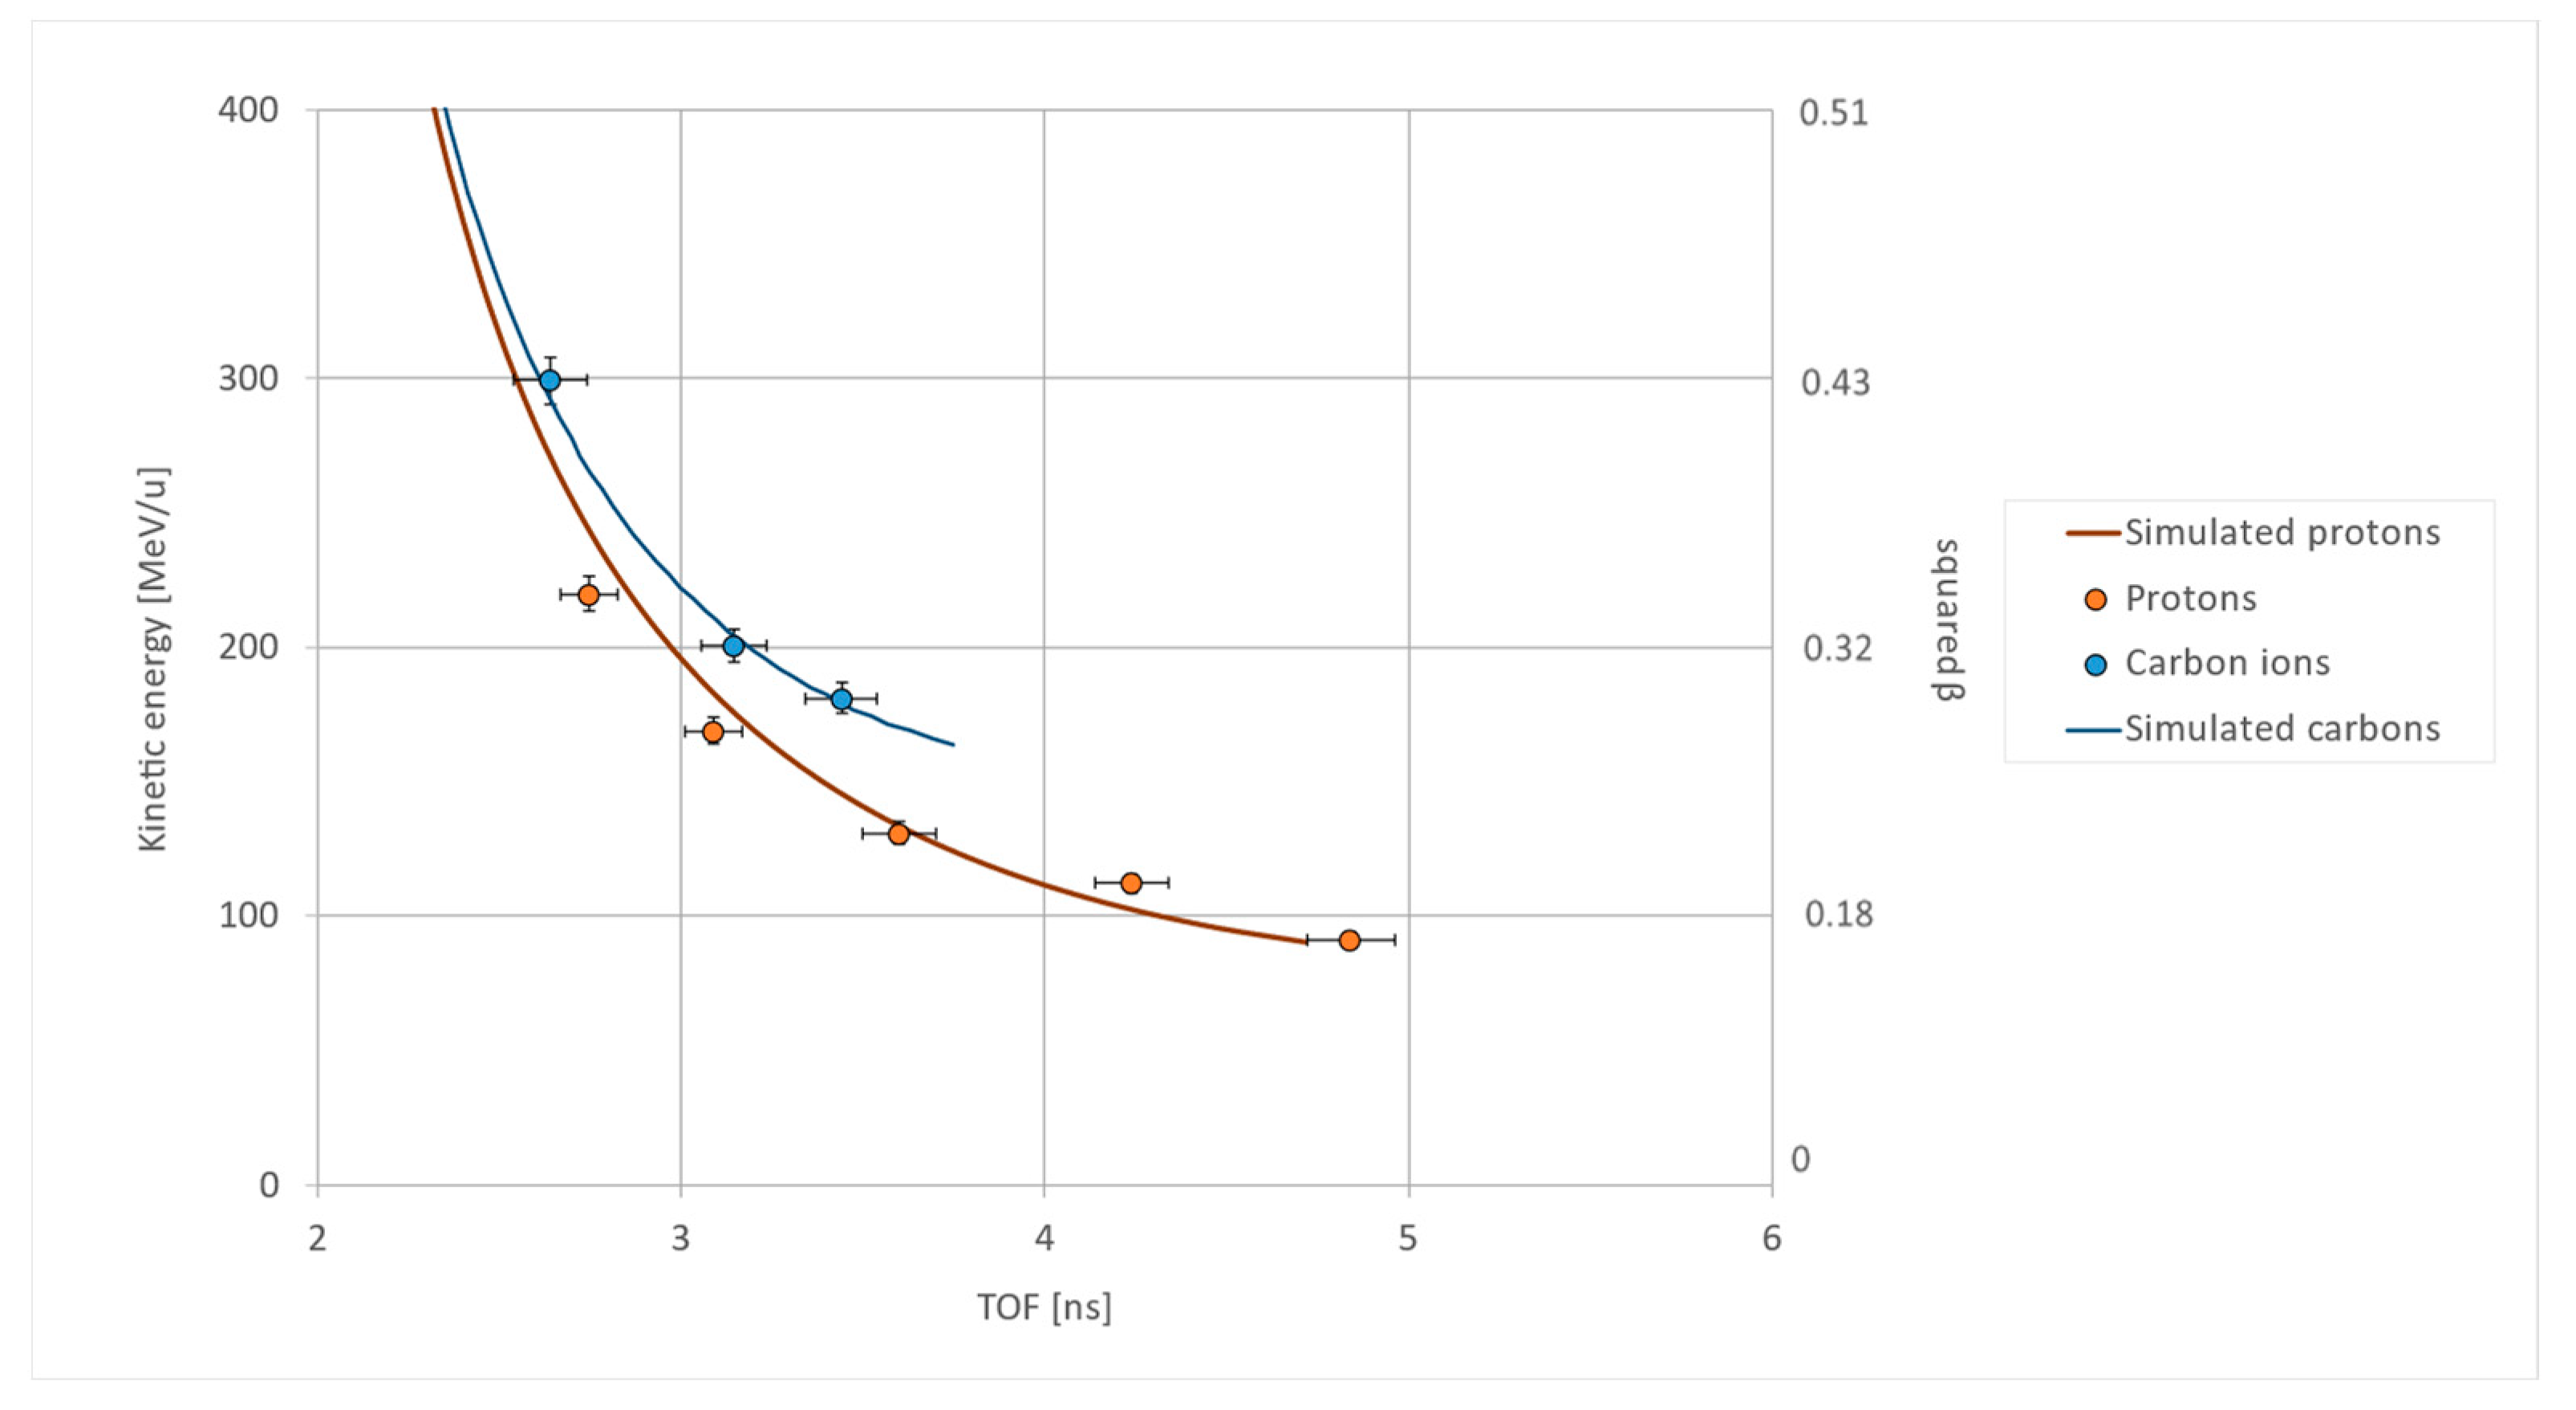
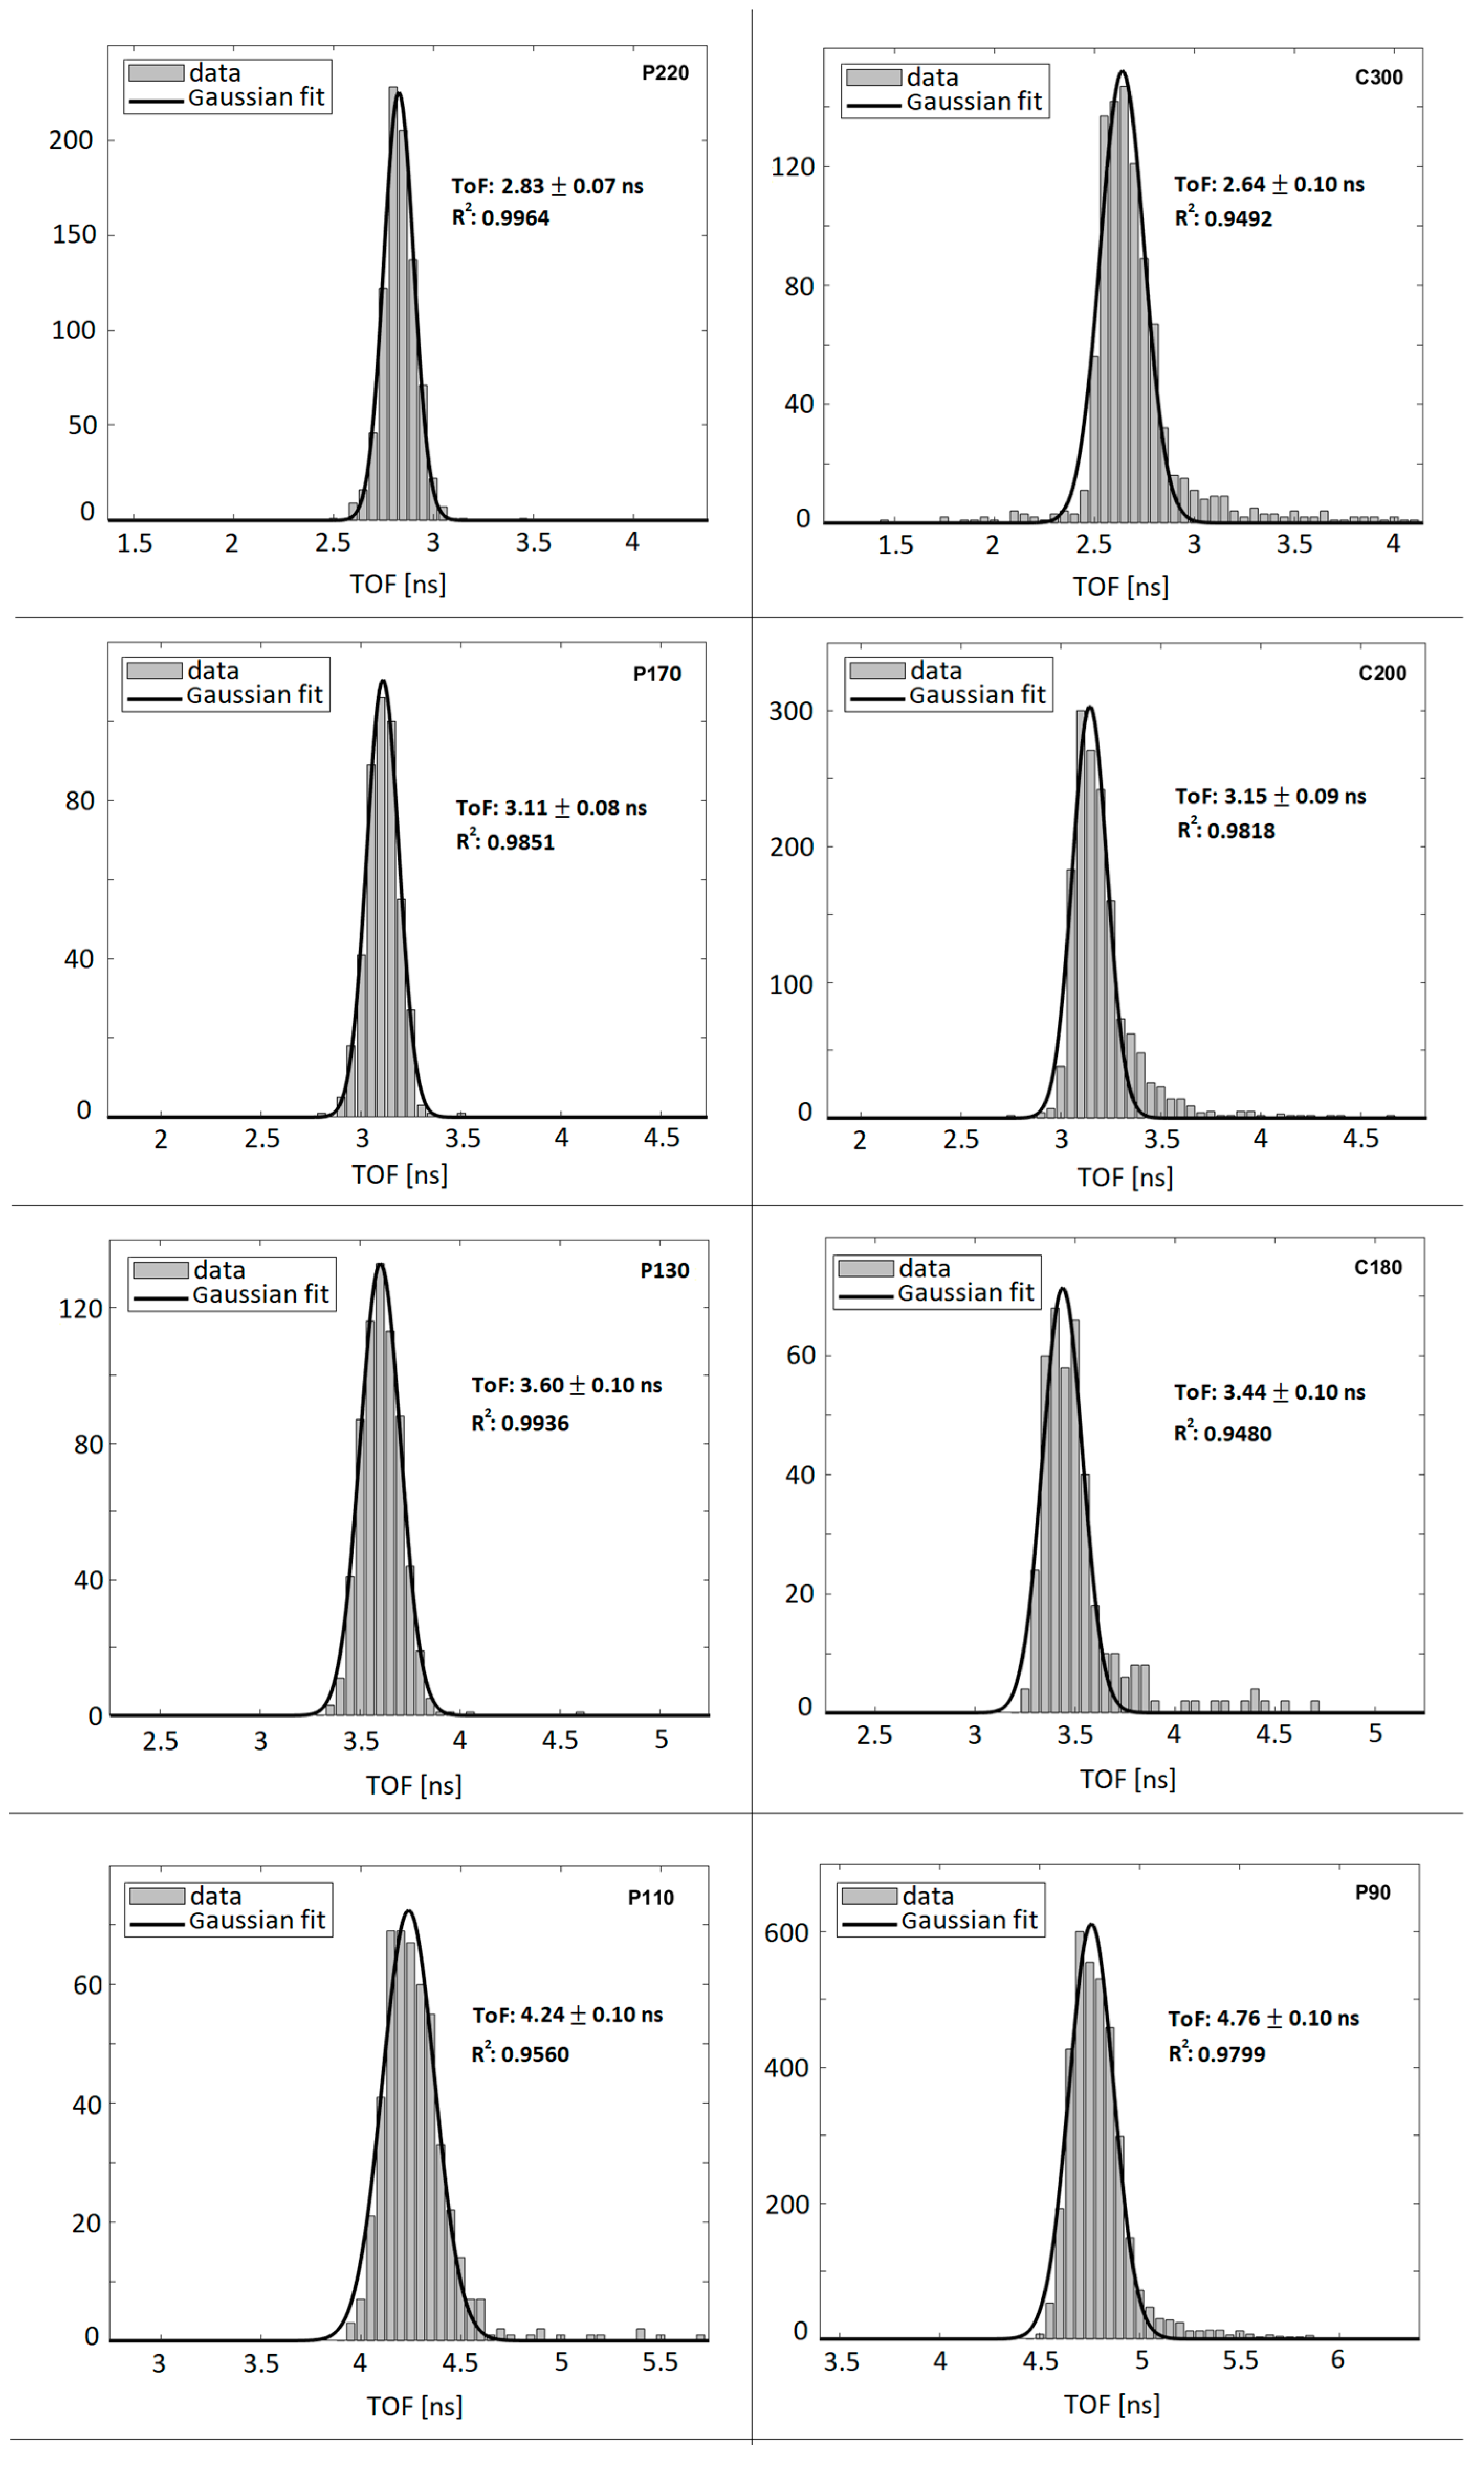
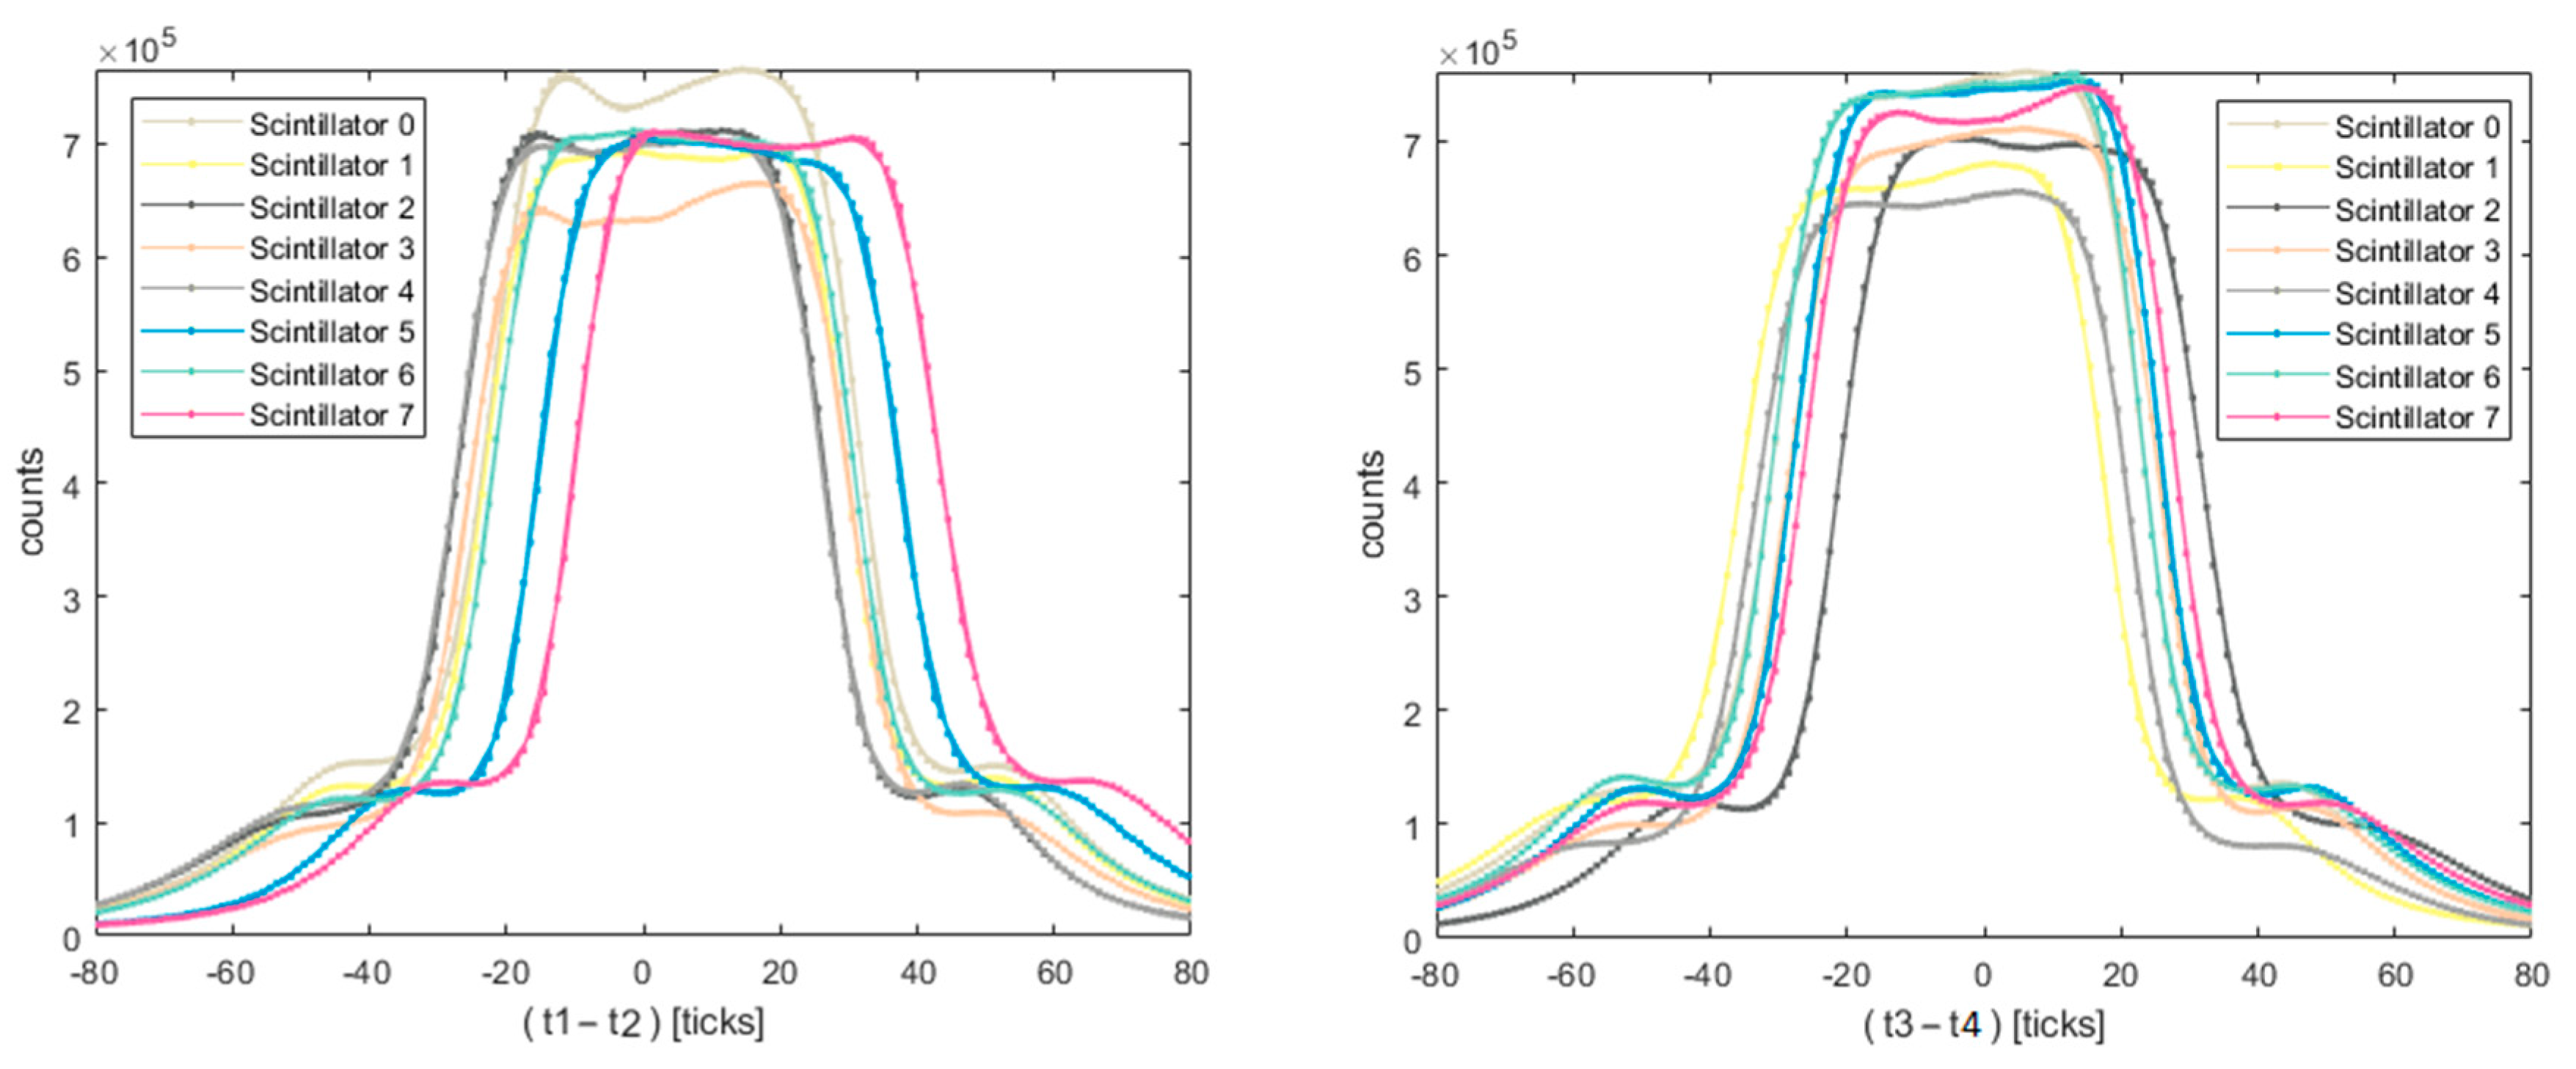
3.1. The Time-of-Flight Measurements (from LDUs)
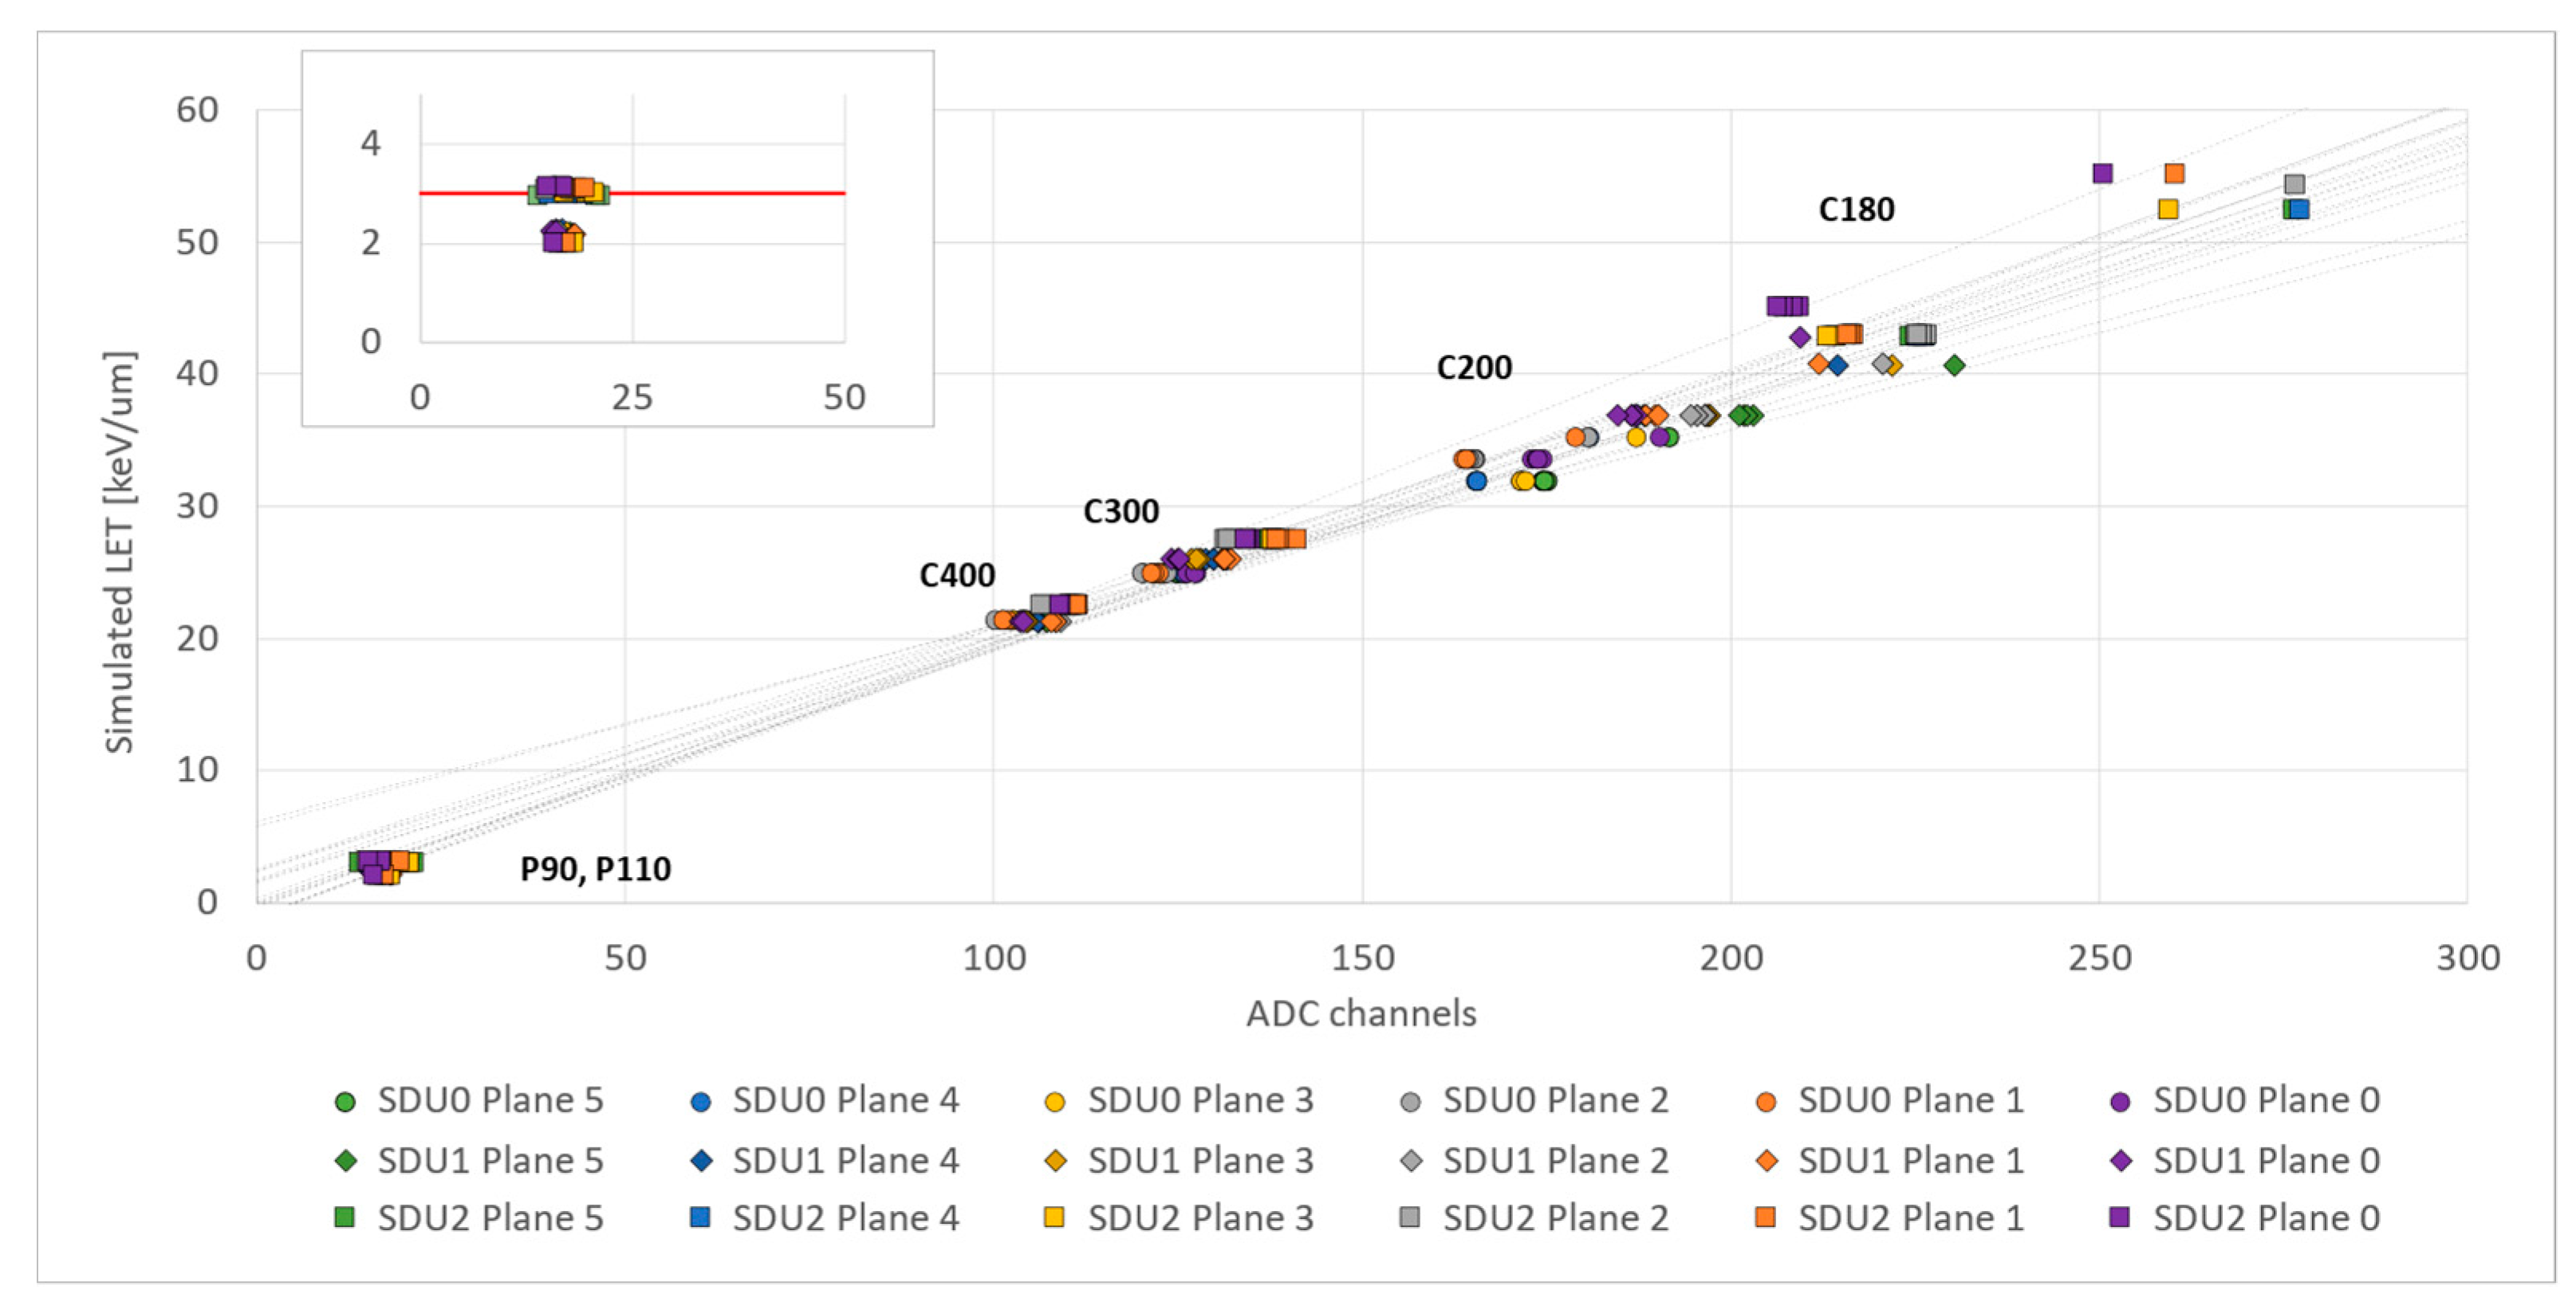
3.2. The Delivered Energy Measurements (from SDUs)
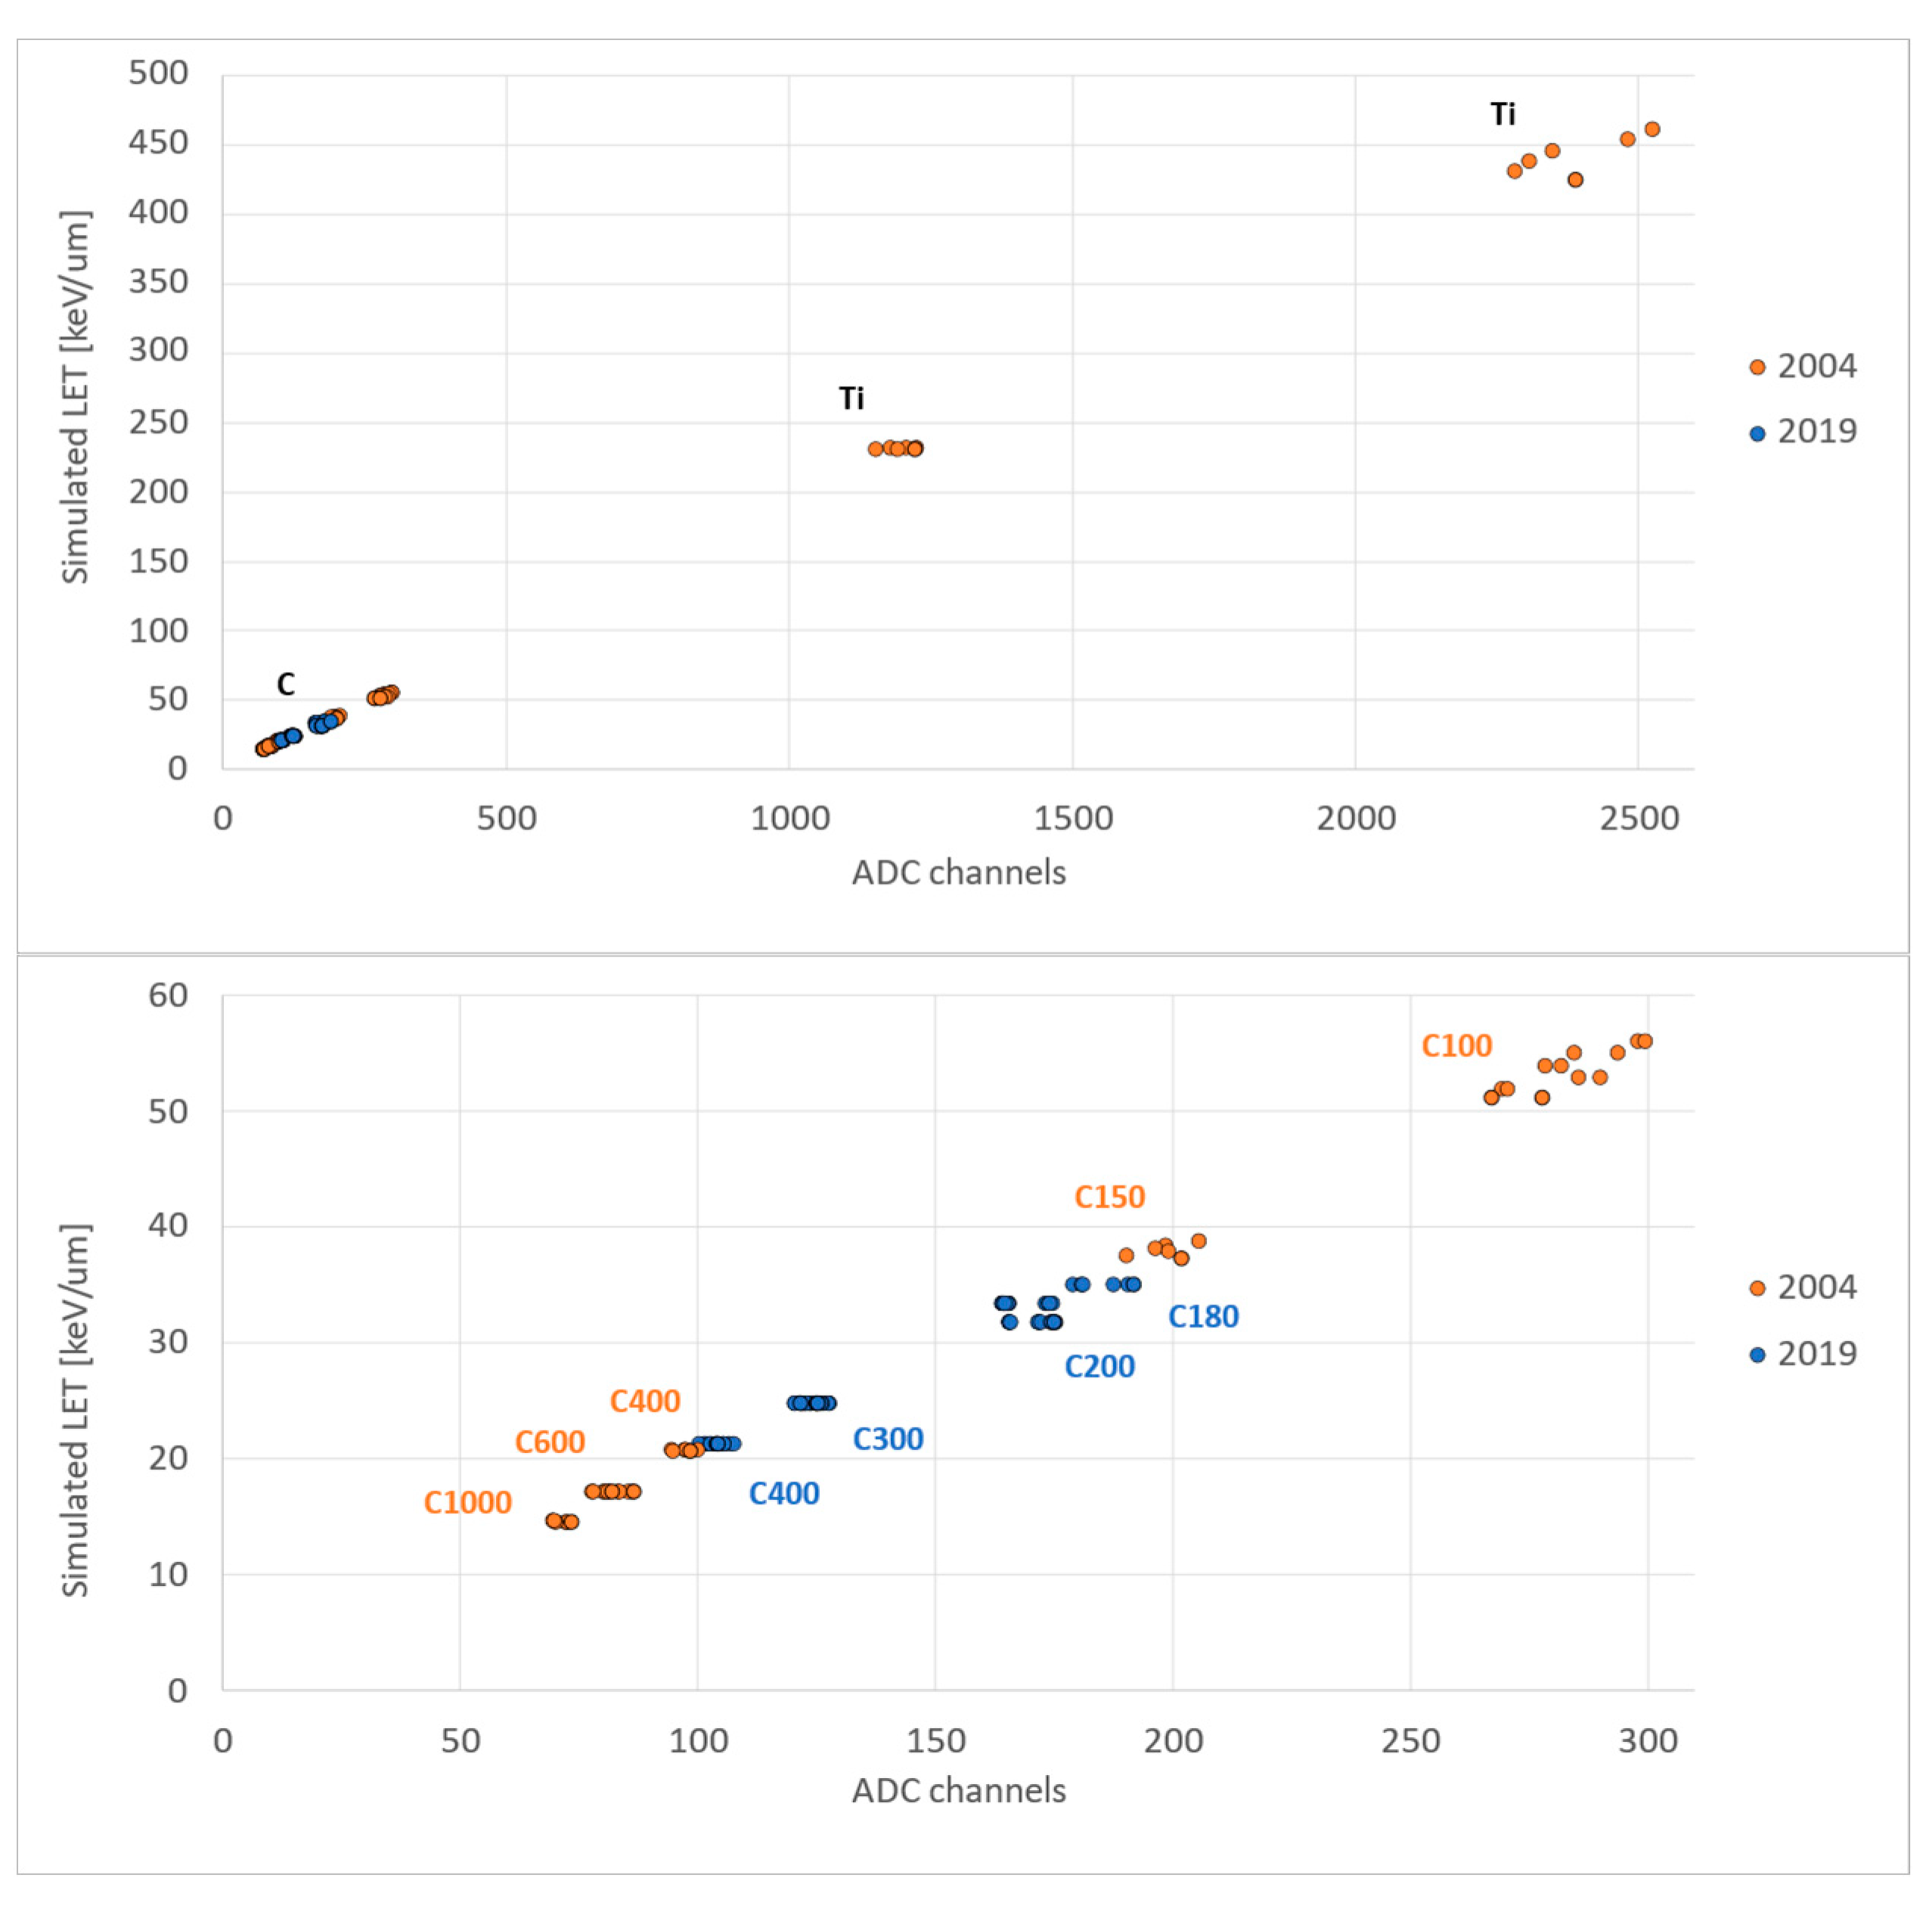
Comparison with Previous ALTEA Calibration
4. Discussion
4.1. Time-of-Flight Measurements
4.2. SDU Calibration
4.3. Comparison with Previous Calibrations
Author Contributions
Funding
Institutional Review Board Statement
Informed Consent Statement
Data Availability Statement
Acknowledgments
Conflicts of Interest
Appendix A

Appendix B

References
- Durante, M.; Cucinotta, F.A. Physical basis of radiation protection in space travel. Rev. Mod. Phys. 2011, 83, 1245–1281. [Google Scholar] [CrossRef]
- Patel, Z.S.; Brunstetter, T.J.; Tarver, W.J.; Whitmire, A.M.; Zwart, S.R.; Smith, S.M.; Huff, J.L. Red risks for a journey to the red planet: The highest priority human health risks for a mission to Mars. npj Microgravity 2020, 6, 33. [Google Scholar] [CrossRef] [PubMed]
- Narici, L.; Berger, T.; Matthiä, D.; Reitz, G. Radiation Measurements Performed with Active Detectors Relevant for Human Space Exploration. Front. Oncol. 2015, 5, 273. [Google Scholar] [CrossRef] [PubMed] [Green Version]
- Cucinotta, F.A.; Kim, M.Y.; Chappel, L.J. Space Radiation Cancer Risk Projections and Uncertainties. NASA/TP-2013-217375. 2013. Available online: https://three.jsc.nasa.gov/articles/TP_2013_CancerRisk.pdf (accessed on 21 January 2023).
- Rizzo, A.; Narici, L.; Messi, R.; Cipollone, P.; De Donato, C.; Di Fino, L.; Iannilli, M.; La Tessa, C.; Manea, C.; Masciantonio, G.; et al. A compact Time-Of-Flight detector for space applications: The LIDAL system. Nucl. Instrum. Methods Phys. Res. Sect. A Accel. Spectrometers Detect. Assoc. Equip. 2018, 898, 98–104. [Google Scholar] [CrossRef]
- Morone, M.; Berucci, C.; Cipollone, P.; De Donato, C.; Di Fino, L.; Iannilli, M.; La Tessa, C.; Manea, C.; Masciantonio, G.; Messi, R.; et al. A compact Time-Of-Flight detector for radiation measurements in a space habitat: LIDAL–ALTEA. Nucl. Instrum. Methods Phys. Res. Sect. A Accel. Spectrometers Detect. Assoc. Equip. 2018, 936, 222–223. [Google Scholar] [CrossRef]
- Rizzo, A.; Berucci, C.; De Donato, C.; Di Fino, L.; Lamastra, F.R.; La Tessa, C.; Masciantonio, G.; Messi, R.; Morone, C.; Picozza, P.; et al. LIDAL (Light Ion Detector for ALTEA): A compact Time-Of-Flight detector for radiation risk assessment in space. J. Phys. Conf. Ser. 2019, 1226, 012024. [Google Scholar] [CrossRef]
- Berucci, C.; De Donato, C.; Di Fino, L.; La Tessa, C.; Masciantonio, G.; Messi, R.; Morone, M.C.; Rizzo, A.; Rovituso, M.; Tommasino, F.; et al. Monte Carlo simulation of the LIDAL-ALTEA detector system. J. Phys. Conf. Ser. 2019, 1226, 012020. [Google Scholar] [CrossRef]
- Di Fino, L.; Romoli, G.; Santi Amantini, G.; Boretti, V.; Lunati, L.; Berucci, C.; Messi, R.; Rizzo, A.; Albicocco, P.; De Donato, C.; et al. Radiation measurements in the International Space Station, Columbus module, in 2020-2022 with the LIDAL detector. Life Sci. Space Res. 2023. submitted. [Google Scholar]
- Zaconte, V.; Casolino, M.; De Santis, C.; Di Fino, L.; La Tessa, C.; Larosa, M.; Narici, L.; Picozza, P. The radiation environment in the ISS-USLab measured by ALTEA: Spectra and relative nuclear abundances in the polar, equatorial and SAA regions. Adv. Space Res. 2010, 46, 797–799. [Google Scholar] [CrossRef]
- Zaconte, V.; Casolino, M.; Di Fino, L.; La Tessa, C.; Larosa, M.; Narici, L.; Picozza, P. High energy radiation fluences in the ISS-USLab: Ion discrimination and particle abundances. Radiat. Meas. 2010, 45, 168–172. [Google Scholar] [CrossRef]
- Narici, L.; Casolino, M.; Di Fino, L.; LaRosa, M.; Picozza, P.; Zaconte, V. Radiation survey in the International Space Station. J. Space Weather. Space Clim. 2015, 5, A37. [Google Scholar] [CrossRef]
- Zaconte, V.; Belli, F.; Bidoli, V.; Casolino, M.; Di Fino, L.; Narici, L.; Picozza, P.; Rinaldi, A.; Ruggieri, D.; Carozzo, S.; et al. ALTEA: Flight model calibration at GSI. Adv. Space Res. 2006, 37, 1704–1709. [Google Scholar] [CrossRef]
- Zaconte, V.; Belli, F.; Bidoli, V.; Casolino, M.; Di Fino, L.; Narici, L.; Picozza, P.; Rinaldi, A.; Sannita, W.; Finetti, N.; et al. ALTEA: The instrument calibration. Nucl. Instrum. Methods Phys. Res. Sect. B Beam Interact. Mater. Atoms 2008, 266, 2070–2078. [Google Scholar] [CrossRef]
- Bidoli, V.; Casolino, M.; De Grandis, E.; De Pascale, M.P.; Furano, G.; Morselli, A.; Narici, L.; Picozza, P.; Reali, E.; Sparvoli, R.; et al. In-flight performance of SilEye-2 experiment and cosmic ray abundances inside the Mir space station. J. Phys. G Nucl. Part. Phys. 2001, 27, 2051–2064. [Google Scholar] [CrossRef] [Green Version]
- Casolino, M.; Bidoli, V.; Di Fino, L.; Furano, G.; Minori, M.; Morselli, A.; Narici, L.; De Pascale, M.P.; Picozza, P.; Reali, E.; et al. Relative nuclear abundances measurements inside Mir and ISS with Sileye-2 and Sileye-3 experiments. In Proceedings of the 28th International Cosmic Ray Conference, Tsukuba, Japan, 31 July–7 August 2003; Volume 7, pp. 4245–4248. [Google Scholar]
- Barbiellini, G.; Bartalucci, S.; Bellotti, R.; Bidoli, V.; Bocciolini, M.; Boezio, M.; Cafagna, F.; Casolino, M.; Candusso, M.; Castellano, M.; et al. NINA: A lightweight silicon strip detector for cosmic ray research in space. Space Tel. Instr. 1995, 2478, 239–250. [Google Scholar]
- Fast timing EJ-228, EJ-230. Available online: https://eljentechnology.com/products/plastic-scintillators/ej-228-ej-230 (accessed on 14 September 2022).
- R9880U PMT Series. Available online: https://www.hamamatsu.com/content/dam/hamamatsu-photonics/sites/documents/99_SALES_LIBRARY/etd/R9880U_TPMH1321E.pdf (accessed on 13 September 2022).
- Anghinolfi, F.; Jarron, P.; Krummenacher, F.; Usenko, E.; Williams, M. NINO, an ultra-fast, low-power, front-end amplifier discriminator for the Time-Of-Flight detector in ALICE experiment. In Proceedings of the 2003 IEEE Nuclear Science Symposium. Conference Record, Portland, OR, USA, 19–25 October 2003; Volume 1, pp. 375–379. [Google Scholar]
- Christiansen, J.; Debieux, S.; Mota, M.; Moreira, P.; Marchioro, A.; Ryzhov, V. A data driven high performance Time to Digital Converter. In Proceedings of the 6th Workshop on Electronics for LHC Experiments, Krakow, Poland, 11–15 September 2000; Volume 169. Available online: http://cdsweb.cern.ch/record/478865 (accessed on 8 July 2022).
- Ackermann, M.; Ajello, M.; Albert, A.; Allafort, A.; Atwood, W.B.; Axelsson, M.; Baldini, L.; Ballet, J.; Barbiellini, G.; Bastieri, D.; et al. THE FERMI LARGE AREA TELESCOPE ON ORBIT: EVENT CLASSIFICATION, INSTRUMENT RESPONSE FUNCTIONS, AND CALIBRATION. Astrophys. J. Suppl. Ser. 2012, 203, 4. [Google Scholar] [CrossRef] [Green Version]
- Grimes, D.R.; Warren, D.R.; Partridge, M. An approximate analytical solution of the Bethe equation for charged particles in the radiotherapeutic energy range. Sci. Rep. 2017, 7, 9781. [Google Scholar] [CrossRef] [PubMed] [Green Version]
- Martinez, D.M.; Rahmani, M.; Burbadge, C.; Hoehr, C. A practical solution of the Bethe equation in the energy range applicable to radiotherapy and radionuclide production. Sci. Rep. 2019, 9, 17599. [Google Scholar] [CrossRef] [PubMed] [Green Version]
- Sato, T.; Iwamoto, Y.; Hashimoto, S.; Ogawa, T.; Furuta, T.; Abe, S.-I.; Kai, T.; Tsai, P.-E.; Matsuda, N.; Iwase, H.; et al. Features of Particle and Heavy Ion Transport code System (PHITS) version 3.02. J. Nucl. Sci. Technol. 2018, 55, 684–690. [Google Scholar] [CrossRef] [Green Version]


| SDU | Plane Y0 | Plane X0 | Plane Y1 | Plane X1 | Plane Y2 | Plane X2 |
|---|---|---|---|---|---|---|
| SDU0 | 0.18 ± 0.01 | 0.19 ± 0.01 | 0.18 ± 0.01 | 0.15 ± 0.01 | 0.18 ± 0.01 | 0.15 ± 0.01 |
| SDU1 | 0.20 ± 0.01 | 0.20 ± 0.01 | 0.19 ± 0.01 | 0.18 ± 0.01 | 0.20 ± 0.01 | 0.18 ± 0.01 |
| SDU2 | 0.22 ± 0.01 | 0.21 ± 0.01 | 0.19 ± 0.01 | 0.21 ± 0.01 | 0.19 ± 0.01 | 0.19 ± 0.02 |
| SDU | Plane Y0 | Plane X0 | Plane Y1 | Plane X1 | Plane Y2 | Plane X2 |
|---|---|---|---|---|---|---|
| SDU0 | 0.18 ± 0.01 | 0.18 ± 0.01 | 0.19 ± 0.01 | 0.19 ± 0.01 | 0.19 ± 0.01 | 0.18 ± 0.01 |
| SDU1 | 0.18 ± 0.01 | 0.19 ± 0.01 | 0.19 ± 0.01 | 0.18 ± 0.01 | 0.18 ± 0.01 | 0.19 ± 0.01 |
| SDU2 | 0.17 ± 0.01 | 0.18 ± 0.01 | 0.17 ± 0.01 | 0.19 ± 0.01 | 0.17 ± 0.01 | 0.18 ± 0.01 |
Disclaimer/Publisher’s Note: The statements, opinions and data contained in all publications are solely those of the individual author(s) and contributor(s) and not of MDPI and/or the editor(s). MDPI and/or the editor(s) disclaim responsibility for any injury to people or property resulting from any ideas, methods, instructions or products referred to in the content. |
© 2023 by the authors. Licensee MDPI, Basel, Switzerland. This article is an open access article distributed under the terms and conditions of the Creative Commons Attribution (CC BY) license (https://creativecommons.org/licenses/by/4.0/).
Share and Cite
Romoli, G.; Di Fino, L.; Santi Amantini, G.; Boretti, V.; Lunati, L.; Berucci, C.; Messi, R.; Rizzo, A.; Albicocco, P.; De Donato, C.; et al. LIDAL, a Time-of-Flight Radiation Detector for the International Space Station: Description and Ground Calibration. Sensors 2023, 23, 3559. https://doi.org/10.3390/s23073559
Romoli G, Di Fino L, Santi Amantini G, Boretti V, Lunati L, Berucci C, Messi R, Rizzo A, Albicocco P, De Donato C, et al. LIDAL, a Time-of-Flight Radiation Detector for the International Space Station: Description and Ground Calibration. Sensors. 2023; 23(7):3559. https://doi.org/10.3390/s23073559
Chicago/Turabian StyleRomoli, Giulia, Luca Di Fino, Giorgia Santi Amantini, Virginia Boretti, Luca Lunati, Carolina Berucci, Roberto Messi, Alessandro Rizzo, Pietro Albicocco, Cinzia De Donato, and et al. 2023. "LIDAL, a Time-of-Flight Radiation Detector for the International Space Station: Description and Ground Calibration" Sensors 23, no. 7: 3559. https://doi.org/10.3390/s23073559