
ICEP: An Instrumented Cycling Ergometer Platform for the Assessment of Advanced FES Strategies

Abstract
:1. Introduction
2. Materials and Methods
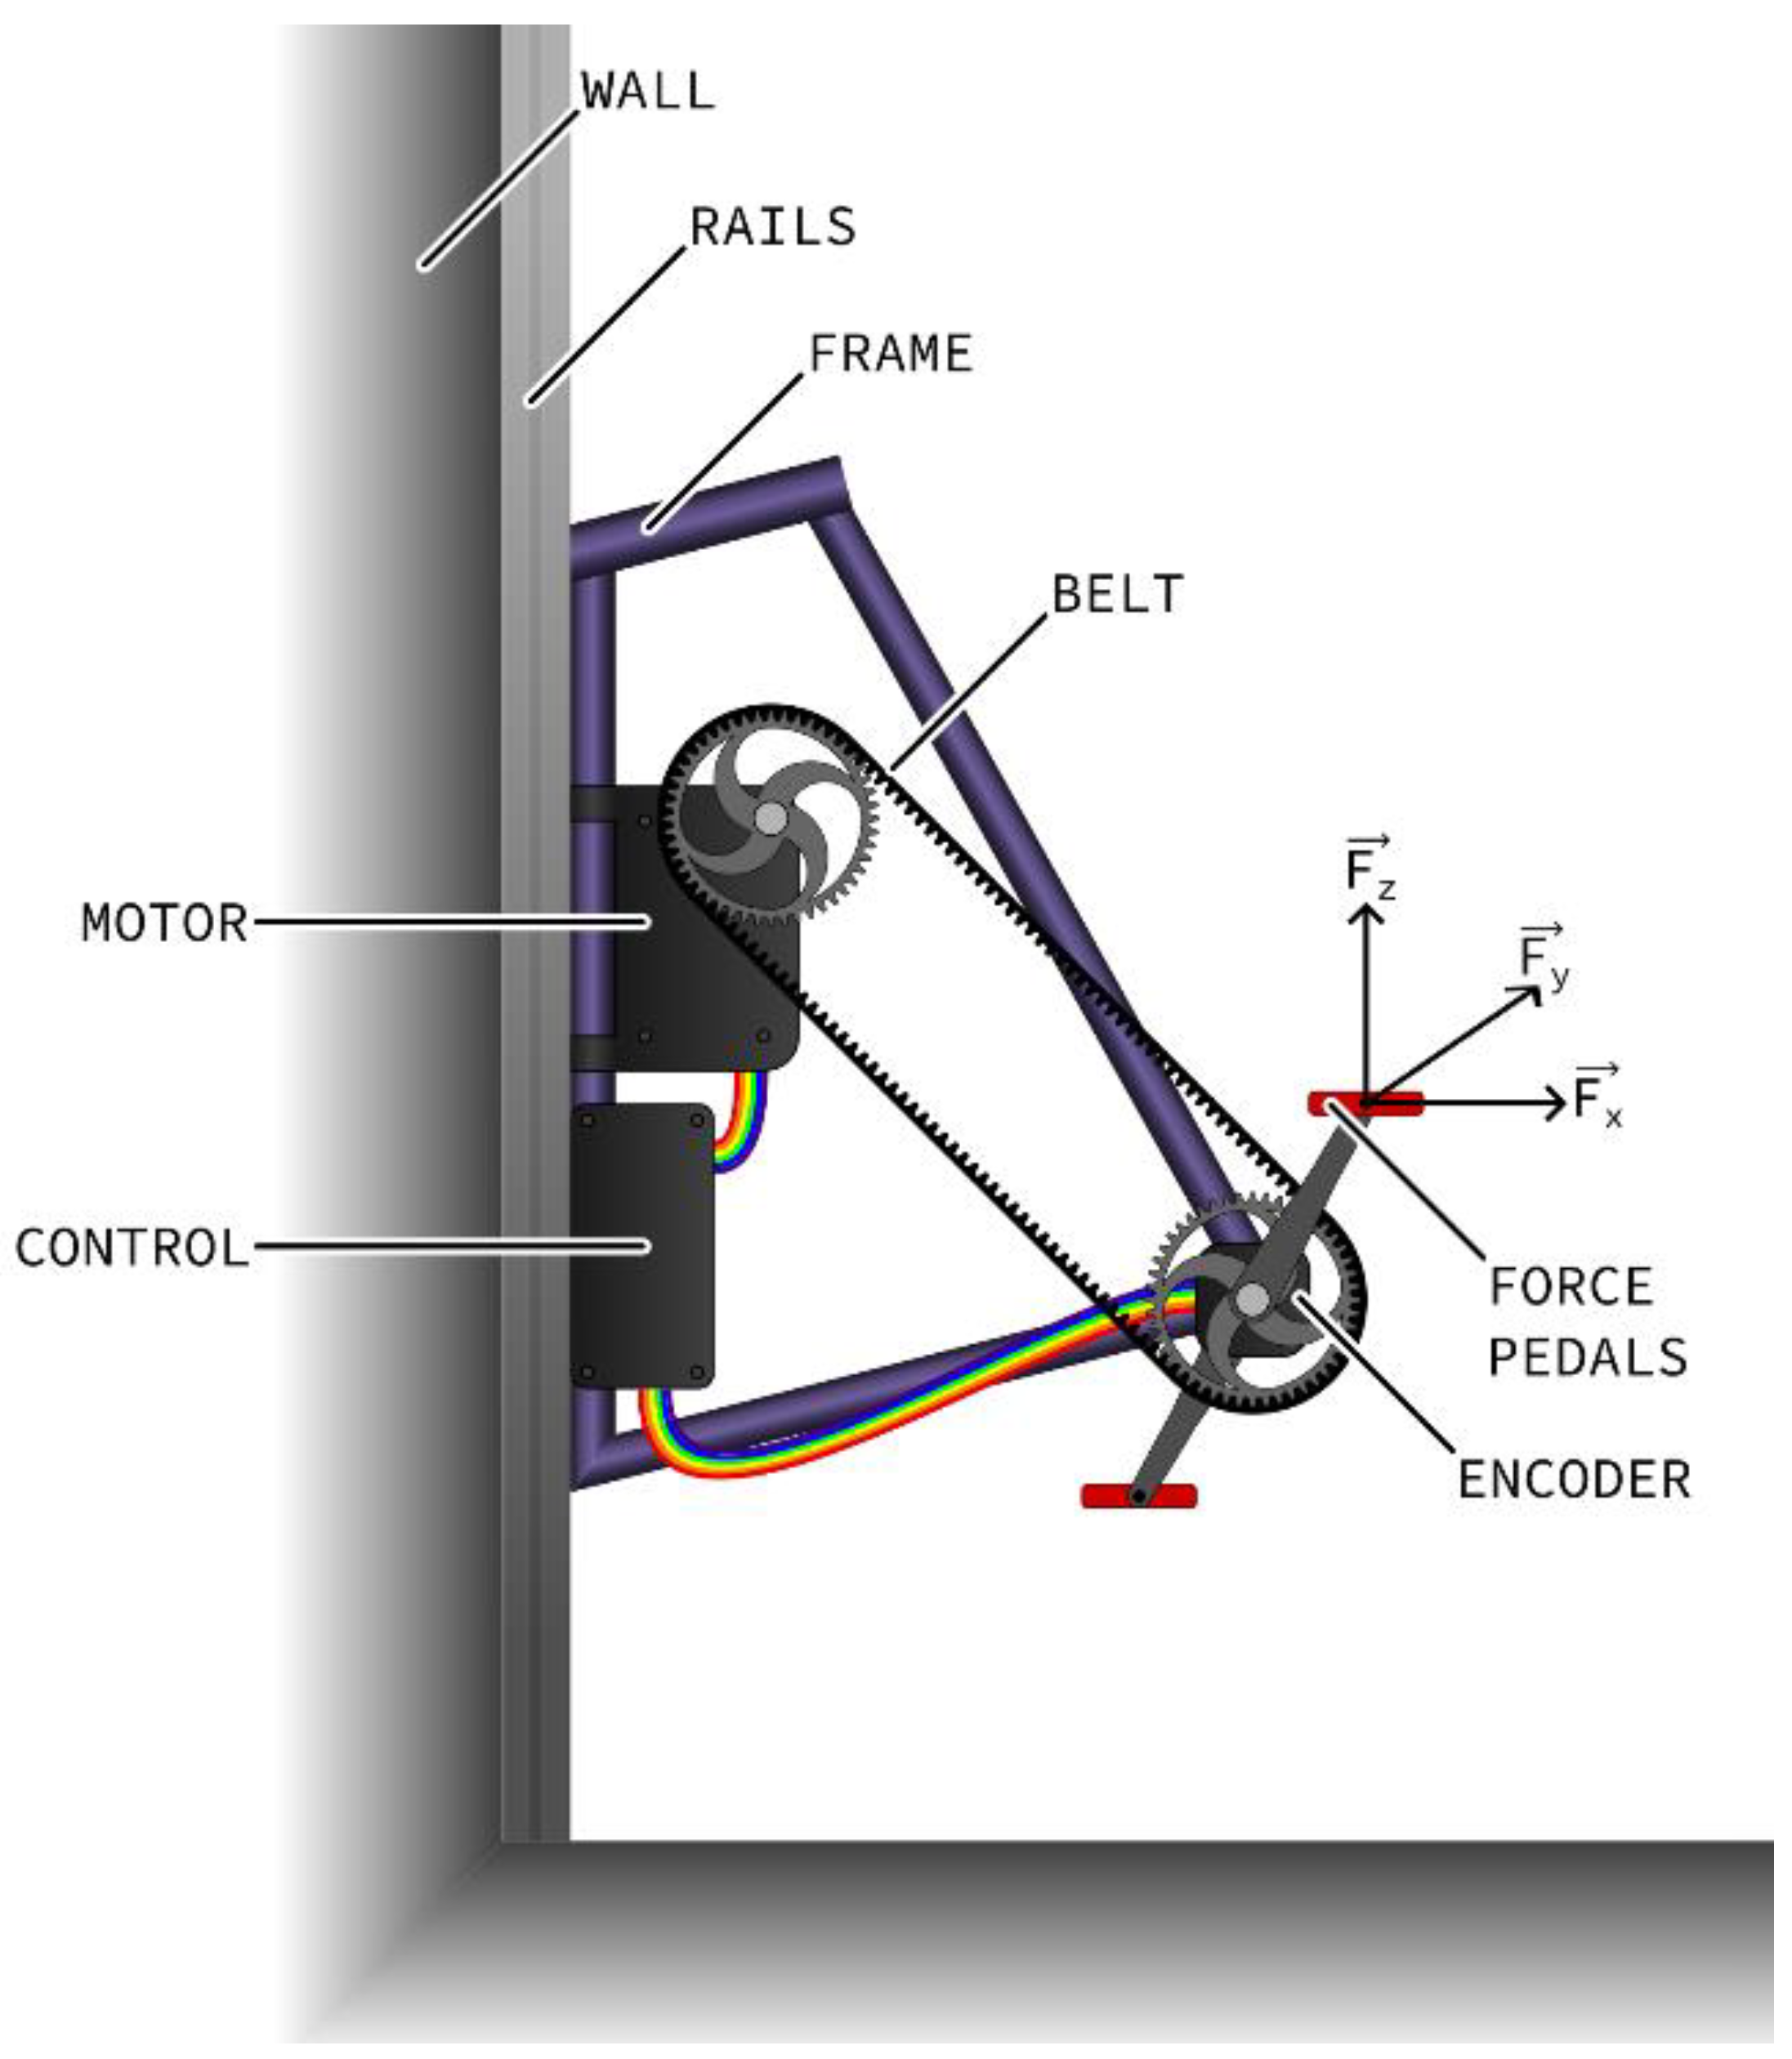
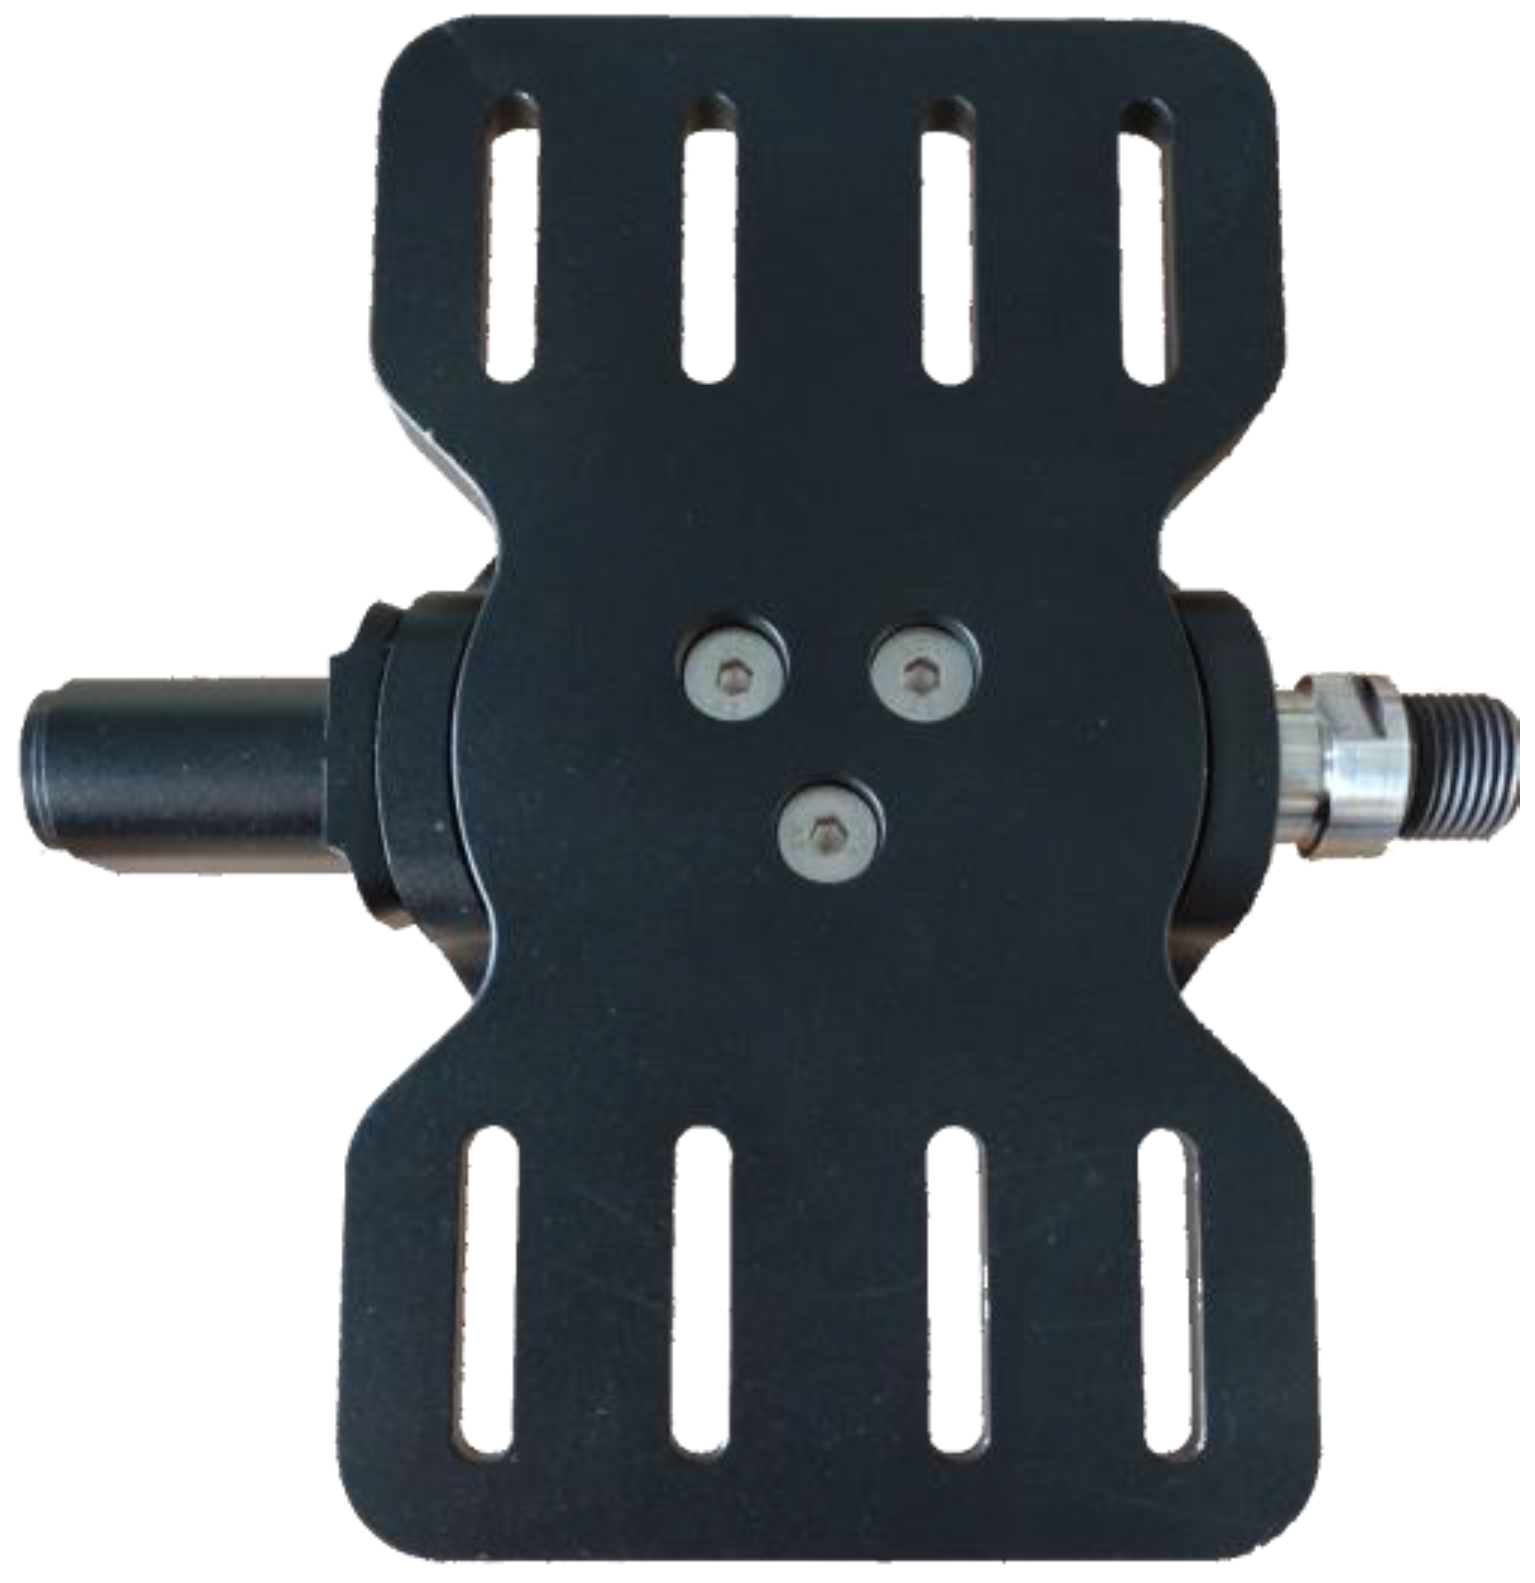
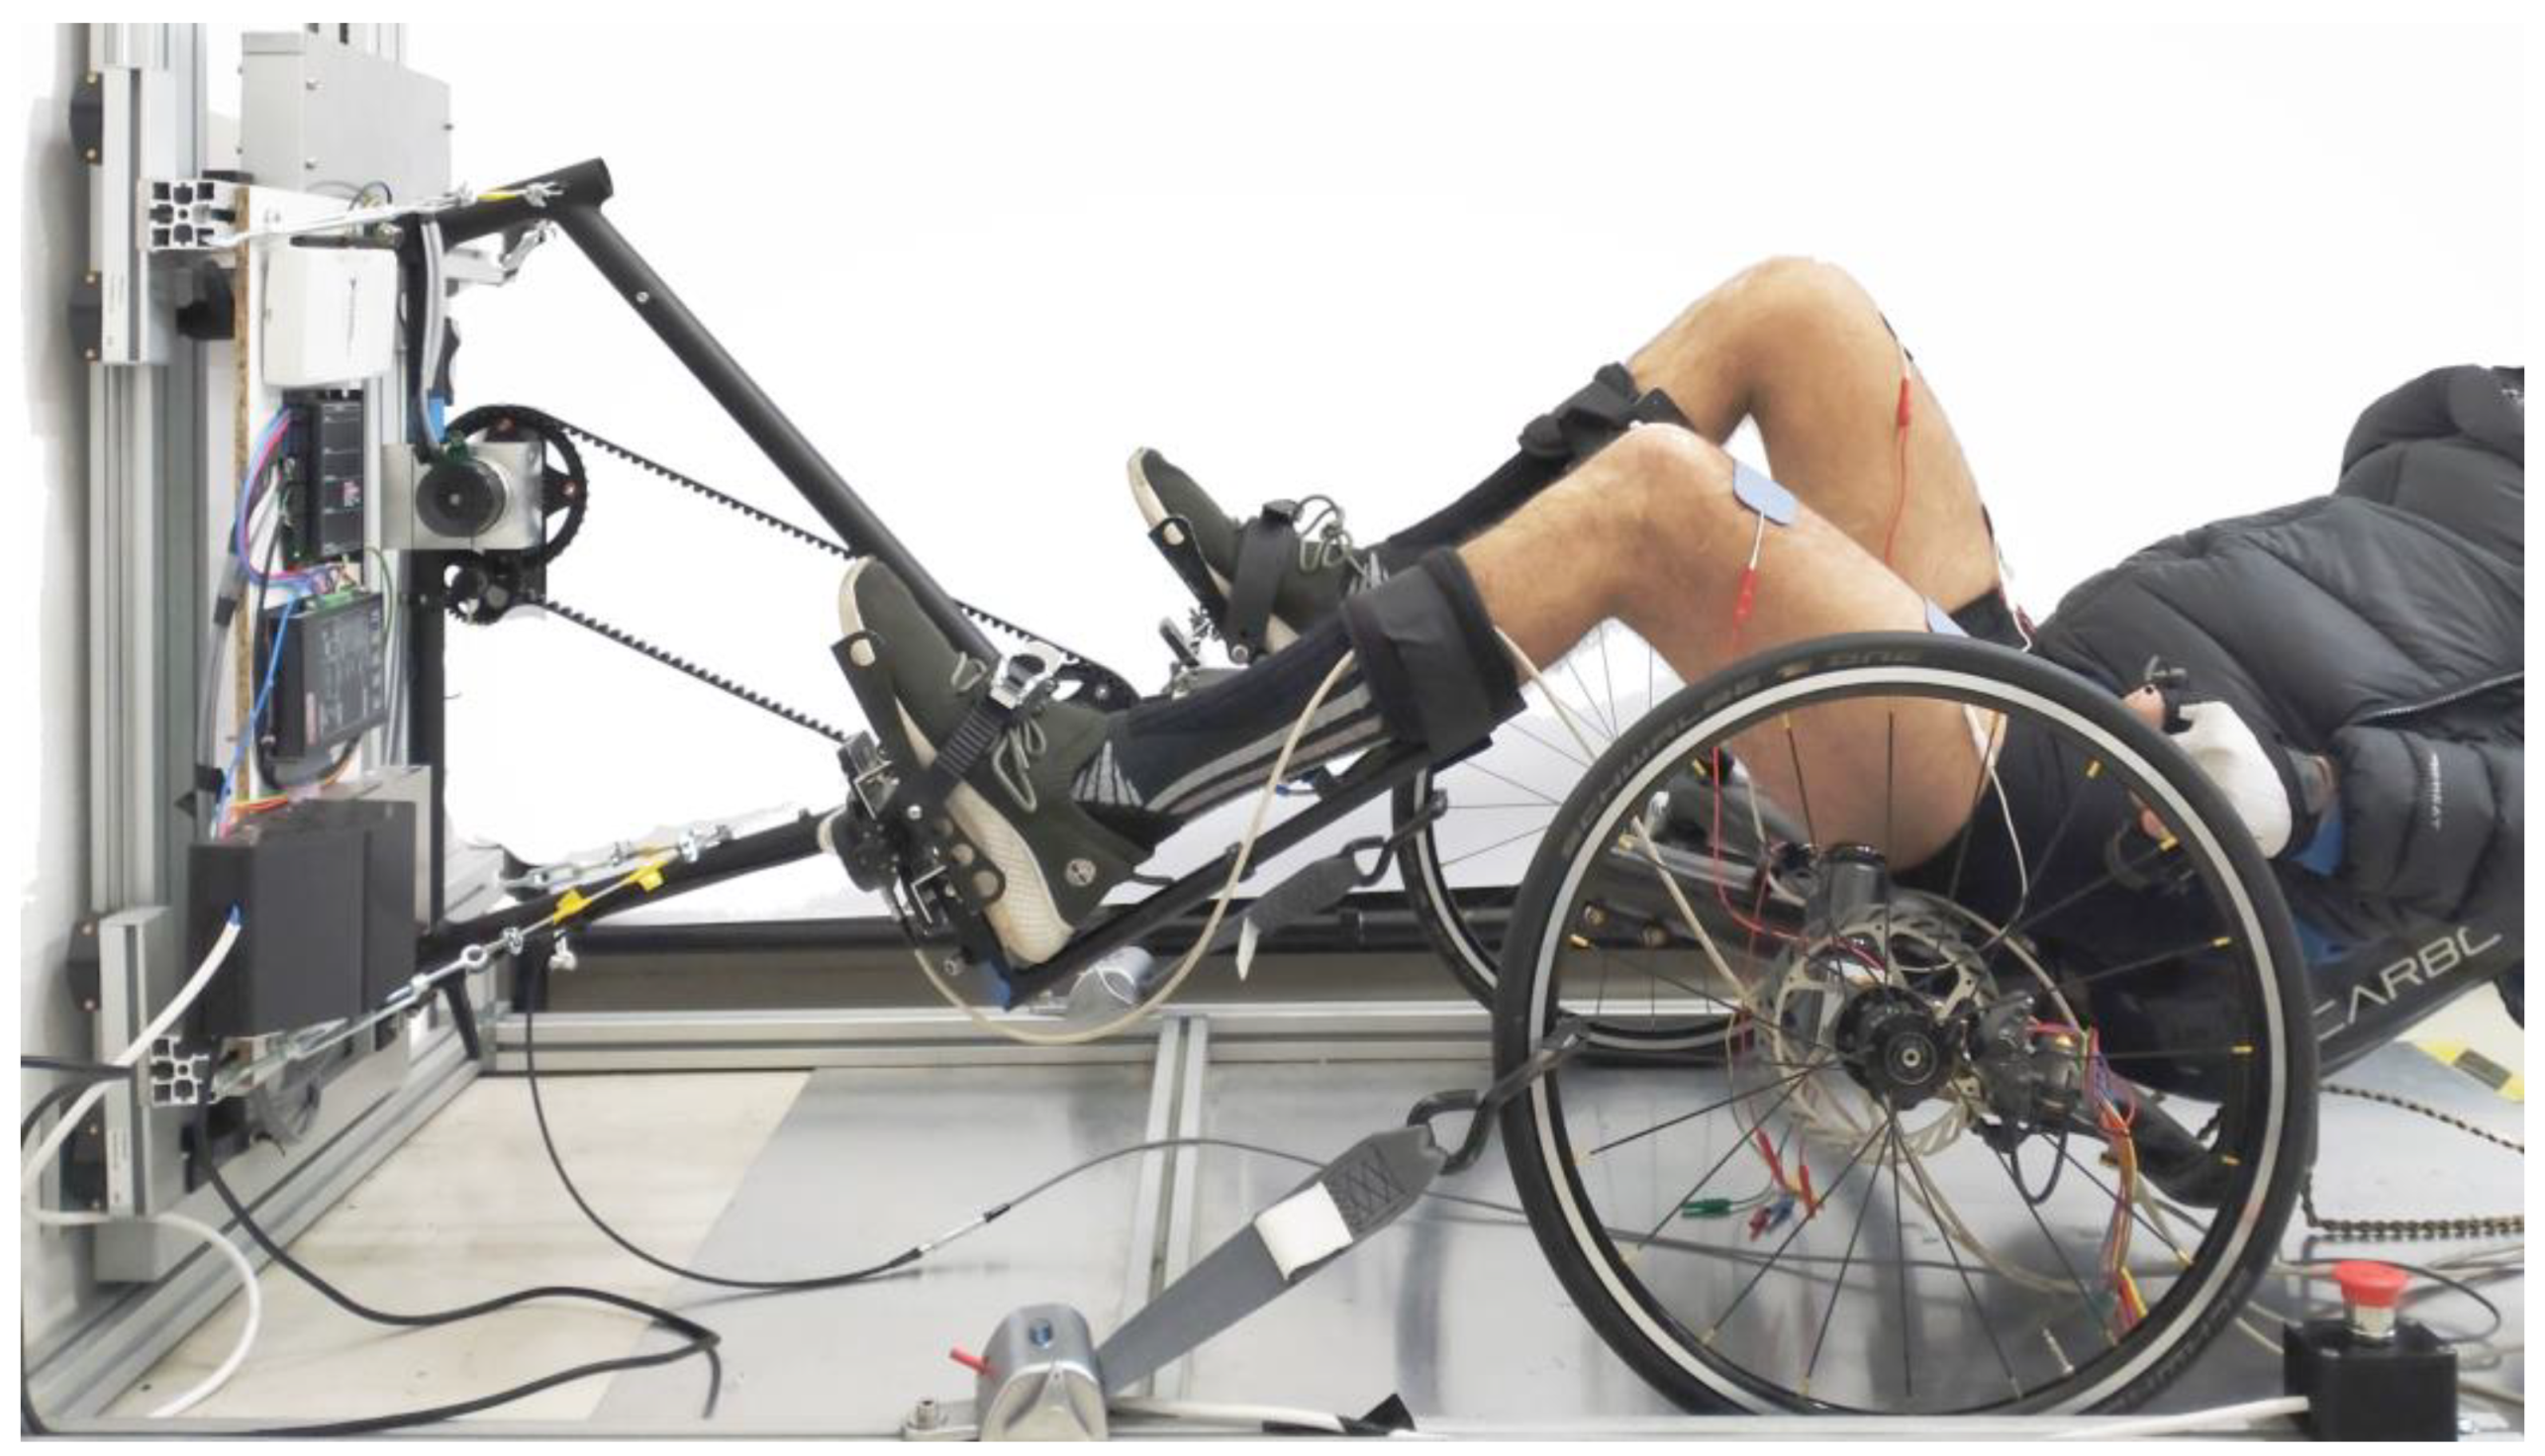
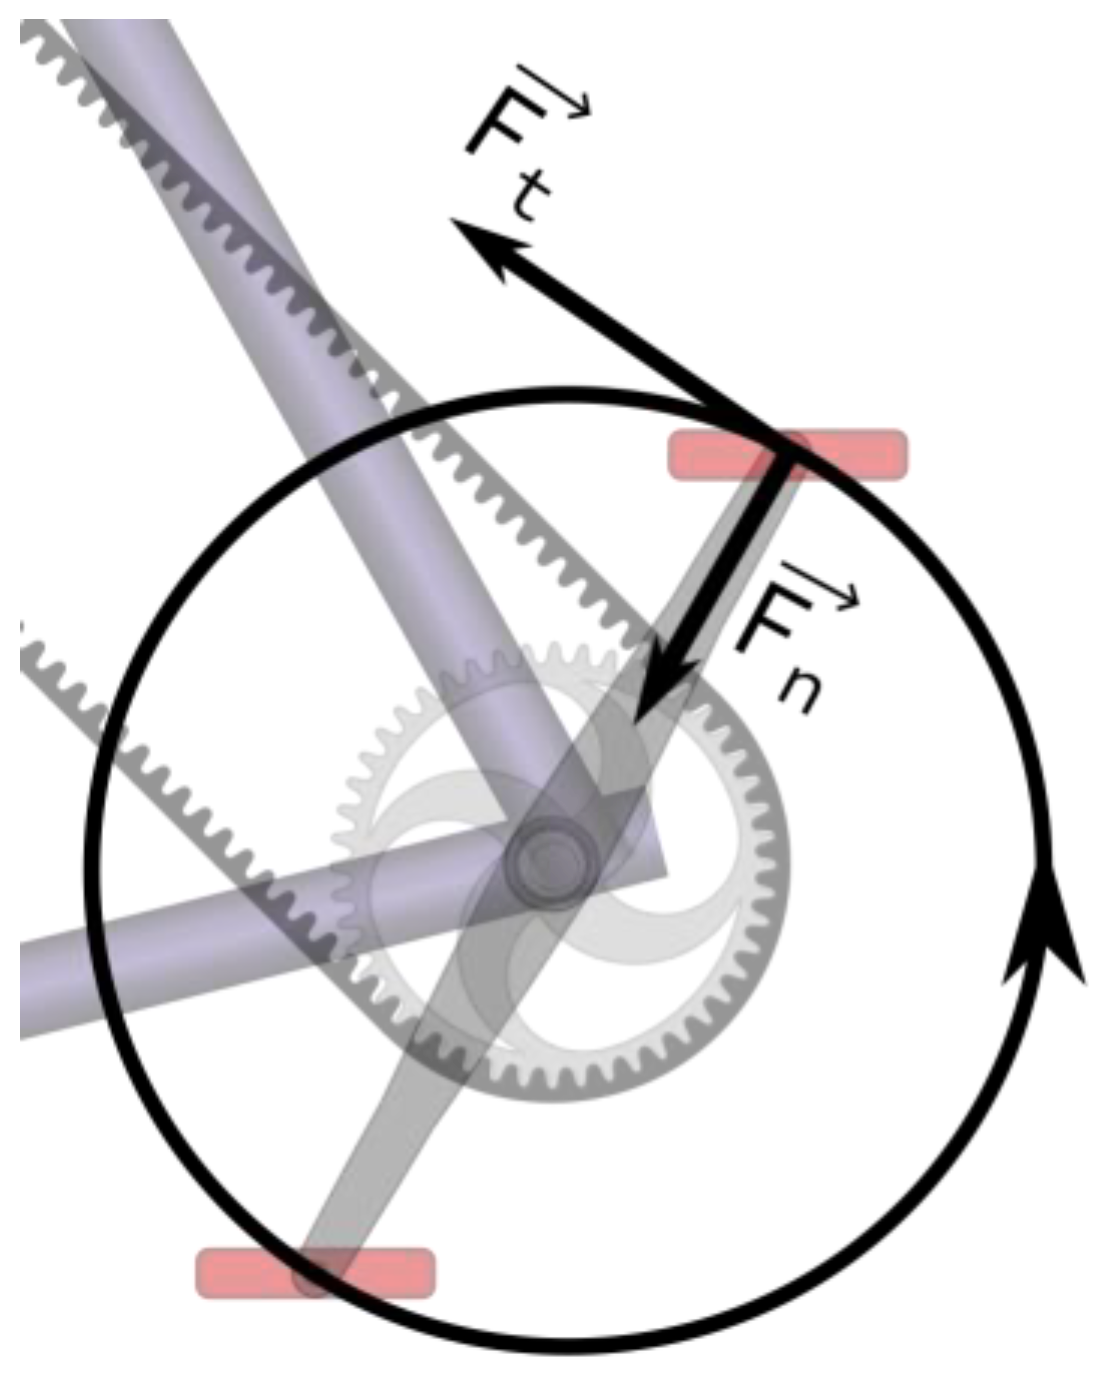
2.1. Description of the Equipment
2.2. Determining Stimulation Patterns
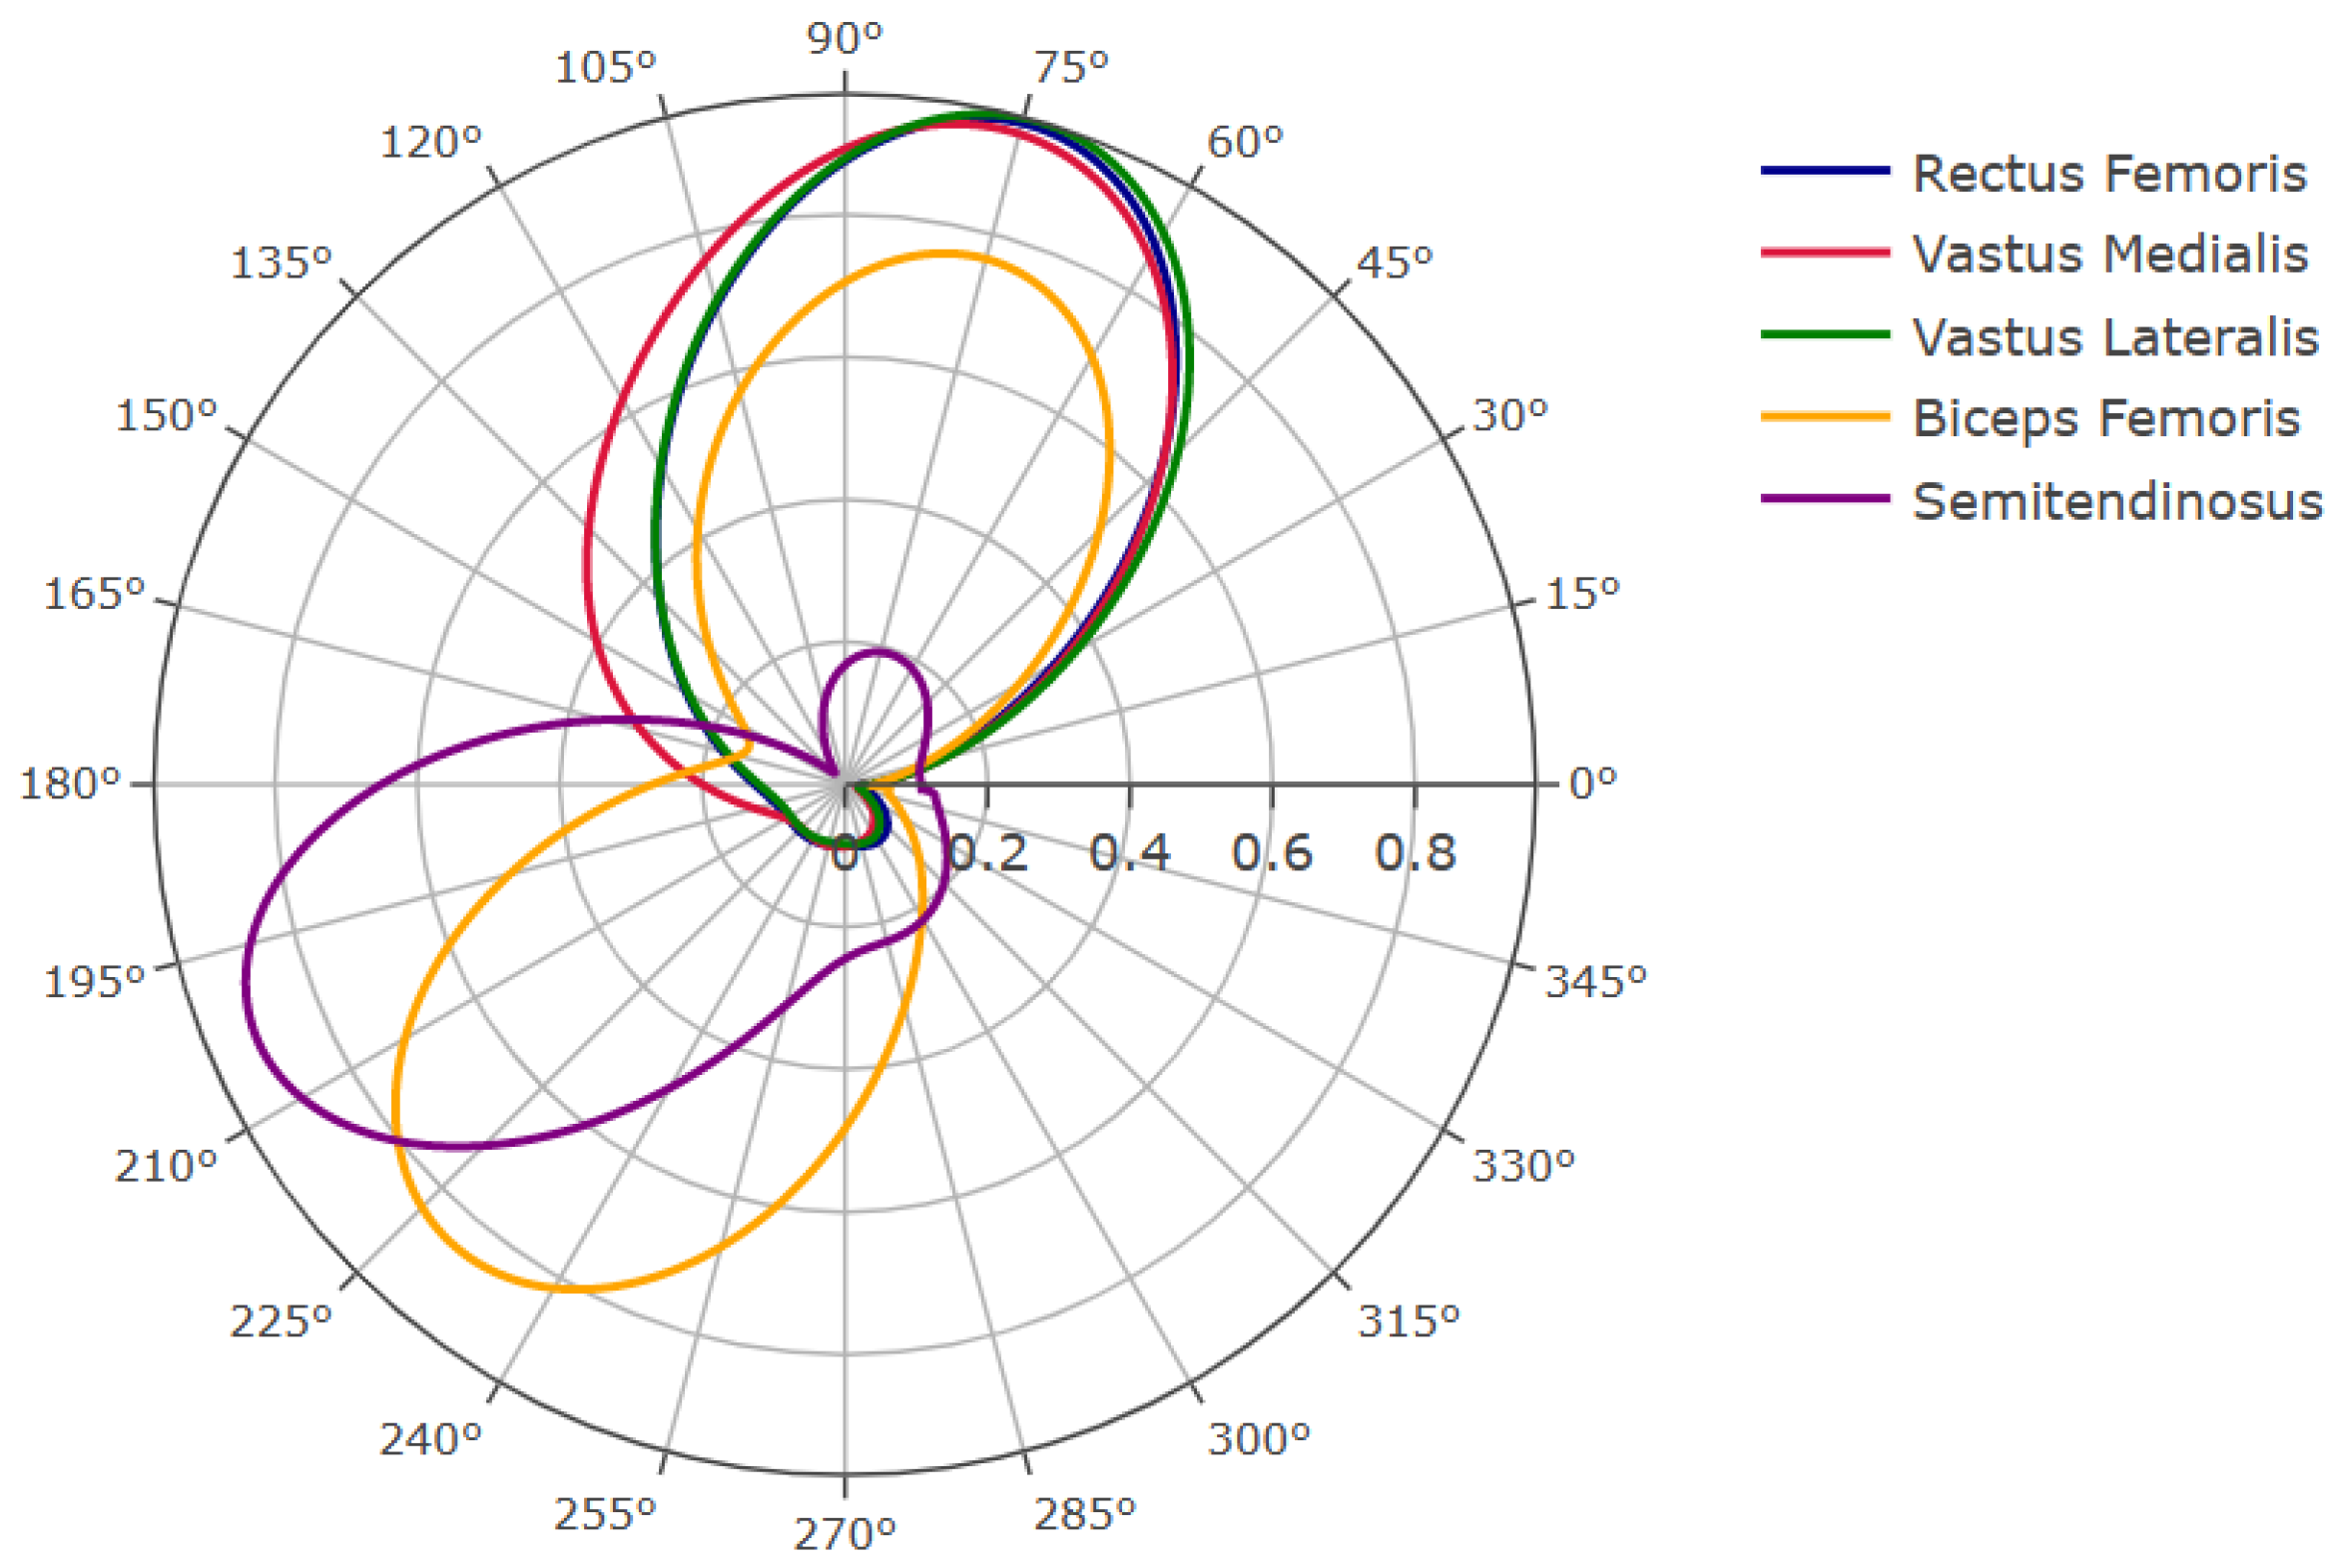
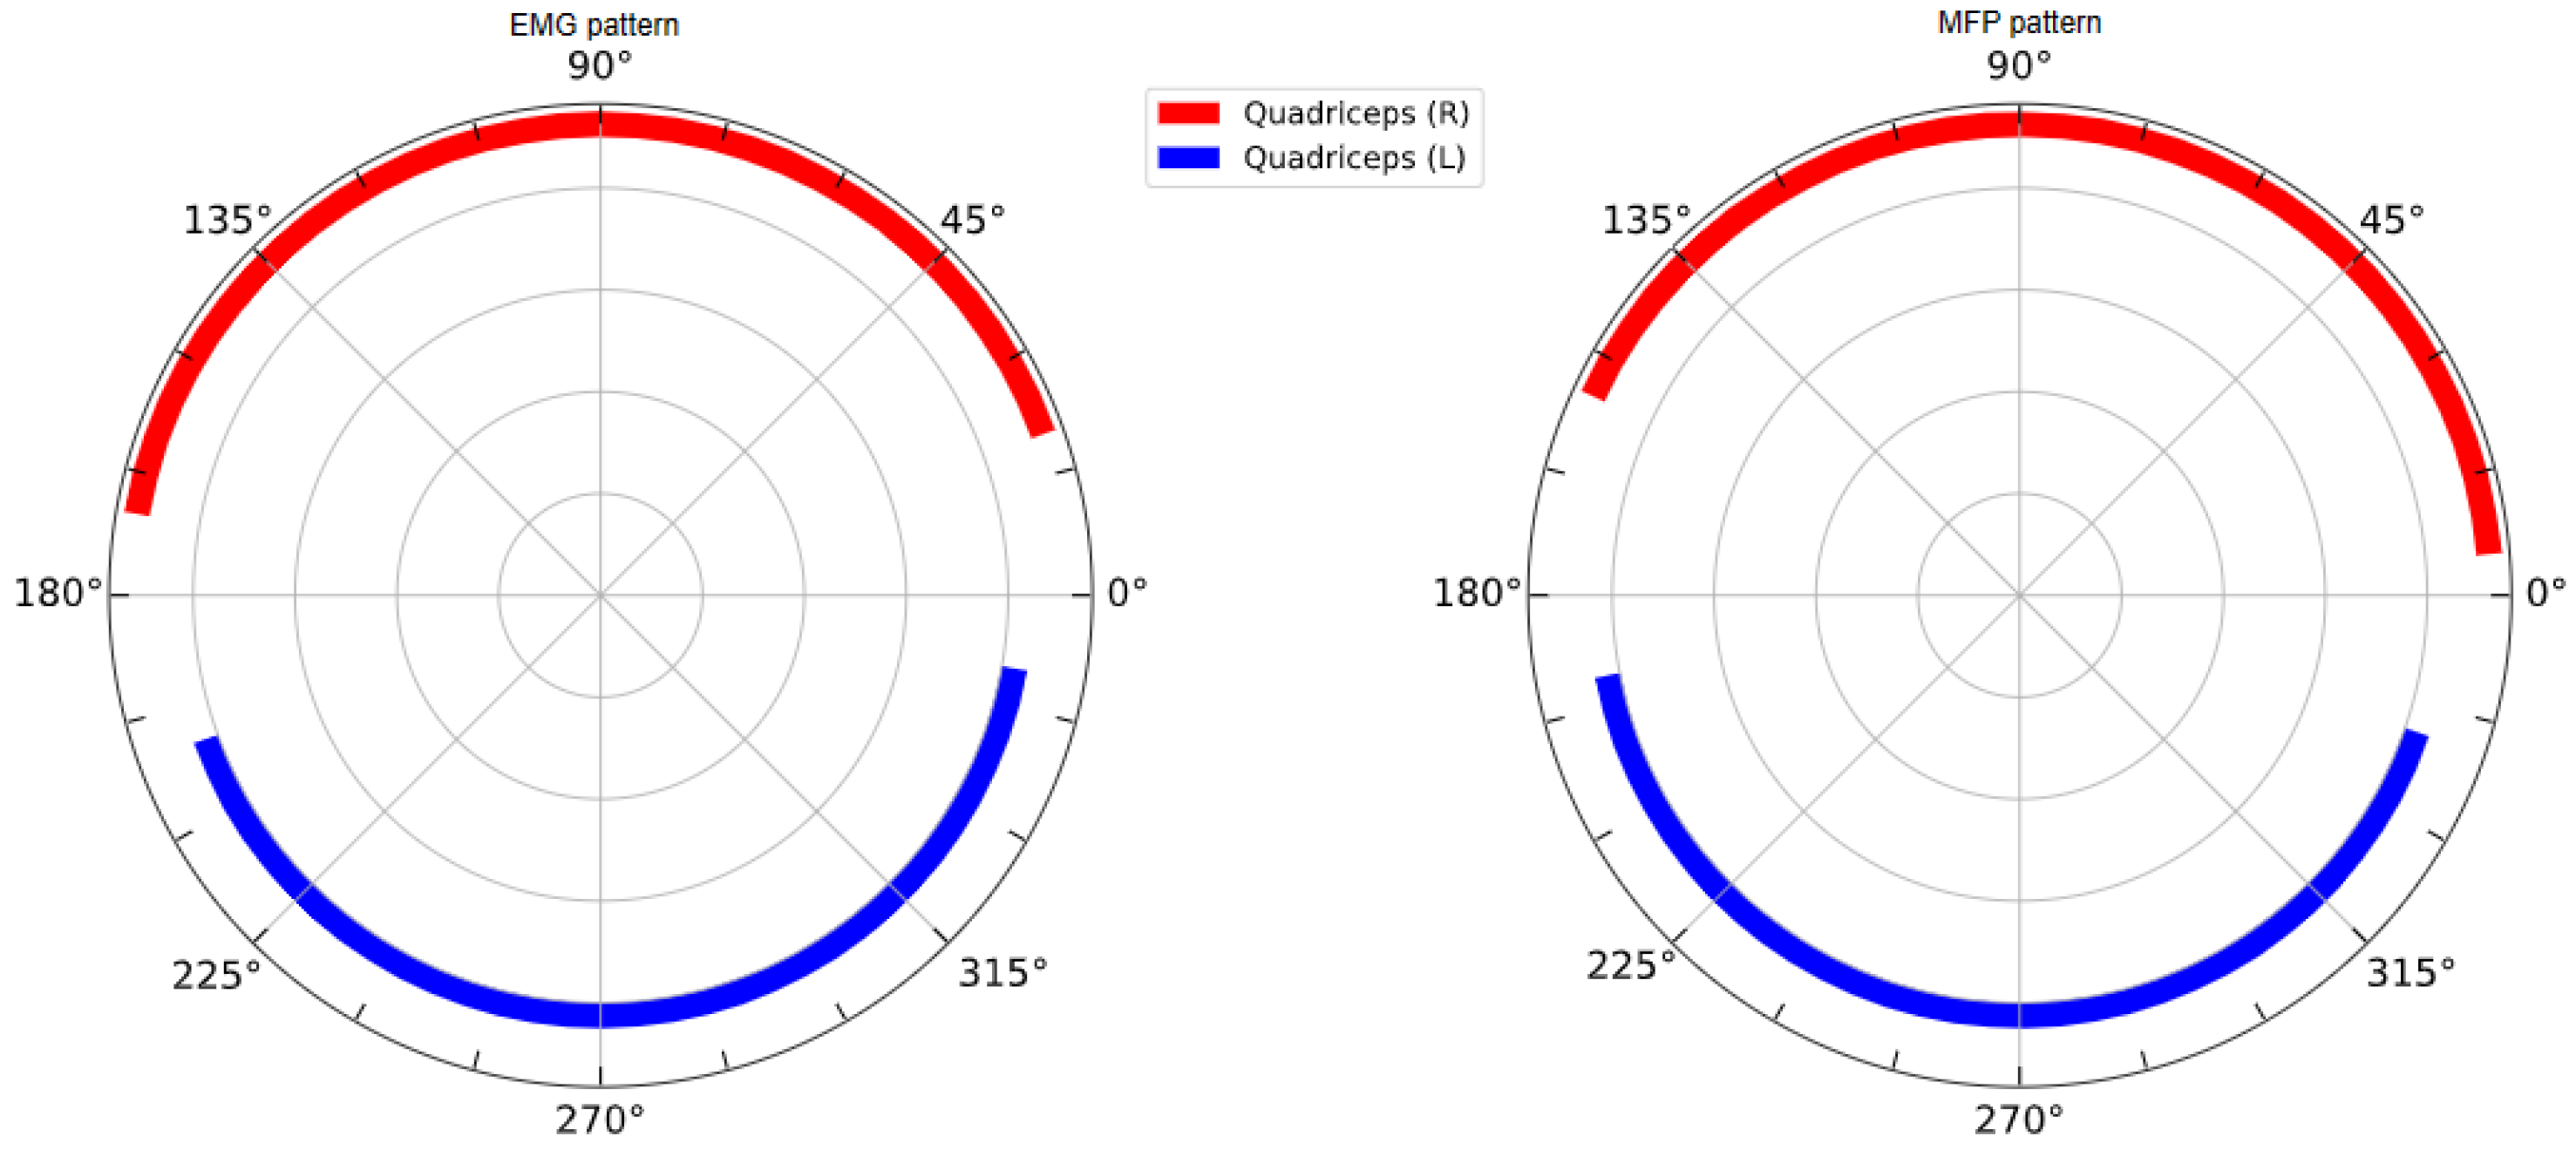
2.2.1. EMG Recording during Volitional Cycling
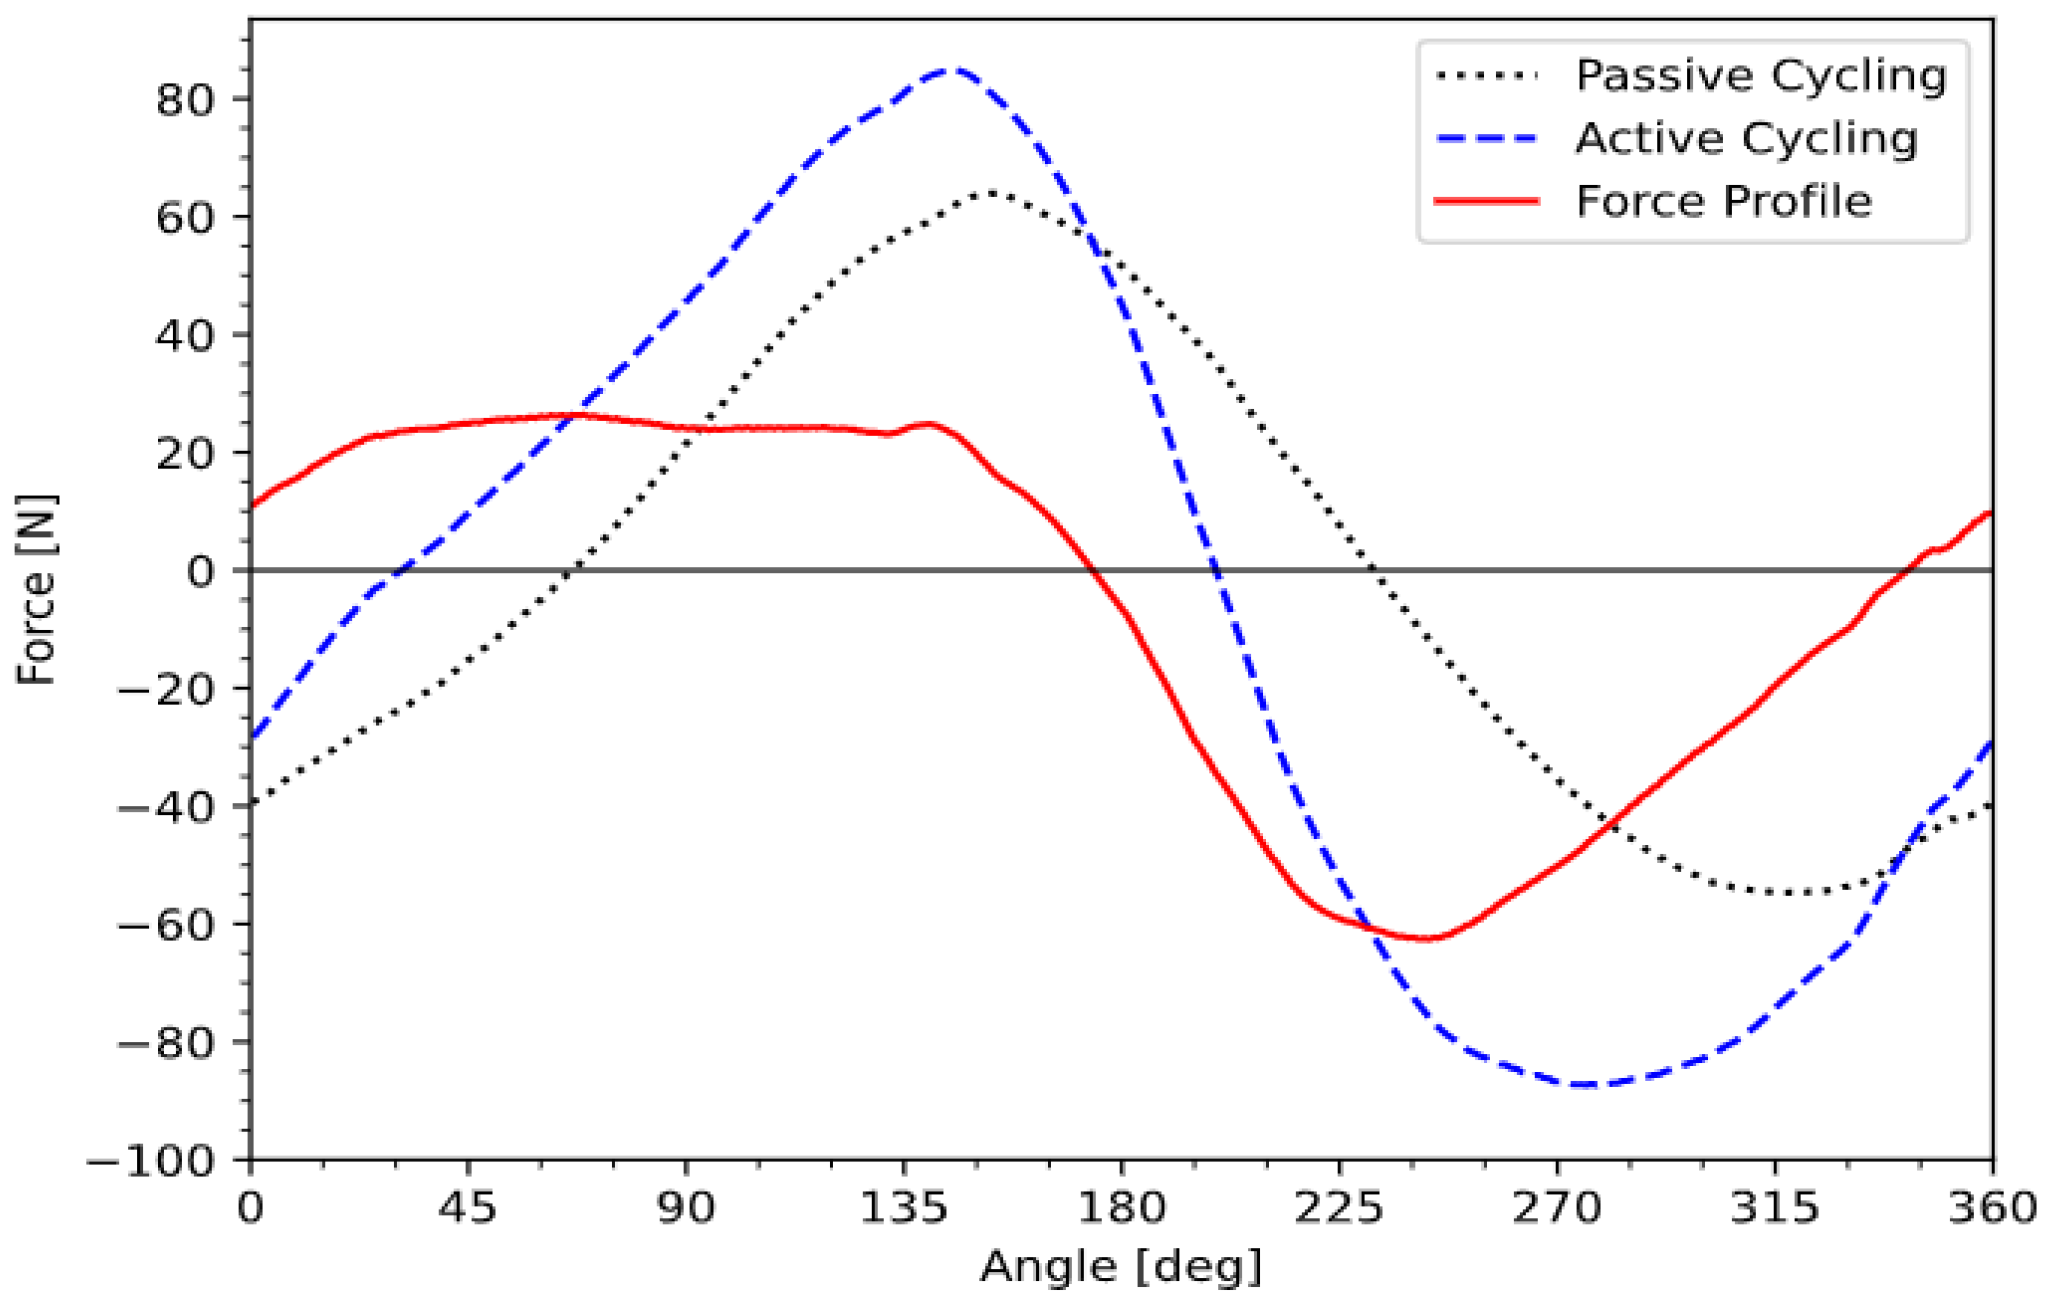
2.2.2. Recording Force Profiles of the Muscle during FES Cycling
2.2.3. Deriving Stimulation Patterns from EMG and MFP
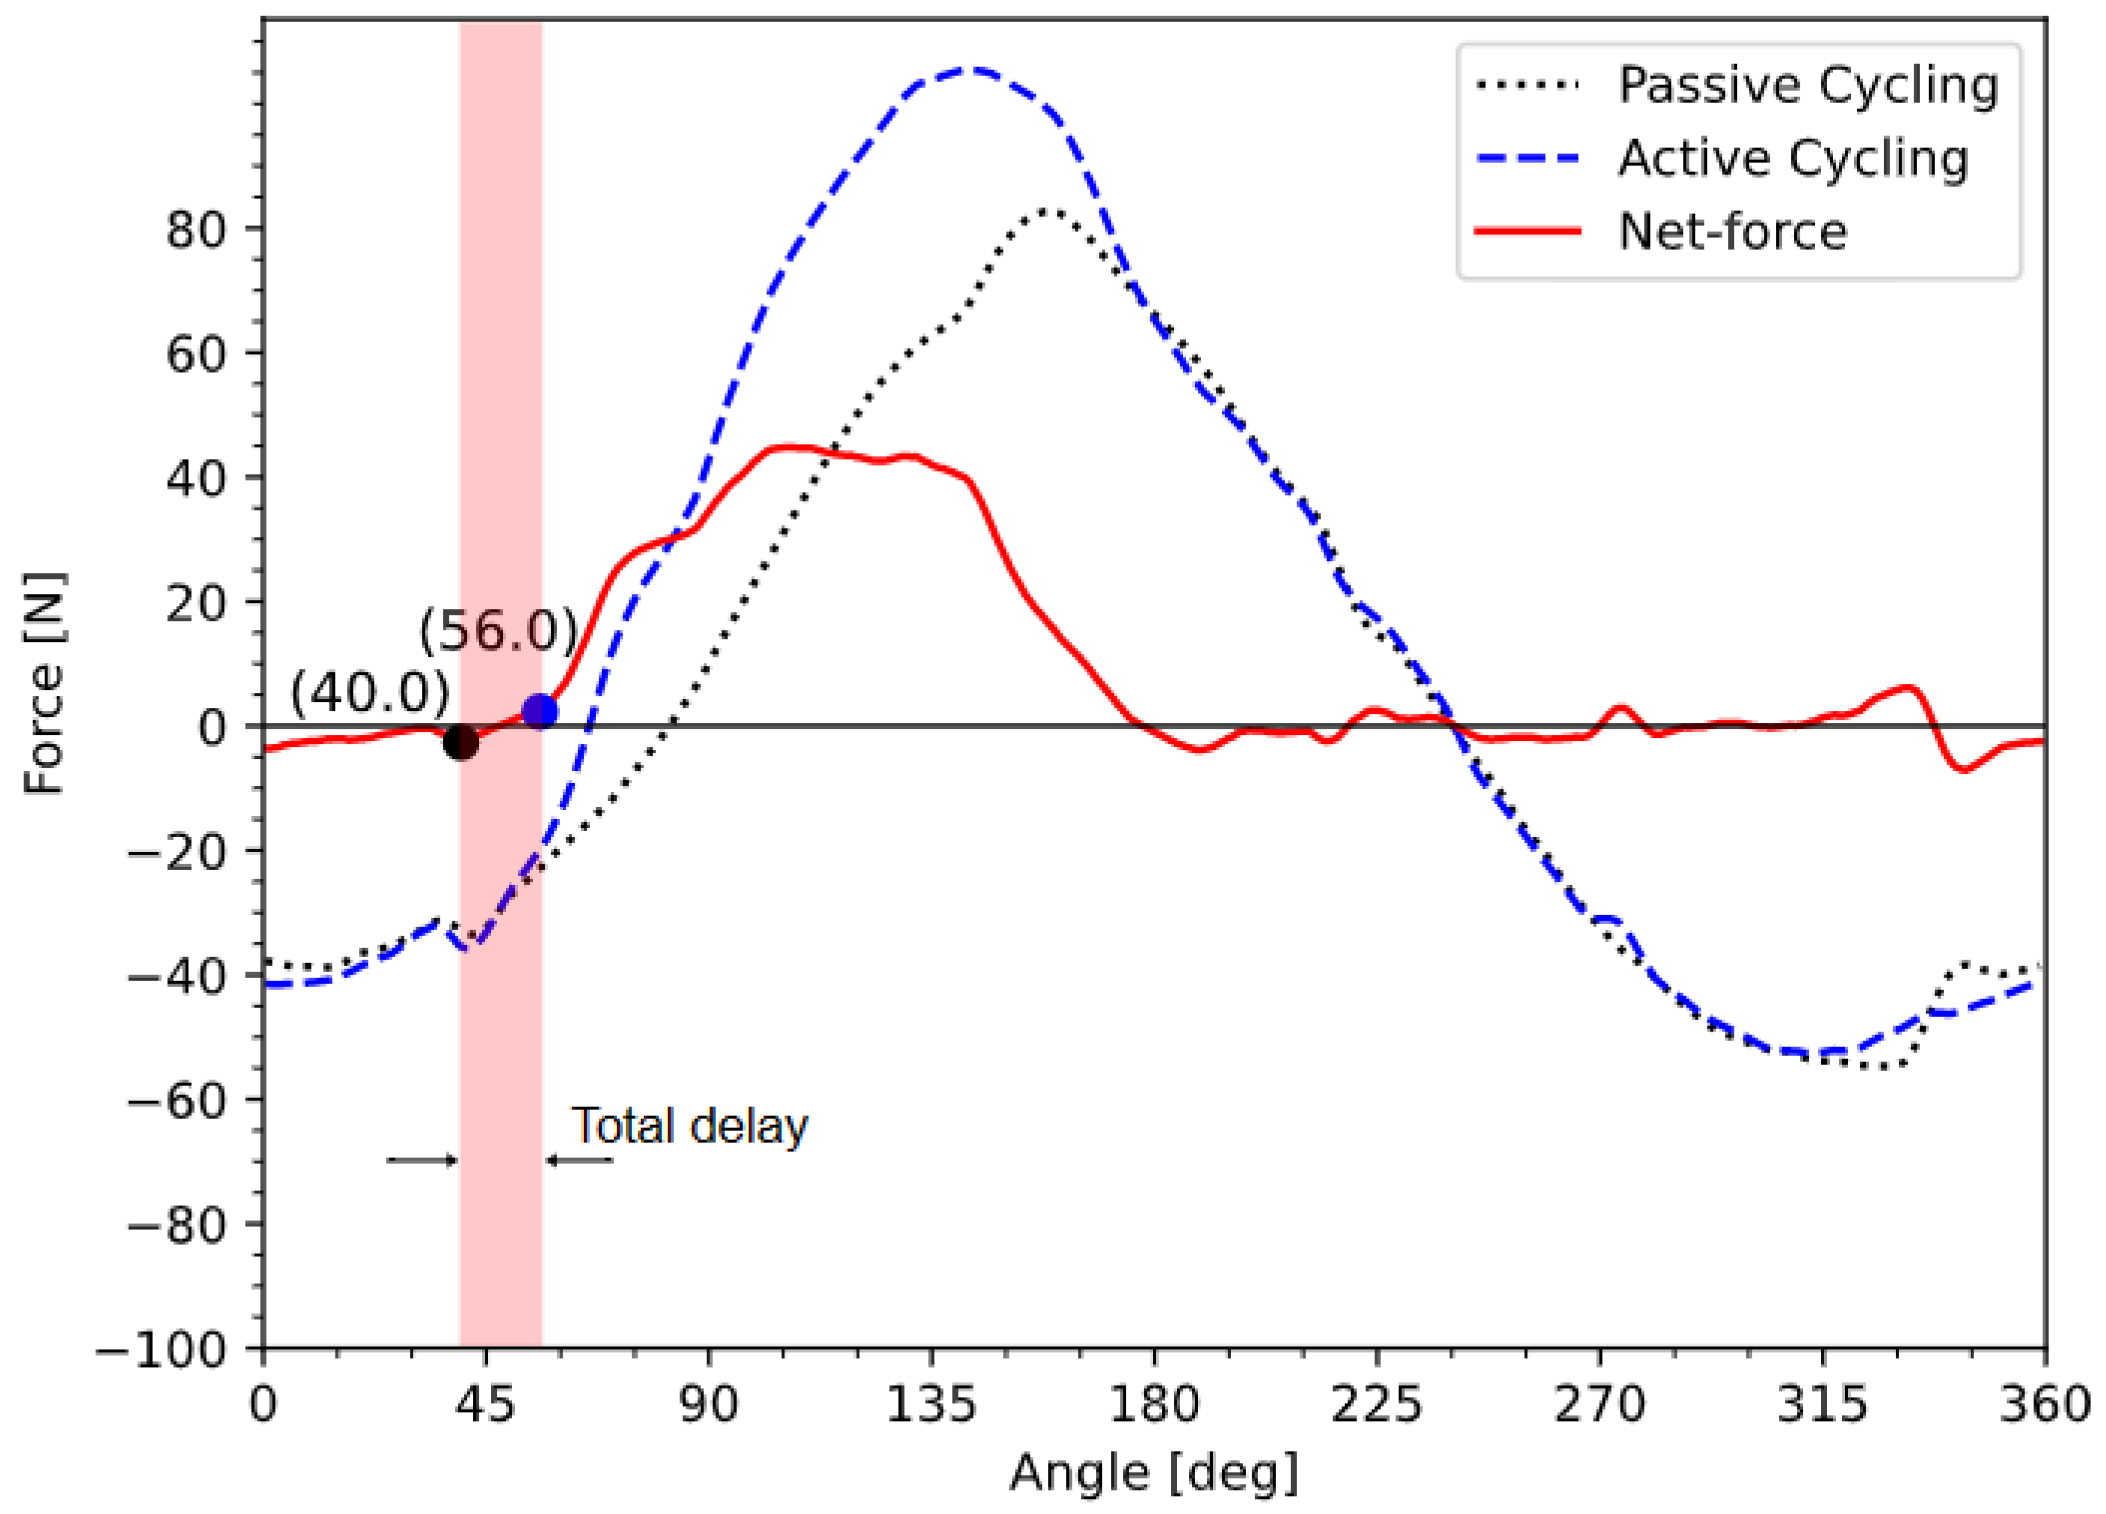
2.2.4. Delay Compensation
- The stimulator delay (DS) is the internal stimulator delay and represents the time from the moment when the stimulator receives the command to generate a pulse, to the moment the generated pulse arrives to the electrode placed on the skin.
- The delay caused by the measuring equipment is a product of the acquisition and processing of the crank angle data. It amounts to 1 ms, which, when cycling at 50 rpm, is equivalent to 0.3° of the crank angle. We will thus consider it insignificant.
- Muscle activation delay, also called electromechanical delay (EMD), is defined as the time it takes for the muscle to develop tension once the stimulation pulse reaches the motor nerve. Muscle delay is usually derived from literature, but it can also be measured.
2.2.5. Experimental Protocol
- determining the force profiles for each muscle of interest;
- measuring the total delay;
- cycling using the EMG pattern;
- cycling with the MFP pattern.
3. Results
4. Discussion
5. Conclusions
Author Contributions
Funding
Institutional Review Board Statement
Informed Consent Statement
Data Availability Statement
Acknowledgments
Conflicts of Interest
References
- List of Bicycle Types. Wikipedia 2022. Available online: https://en.wikipedia.org/wiki/List_of_bicycle_types (accessed on 17 March 2023).
- What Are the Different Types of Bicycles?—Bike LVR 2021. Available online: https://bikelvr.com/beginners/types-of-bicycles/ (accessed on 17 March 2023).
- Newham, D.J.; de N. Donaldson, N. FES Cycling. In Operative Neuromodulation: Volume 1: Functional Neuroprosthetic Surgery. An Introduction; Sakas, D.E., Simpson, B.A., Krames, E.S., Eds.; Springer: Vienna, Austria, 2007; pp. 395–402. ISBN 978-3-211-33079-1. [Google Scholar]
- Hunt, K.J.; Fang, J.; Saengsuwan, J.; Grob, M.; Laubacher, M. On the Efficiency of FES Cycling: A Framework and Systematic Review. Technol. Health Care 2012, 20, 395–422. [Google Scholar] [CrossRef] [PubMed]
- Rushton, D.N. Functional Electrical Stimulation and Rehabilitation—An Hypothesis. Med. Eng. Phys. 2003, 25, 75–78. [Google Scholar] [CrossRef] [PubMed]
- Peckham, P.H.; Knutson, J.S. Functional Electrical Stimulation for Neuromuscular Applications. Annu. Rev. Biomed. Eng. 2005, 7, 327–360. [Google Scholar] [CrossRef] [PubMed]
- Popović, D.B. Advances in Functional Electrical Stimulation (FES). J. Electromyogr. Kinesiol. 2014, 24, 795–802. [Google Scholar] [CrossRef] [PubMed]
- Petrofsky, J.S.; Phillips, C.A.; Glaser, R.M.; Heaton, H.H., III. System and Method for Treating Paralyzed Persons. U.S. Patent No 4,499,900, 26 November 1985. [Google Scholar]
- Azevedo Coste, C.; Wolf, P. FES-Cycling at Cybathlon 2016: Overview on Teams and Results. Artif. Organs 2018, 42, 336–341. [Google Scholar] [CrossRef]
- Riener, R. The Cybathlon Promotes the Development of Assistive Technology for People with Physical Disabilities. J. NeuroEngineering Rehabil. 2016, 13, 49. [Google Scholar] [CrossRef] [Green Version]
- Lyon Cyberdays. Available online: https://www.youtube.com/@antsasso5157/videos (accessed on 17 March 2023).
- Metani, A.; Popović-Maneski, L.; Mateo, S.; Lemahieu, L.; Bergeron, V. Functional Electrical Stimulation Cycling Strategies Tested during Preparation for the First Cybathlon Competition—A Practical Report from Team ENS de Lyon. Eur. J. Transl. Myol. 2017, 27, 7110. [Google Scholar] [CrossRef] [Green Version]
- Sijobert, B.; Le Guillou, R.; Fattal, C.; Azevedo Coste, C. FES-Induced Cycling in Complete SCI: A Simpler Control Method Based on Inertial Sensors. Sensors 2019, 19, 4268. [Google Scholar] [CrossRef] [Green Version]
- Le Guillou, R.; Schmoll, M.; Sijobert, B.; Lobato Borges, D.; Fachin-Martins, E.; Resende, H.; Pissard-Gibollet, R.; Fattal, C.; Azevedo Coste, C. A Novel Framework for Quantifying Accuracy and Precision of Event Detection Algorithms in FES-Cycling. Sensors 2021, 21, 4571. [Google Scholar] [CrossRef]
- Ambrosini, E.; Ferrante, S.; Schauer, T.; Ferrigno, G.; Molteni, F.; Pedrocchi, A. An Automatic Identification Procedure to Promote the Use of FES-Cycling Training for Hemiparetic Patients. J. Healthc. Eng. 1900, 5, 163457. [Google Scholar] [CrossRef] [Green Version]
- Popović Maneski, L.; Metani, A. FES Cycling in Persons with Paralyzed Legs: Force Feedback for Setup and Control. In Proceeding of the 13th Vienna FES Workshop, Vienna, Austria, 23–25 September 2019. [Google Scholar]
- Schmoll, M.; Le Guillou, R.; Fattal, C.; Coste, C.A. OIDA: An Optimal Interval Detection Algorithm for Automatized Determination of Stimulation Patterns for FES-Cycling in Individuals with SCI. J. NeuroEngineering Rehabil. 2022, 19, 39. [Google Scholar] [CrossRef] [PubMed]
- Fornusek, C.; Davis, G.M.; Sinclair, P.J.; Milthorpe, B. Development of an Isokinetic Functional Electrical Stimulation Cycle Ergometer. Neuromodulation 2004, 7, 56–64. [Google Scholar] [CrossRef] [PubMed]
- Baptista, S.; Moreira, C.C.; Pinheiro, D.M.; Pereira, R.; Carmona, G.; Freire, P.D.; Bastos, A.I.; Bo, P.L. User-Centered Design and Spatially-Distributed Sequential Electrical Stimulation in Cycling for Individuals with Paraplegia. J. NeuroEngineering Rehabil. 2022, 19, 45. [Google Scholar] [CrossRef] [PubMed]
- Hunt, K.; Stone, B.; Negard, N.-O.; Schauer, T.; Fraser, M.; Cathcart, A.; Ferrario, C.; Ward, S.; Grant, S. Grant Control Strategies for Integration of Electric Motor Assist and Functional Electrical Stimulation in Paraplegic Cycling: Utility for Exercise Testing and Mobile Cycling. IEEE Trans. Neural Syst. Rehabil. Eng. 2004, 12, 89–101. [Google Scholar] [CrossRef] [PubMed] [Green Version]
- Aksöz, E.A.; Laubacher, M.; Riener, R.; Hunt, K.J. Design of an Isokinetic Knee Dynamometer for Evaluation of Functional Electrical Stimulation Strategies. Med. Eng. Phys. 2019, 73, 100–106. [Google Scholar] [CrossRef] [PubMed]
- Popović-Maneski, L.; Mateo, S. MotiMove: Multi-Purpose Transcutaneous Functional Electrical Stimulator. Artif. Organs 2022, 46, 1970–1979. [Google Scholar] [CrossRef]
- Petrofsky, J.S. New Algorithm to Control a Cycle Ergometer Using Electrical Stimulation. Med. Biol. Eng. Comput. 2003, 41, 18–27. [Google Scholar] [CrossRef]
- Trumbower, R.; Faghri, P. Improving Pedal Power during Semireclined Leg Cycling. IEEE Eng. Med. Biol. Mag. Q. Mag. Eng. Med. Biol. Soc. 2004, 23, 62–71. [Google Scholar] [CrossRef]
- Hermens, H.J.; Freriks, B.; Disselhorst-Klug, C.; Rau, G. Development of Recommendations for SEMG Sensors and Sensor Placement Procedures. J. Electromyogr. Kinesiol. 2000, 10, 361–374. [Google Scholar] [CrossRef]
- Downey, R.J.; Merad, M.; Gonzalez, E.J.; Dixon, W.E. Dixon The Time-Varying Nature of Electromechanical Delay and Muscle Control Effectiveness in Response to Stimulation-Induced Fatigue. IEEE Trans. Neural Syst. Rehabil. Eng. 2017, 25, 1397–1408. [Google Scholar] [CrossRef]
- Rampichini, S.; Cè, E.; Limonta, E.; Esposito, F. Effects of Fatigue on the Electromechanical Delay Components in Gastrocnemius Medialis Muscle. Eur. J. Appl. Physiol. 2014, 114, 639–651. [Google Scholar] [CrossRef] [PubMed]
- Zhou, S. Acute Effect of Repeated Maximal Isometric Contraction on Electromechanical Delay of Knee Extensor Muscle. J. Electromyogr. Kinesiol. 1996, 6, 117–127. [Google Scholar] [CrossRef] [PubMed]
- Laubacher, M.; Aksöz, E.A.; Bersch, I.; Hunt, K.J. The Road to Cybathlon 2016—Functional Electrical Stimulation Cycling Team IRPT/SPZ. Eur. J. Transl. Myol. 2017, 27, 7086. [Google Scholar] [CrossRef] [PubMed] [Green Version]


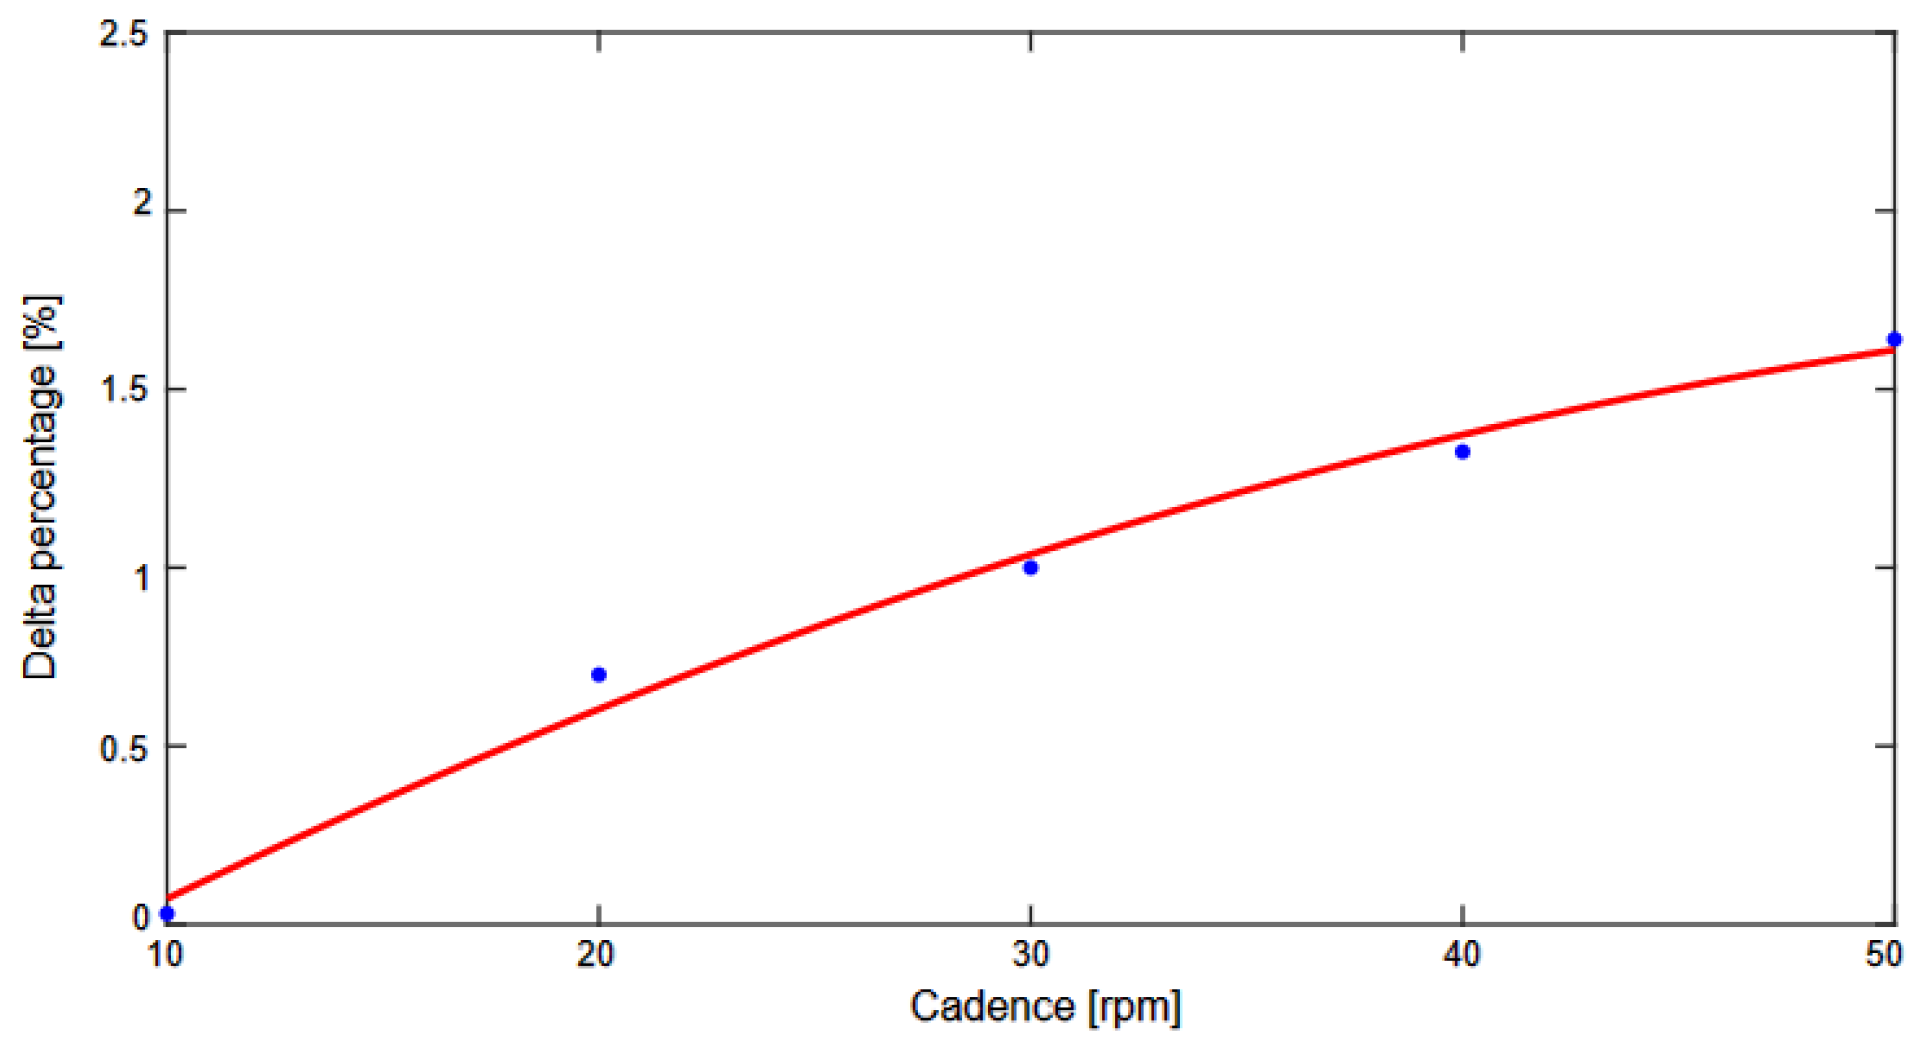
| Target Cadence [rpm] | Measured Cadence [rpm] | Delta Percentage [%] |
|---|---|---|
| 10 | 10.003 | 0.03 |
| 20 | 19.86 | 0.7 |
| 30 | 29.70 | 1 |
| 40 | 39.47 | 1.34 |
| 50 | 49.18 | 1.66 |
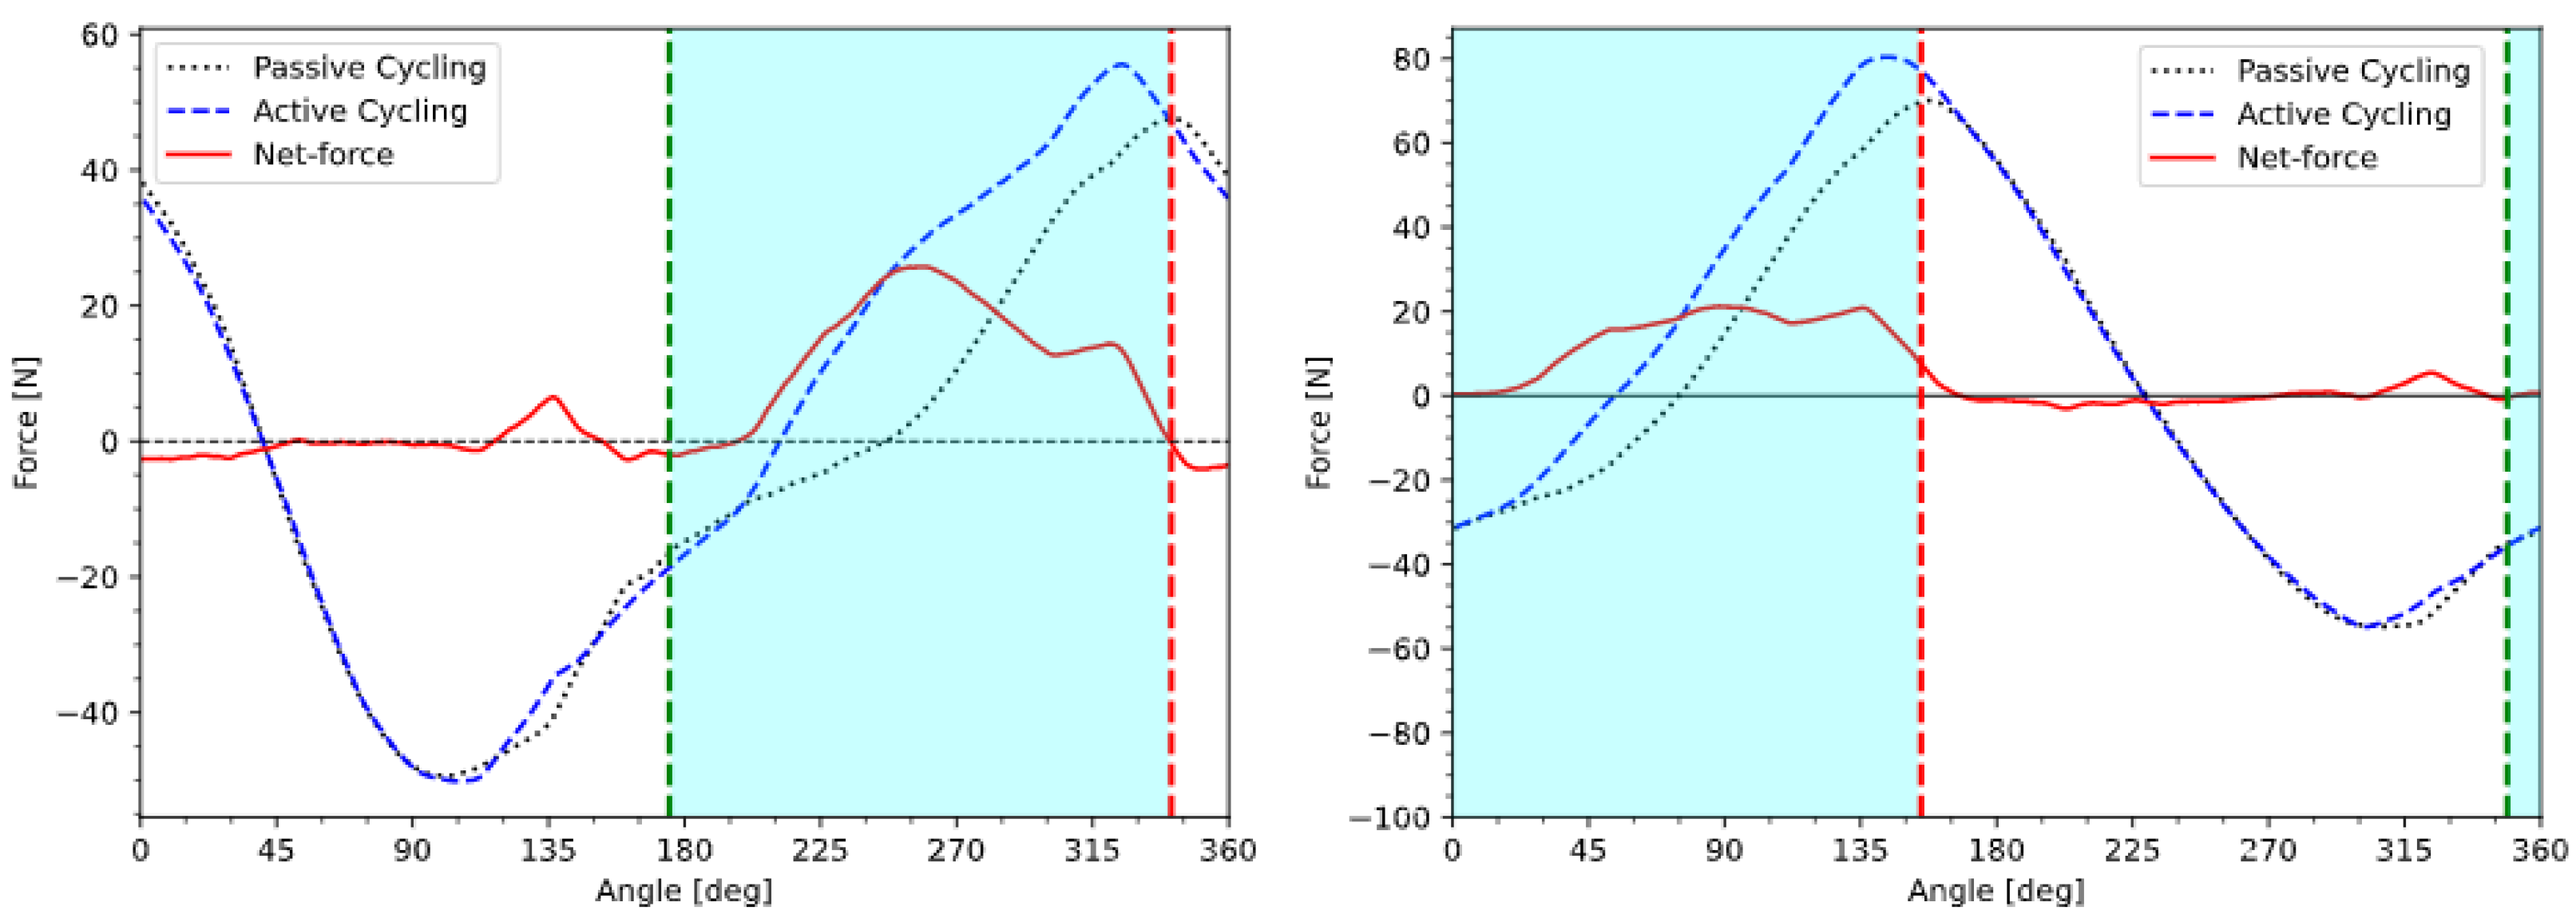
| Left Quadriceps | Right Quadriceps | ||||
|---|---|---|---|---|---|
| Start Angle [°] | Stop Angle [°] | Start Angle [°] | Stop Angle [°] | Power [W] | |
| EMG pattern | 184 | 350 | 4 | 170 | 8.8 |
| MFP pattern | 175 | 341 | 349 | 155 | 10.1 |
Disclaimer/Publisher’s Note: The statements, opinions and data contained in all publications are solely those of the individual author(s) and contributor(s) and not of MDPI and/or the editor(s). MDPI and/or the editor(s) disclaim responsibility for any injury to people or property resulting from any ideas, methods, instructions or products referred to in the content. |
© 2023 by the authors. Licensee MDPI, Basel, Switzerland. This article is an open access article distributed under the terms and conditions of the Creative Commons Attribution (CC BY) license (https://creativecommons.org/licenses/by/4.0/).
Share and Cite
Kajganic, P.; Bergeron, V.; Metani, A. ICEP: An Instrumented Cycling Ergometer Platform for the Assessment of Advanced FES Strategies. Sensors 2023, 23, 3522. https://doi.org/10.3390/s23073522
Kajganic P, Bergeron V, Metani A. ICEP: An Instrumented Cycling Ergometer Platform for the Assessment of Advanced FES Strategies. Sensors. 2023; 23(7):3522. https://doi.org/10.3390/s23073522
Chicago/Turabian StyleKajganic, Petar, Vance Bergeron, and Amine Metani. 2023. "ICEP: An Instrumented Cycling Ergometer Platform for the Assessment of Advanced FES Strategies" Sensors 23, no. 7: 3522. https://doi.org/10.3390/s23073522