
Recognition of Occluded Goods under Prior Inference Based on Generative Adversarial Network
 , ,
, ,
Abstract
:1. Introduction
2. Related Work
2.1. Conventional Recognizing Method
2.2. Recognizing Based on Feature Expansion Method
2.3. Recognizing Based on Fine-Grained Method
3. Methods
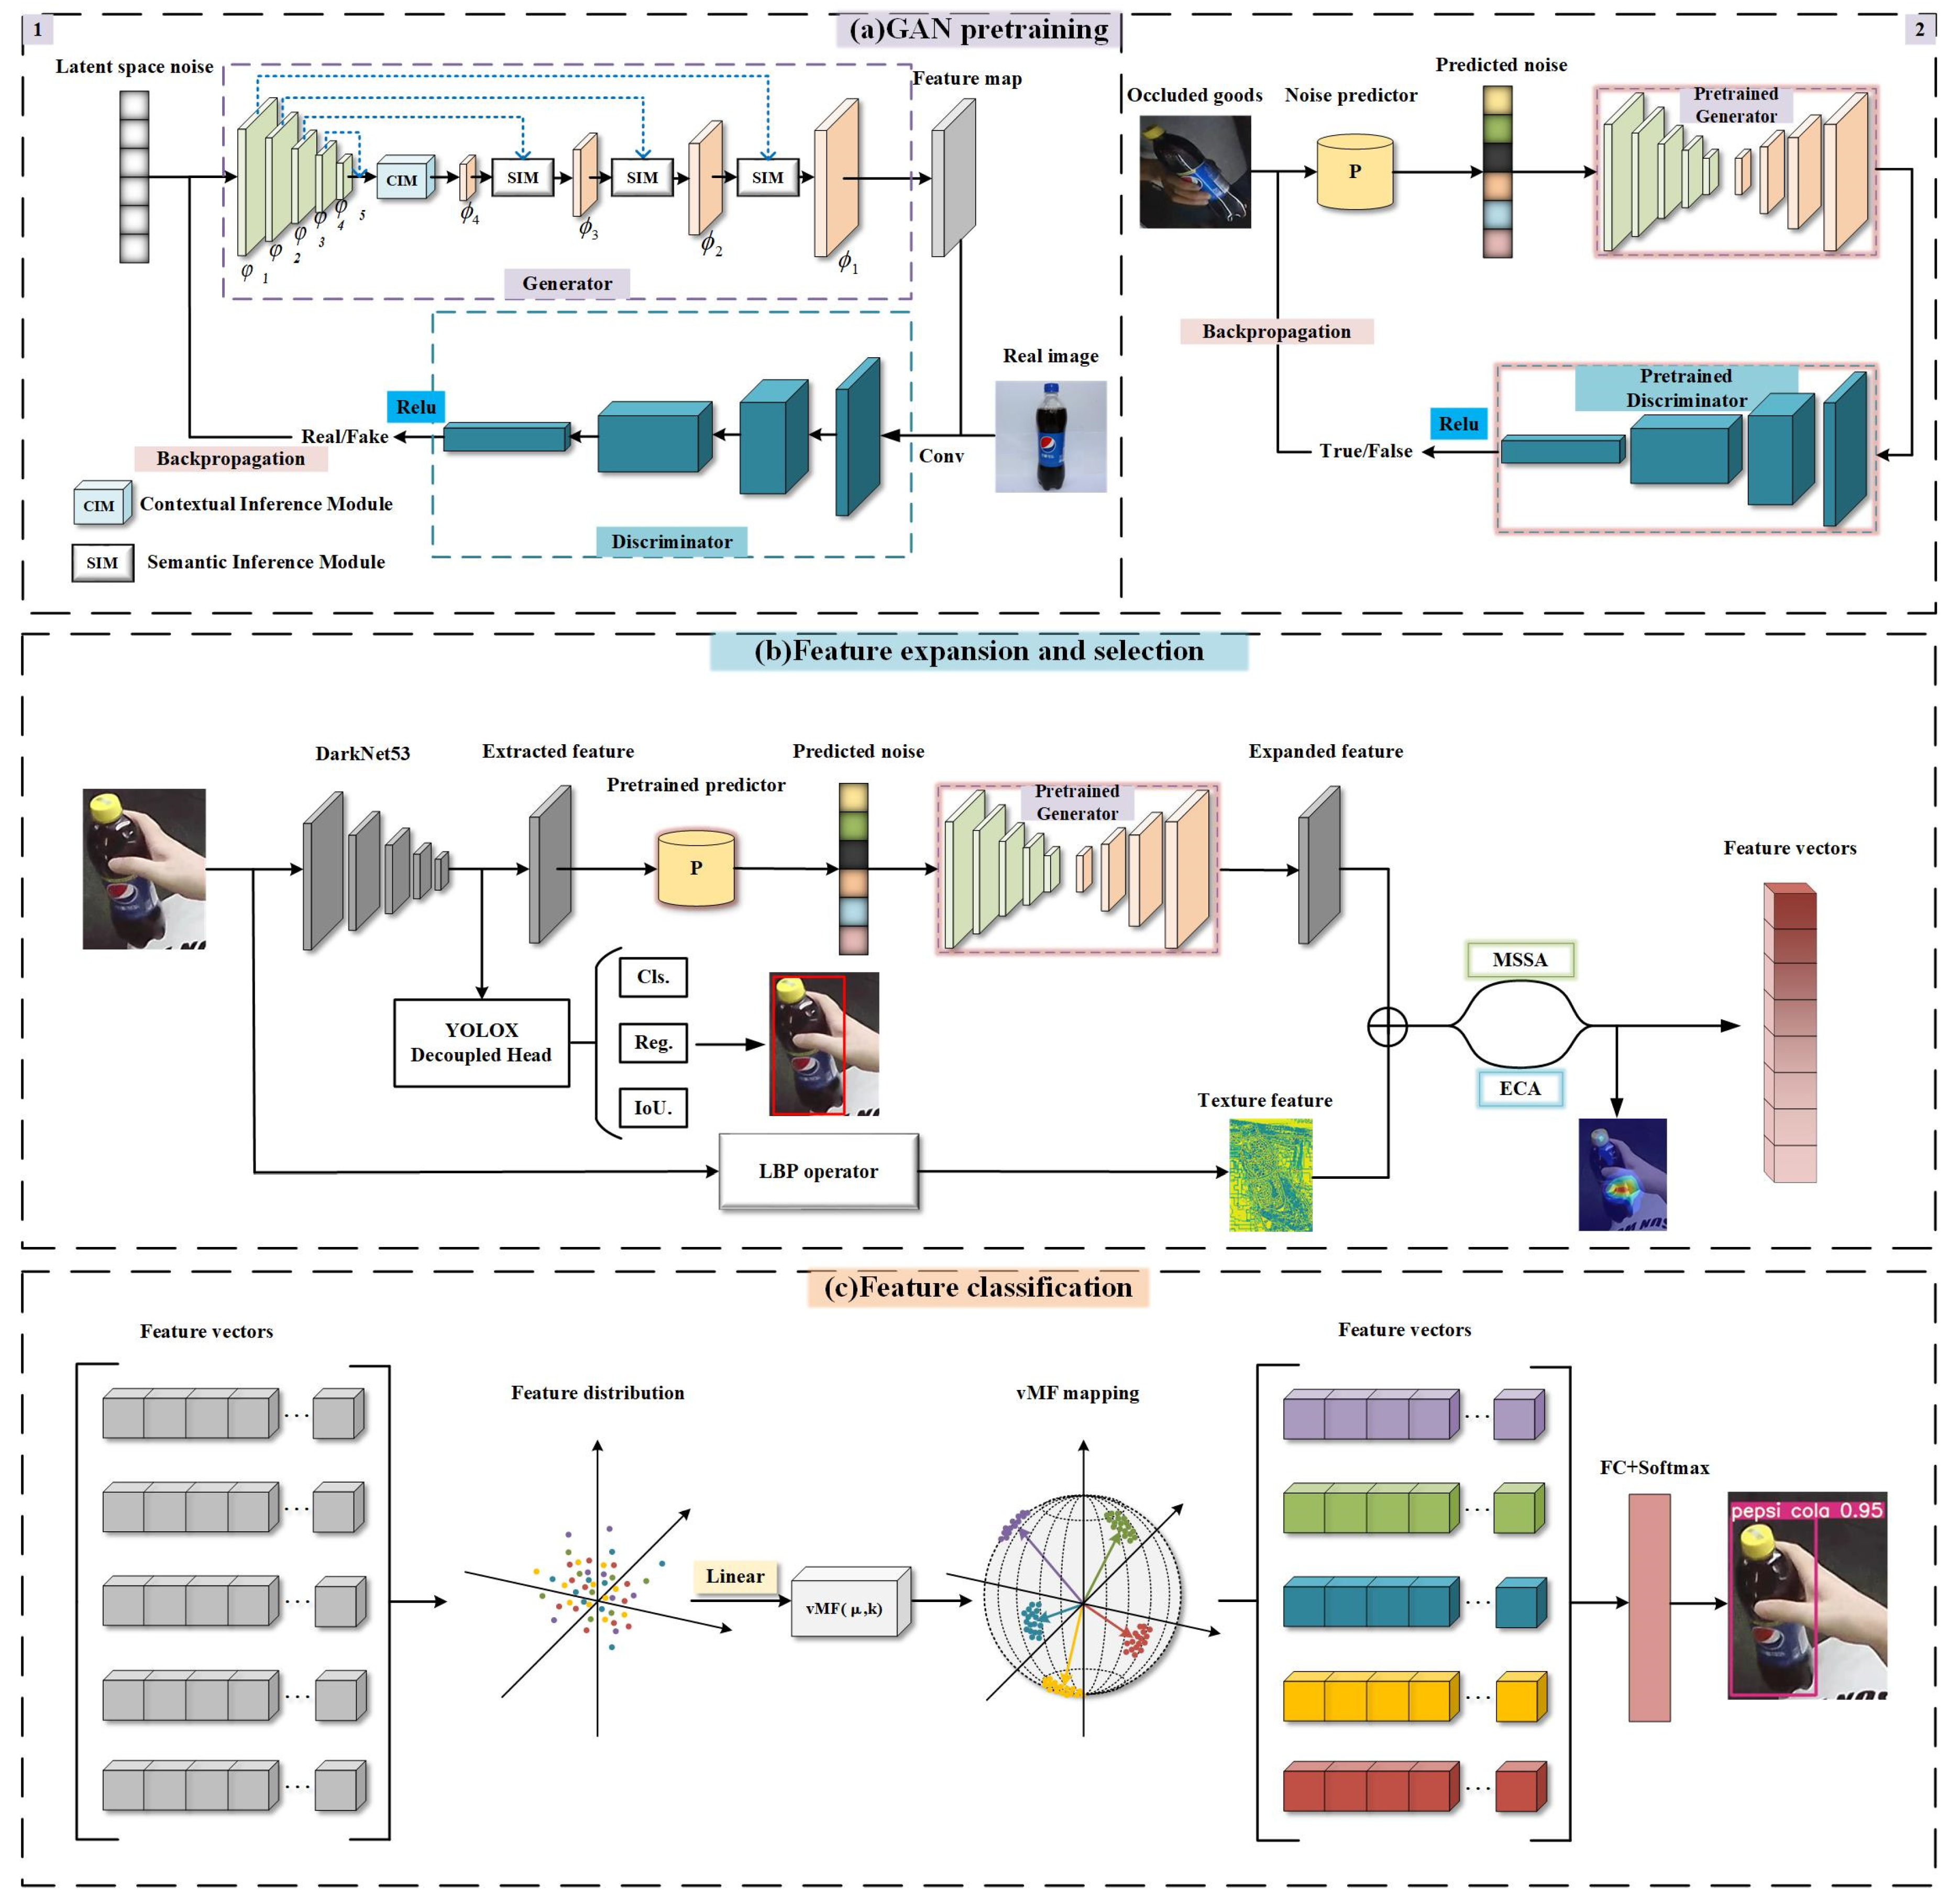
3.1. GAN Pretraining
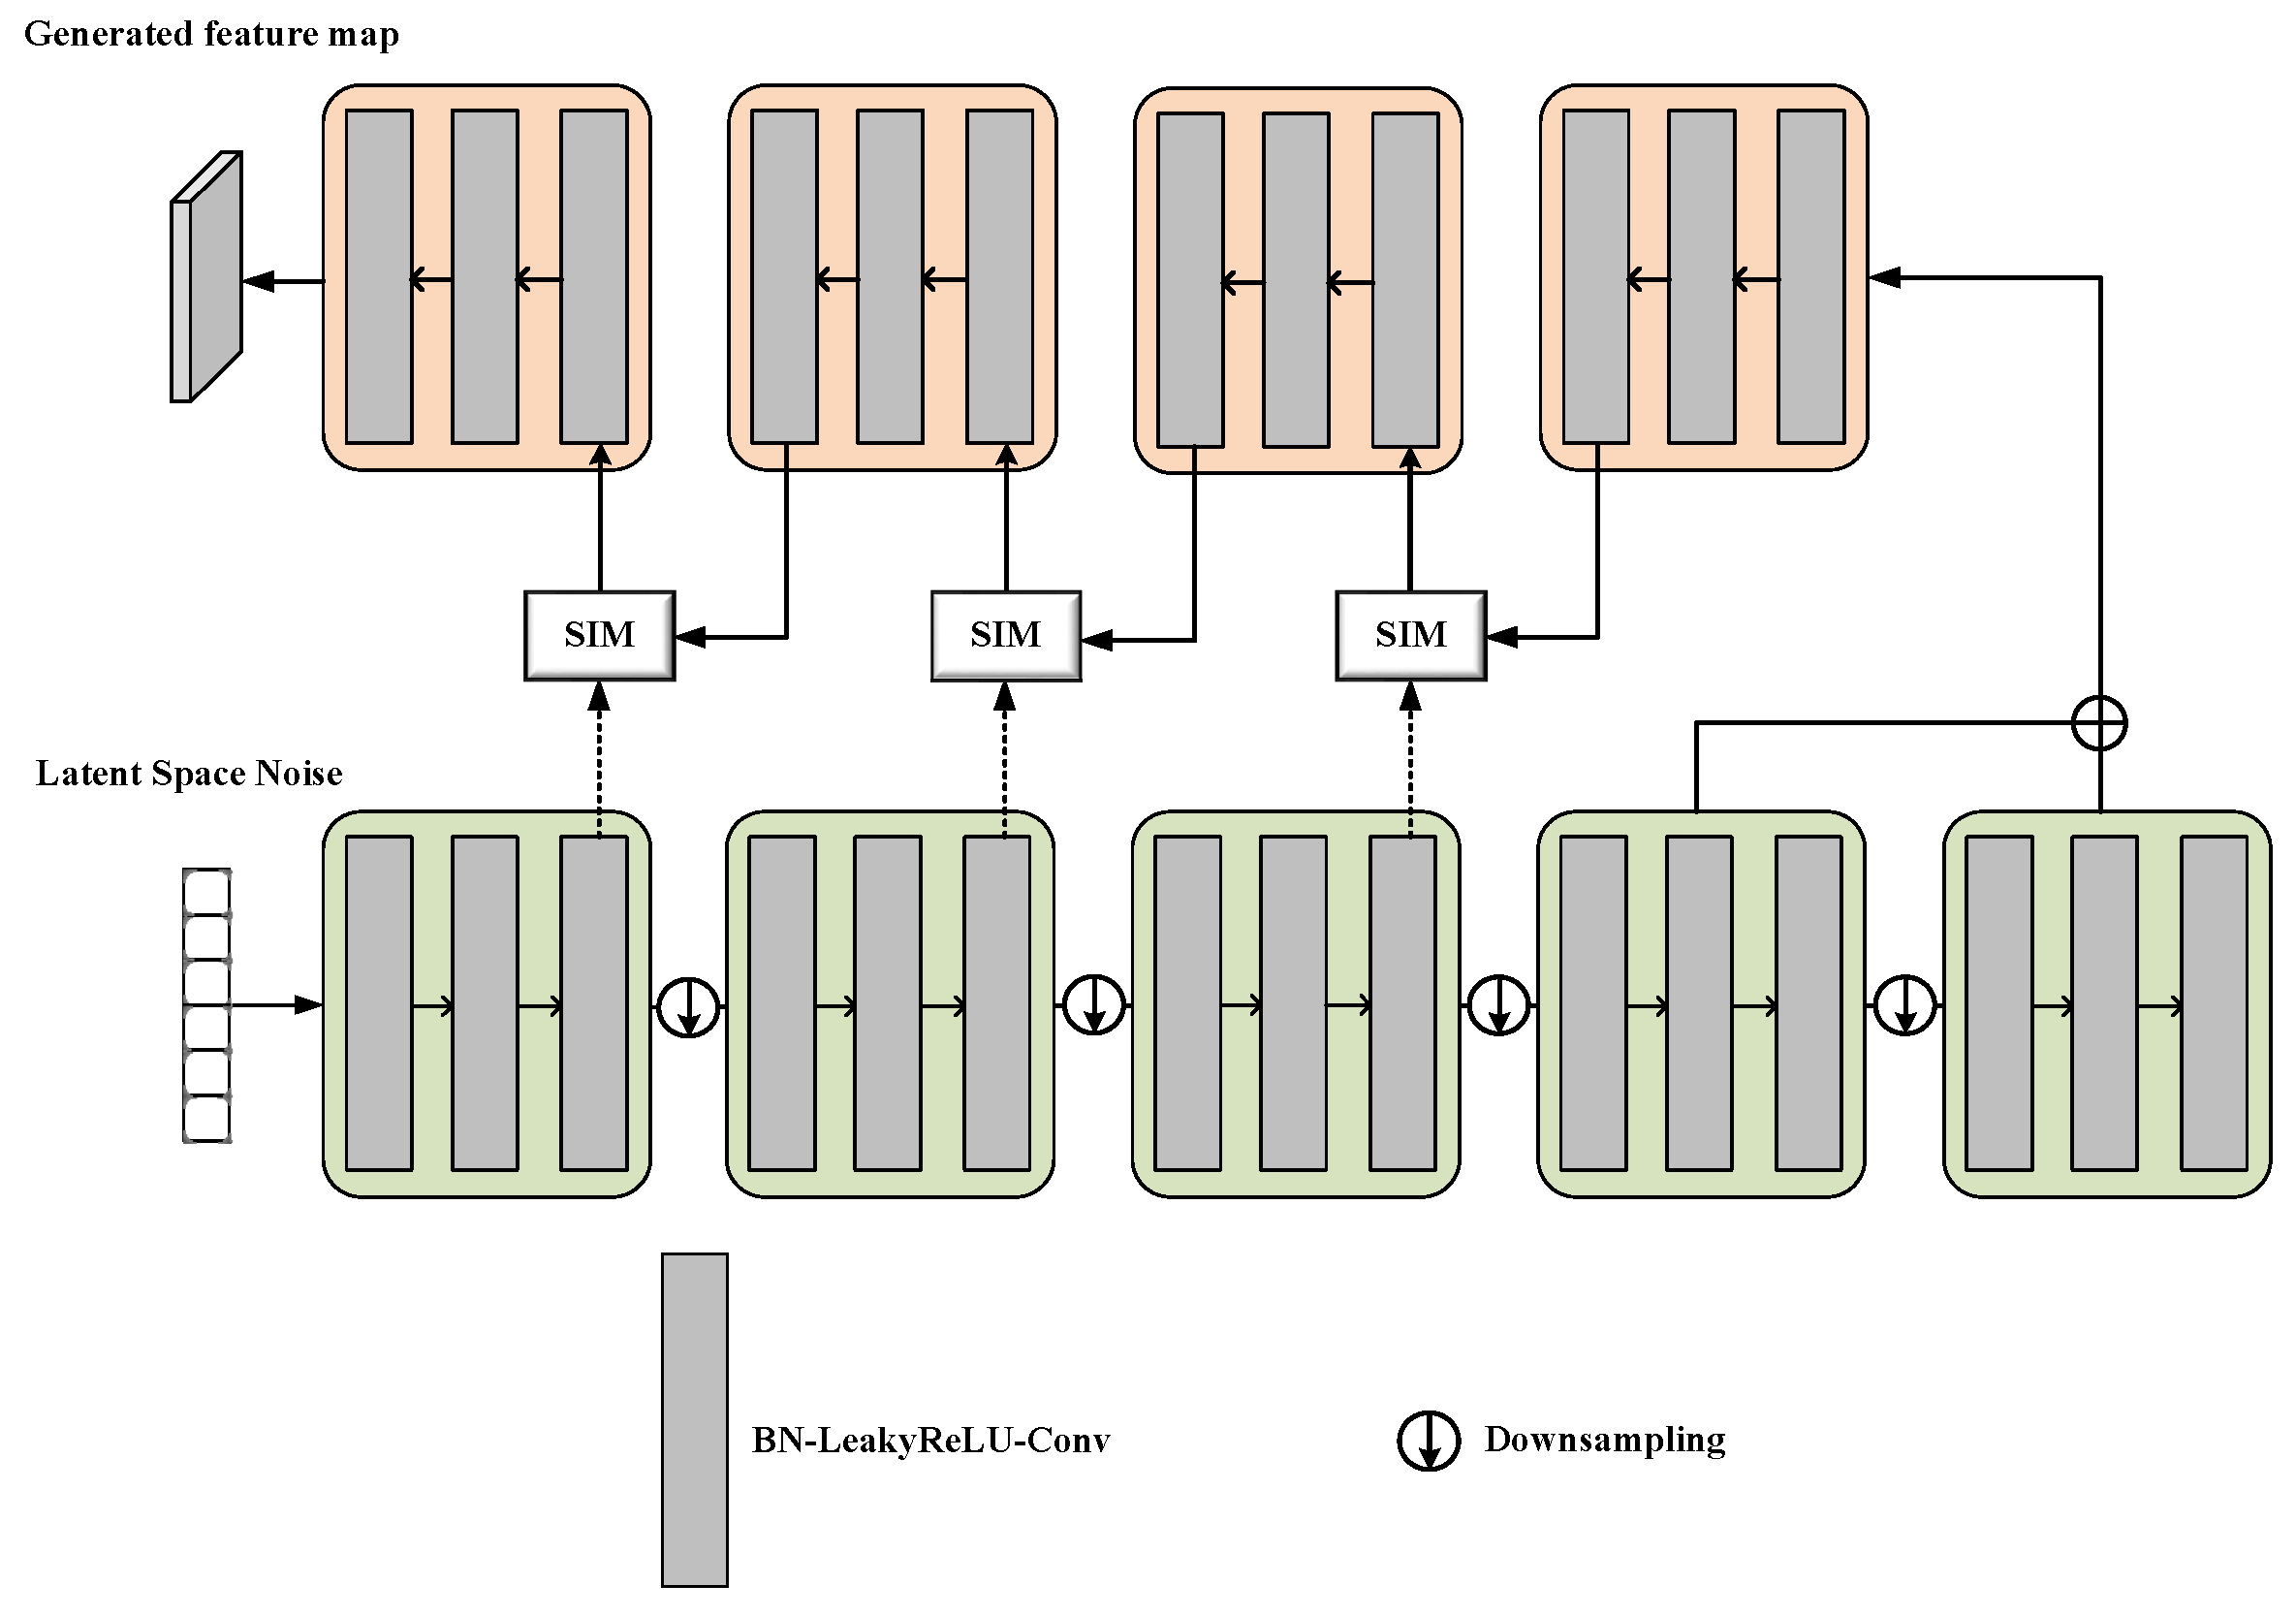
3.1.1. Generator Pretraining
3.1.2. Discriminator Pretraining
3.1.3. Noise Prior Pretraining
3.1.4. Loss Function
3.2. Expansion and Selection of Features
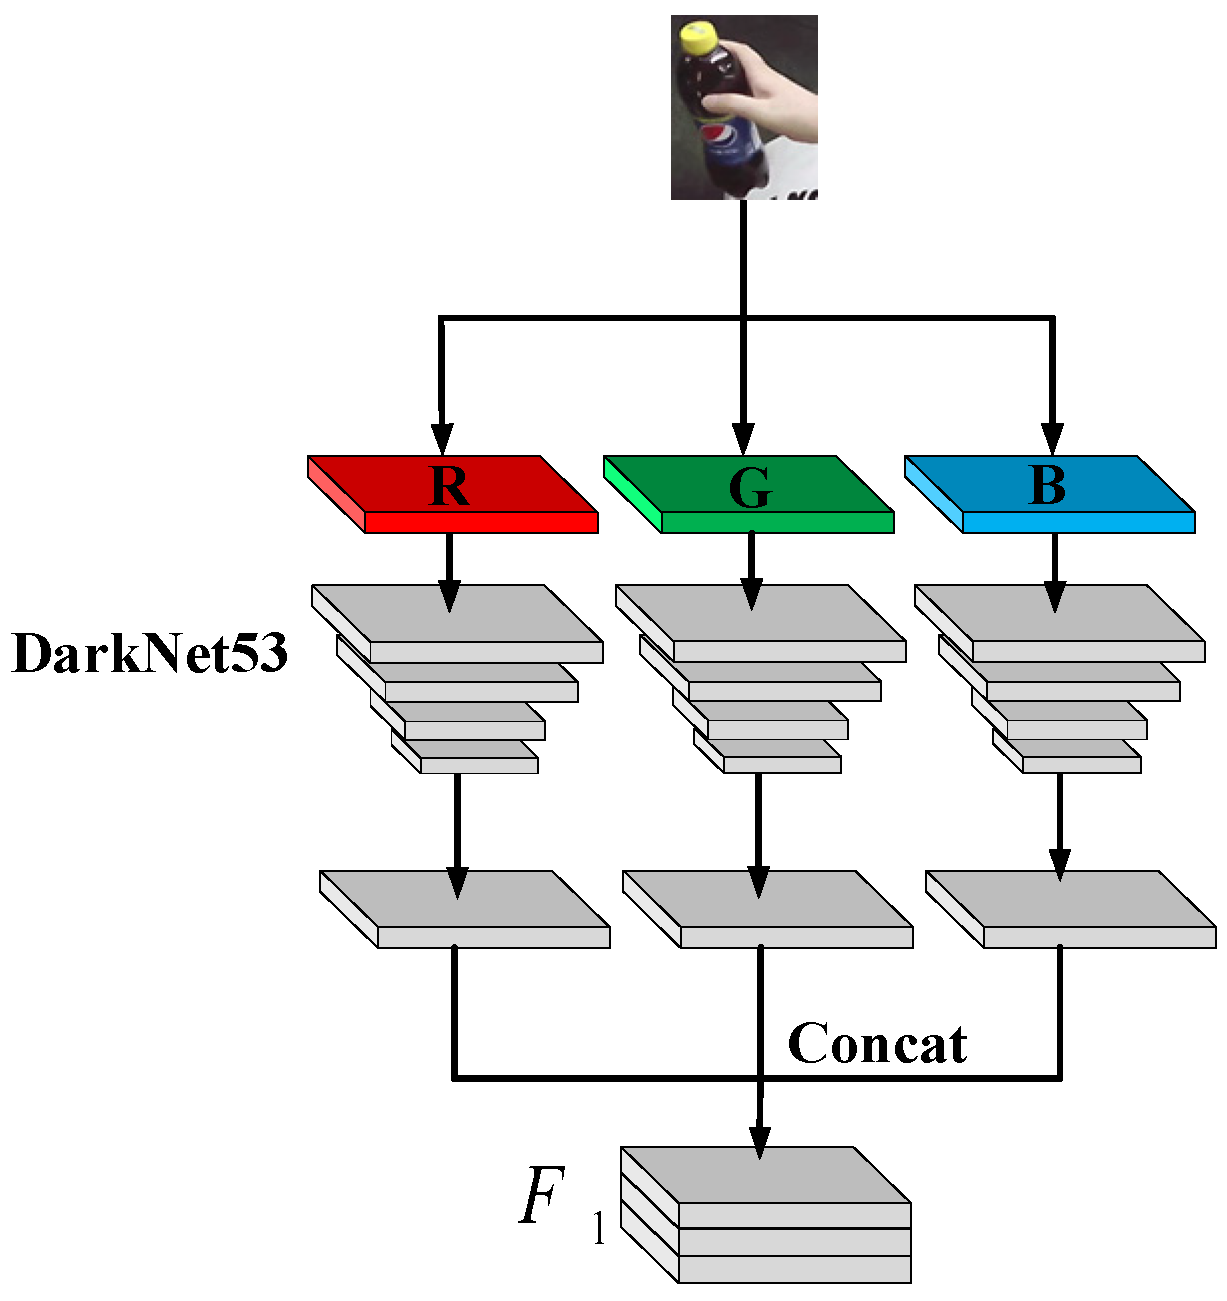
3.2.1. Three-Channel Feature Extraction
3.2.2. Feature Restoration and Expansion
3.2.3. Features Selection
3.3. Features Distinction
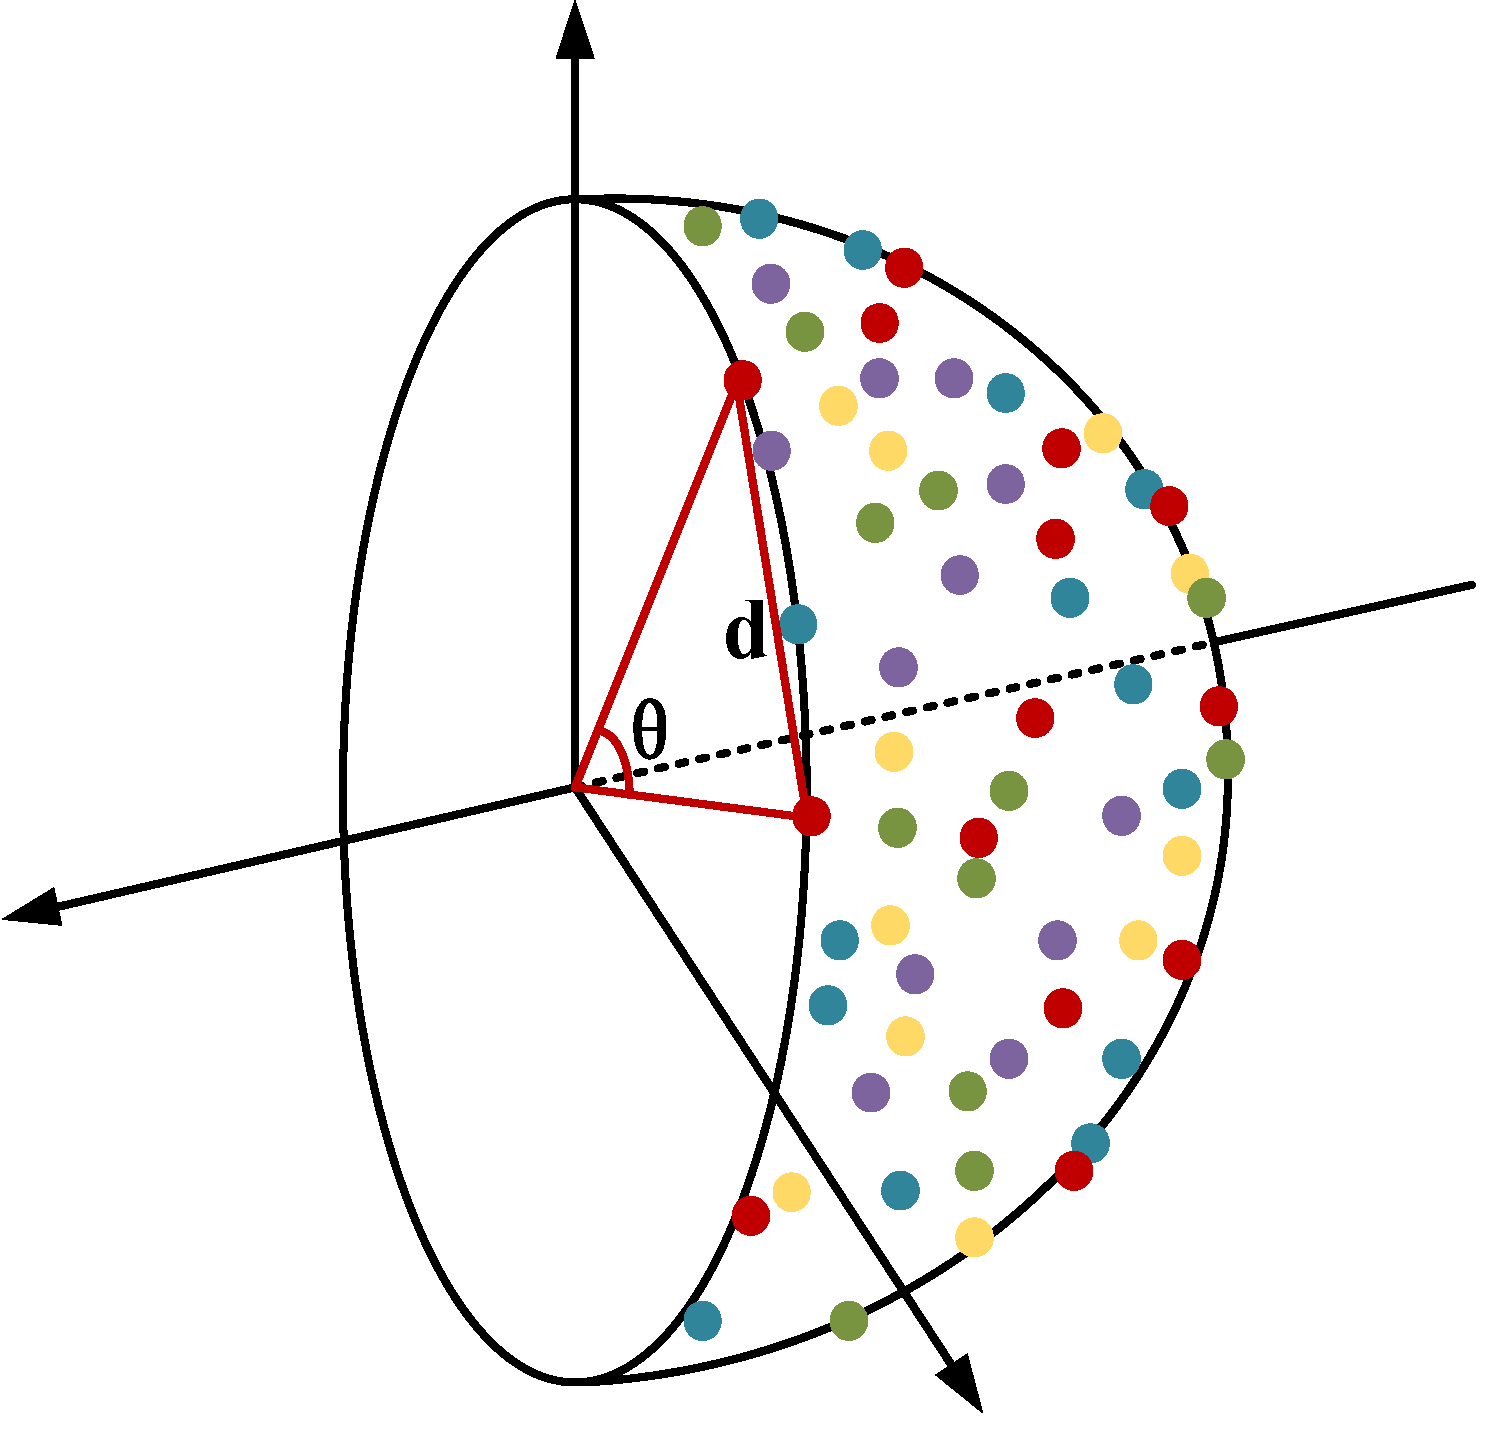
3.3.1. Feature Mapping and Clustering
3.3.2. Feature Classification
4. Experimental Results and Analysis
4.1. Dataset
4.2. Experiment Platform
4.3. Feature Restoration and Expansion Result
4.3.1. Ablation Experiment
4.3.2. Comparison Experiment
4.4. Recognition Results of Occluded Goods
4.4.1. Ablation Experiment
4.4.2. Comparison Experiment
5. Conclusions
- To solve the problem of the small number of good features due to occlusion, the generator and predictor of the network were pretrained, and noise was used prior to guide the generation of features. By jumping and connecting context features for semantic inference, these features could be restored and expanded. The contour structure loss function based on the Hausdorff Distance designed in this study was used in the process of feature restoration and expansion to ensure the generation of accurate contour features.
- To resolve the situation in which the product features are highly similar, MSSA+ECA was used to select the features in a fine-grained manner and the most discriminative features were screened out. The spherical model under the vMF distribution was used to map the feature vectors to the unit hypersphere and cluster it, thereby increasing the distance between features. In the spherical feature clustering process, the angle loss function designed in this study was used to effectively improve the clustering effect.
Author Contributions
Funding
Institutional Review Board Statement
Informed Consent Statement
Data Availability Statement
Conflicts of Interest
Ethical Statement
References
- Han, P.; Zhang, J. Comparison of Investment Direction and Efficiency Analysis of China’s Rural Poverty Alleviation Fund. Int. Conf. Econ. Manag. Model Eng. (ICEMME) 2020, 2, 715–719. [Google Scholar]
- Zhang, L. The Construction of Rural Poverty Alleviation Audit using Big Data Anomaly Detection. In Proceedings of the 2021 Fifth International Conference on I-SMAC (IoT in Social, Mobile, Analytics and Cloud) (I-SMAC), Palladam, India, 11–13 November 2021. [Google Scholar]
- Cao, X.; Shi, D. Research on Poverty Alleviation by Informatization Education under the Background of Rural Revitalization. In Proceedings of the 2021 International Conference on Education, Information Management and Service Science (EIMSS), Xi’an, China, 16–18 July 2021. [Google Scholar]
- Lodhi, E.; Zhu, F.; Lodhi, Z.; Saleem, Q.; Xiong, G.; Wang, F. Design and Implementation of RFID Based Smart Shopping Booth; IEEE: Barcelona, Spain, 2019. [Google Scholar] [CrossRef]
- Liu, L.; Cui, J.; Huan, Y.; Zou, Z.; Hu, X.; Zheng, L. A Design of Smart Unmanned Vending Machine for New Retail Based on Binocular Camera and Machine Vision. IEEE Consum. Electron. Mag. 2022, 11, 21–31. [Google Scholar] [CrossRef]
- Zhang, H.; Li, D.; Ji, Y.; Zhou, H.; Wu, W.; Liu, K. Toward New Retail: A Benchmark Dataset for Smart Unmanned Vending Machines. IEEE Trans. Ind. Inform. 2020, 16, 7722–7731. [Google Scholar] [CrossRef]
- Kobayashi, T.; Otsu, N. Von Mises-Fisher Mean Shift for Clustering on a Hypersphere. In Proceedings of the 2010 20th International Conference on Pattern Recognition, Istanbul, Turkey, 23–26 August 2010; pp. 2130–2133. [Google Scholar] [CrossRef]
- Ge, Z.; Liu, S.; Wang, F.; Li, Z.; Sun, J. YOLOX: Exceeding YOLO Series in 2021. In Proceedings of the Computer Vision and Pattern Recognition, Nashville, TN, USA, 20–25 June 2021; pp. 1–6. [Google Scholar]
- Liu, W.; Anguelov, D.; Erhan, D.; Szegedy, C.; Reed, S.; Fu, C.Y.; Berg, A.C. Ssd: Single Shot Multibox Detector. In Proceedings of the European Conference on Computer Vision; Springer: Berlin/Heidelberg, Germany, 2016; pp. 21–37. [Google Scholar]
- Meivel, S.; Sindhwani, N.; Anand, R.; Pandey, D.; Alnuaim, A.A.; Altheneyan, A.S.; Jabarulla, M.Y.; Lelisho, M.E. Mask Detection and Social Distance Identification Using Internet of Things and Faster R-CNN Algorithm. Comput. Intell. Neurosci. 2022, 2022, 2103975. [Google Scholar] [CrossRef] [PubMed]
- Li, Y.; Wang, Z. Research on Textile Defect Detection Based on Improved Cascade R-CNN. In Proceedings of the 2021 International Conference on Artificial Intelligence and Electromechanical Automation (AIEA), Guangzhou, China, 14–16 May 2021. [Google Scholar]
- Dapogny, A.; Bailly, K.; Dubuisson, S. Confidence-Weighted Local Expression Predictions for Occlusion Handling in Expression Recognition and Action Unit Detection. Int. J. Comput. Vis. 2018, 126, 255–271. [Google Scholar] [CrossRef] [Green Version]
- Chaudhury, A.; Barron, J.L. Plant Species Identification from Occluded Leaf Images. IEEE/ACM Trans. Comput. Biol. Bioinform. 2020, 17, 1042–1055. [Google Scholar] [CrossRef] [PubMed]
- Putri, D.U.K.; Musdholifah, A.; Makhrus, F.; Duong, V.H.; Le, P.T.; Chen, B.W.; Wang, J.C. Occluded Face Recognition Using Sparse Complex Matrix Factorization with Ridge Regularization. In Proceedings of the 2021 International Symposium on Intelligent Signal Processing and Communication Systems (ISPACS), Hualien City, Taiwan, 16–19 November 2021. [Google Scholar]
- Kortylewski, A.; Liu, Q.; Wang, A.; Sun, Y.; Yuille, A. Compositional Convolutional Neural Networks: A Robust and Interpretable Model for Object Recognition Under Occlusion. Int. J. Comput. Vis. 2020, 129, 736–760. [Google Scholar] [CrossRef]
- Wang, Z. Recognition of occluded objects by slope difference distribution features. Appl. Soft Comput. 2022, 120, 108622. [Google Scholar] [CrossRef]
- Ma, X.; Ma, Q.; Ma, Q.; Han, X. Robust face recognition for occluded real-world images using constrained probabilistic sparse network. IET Image Process 2022, 16, 1359–1375. [Google Scholar] [CrossRef]
- Heo, J.; Wang, Y.; Park, J. Occlusion-aware spatial attention transformer for occluded object recognition. Pattern Recognit. Lett. 2022, 159, 70–76. [Google Scholar] [CrossRef]
- Xu, Y.; Liu, J.; Zhai, Y.; Gan, J.; Zeng, J.; Cao, H.; Scotti, F.; Piuri, V.; Labati, R.D. Weakly supervised facial expression recognition via transferred DAL-CNN and active incremental learning. Soft Comput. 2020, 24, 5971–5985. [Google Scholar] [CrossRef]
- Goodfellow, I.; Pouget-Abadie, J.; Mirza, M.; Xu, B.; Warde-Farley, D.; Ozair, S.; Courville, A.; Bengio, Y. Generative adversarial nets. In Proceedings of the 2014 Advances in Neural Information Processing Systems, Montreal, QC, Canada, 8–13 December 2014; Curran Associates: New York, NY, USA, 2014; pp. 2672–2680. [Google Scholar]
- Arjovsky, M.; Chintala, S.; Bottou, L. Wasserstein Gan. [EB/OL]. Available online: https://arxiv.org/abs/1701.07875 (accessed on 20 April 2021).
- Gulrajani, I.; Ahmed, F.; Arjovsky, M.; Dumoulin, V.; Courville, A.C. Improved training of Wasserstein gans. In Proceedings of the 2017 Advances in Neural Information Processing Systems, Long Beach, CA, USA, 4–9 December 2017; Curran Associates: New York, NY, USA, 2017; pp. 5767–5777. [Google Scholar]
- Liao, L.; Xiao, J.; Wang, Z.; Lin, C.-W.; Satoh, S. Guidance and Evaluation: Semantic-Aware Image Inpainting for Mixed Scenes. In European Conference on Computer Vision; Springer: Berlin/Heidelberg, Germany, 2020; pp. 683–700. [Google Scholar]
- Liao, L.; Xiao, J.; Wang, Z.; Lin, C.-W.; Satoh, S. Image Inpainting Guided by Coherence Priors of Semantics and Textures. In Proceedings of the Computer Vision and Pattern Recognition (CVPR), Nashville, TN, USA, 20–25 June 2021. [Google Scholar]
- Li, J.; Wang, N.; Zhang, L.; Du, B.; Tao, D. Recurrent Feature Reasoning for Image Inpainting. In Proceedings of the IEEE/CVF Conference on Computer Vision and Pattern Recognition, Seattle, WA, USA, 13–19 June 2020; pp. 7760–7768. [Google Scholar]
- Geng, W.; Han, F.; Lin, J.; Zhu, L.; Bai, J.; Wang, S.; He, L.; Xiao, Q.; Lai, Z. Fine-Grained Grocery Product Recognition by One-Shot Learning; ACM: New York, NY, USA, 2018; pp. 1706–1714. [Google Scholar]
- Lee, J.W.; Yoon, Y.C. Fine-Grained Plant Identification Using Wide and Deep Learning Model; IEEE: Barcelona, Spain, 2019. [Google Scholar]
- Rao, Y.; Chen, G.; Lu, J.; Zhou, J. Counterfactual Attention Learning for Fine-Grained Visual Categorization and Re-identification. Computer Vision and Pattern Recognition (CVPR). In Proceedings of the IEEE/CVF International Conference on Computer Vision (ICCV), Montreal, QC, Canada, 10–17 October 2021; pp. 1025–1034. [Google Scholar]
- Wang, W.; Cui, Y.; Li, G.; Jiang, C.; Deng, S. A self-attention-based destruction and construction learning fine-grained image classification method for retail product recognition. Neural Comput. Appl. 2020, 32, 14613–14622. [Google Scholar] [CrossRef]
- Liu, H.; Li, J.; Li, D.; See, J.; Lin, W. Learning Scale-Consistent Attention Part Network for Fine-Grained Image Recognition. IEEE Trans. Multimed. 2022, 24, 2902–2913. [Google Scholar] [CrossRef]
- Kato, K.; Takano, H.; Saiko, M.; Hiraike, R.; Imaoka, H. Effectiveness of Feature-Selected LBP-TOP for Emotional Estimation by Micro-Expression; IEEE: Barcelona, Spain, 2020. [Google Scholar]
- Lahiri, A.; Jain, A.K.; Agrawal, S.; Mitra, P.; Biswas, P.K. Prior Guided GAN Based Semantic Inpainting. In Proceedings of the 2020 IEEE/CVF Conference on Computer Vision and Pattern Recognition (CVPR), Seattle, WA, USA, 13–19 June 2020; pp. 13693–13702. [Google Scholar]
- Shen, Y.; Gu, J.; Tang, X.; Zhou, B. Interpreting the Latent Space of GANs for Semantic Face Editing. In Proceedings of the IEEE/CVF Conference on Computer Vision and Pattern Recognition (CVPR), Long Beach, CA, USA, 15–20 June 2019. [Google Scholar]
- Xu, M.; Zhou, Z.; Lu, G.; Tang, J.; Zhang, W.; Yu, Y. Sobolev Wasserstein GAN. In Proceedings of the AAAI Conference on Artificial Intelligence (AAAI), Montreal, QC, Canada, 21–26 August 2020. [Google Scholar]
- Liu, G.; Shih, K.; Wang, T.C.; Tao, A.; Catanzaro, B. Image Inpainting for Irregular Holes Using Partial Convolutions. In Proceedings of the European Conference on Computer Vision (ECCV), Munich, Germany, 8–14 September 2018. [Google Scholar]
- Nazeri, K.; Ng, E.; Joseph, T.; Qureshi, F.Z.; Ebrahimi, M. EdgeConnect: Generative Image Inpainting with Adversarial Edge Learning; IEEE: Barcelona, Spain, 2019; pp. 1–17. [Google Scholar]
- Hu, J.; Shen, L.; Sun, G. Squeeze-and-excitation networks. In Proceedings of the IEEE Transactions on Pattern Analysis and Machine Intelligence, Salt Lake City, UT, USA, 18–23 June 2018; Volume 42, pp. 2011–2023. [Google Scholar] [CrossRef] [Green Version]
- Woo, S.; Park, J.; Lee, J.Y.; Kweon, I.S. CBAM: Convolutional Block Attention Module. In Computer Vision—ECCV 2018; Lecture Notes in Computer, Science; Ferrari, V., Hebert, M., Sminchisescu, C., Weiss, Y., Eds.; Springer: Cham, Switzerland, 2018; Volume 11211. [Google Scholar]
- Wang, Q.; Wu, B.; Zhu, P.; Li, P.; Zuo, W.; Hu, Q. ECA-Net: Efficient Channel Attention for Deep Convolutional Neural Networks. In Proceedings of the 2020 IEEE/CVF Conference on Computer Vision and Pattern Recognition (CVPR), Seattle, WA, USA, 14–19 June 2020; pp. 11531–11539. [Google Scholar] [CrossRef]


| Loss Function | PSNR | SSIM |
|---|---|---|
| 19.0742 | 0.7367 | |
| 19.2039 | 0.7481 | |
| Ours 1 | 19.9782 | 0.7664 |
| Backbone | F1 Score | mAP |
|---|---|---|
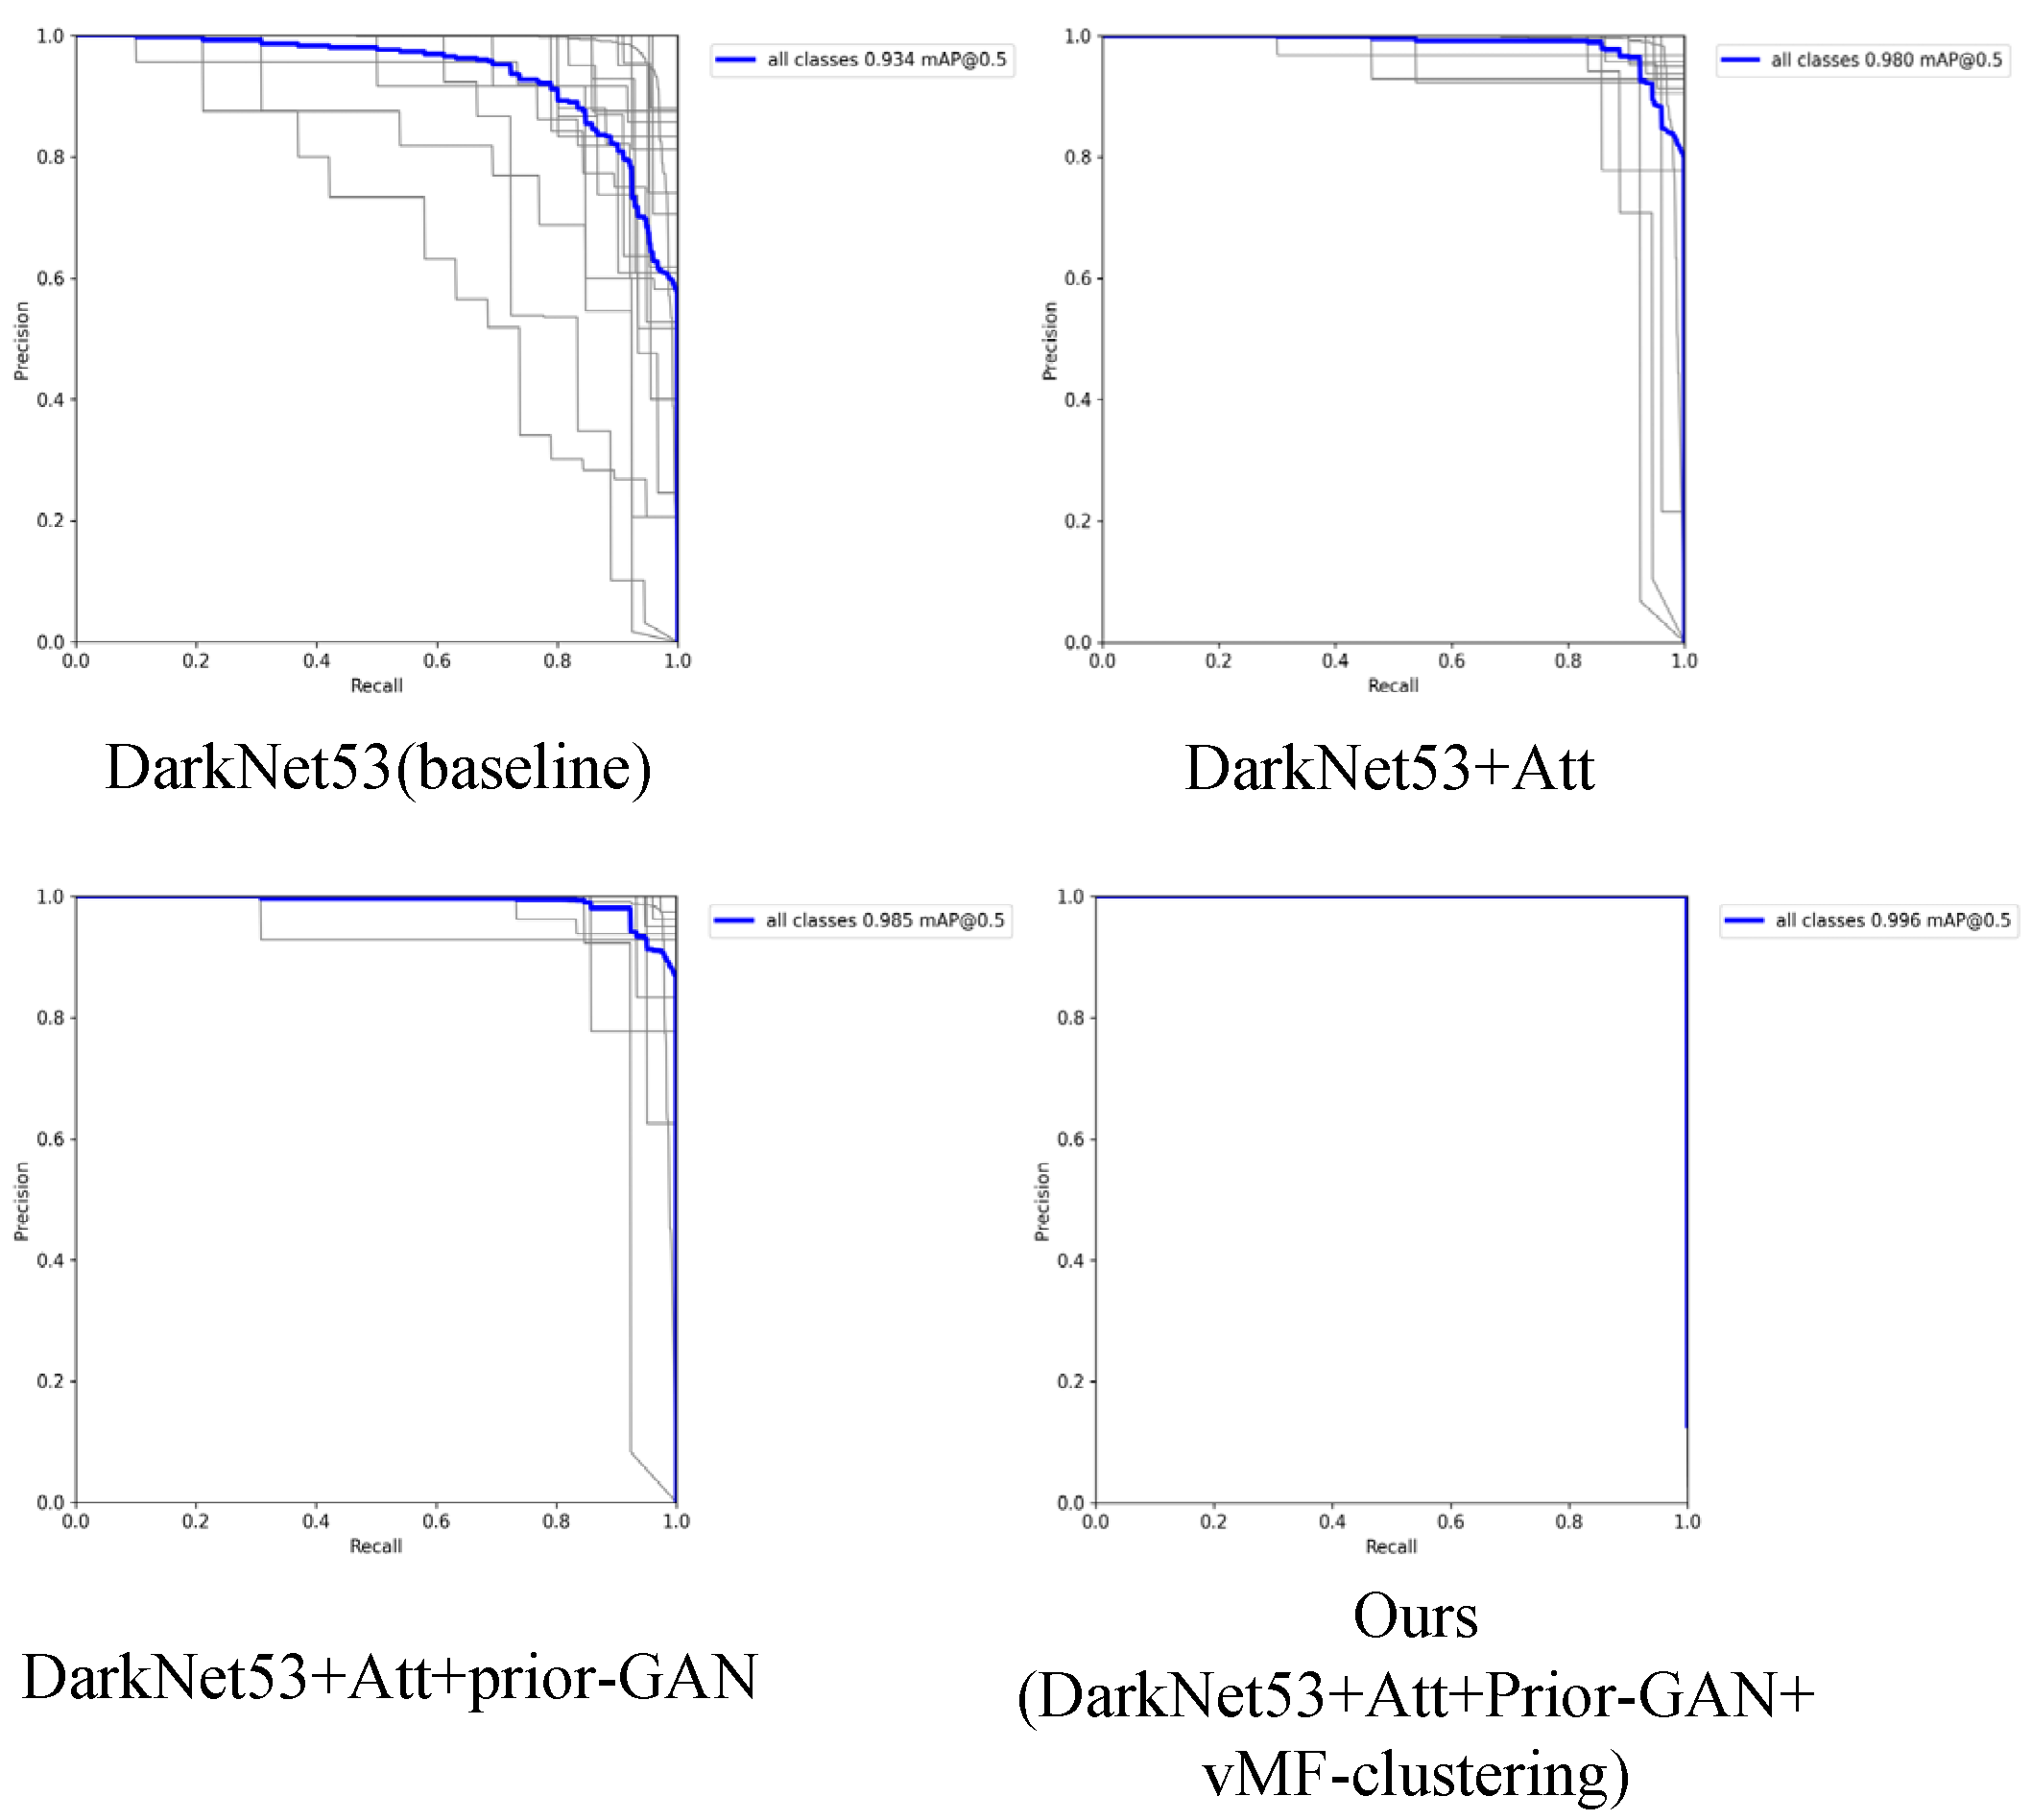
| DarkNet53 (baseline) | 0.94 | 0.934 |
| DarkNet53 + Attention | 0.95 | 0.980 |
| DarkNet53 + Pr-GAN + Attention | 0.95 | 0.985 |
| Ours | 0.98 | 0.996 |
| Network Combinations | F1 Score | mAP | Accuracy |
|---|---|---|---|
| DarkNet53 (baseline) | 0.94 | 0.934 | 0.894 |
| DarkNet53 + SE | 0.95 | 0.980 | 0.907 |
| DarkNet53 + CBAM | 0.96 | 0.983 | 0.899 |
| DarkNet53 + ECA | 0.96 | 0.984 | 0.916 |
| Ours (DarkNet53 + MSSA + ECA) | 0.98 | 0.995 | 0.937 |
| Algorithm Models | Bottle Shaped | Can Shaped | Bag Shaped |
|---|---|---|---|
| EfficientDet | 84.74 | 88.23 | 76.94 |
| CenterNet | 81.31 | 62.39 | 61.87 |
| SSD | 82.14 | 84.23 | 74.18 |
| Faster-RCNN | 82.56 | 65.60 | 71.49 |
| RetinaNet | 88.47 | 81.04 | 74.17 |
| YOLOv5 | 91.13 | 83.43 | 80.57 |
| YOLOX | 91.77 | 96.43 | 84.62 |
| Ours | 94.64 | 96.80 | 91.42 |
| Classes of Similar Goods | Faster-RCNN | SSD | RetinaNet | YOLOv5 | YOLOX | Ours |
|---|---|---|---|---|---|---|
| Large C’estbon | 95.96 | 88.67 | 95.94 | 99.84 | 95.87 | 99.91 |
| C’estbon | 75.14 | 76.21 | 75.26 | 80.09 | 96.74 | 97.62 |
| Sprite_Canned | 59.76 | 83.54 | 78.91 | 81.48 | 96.44 | 96.53 |
| Sprite_Bottled | 90.92 | 93.36 | 90.37 | 99.89 | 96.87 | 97.46 |
| Large Pepsi Cola | 86.76 | 86.04 | 98.81 | 97.62 | 97.68 | 98.94 |
| Pepsi Cola | 83.11 | 77.64 | 88.60 | 97.24 | 82.79 | 97.49 |
| Nongfu Spring | 77.14 | 63.08 | 94.46 | 91.82 | 92.16 | 95.27 |
| Little Nongfu Spring | 62.74 | 84.09 | 74.18 | 90.16 | 89.62 | 87.46 |
| Average Accuracy | 78.94 | 81.58 | 87.07 | 92.27 | 93.52 | 96.34 |
Disclaimer/Publisher’s Note: The statements, opinions and data contained in all publications are solely those of the individual author(s) and contributor(s) and not of MDPI and/or the editor(s). MDPI and/or the editor(s) disclaim responsibility for any injury to people or property resulting from any ideas, methods, instructions or products referred to in the content. |
© 2023 by the authors. Licensee MDPI, Basel, Switzerland. This article is an open access article distributed under the terms and conditions of the Creative Commons Attribution (CC BY) license (https://creativecommons.org/licenses/by/4.0/).
Share and Cite
Cao, M.; Xie, K.; Liu, F.; Li, B.; Wen, C.; He, J.; Zhang, W. Recognition of Occluded Goods under Prior Inference Based on Generative Adversarial Network. Sensors 2023, 23, 3355. https://doi.org/10.3390/s23063355
Cao M, Xie K, Liu F, Li B, Wen C, He J, Zhang W. Recognition of Occluded Goods under Prior Inference Based on Generative Adversarial Network. Sensors. 2023; 23(6):3355. https://doi.org/10.3390/s23063355
Chicago/Turabian StyleCao, Mingxuan, Kai Xie, Feng Liu, Bohao Li, Chang Wen, Jianbiao He, and Wei Zhang. 2023. "Recognition of Occluded Goods under Prior Inference Based on Generative Adversarial Network" Sensors 23, no. 6: 3355. https://doi.org/10.3390/s23063355